Market Minds Advisory
Virtual Fitness Market

Virtual Fitness Market: Virtual Fitness: Churn Arithmetic, Hardware Attach And The Subscriber Who Stops Turning Up

Almost half of every subscriber cohort stops opening the app within ninety days, and the entire commercial argument for this industry rests on what happens to the ones who do not.

Lead Analyst

Published

September 2026

Make Smarter Decisions with Customized Research Insights

Request a free sample report and evaluate market opportunities, growth trends, and competitive dynamics relevant to your business needs.

2025 MARKET VALUE$32.0BMarket Size 2025
2036 FORECAST VALUE$89.5BBase Case , 2026 to 2036
CAGR 2026 TO 20369.8 %Bull 11.0% / Bear 8.5%
INCREMENTAL OPPORTUNITY$54.4BNet 10- year value creation
EXPANSION MULTIPLE2.55x2036 value over 2026 base
Strategic Levers
M&A Pipeline
Regional Outlook
Country Rankings
Competitive Intelligence
Segmental Deep-dive
Call-Us : 91 93563 13602

Executive Snapshot and Market Trajectory.

This industry is a retention business wearing an acquisition business as a costume. Around 44% of a subscriber cohort stops engaging within ninety days, and everything commercially interesting here concerns the minority who continue. The costume is convincing and the arithmetic underneath it is not at all.
Corporate and insurer funded programmes grow fastest at 14.7%, and the reason is that somebody other than the exerciser is paying. An employer or insurer buys population coverage rather than individual motivation, which removes the churn problem from the revenue line entirely even though the underlying engagement behaviour does not change at all. Consumer subscription growth has meanwhile slowed considerably. Content investment has never once altered that underlying behaviour in any market anywhere.
Concentration is low at 37% and content is not what separates anybody. Instruction is abundant and much of it is free, so participants compete on habit formation, community and equipment lock-in. The businesses that survived the correction were the ones holding something the subscriber could not simply cancel and replace with a video. A video library is not something anybody can be prevented from replacing within minutes.
Market Definition
Revenue from digitally delivered fitness instruction and training accessed outside a physical gym setting, covering consumer subscription platforms, connected equipment platform subscriptions, live and on-demand class streaming, corporate and insurer funded programmes, personal training and coaching delivered remotely, and immersive and gamified fitness experiences. Excludes physical gym memberships and studio classes, connected fitness hardware revenue itself, wearable device sales, and clinical rehabilitation programmes delivered under medical supervision.
Base Year Value
$32.0B in 2025 (MMA Primary Research Dataset, August 2026)
Forecast Period
2026 to 2036, eleven discrete annual values
CAGR
9.8% base case. Bull 11.0%. Bear 8.5%.
Fastest Growth Segment
Corporate and Insurer Funded Programmes: 14.7% CAGR
Fastest Growth Country
India: 12.0% CAGR
Fastest Growth Region
South Asia and Pacific: 12.0% CAGR
Largest Region
North America: 31% of 2025 global value
Market Leaders
Peloton Interactive, Apple Fitness, Technogym, iFIT and Wellhub lead on virtual fitness subscription and programme revenue. Source: company annual reports and MMA Primary Research Dataset, July 2026.
Primary Survey
n=3,800 procurement and R&D decision-makers, Q4 2025, six countries
Methodology
Demand-side build-up, cross-validated against public data, 47 expert interviews

Virtual Fitness Market Forecast Scenarios

virtual-fitness-market-size-forecast-scenario-1788165861497
The 2020 to 2025 period contained a boom, a correction and a lesson the industry is still absorbing. Enforced gym closure produced subscriber growth nobody had planned for, and the reopening removed a large share of it just as quickly. Connected equipment inventories built for permanent demand were written down heavily. Revenue compounded near 8.3%, which conceals a violent shape that averaged into something deceptively ordinary.
Three mechanisms carry the base case. Corporate and insurer funding continues shifting payment away from the individual, which changes the revenue quality more than the usage. Connected equipment subscriptions retain considerably better than app-only offerings because the hardware sits in the room. And hybrid arrangements pairing digital access with physical facility entitlements are being adopted by operators who previously treated the two as competing. None of the three depends on consumer subscription growth returning.
The bull catalyst is broad insurer recognition of digital fitness participation within health plan design, which would move funding decisively away from discretionary consumer spending. The bear risk is engagement measurement: as employers and insurers scrutinise utilisation rather than enrolment, programmes that never produced actual participation become considerably harder to renew. Enrolment was never participation.

Retention Is The Whole Business

The number that governs this industry is 44%. Almost half of every subscriber cohort stops engaging within ninety days, and acquisition takes around 11 months to pay back, which means a large share of subscribers are gone before they have covered what it cost to obtain them. Everything else in this market, including the boom and the correction, follows from that single arithmetic relationship.
MARKET CONCENTRATION CR537%Share of subscription revenue held by the leading platforms
NINETY DAY CHURN44%Subscribers no longer engaging within three months of joining
AVERAGE MONTHLY SUBSCRIPTIONUSD 16.40Typical consumer price across app and platform offerings
HARDWARE ATTACH RETENTION2.4 timesRetention advantage where connected equipment sits in the home
CORPORATE PROGRAMME UTILISATION23%Share of enrolled employees actually using a funded programme
ACQUISITION PAYBACK PERIOD11 monthsTime to recover the cost of acquiring one subscriber
Content does not fix it, and the industry took an expensive while to accept that. Instruction is abundant, much of it is genuinely free, and no library of classes has ever retained anybody who had stopped intending to exercise. What retains is friction in the right direction: equipment occupying floor space produces retention around 2.4 times an app-only subscription, because a bicycle in the bedroom is an argument the subscriber has with themselves daily.
The most interesting commercial move is changing who pays. Corporate and insurer funded programmes remove the individual from the transaction, which converts a discretionary consumer subscription into a contracted population arrangement. Utilisation runs around 23% of enrolled employees, which the industry has been comfortable with for years and which purchasers have recently started examining rather more closely than they used to.
"The dirty secret of corporate wellness is that low utilisation was a feature, not a defect, because everybody was paid on enrolment. Now the buyers are asking who actually turned up, and that question reprices the whole category."
Director, Digital Health and Fitness Practice · MMA Digital Health and Fitness Services Practice · August 2026

Market Trends

Hardware Attachment Retains Where Content Alone Never Did

Connected equipment occupying floor space in a home produces retention roughly 2.4 times an app-only subscription, and the mechanism is guilt and sunk cost rather than any content advantage. A subscriber cancelling an app deletes it, while a subscriber cancelling a bicycle subscription still has the bicycle in the bedroom looking at them. Platforms competing on class libraries have consistently lost to platforms competing on physical presence in the customer's actual living space. The industry spent several years and a great deal of money proving that content alone does not work.
Market Impact: Grows at 14.7% against 9.8%
Buyers Have Started Measuring Utilisation Rather Than Enrolment

Corporate and insurer purchasers historically bought population coverage and reported enrolment, which suited providers because utilisation runs around 23% and nobody was asking. Purchasers under cost pressure have begun asking who actually participated, and programmes that never produced measurable engagement are now considerably harder to renew. Providers who built genuine participation mechanisms rather than enrolment funnels are benefiting from a change the rest of the category finds distinctly uncomfortable. Nobody in this category built participation measurement while enrolment was the metric being paid on, which is now proving expensive for a great many providers.
Market Impact: Combines 2 habits rather than one

Market Opportunities and Growth Drivers

Employer And Insurer Funding Removes The Individual Payer

When an employer or insurer funds participation, the revenue stops depending on an individual deciding each month whether exercise is worth USD 16.40 to them. That converts a discretionary consumer subscription into a contracted population arrangement with annual renewal rather than monthly cancellation. Corporate and insurer programmes accordingly grow at 14.7% against a market rate of 9.8%. The underlying engagement behaviour is unchanged, and the revenue quality is entirely different. Annual renewal against a population is a fundamentally better revenue structure than monthly cancellation against an individual's enthusiasm, and it always was.
Market Impact: Churns 44% before 11 month payback

Hybrid Access Arrangements Replace The Digital Versus Physical Argument

Operators who spent years treating digital delivery as a threat to facility attendance have begun selling both together, and subscribers holding a combined entitlement retain considerably better than those holding either alone. The reasoning is straightforward: a person who uses a facility twice weekly and an application on other days has two habits rather than one. Facility operators reach subscribers they could never serve geographically, and digital participants gain a retention mechanism. Two decades of treating the two channels as opponents produced very little except lost members on both sides of the argument.
Market Impact: Replaces content in 5 minutes

Market Restraints and Challenges

Churn Outruns Acquisition Payback For Most Participants

Around 44% of a cohort stops engaging within ninety days while acquisition takes roughly 11 months to pay back, which means a substantial share of subscribers never cover their own acquisition cost at all. The root cause is that exercise intention is abundant and exercise habit is rare, and no product has yet reliably converted one into the other. Mitigation runs through hardware attachment, corporate funding, community structures, and onboarding designed around habit rather than around content discovery. Nobody in this industry has yet built a reliable machine for making somebody exercise.
Market Impact: Retains 2.4 times better than apps

Instruction Content Has No Defensible Scarcity At All

Fitness instruction is abundant, much of it is free, and a subscriber cancelling one platform can replace the content within minutes at no cost whatever. The root cause is that exercise knowledge is neither proprietary nor complicated, and video distribution has been free for over a decade. Commercially it means content investment does not create retention. Mitigation runs through community and social structures, connected equipment lock-in, personalisation that improves with use, and coaching relationships involving an actual person. Every one of those routes builds something around the content rather than inside it.
Market Impact: Examines 23% utilisation rates
4 additional market trends, 3 additional growth drivers, and 2 additional restraints and challenges are covered in the full report. Contact sales@marketmindsadvisory.com to access the complete intelligence.

Segment CAGR and Growth Architecture

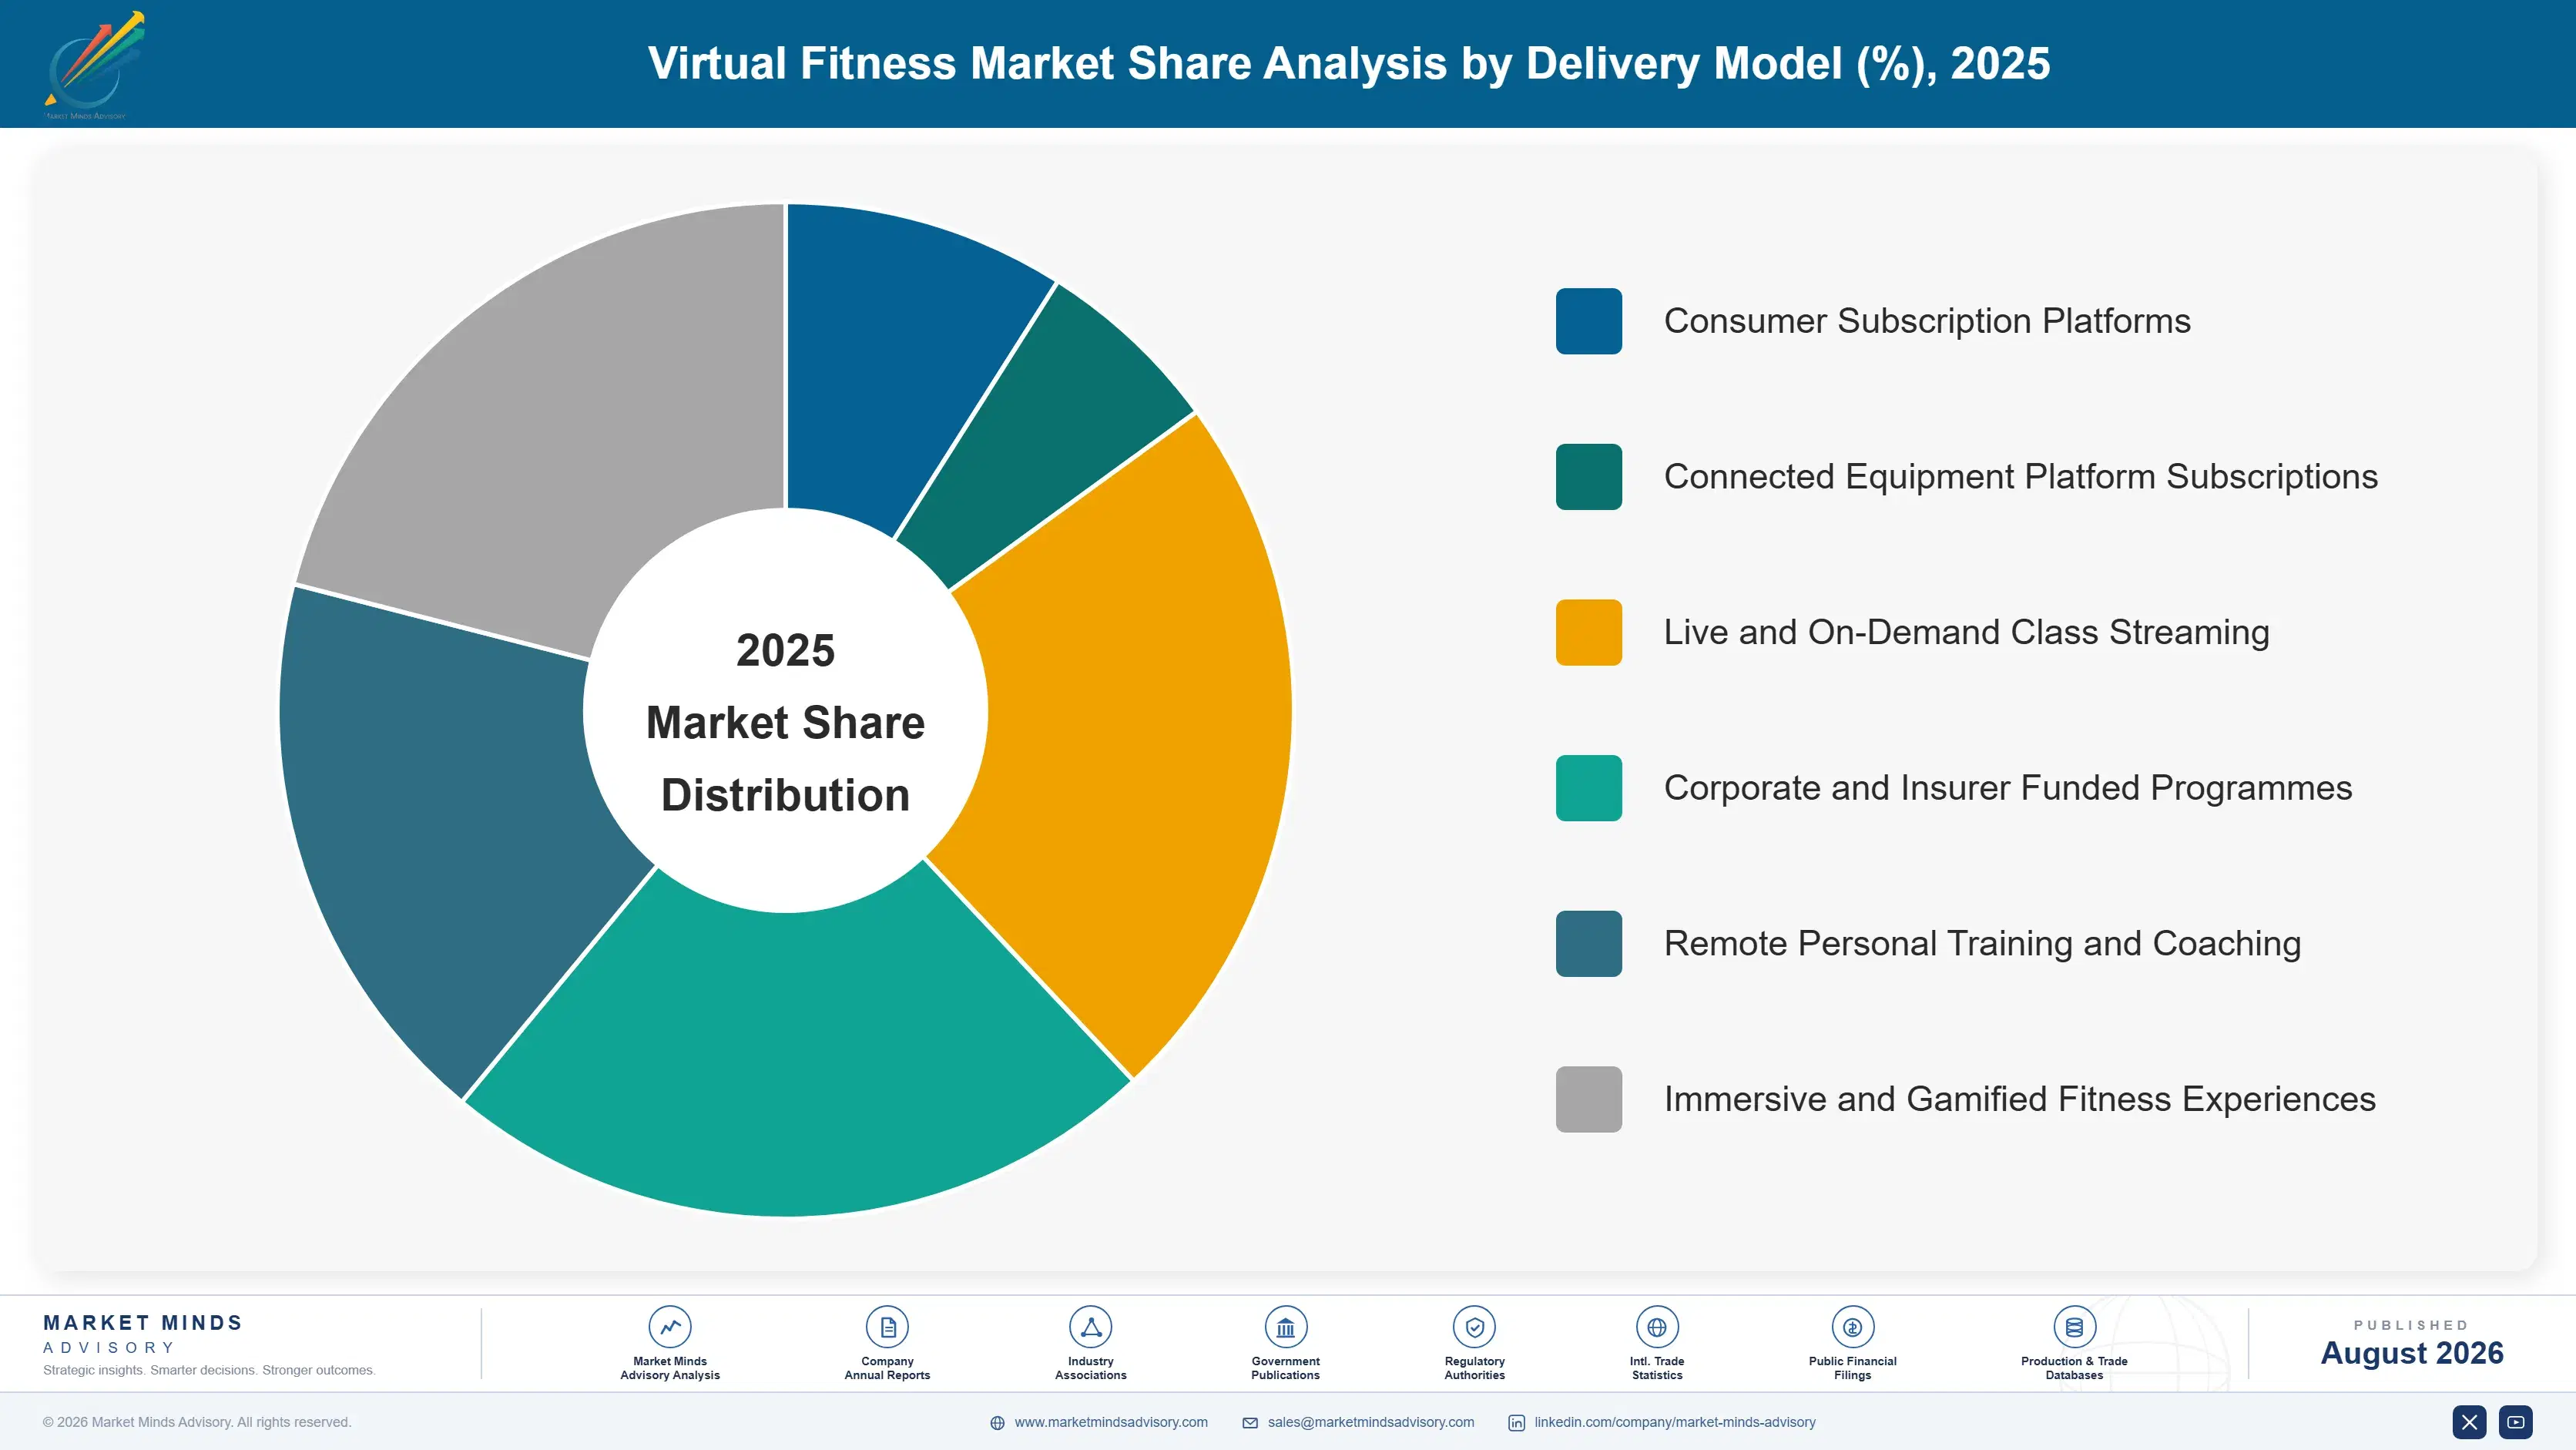
Segmentation follows delivery and funding model, since each carries a different payer, a different retention profile and a different reason the subscriber continues or stops. Six models describe the market completely, from open class streaming that anybody can cancel instantly through to corporate funded programmes where the participant is not the person making the payment decision.
virtual-fitness-market-market-share-analysis-1788165862029

Corporate and Insurer Funded Programmes

The fastest model grows at 14.7%, half again the market rate of 9.8%, and it grows because it removes the individual from the payment decision entirely. An employer or insurer buys population coverage on annual renewal rather than an individual weighing USD 16.40 against their own intentions each month, which converts discretionary consumer spending into contracted revenue. Utilisation runs around 23% of enrolled employees and the industry lived comfortably with that for years. Purchasers have recently begun measuring participation rather than enrolment, which is reshaping this segment faster than any product development has managed to. The payer and the participant being different people is the whole commercial advantage in this segment.
CAGR 14.7%

Connected Equipment Platform Subscriptions

Equipment-linked subscriptions grow at 12.3% on retention around 2.4 times what app-only offerings achieve, and the mechanism has very little to do with content quality. A bicycle or rower occupying floor space in a bedroom is a daily reminder that money was spent, and cancelling the subscription does not remove the object or the reproach. Sunk cost and physical presence together produce a retention effect no class library has ever matched. The correction that followed the boom punished participants who mistook hardware volume for a durable subscription base underneath it. Retention through physical presence is unglamorous, entirely unrelated to product quality, and considerably more reliable than anything the content teams have produced.
CAGR 12.3%
Full segment breakdown across 6 segments available in the complete report.

Regional Architecture and Country Demand Map

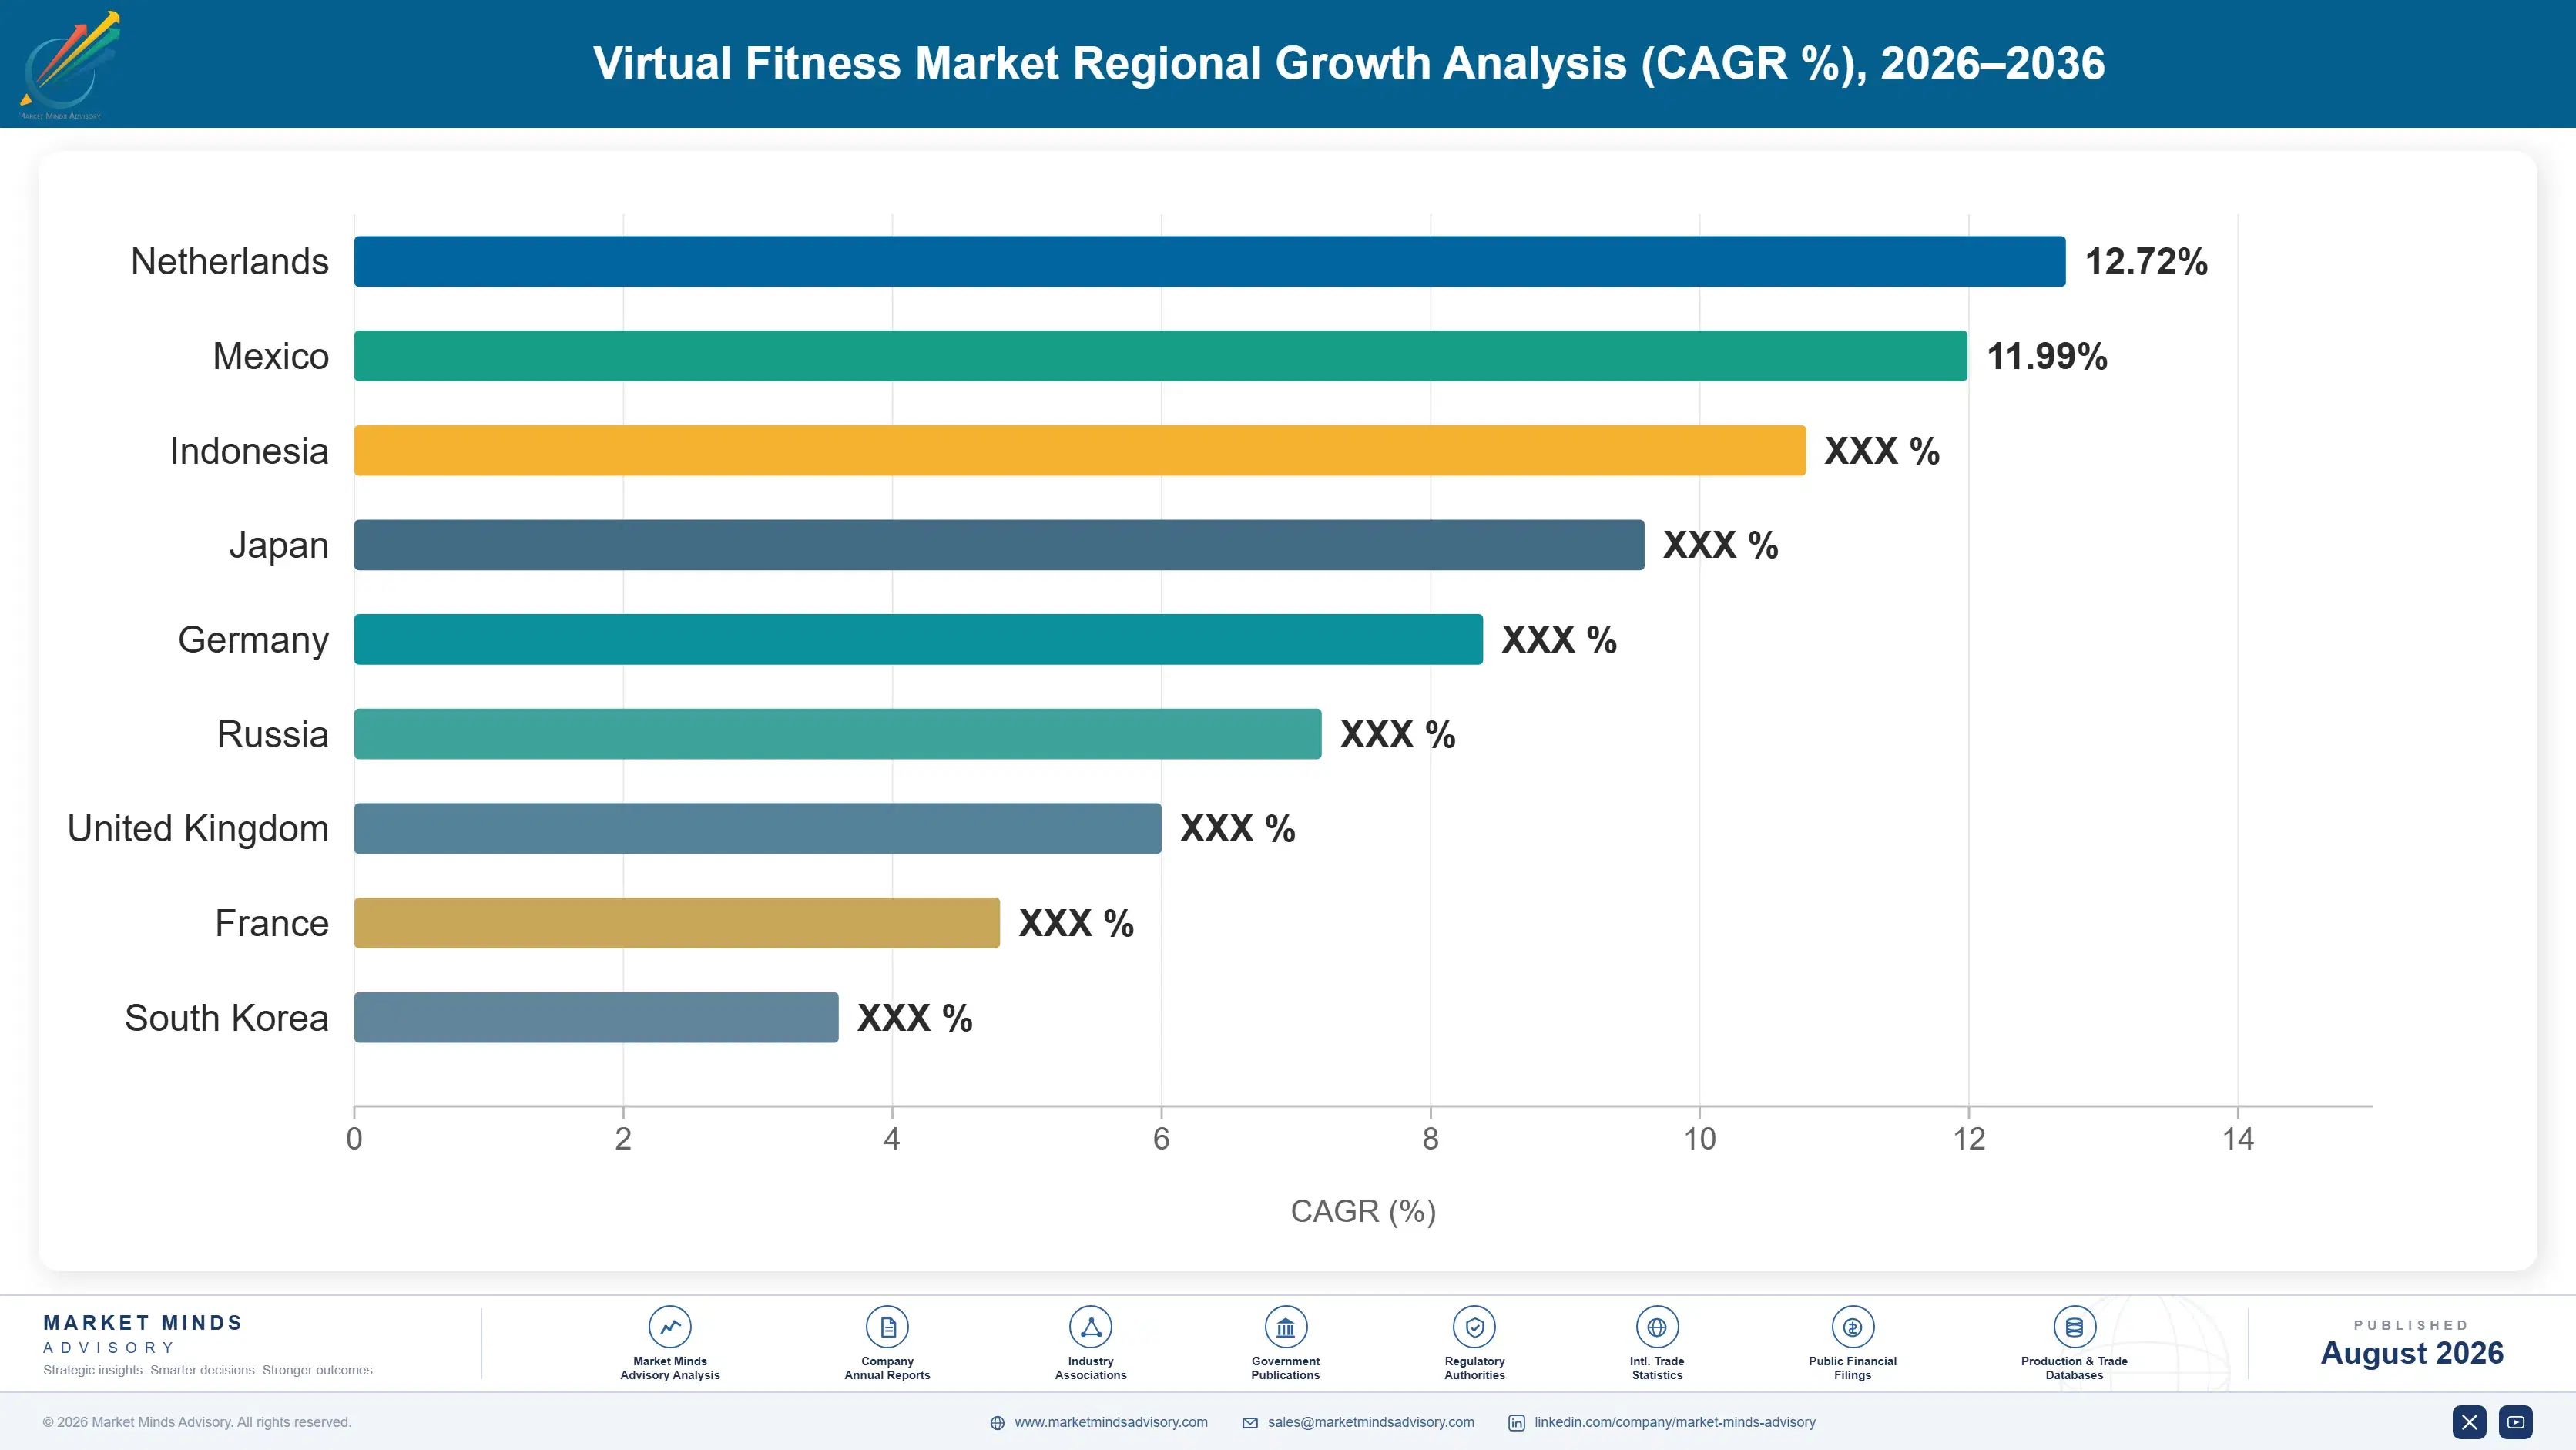
Participation follows connectivity, disposable income and employer benefit structures rather than fitness culture alone. North America leads on subscription value and corporate funding, with East Asia expanding fastest among large markets and South Asia growing quickest from a considerably smaller base. Benefit payer structure matters most of all.

North America

The largest share at 31% rests on subscription pricing above every other region and on employer benefit structures that fund participation at genuine scale. Connected equipment adoption reached levels no other market approached during the boom, and the subsequent correction was correspondingly severe. Insurer involvement in wellness benefit design is more developed here than anywhere, which is where the fastest growing revenue in this market originates. Utilisation scrutiny from corporate purchasers has also advanced further here than elsewhere. Utilisation scrutiny arriving here first matters for everybody else, because benefit purchasing practice developed in this market has historically spread outward to multinational employers within a few years of appearing, reliably enough.
Share: 31% | CAGR: 10.2% (2026 to 2036)

East Asia

A 24% share reflects unusually high smartphone-native participation and platforms built around social and competitive features rather than around instructional libraries. Chinese platforms integrate fitness into broader lifestyle and commerce applications, which produces engagement patterns Western participants have not replicated. Korean and Japanese adoption skews toward shorter sessions fitted around long working hours. Connected equipment penetration is lower than in North America, and app-only retention is correspondingly harder to sustain across the region. Building fitness into applications people already open every day removes the acquisition problem that defines this industry everywhere else, and it is the single clearest difference between how this region and the West have approached the category.
Share: 24% | CAGR: 11.0% (2026 to 2036)
Regional intelligence for 5 additional markets available in the complete report: Western Europe, South Asia and Pacific, Latin America, Middle East and Africa, Eastern Europe. Contact sales@marketmindsadvisory.com.
virtual-fitness-market-country-cagr-analysis-1788165862575

Where Virtual Fitness Margin Sits

Four levers work on retention, payer identity and habit structure rather than on content investment, which has never retained anybody who stopped wanting to exercise. Corporate funding, hardware attachment, community design and utilisation evidence each address the churn arithmetic directly and immediately. None of the four requires producing one additional class or hiring one more instructor.

Shift The Payer From Individual To Employer

A consumer weighing USD 16.40 against their own intentions each month cancels far more readily than an employer renewing an annual population contract, and corporate programmes accordingly grow at 14.7% against 9.8% for the market. The revenue quality improves even though engagement behaviour does not change at all. Selling to benefit teams requires a commercial capability consumer platforms rarely hold. Building it takes perhaps 2 years and changes what the business is fundamentally worth. Nobody cancels an annual contract in a moment of low motivation on a wet Tuesday morning.
Market Impact: Grows at 14.7% against a 9.8% market rate

Put Something Physical In The Customer's Room

Connected equipment produces retention roughly 2.4 times app-only subscriptions through sunk cost and daily visibility rather than any content advantage, and platforms without a physical presence are competing on the one dimension that demonstrably does not retain. Hardware need not be expensive or complex to work, since the mechanism is presence rather than capability. Even modest equipment paired with a subscription changes the cancellation conversation entirely, because the object does not go away when the application does. A 2 times retention improvement is worth more than any content budget ever spent.
Market Impact: Improves subscriber retention by roughly 2.4 times over

Design Community Structures Into The Product

Subscribers who form a social connection through a platform churn at materially lower rates than those who exercise alone, because leaving means leaving people rather than cancelling a service. Group challenges, cohort programmes and live participation all create that connection, and none requires content investment. Retention improvements of 20 to 30 percent are achievable where community is designed in rather than added on. Most platforms still treat social features as a marketing surface rather than a retention mechanism. A 25% retention gain costs nothing beyond product attention to actually obtain.
Market Impact: Improves subscriber retention by roughly 25% across cohorts

Measure Participation Before Purchasers Demand It

Corporate and insurer buyers have begun asking who actually used a programme rather than who enrolled in one, and utilisation running around 23% is an awkward answer for providers who never built the measurement. Those reporting genuine participation against enrolment are winning renewals that competitors are losing. Building the measurement takes months and costs very little. Providers waiting until a purchaser asks the question are answering it under conditions they do not control at all. The 23% figure is uncomfortable and answering it first is considerably better than being asked.
Market Impact: Reports genuine participation against a 23% utilisation average

Who Controls the Margin Pool

Concentration is low at around 37% across the five largest participants measured on virtual fitness subscription and programme revenue, and the fragmentation persists because content is not scarce. Instruction is abundant and much of it is free, which means no participant holds anything a subscriber cannot replace within minutes at no cost. The category is defined by that absence more than by anything else.
Competition runs on retention mechanics, payer relationships and physical presence. Retention mechanics decide whether a subscriber acquired is a subscriber kept. Payer relationships decide whether revenue depends on an individual's monthly enthusiasm. Physical presence decides whether cancellation is frictionless. Content quality features nowhere in that list, which took the industry an expensive period to accept properly.

Pressure is arriving from technology platforms and facility operators moving toward each other. Device platforms bundle fitness into subscriptions the customer already holds, acquiring participants at effectively zero cost. Facility operators have stopped treating digital delivery as competition and now sell hybrid entitlements. Rankings will shift toward participants holding payer relationships and physical presence, since one removes churn from revenue and the other reduces it directly.
virtual-fitness-market-company-positioning-matrix-1788165863094

Competitive Moat and Risk Dimensions

PELOTON INTERACTIVE

Moat: Hardware presence and community depth

Peloton holds connected equipment in customers' homes producing retention around 2.4 times app-only offerings, alongside community structures that make cancellation a social decision rather than a purely financial one. That combination addresses the churn arithmetic directly rather than through content investment. The installed equipment base generates subscription revenue long after the hardware sale itself has been recognised.
PELOTON INTERACTIVE

Risk: Hardware cost and inventory exposure

Connected equipment carries manufacturing, inventory and logistics cost that app-only competitors avoid entirely, and demand misjudgement produced painful write-downs through the correction. Hardware also raises the price of entry for a subscriber considerably. Competitors reaching customers through devices those customers already own acquire participants at a fraction of the cost.
WELLHUB

Moat: Employer payer relationships at scale

Wellhub sells to employers rather than individuals, which removes monthly cancellation from the revenue line and replaces it with annual contract renewal across an enrolled population. Aggregating facility and digital access gives employees breadth no single platform can match. The commercial capability required to sell into benefit teams is genuinely different from consumer marketing and considerably harder to build.
WELLHUB

Risk: Utilisation scrutiny from purchasers

Corporate buyers examining who actually participated rather than who enrolled create exposure for any model priced on population coverage, since utilisation across the category runs near 23%. Demonstrating genuine engagement requires measurement infrastructure and results that stand up. Renewal conversations become considerably harder once the question is asked properly.

Players Tracked

Prominent Players

Peloton Interactive
Apple Fitness
Technogym
iFIT
Wellhub

Other Key Players

Nike Training Club
Strava
Tonal
Hydrow
Zwift
Les Mills International
ClassPass
Alo Moves
Future
WHOOP
Freeletics
Keep
Cure.fit
EGYM
Virgin Active Digital

Recent Developments

MAY 2024

Corporate wellness purchasers moved renewal terms onto utilisation

Several large employers restructured wellness programme contracts to price and renew on measured participation rather than on enrolled headcount, responding to internal scrutiny of benefit spending against demonstrable employee use. This was a purchasing decision by the customers rather than any commercial arrangement between programme providers.
Signal: Pricing on participation rather than on enrolment reprices the whole corporate wellness category permanently and everywhere.
NOVEMBER 2024

Facility operator launched combined digital and physical entitlement

A gym operator launched a membership pairing facility access with digital class entitlements, abandoning a long-held position that digital delivery competed with attendance rather than supporting it. This was a product launch rather than any acquisition, merger or joint venture with a digital fitness platform.
Signal: Operators treating digital as complementary rather than competitive retain members considerably better than they did before.
MARCH 2025

Device platform bundled fitness into an existing subscription

A consumer technology platform added fitness content to a subscription its customers already held, acquiring participants at effectively no incremental acquisition cost and reaching an audience that standalone platforms pay substantially to obtain. This was a bundling decision rather than any corporate transaction between the parties.
Signal: Bundling into an existing subscription removes the acquisition cost that defines every standalone participant in this market.

What A Subscriber Actually Costs

Cost divides four ways and content is smaller than the industry's own narrative suggests. Subscriber acquisition absorbs roughly 41% of revenue, content production and instructor cost near 21%, platform, streaming and technology near 20%, and support with payment processing the remaining 18%. Acquisition takes around 11 months to pay back while 44% of a cohort has already stopped engaging, which is the entire commercial problem in a single comparison.
Digital advertising cost has moved sharply against this category across recent years, as platforms competing for the same audiences bid acquisition rates upward while conversion quality declined. Peloton Interactive and Technogym have both discussed acquisition and marketing cost across recent reporting periods. Instructor and production cost has moved less, and several participants have reduced content investment without any measurable effect on subscriber retention whatsoever at all.

Exposure varies by payer rather than by geography. Consumer subscription businesses carry full acquisition cost against a subscriber who may cancel monthly. Corporate and insurer funded providers carry sales cost against annual contracts covering entire populations. Hardware-attached participants carry inventory and logistics exposure that app-only competitors avoid, and receive retention in exchange that those competitors cannot obtain at any price.
virtual-fitness-market-cost-volatility-analysis-1788165863289

Onboarding designed for habit rather than content discovery

Most cancellation happens inside ninety days and most onboarding is built to showcase content breadth rather than to establish a routine. Designing the first three weeks around a repeatable schedule costs nothing beyond product attention and measurably reduces early churn. Participants who optimise onboarding for library exploration are demonstrating the wrong thing at exactly the wrong moment.

Content investment capped where retention does not respond

Content production absorbs roughly a fifth of revenue and several participants have reduced it without any measurable retention effect at all. Instruction is abundant and free elsewhere, so additional library depth competes against something the subscriber can obtain for nothing. Capping that spending and redirecting it toward community or measurement generally produces a better return.

Acquisition channel discipline against payback period length

Acquisition takes around eleven months to pay back and channels differ enormously in the retention quality of the subscribers they deliver. Measuring payback by channel rather than cost per acquisition reveals sources that are actively unprofitable at any volume. Most participants still optimise on acquisition cost, which rewards exactly the channels that deliver subscribers who leave quickest.

Portfolio Architecture for Margin Defence

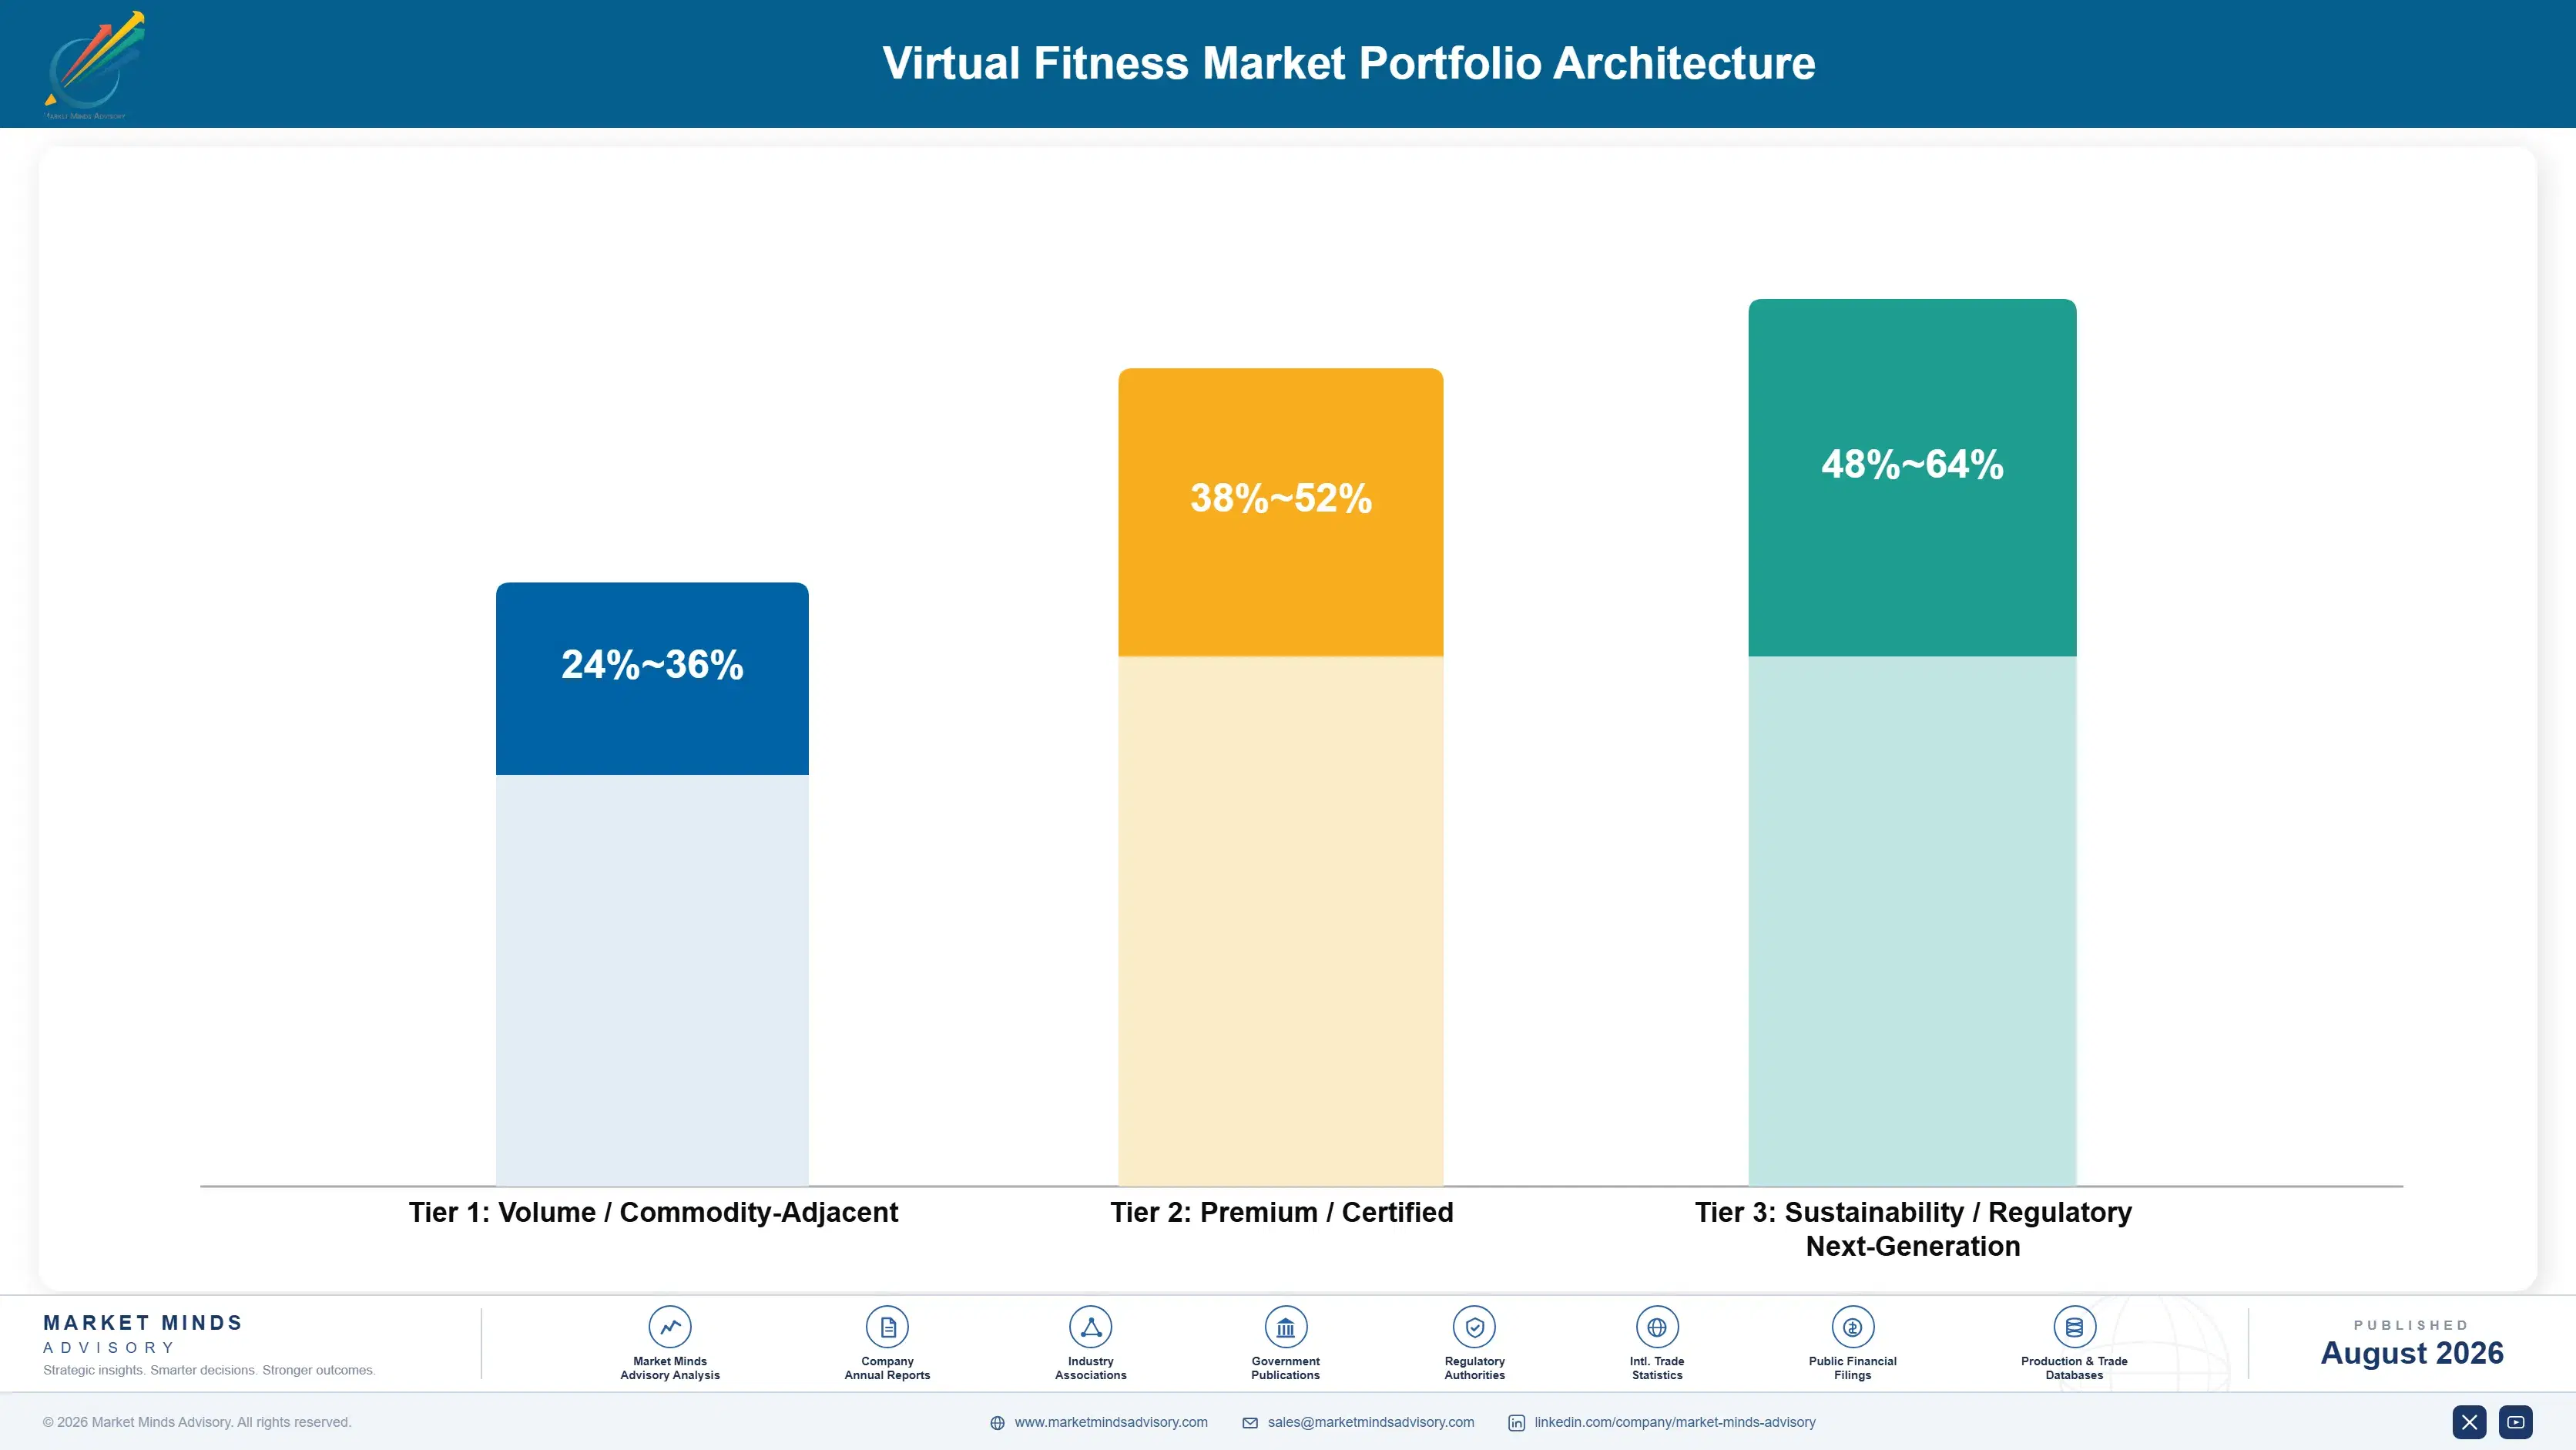
The portfolio separates by who pays and what stops the subscriber leaving. Open consumer subscription is the volume core: enormous user numbers, monthly cancellation, full acquisition cost against every one, and content that any subscriber can replace within minutes for nothing. It is the largest part of the market and the least defensible position anywhere within it. Everybody competes there and almost nobody profits.
Margin concentrates where the payer is not the participant or where something physical is involved. Corporate and insurer programmes contract annually across populations. Connected equipment retains at 2.4 times app-only rates through presence rather than content. Both address the churn arithmetic directly, and both require capabilities that a content-led consumer platform has no particular reason to have built. Neither is a content problem at all.

The overlooked pool is participation measurement. Corporate purchasers are moving renewal onto utilisation, providers reporting genuine engagement are winning renewals competitors lose, and the measurement costs very little to build. It is also the only asset in this category that improves a provider's position with the buyer who actually holds the budget. Nobody else is building it yet, which is the opportunity.

Volume / Commodity-Adjacent

Open consumer subscription apps and on-demand class streaming sold directly to individuals monthly. Range spans twelve points because acquisition efficiency and churn differ enormously between participants competing for identical audiences.
Gross Margin: 24-36%

Premium / Certified

Connected equipment platform subscriptions, remote personal coaching and premium guided programmes. Range spans fourteen points because hardware attachment and coaching cost structures are barely comparable within a single tier. Structures differ sharply.
Gross Margin: 38-52%

Sustainability / Regulatory / Next-Generation

Corporate and insurer funded programmes, population health arrangements and hybrid facility entitlements. Range spans sixteen points because contract structure and utilisation obligations vary considerably between providers here. Contract terms decide the outcome.
Gross Margin: 48-64%
virtual-fitness-market-portfolio-architecture-1788165863794

High-value Sub-segments and Strategic Watch-out

Corporate and Insurer Funded Programmes

High value and high growth at 14.7%, removing the individual from the payment decision entirely and contracting annually instead. The fourteen point range separates providers reporting genuine participation from those still pricing purely on enrolled population headcount. Annual renewal beats monthly cancellation every single time.
Gross Margin: 50-64%

Connected Equipment Platform Subscriptions

High value with moderate growth at 12.3%, retaining at roughly twice the rate of app-only offerings through physical presence alone. The twelve point range reflects hardware cost structures, since inventory and logistics exposure varies enormously across equipment types. Presence rather than content produces that effect.
Gross Margin: 42-54%

Open Consumer Subscription Platforms

The volume core, carrying full acquisition cost against subscribers who cancel monthly and replace the content instantly. Enormous reach, no defensible scarcity, and the part of this market where the churn arithmetic bites hardest of all. Everybody starts here and the arithmetic here is brutal.
Gross Margin: 24-36%

Utilisation Measurement Capability

The strategic watch-out rather than a growth pool. Purchasers now ask who actually participated, utilisation runs near a quarter of enrolment, and providers without measurement answer that question on somebody else's terms. Building the measurement costs months rather than years and remarkably little actual money.
Gross Margin: Variable

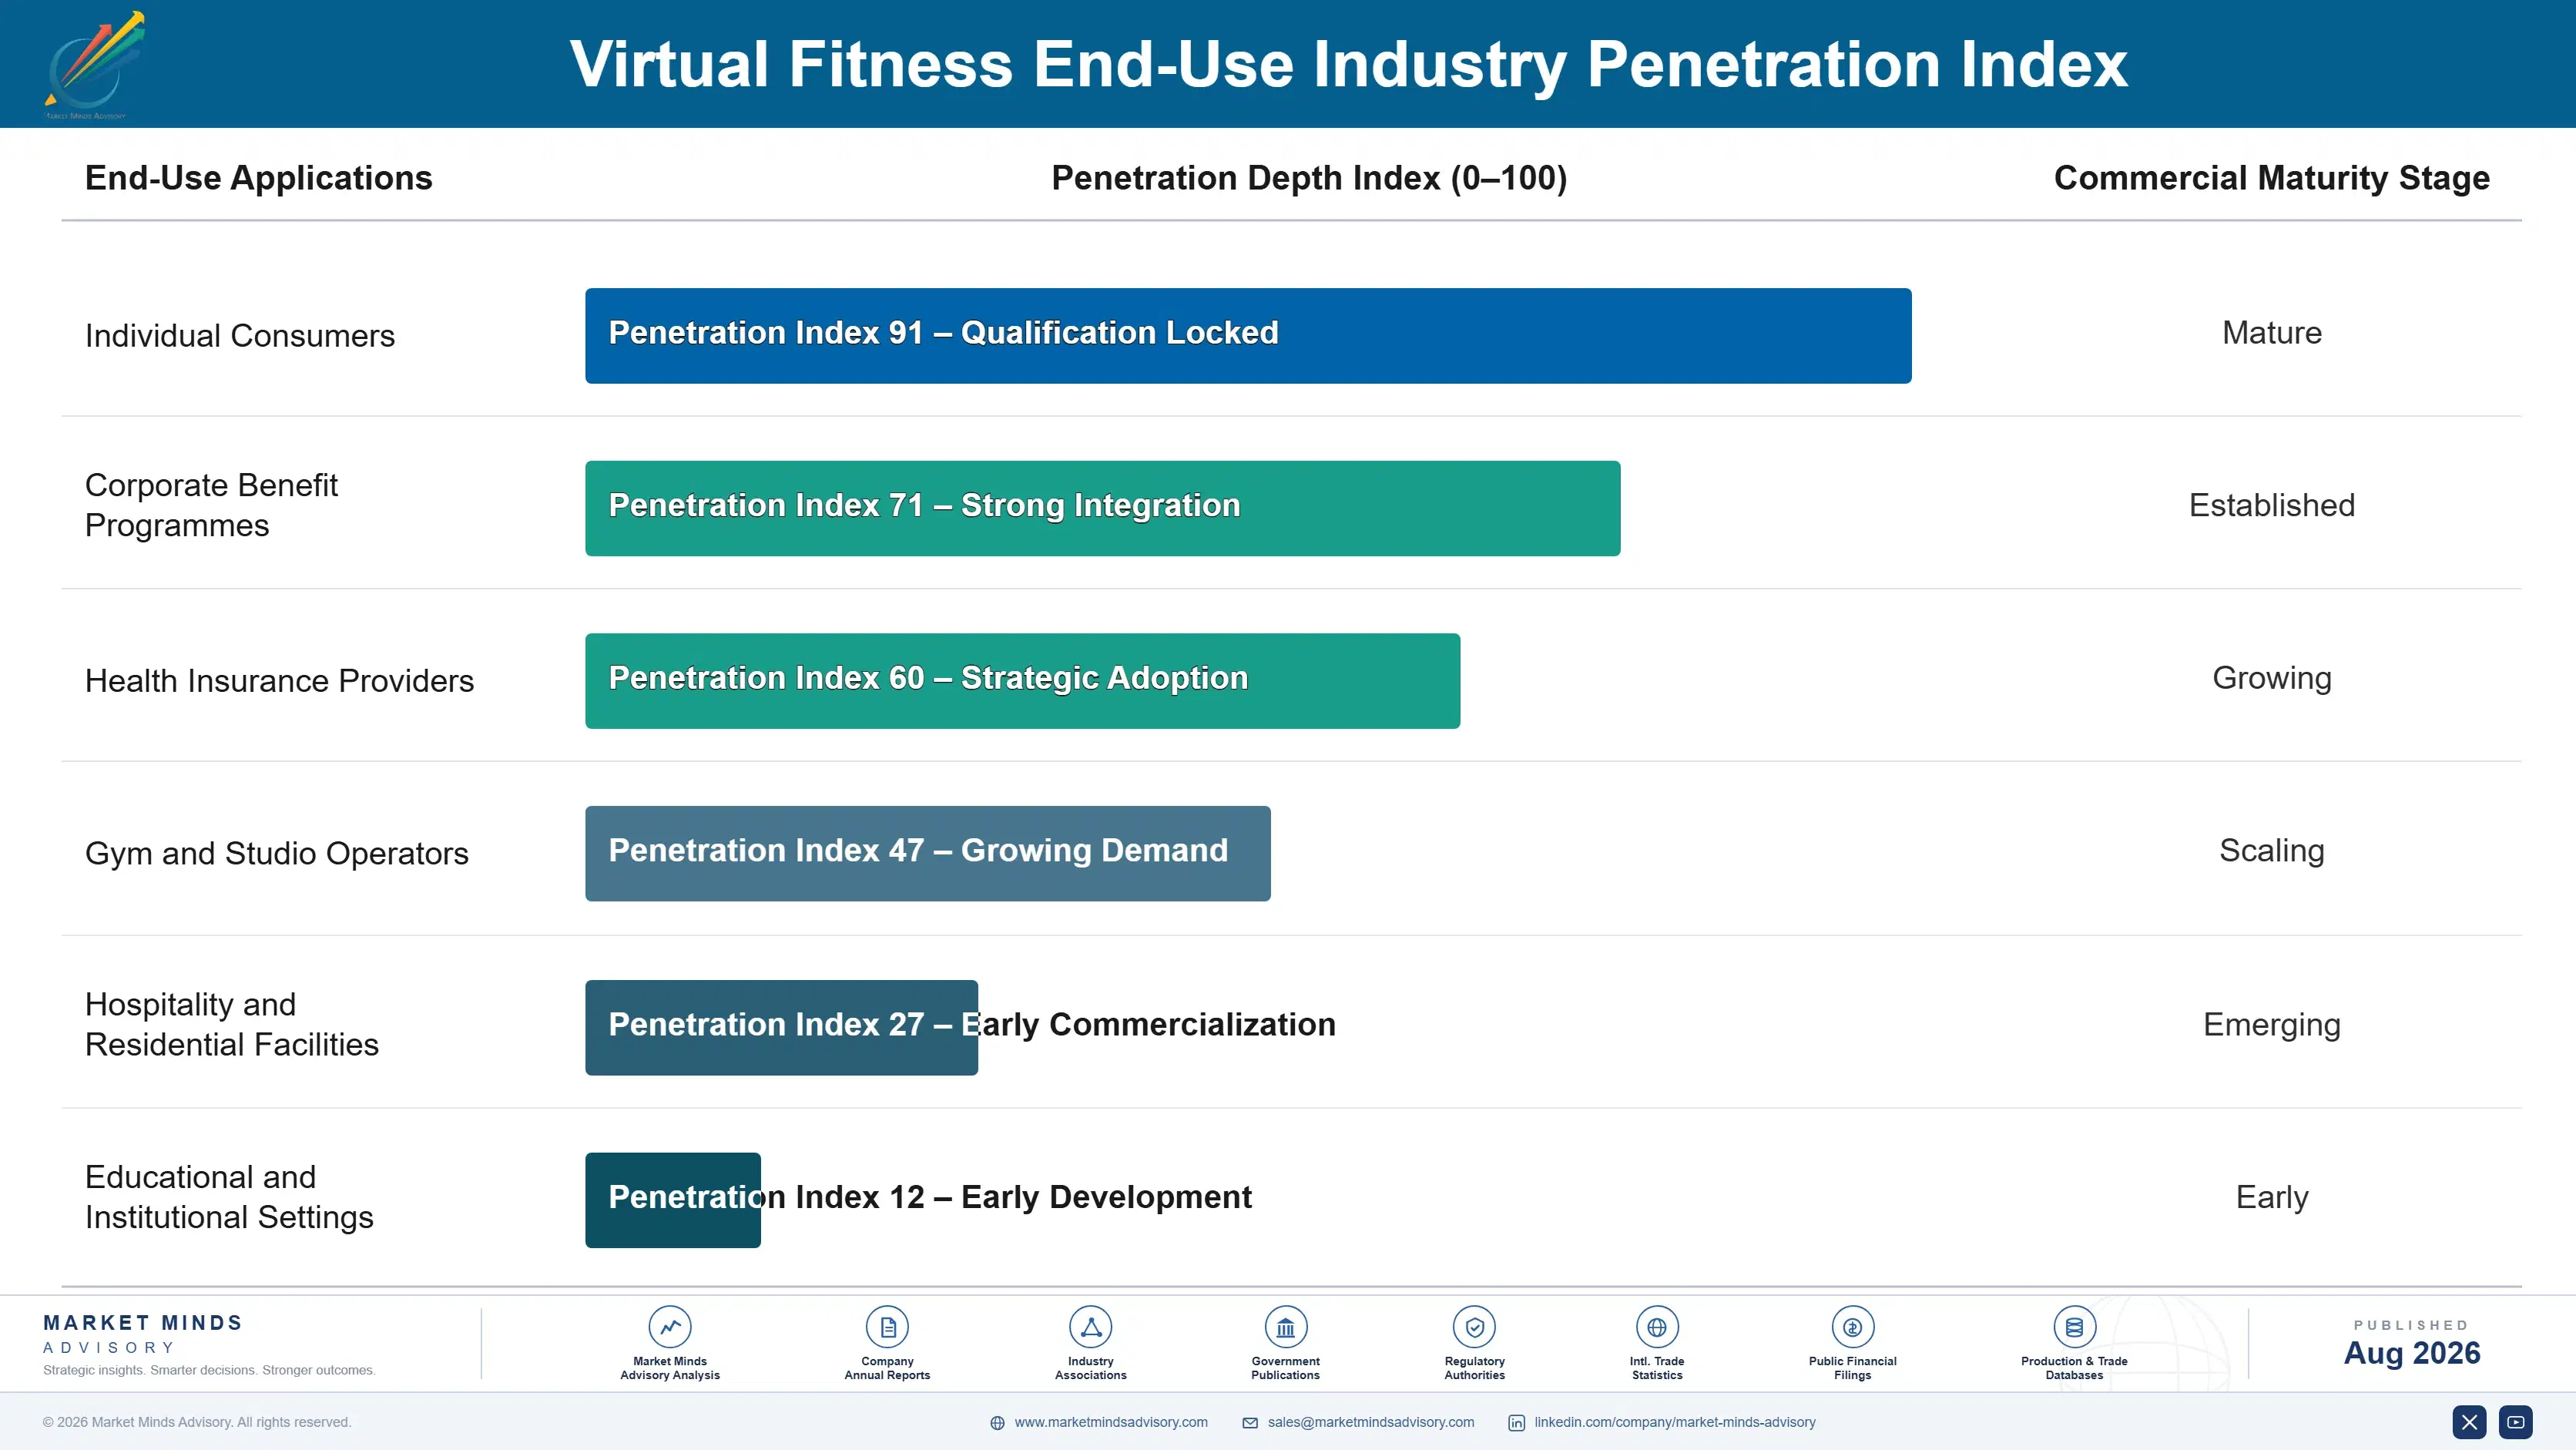
Why Subscribers Stop Turning Up

Subscription revenue looks like an annuity and behaves like one only where something prevents cancellation. Around 44% of a cohort stops engaging within ninety days against an acquisition payback of roughly 11 months, which means the annuity is real for a minority and an illusion for everybody else. Providers who model lifetime value on the retained minority and acquisition cost on the whole cohort have been describing a business that does not exist.
Stickiness varies by what surrounds the subscription rather than by what is inside it. Corporate funded participants are retained by a contract they did not sign personally. Equipment owners are retained by an object in the room. Community members are retained by people. Content-only subscribers are retained by nothing at all, which is why they leave at rates that no amount of production investment has ever meaningfully altered.

The buyer has changed most where the money is growing. Individual consumers still decide monthly on enthusiasm. Benefit and insurance purchasers decide annually on evidence, and they have recently started asking for participation data rather than accepting enrolment figures. Providers whose commercial approach was built for consumer marketing find the second conversation requires an entirely different kind of proof.
virtual-fitness-market-end-use-penetration-index-1788165864279

Where Providers Should Commit Now

These are among the four positions where our research anticipates prominent divergence between winners and laggards over the coming forecast period. Each is grounded in the demand model, the regulatory perimeter, and the announced capacity pipeline.
01 / PAYER STRUCTURE SHIFT

An employer renews annually and a consumer cancels monthly

A consumer weighing USD 16.40 against their own good intentions every single month cancels far more readily than an employer renewing an annual population contract does, and corporate programmes accordingly grow at 14.7% against 9.8% for the wider market. The revenue quality improves substantially even though the underlying engagement behaviour of the participants does not change at all. Selling into benefit teams requires an entire commercial capability that consumer platforms rarely hold and that takes roughly two years to build properly.
02 / PHYSICAL PRESENCE DESIGN

Something in the room beats anything on the screen

Connected equipment produces retention roughly 2.4 times that of app-only subscriptions through sunk cost and simple daily visibility rather than through any content advantage whatsoever anywhere. Platforms without any physical presence at all are competing on precisely the dimension that has been demonstrated not to retain anybody at all. Hardware need not be expensive or sophisticated at all for the mechanism to work, because presence rather than capability is what changes the cancellation conversation in the subscriber's own living room.
03 / COMMUNITY RETENTION STRUCTURES

Leaving people is harder than cancelling a service

Subscribers who go on to form a genuine social connection through a platform churn at materially lower rates than those who exercise alone, because cancellation then means actually leaving people rather than simply ending a monthly payment. Group challenges, cohort programmes and live participation events all create that connection, and none of them requires any content investment whatsoever. Retention improvements of twenty to thirty percent are readily achievable wherever community is designed into the product rather than bolted on somewhere afterwards.
04 / PARTICIPATION EVIDENCE BUILDING

Answer the utilisation question before it is asked

Corporate and insurer buyers have now begun asking who actually used a programme rather than who merely enrolled in one of them, and utilisation running at around 23% is an awkward answer for any provider that never built the measurement at all. Those reporting genuine participation against enrolment figures are already winning renewals that their competitors are currently losing outright. Building that measurement infrastructure takes months rather than years and costs remarkably little against what it actually ends up protecting.

Engagement Snapshot From the Field

A live engagement with an industry participant carrying material or product regulatory and market exposure ahead of a defining policy shift, showing how our research translates into a defensible multi-year portfolio strategy.
MARKET MINDS ADVISORY · CLIENT ENGAGEMENT SUMMARY
Virtual Fitness Producer Strategic Portfolio Review and Transition Roadmap 2026·Investment Scenario on Virtual Fitness Exposure Evaluation 2025-26
CLIENT PROFILE
A subscription fitness platform with a large content library, several million registered users and no hardware, no community structure and no corporate channel. Subscriber numbers had grown for four years while contribution declined steadily, and management had responded by increasing content production on the assumption that a deeper library would improve retention across the base.
STRATEGIC CHALLENGE
The board needed to establish whether content investment had any measurable effect on retention, and whether building a corporate sales capability justified the two years it would take. It also faced a decision on whether to introduce a low-cost hardware accessory, which product leadership regarded as a distraction and finance leadership regarded as the only retention mechanism available.
MMA APPROACH
MMA rebuilt cohort retention against content consumption across four years, testing directly whether library depth predicted anything about how long a subscriber stayed. It modelled corporate channel development against continued consumer acquisition. Expert interviews with benefit purchasers, insurers, facility operators and competing platforms established what actually retains subscribers and who is willing to pay for them.
KEY FINDINGS
  1. Content library depth showed no measurable relationship with retention in any cohort examined, and content spending had risen by roughly half across the period without effect.
  2. Subscribers who joined a group challenge in their first month retained at nearly twice the rate of those who did not, and only a small fraction were ever invited.
  3. Acquisition cost varied by more than three times across channels while retention varied more still, and the two had never been measured together at all.
  4. Two benefit purchasers interviewed would contract with the client immediately if it could report participation rather than enrolment, which it currently could not do.
CLIENT PROFILE
A subscription fitness platform with a large content library, several million registered users and no hardware, no community structure and no corporate channel. Subscriber numbers had grown for four years while contribution declined steadily, and management had responded by increasing content production on the assumption that a deeper library would improve retention across the base.
STRATEGIC CHALLENGE
The board needed to establish whether content investment had any measurable effect on retention, and whether building a corporate sales capability justified the two years it would take. It also faced a decision on whether to introduce a low-cost hardware accessory, which product leadership regarded as a distraction and finance leadership regarded as the only retention mechanism available.
MMA APPROACH
MMA rebuilt cohort retention against content consumption across four years, testing directly whether library depth predicted anything about how long a subscriber stayed. It modelled corporate channel development against continued consumer acquisition. Expert interviews with benefit purchasers, insurers, facility operators and competing platforms established what actually retains subscribers and who is willing to pay for them.
KEY FINDINGS
  1. Content library depth showed no measurable relationship with retention in any cohort examined, and content spending had risen by roughly half across the period without effect.
  2. Subscribers who joined a group challenge in their first month retained at nearly twice the rate of those who did not, and only a small fraction were ever invited.
  3. Acquisition cost varied by more than three times across channels while retention varied more still, and the two had never been measured together at all.
  4. Two benefit purchasers interviewed would contract with the client immediately if it could report participation rather than enrolment, which it currently could not do.
RECOMMENDED STRATEGY
Phase 1: Phase one: cap content production at current levels and redirect that spending toward community structures and onboarding designed around habit formation. Phase 2: Phase two: build participation measurement and approach benefit purchasers with genuine engagement evidence rather than with enrolment numbers alone as evidence. Phase 3: Phase three: introduce a low-cost hardware accessory bundled with subscription, testing physical presence as a retention mechanism at modest scale.
OUTCOME
The client reported ninety day retention improving 9 points within three quarters and contribution turning positive (client-reported, unverified by MMA). Content spending fell without any measurable retention effect. Two corporate contracts were signed on participation reporting alone, and the hardware pilot entered a limited release afterwards.

Frequently Asked Questions

Foundational context covering the market sizes, CAGR, scope, country, region and competition that inform every finding below. This section is provided to cover basics and most often pre-purchase conversations, answered from the MMA Primary Research Dataset.

What is the current size of the Virtual Fitness Market?

The market is valued at USD 32.0 billion in 2025, measured as revenue from digitally delivered fitness instruction and training accessed outside a physical gym.

How large will the Virtual Fitness Market be by 2036?

MMA forecasts USD 89.49 billion by 2036, up from USD 35.14 billion in 2026. That represents incremental revenue of USD 54.35 billion and an expansion multiple of 2.55 times.

What is the CAGR for the Virtual Fitness Market 2026 to 2036?

The base case CAGR is 9.8%, with a bull case of 11.0% and a bear case of 8.5%. Corporate and insurer funded participation supplies most of that growth.

Which segment is growing fastest?

Corporate and insurer funded programmes grow at 14.7%, half again the market rate of 9.8%, because somebody other than the exerciser is making the payment decision.

Who are the major companies in the Virtual Fitness Market?

Peloton Interactive, Apple Fitness, Technogym, iFIT and Wellhub lead on subscription and programme revenue, holding only around 37% between them across a genuinely fragmented market.

Which country is growing fastest?

India grows fastest at 12.0%, driven by smartphone access and pricing set far below Western levels, producing enormous user numbers against modest revenue per user.

Report Segmentation Architecture

The full report scope spans multiple orthogonal segmentation dimensions, with cross-tabulated demand data provided for each dimension pair. Coverage extends further to regional breakdowns, trend trajectories, and the competitive detail needed to support segment-level decision-making.

By Delivery Model

  • Consumer Subscription Platforms
  • Connected Equipment Platform Subscriptions
  • Live and On-Demand Class Streaming
  • Corporate and Insurer Funded Programmes
  • Remote Personal Training and Coaching
  • Immersive and Gamified Fitness Experiences

By End-Use Industry

  • Individual Consumers
  • Corporate Benefit Programmes
  • Health Insurance Providers
  • Gym and Studio Operators
  • Hospitality and Residential Facilities
  • Educational and Institutional Settings

By Commercial Dimension

  • Direct Consumer Subscription
  • Hardware Bundled Subscription
  • Employer Contracted Programmes
  • Insurer Reimbursed Participation
  • Platform Bundled Distribution
  • Facility Partnership Arrangements

By Region

  • North America
  • Western Europe
  • East Asia
  • South Asia and Pacific
  • Latin America
  • Middle East and Africa
  • Eastern Europe

Scope, Methodology, and Coverage

Every figure in this report is reproducible from documented input assumptions. The scope below maps the historical period, the forecast horizon, the segmentation dimensions, and the countries covered, alongside the underlying primary and qualitative methodology.
Historical Period
2020 to 2025
Forecast Period
2026 to 2036
Base Year
2025 (USD billions; MMA Primary Research Dataset, August 2026)
Market Definition
Revenue from digitally delivered fitness instruction and training accessed outside a physical gym setting, spanning consumer subscription platforms, connected equipment platform subscriptions, live and on-demand class streaming, corporate and insurer funded programmes, remote personal training and coaching, and immersive and gamified fitness experiences. Direct consumer subscription, hardware bundled subscription, employer contracted programmes, insurer reimbursed participation, platform bundled distribution and facility partnership arrangements are all included. Physical gym memberships and studio classes, connected fitness hardware revenue itself, wearable device sales, and clinically supervised rehabilitation programmes are excluded.
Quantitative Units
USD billions, virtual fitness subscription and programme revenue
Segmentation Dimensions
Delivery model, customer type, commercial payer structure, region
Regions Covered
North America, Western Europe, East Asia, South Asia and Pacific, Latin America, Middle East and Africa, Eastern Europe
Countries Covered
United States, Canada, United Kingdom, Germany, France, Italy, China, Japan, South Korea, India, Australia, Brazil, Mexico, United Arab Emirates
Key Companies Profiled
Peloton Interactive, Apple Fitness, Technogym, iFIT, Wellhub, Zwift, Tonal, ClassPass, Keep, EGYM
Quantitative Methodology
Primary survey, n=3,800 respondents, Q4 2025, six countries; demand-side model with trade association cross-validation
Qualitative Methodology
47 expert interviews, Q4 2025; applied to validate demand model assumptions, identify emerging dynamics, and assess competitive positioning
Report Format
PDF and XLSX data workbook (Word format preview document)
Publisher
Market Minds Advisory
Report Code
MMA-2026-TEC-491
Published
August 2026
Contact
sales@marketmindsadvisory.com | www.marketmindsadvisory.com

Purchase the full Virtual Fitness Market Report (2026 to 2036).

The full report treats this as the retention problem it has always been rather than the content competition it was funded as. It quantifies cohort churn against acquisition payback by delivery model, separates corporate and insurer funded revenue from discretionary consumer subscription, and assesses participation measurement as the requirement now reshaping the fastest growing part of the market. Segment analysis covers all six delivery models, with particular attention to corporate programmes where the payer is not the participant. Competitive assessment ranks twenty participants on virtual fitness subscription and programme revenue.
Six delivery model segmentation with growth rates
Cohort churn measured against acquisition payback periods
Twenty participant assessment on subscription and programme revenue
Corporate utilisation rates compared against enrolled populations
Hardware attachment retention effects quantified across platforms
Community structure impact assessed on subscriber retention

Built For The People Who Decide

From boardroom strategy to bench-side execution, this report is read cover-to-cover by leaders shaping the next decade of their industry, turning demand scenarios, market dynamics and valuation benchmarks into decisions.
CXOs/ Presidents/ VPs/ Managers
M&A and Corporate Development
Strategy Teams and R&D Heads
Procurement and Product Directors
Regulatory and Compliance Leaders
Investor Relations and Equity Analysts