Market Minds Advisory
Viral Vector Development Market

Viral Vector Development Market: Suite Overhang, Empty Capsids and the Analytical Bottleneck

The industry built manufacturing suites for a gene therapy pipeline that never arrived, and the constraint moved to proving what is actually inside the vials it does still manage to make.

Lead Analyst

Alice Ballenger

Published

September 2026

Make Smarter Decisions with Customized Research Insights

Request a free sample report and evaluate market opportunities, growth trends, and competitive dynamics relevant to your business needs.

2025 MARKET VALUE$6.8BMarket Size 2025
2036 FORECAST VALUE$22.3BBase Case , 2026 to 2036
CAGR 2026 TO 203611.4 %Bull 12.7% / Bear 10.1%
INCREMENTAL OPPORTUNITY$14.7BNet 10- year value creation
EXPANSION MULTIPLE2.94x2036 value over 2026 base
Strategic Levers
M&A Pipeline
Regional Outlook
Country Rankings
Competitive Intelligence
Segmental Deep-dive
Call-Us : 91 93563 13602

Executive Snapshot and Market Trajectory

Capacity built between 2020 and 2022 assumed a gene therapy pipeline that attrition and commercial disappointment never delivered, and suites now run at 52% utilisation. The binding constraint moved from making vector to characterising it, because only 34% of particles carry the intended payload and regulators want that measured properly.
Analytical characterisation and release testing compounds at 17.1%, exactly 1.50 times the market rate, and now consumes 27% of programme spend. North America holds 32% of value, the largest position, because gene therapy development and the manufacturing capacity serving it are both concentrated there. Commercial scale batches cost roughly USD 2.1 million to produce, and suite pricing has been under sustained pressure ever since.
Five providers deliver 41% of manufacturing batch slots, which is fragmented for an industry this capital-intensive, because suites were built faster than demand appeared. Technology transfer between sites takes 14 months, which is why sponsors rarely move once committed. That friction is the only thing protecting utilisation at several providers. Analytical capability rather than available capacity now decides which programmes a provider actually wins, and it was never what anybody financed.
Market Definition
Covers development, manufacturing and analytical services for viral vectors used in gene and cell therapy, spanning analytical characterisation and release testing, suspension adeno-associated virus process development, lentiviral vector manufacture, adherent adeno-associated virus manufacture, plasmid and raw material supply, and adenoviral and other vector manufacture. Sizing captures contract development, manufacturing and testing revenue at realised contract value plus captive in-house equivalent spend. Excludes non-viral delivery including lipid nanoparticles, messenger RNA manufacture, cell processing and expansion services, plasmid supply for non-vector applications, clinical trial services, and gene therapy product revenue itself.
Base Year Value
$6.8B in 2025 (MMA Primary Research Dataset, August 2026)
Forecast Period
2026 to 2036, eleven discrete annual values
CAGR
11.4% base case. Bull 12.7%. Bear 10.1%.
Fastest Growth Segment
Analytical Characterisation and Release Testing: 17.1% CAGR
Fastest Growth Country
India: 14.2% CAGR
Fastest Growth Region
South Asia and Pacific: 13.5% CAGR
Largest Region
North America: 32% of 2025 global value
Market Leaders
Thermo Fisher Scientific, Lonza, Catalent, Charles River Laboratories, WuXi Advanced Therapies. Source: MMA Analysis based on company annual reports.
Primary Survey
n=3,800 procurement and R&D decision-makers, Q4 2025, six countries
Methodology
Demand-side build-up, cross-validated against public data, 47 expert interviews

Viral Vector Development Market Forecast Scenarios

viral-vector-development-market-size-forecast-scenario-1787309973829
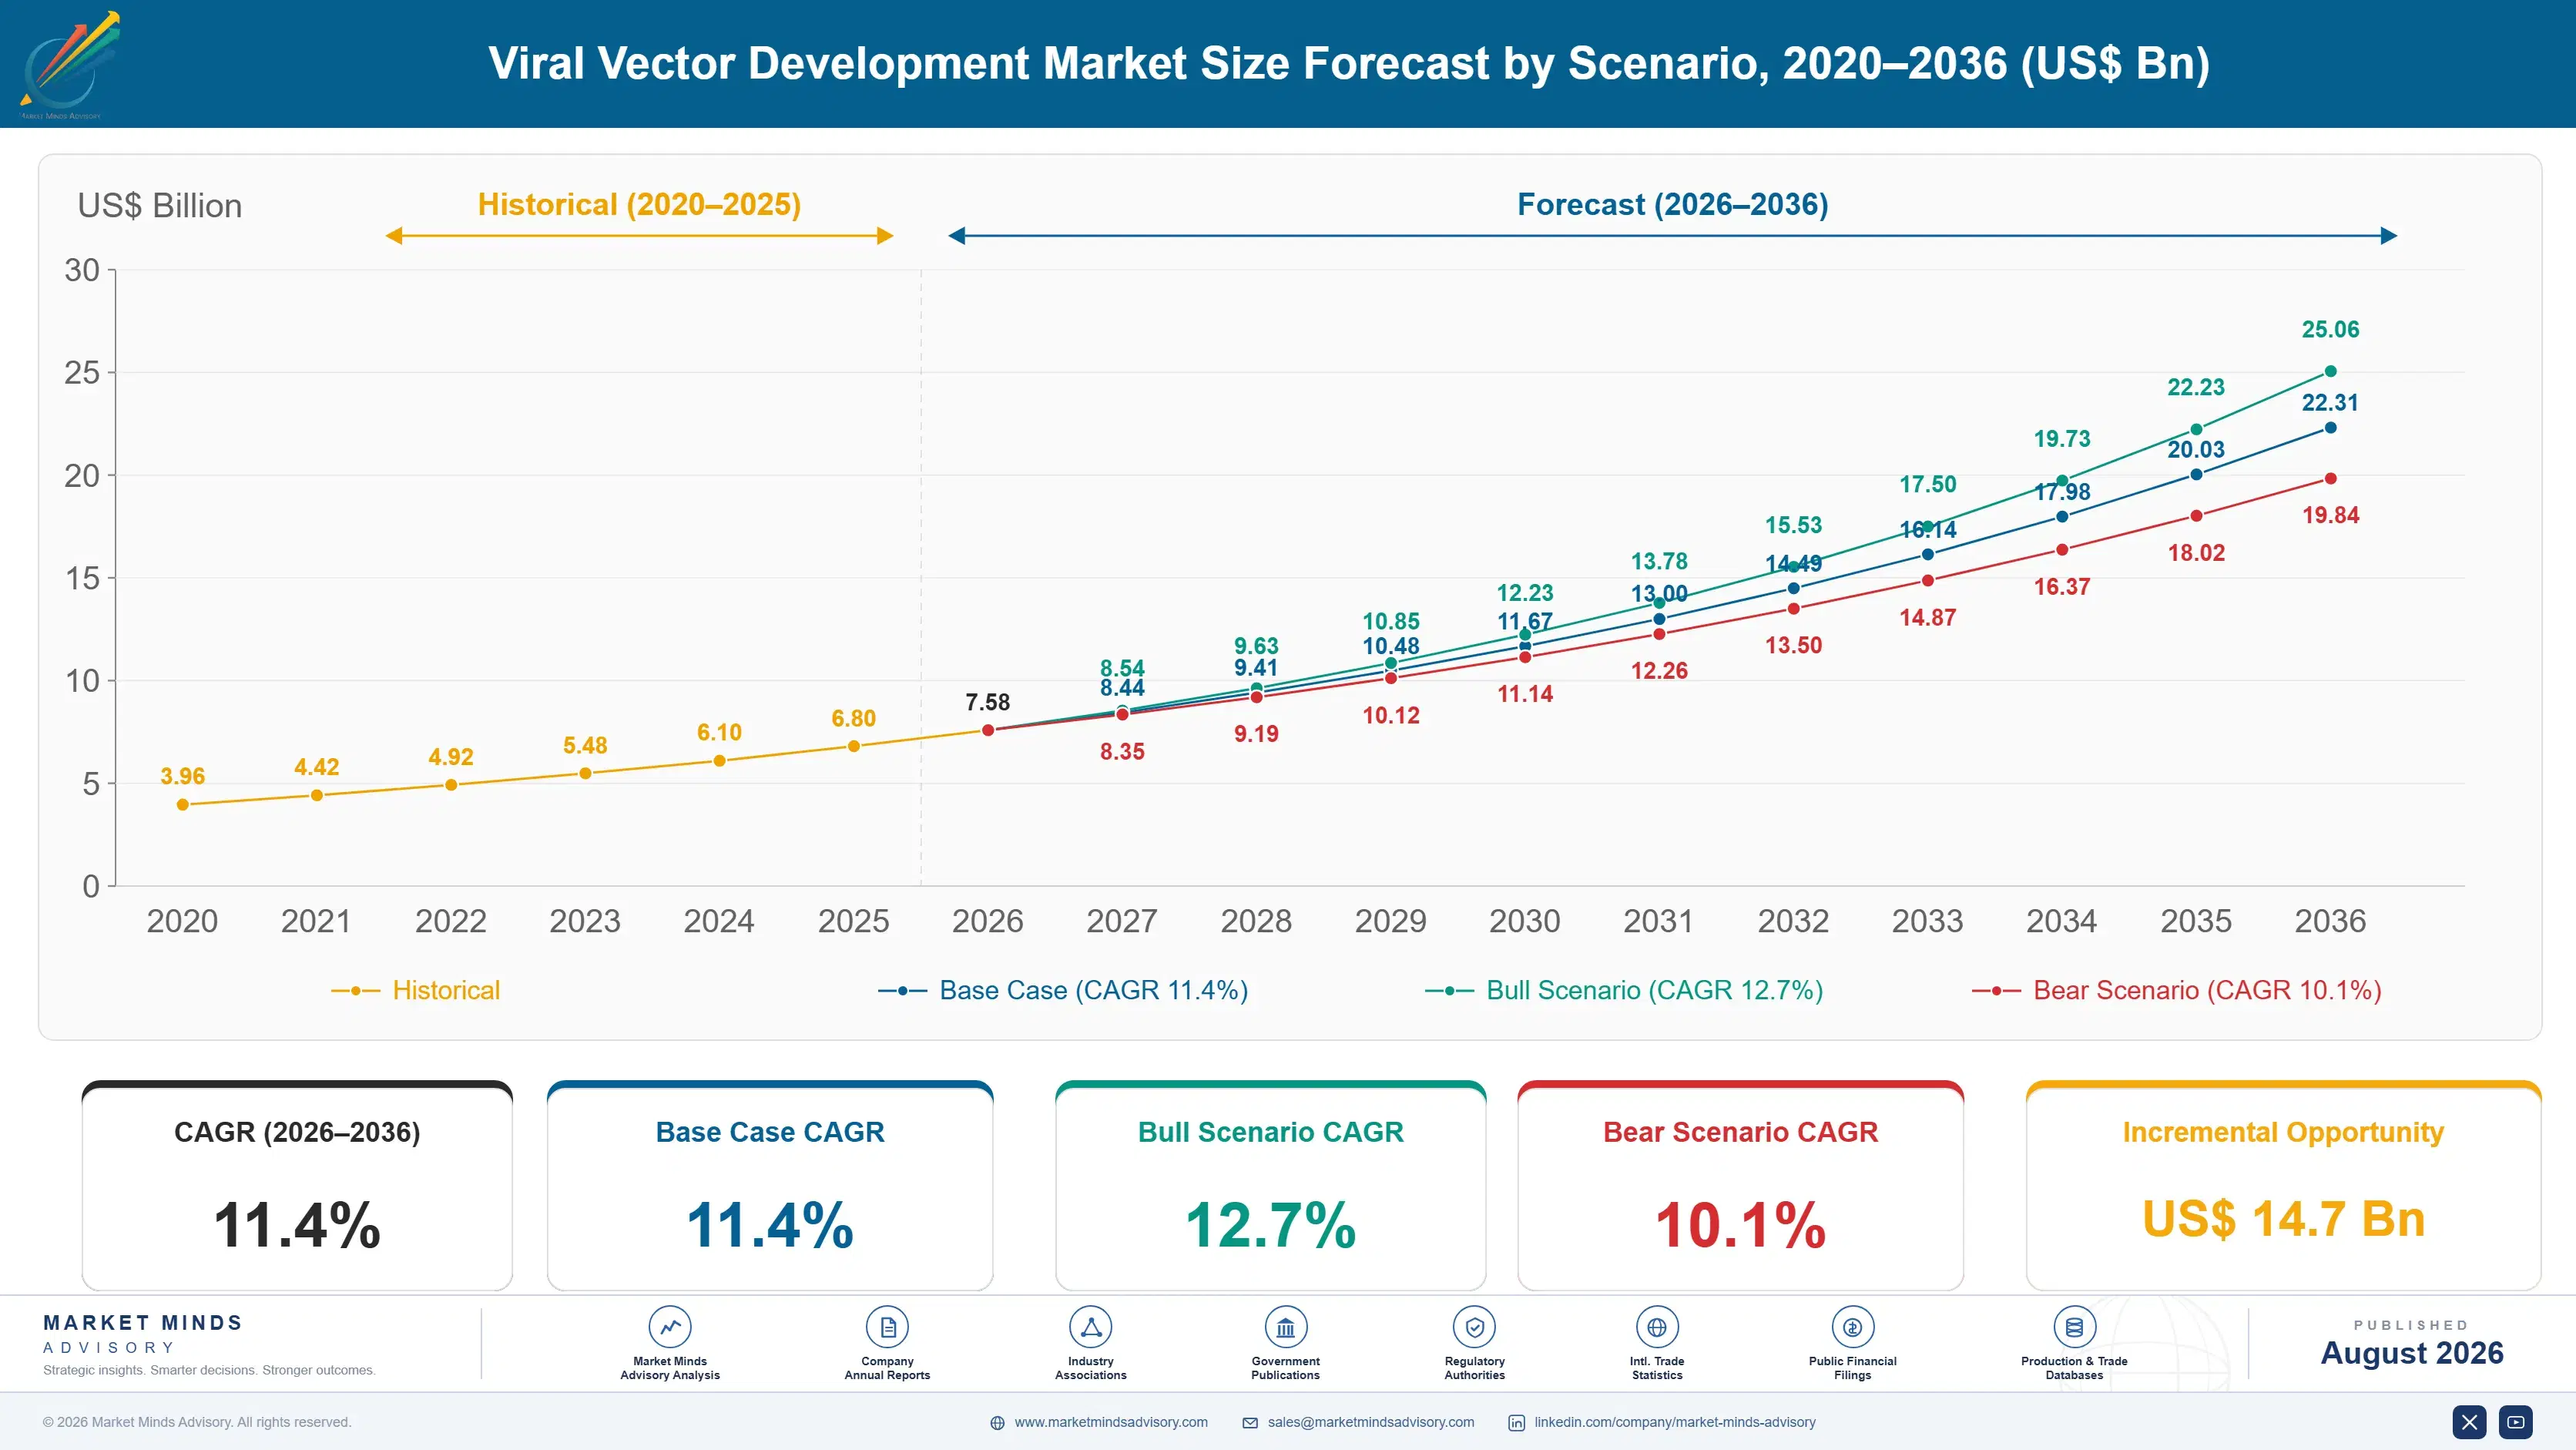
Growth of 10.2% across 2020 to 2025 masked a capacity story that went badly wrong in the middle. Providers and sponsors alike built manufacturing suites through 2020 and 2021 against gene therapy pipeline projections that assumed far higher clinical progression than materialised. Programme attrition, commercial disappointment among approved products and sponsor funding constraints all arrived together, leaving suites empty and pricing under pressure that has not yet lifted.
The base case of 11.4% rests on three mechanisms. Analytical characterisation keeps growing faster than manufacture because regulators now expect full and empty capsid ratios, impurity profiles and potency measured properly, and 27% of programme spend already goes there. Suspension process development keeps displacing adherent manufacture on yield and scalability grounds. And Asian capacity is building against domestic gene therapy pipelines that Western providers have never served and mostly cannot reach.
The bull case of 12.7% assumes late-stage gene therapy programmes progress at rates closer to original projections, which would absorb the suite overhang and restore pricing power to providers holding capacity. The bear case of 10.1% reflects two pressures: continued programme attrition leaving utilisation below 52%, and sponsors insourcing manufacture once a programme reaches commercial scale.

Suites Without Programmes To Fill Them

This industry made a forecasting error at scale and is still working through it. Suites were built through 2020 and 2021 against pipeline projections assuming clinical progression that did not happen, and commercial performance among approved products disappointed badly enough to slow sponsor investment. Suites now run at 52% utilisation, pricing has come under sustained pressure, and providers who expanded most aggressively are the ones carrying the heaviest fixed cost against it.
TOP FIVE CONCENTRATION41%Manufacturing batch slots delivered by the leading service providers
SUITE UTILISATION52%Share of installed suite capacity actually producing material
FULL CAPSID RATIO34%Proportion of particles carrying the intended genetic payload
BATCH COST AT SCALEUSD 2.1 millionTypical cost to produce one commercial scale batch
ANALYTICAL COST SHARE27%Portion of programme spend on characterisation and release testing
TECHNOLOGY TRANSFER DURATION14 monthsTime required to move a process between manufacturing sites
The technical picture moved while that happened. Making viral vector is no longer the hard part; proving what is in it is. Only 34% of adeno-associated virus particles typically carry the intended payload, the rest empty or partially filled capsids contributing immunogenicity without therapeutic effect, and regulators now expect that ratio controlled rather than reported. Analytical work now consumes 27% of programme spend and compounds at 17.1%.
Two forces determine the next decade. Whether late-stage programmes progress at anything like original projections decides when the suite overhang clears, and nobody in the industry forecasts that confidently any more. And technology transfer taking 14 months between sites is the friction protecting incumbent providers, since a sponsor that has qualified a process rarely moves it whatever the pricing elsewhere.
"Everyone built suites because everyone else was building suites, and the pipeline that justified it was a spreadsheet rather than a set of programmes. What nobody built enough of was analytics. The question that now holds regulatory submissions up is not whether you can make the vector. It is whether you can prove what fraction of it is actually full."
Director, Cell and Gene Therapy Manufacturing Practice · MMA Healthcare / Cell a

Market Trends

Analytical characterisation overtakes manufacture as the binding constraint

Only 34% of adeno-associated virus particles typically carry the intended genetic payload, and empty capsids contribute immunogenicity without therapeutic benefit, which regulators now expect measured and controlled rather than simply reported. Potency assays, impurity profiling and capsid ratio determination have become the work that holds submissions up. Analytical spend has reached 27% of programme cost and compounds at 17.1% against 11.4% for the market. Analytical capacity was built far less aggressively than manufacturing capacity, which is why it now constrains timelines. Specialist analytical businesses are being acquired rather than competed with as a direct result.
Market Impact: Grows regional value at 13.5% yearl
Suspension processes displace adherent manufacture on scalability

Adherent cell culture in fixed-bed or flask systems limits batch size and scales by adding vessels rather than volume, which becomes impractical as programmes approach commercial requirements. Suspension processes scale by bioreactor volume and deliver considerably better yield per unit of suite time. The segment grows at 14.2% while adherent manufacture grows at 6.6%. Transferring an existing adherent process to suspension requires comparability work sponsors resist late in development, which is why conversion happens at programme start rather than at scale-up. A provider not chosen at programme start reaches nothing later regardless of its yield advantage.
Market Impact: Requires 34% ratio characterised fu

Market Opportunities and Growth Drivers

Asian capacity builds against domestic pipelines Western providers miss

Chinese, Korean and Japanese gene therapy pipelines are developing against domestic regulatory pathways and domestic funding, and the manufacturing capacity serving them is being built regionally rather than contracted to Western providers. East Asia holds 22% of category value at 12.4% growth and South Asia and Pacific grows at 13.5%. Indian capacity is expanding through both contract providers and academic manufacturing units. Western providers carrying suite overhang are largely absent from that growth entirely, which compounds their utilisation problem. Regional contract pricing sits far below Western rates, which makes entry uncomfortable as well as necessary.
Market Impact: Runs suites at 52% utilisation

Regulatory expectation on capsid content raises analytical requirement

Regulators reviewing gene therapy submissions increasingly require full and empty capsid ratios characterised, controlled and justified rather than merely measured once, which turns analytics from a release activity into a process development discipline. That expectation has tightened across successive submissions rather than through any single guidance change. Sponsors discovering it late face delay measured in quarters. Providers holding genuine analytical depth are winning programmes on that basis alone, regardless of their manufacturing pricing or available suite capacity. Analytical capacity was built far less aggressively than manufacturing capacity, which is why it now binds.
Market Impact: Removes programmes above 3 batches

Market Restraints and Challenges

Suite overhang suppresses pricing across every provider

Installed manufacturing capacity runs at 52% utilisation, and the root cause is that suites were built against pipeline projections rather than against contracted programmes. Fixed cost per batch rises as utilisation falls, and providers competing for the programmes that exist discount to fill suites they cannot otherwise cover. Participants respond by consolidating suites into fewer sites, by converting manufacturing space to analytical capacity where demand genuinely is, and by pursuing regional pipelines they previously ignored entirely. Fixed cost per batch rises as utilisation falls, which makes discounting self-defeating rather than merely painful.
Market Impact: Consumes 27% of programme spend

Sponsors insource once programmes reach commercial volumes

A sponsor with an approved product and predictable volumes eventually finds owning the process cheaper and more controllable than contracting it, and the root cause is that vector manufacture is a fixed-cost business where volume certainty changes the arithmetic completely. Providers therefore lose their best customers at the point they become most valuable. Participants respond by offering long-term capacity reservation, by embedding analytical and regulatory support insourcing cannot easily replicate, and by accepting that development work is the more durable business. Development work commits a sponsor before volumes exist, which is when the relationship is actually formed.
Market Impact: Grows suspension processes at 14.2%
3 additional market trends, 4 additional growth drivers, and 2 additional restraints and challenges are covered in the full report. Contact sales@marketmindsadvisory.com to access the complete intelligence.

Segment CAGR and Growth Architecture

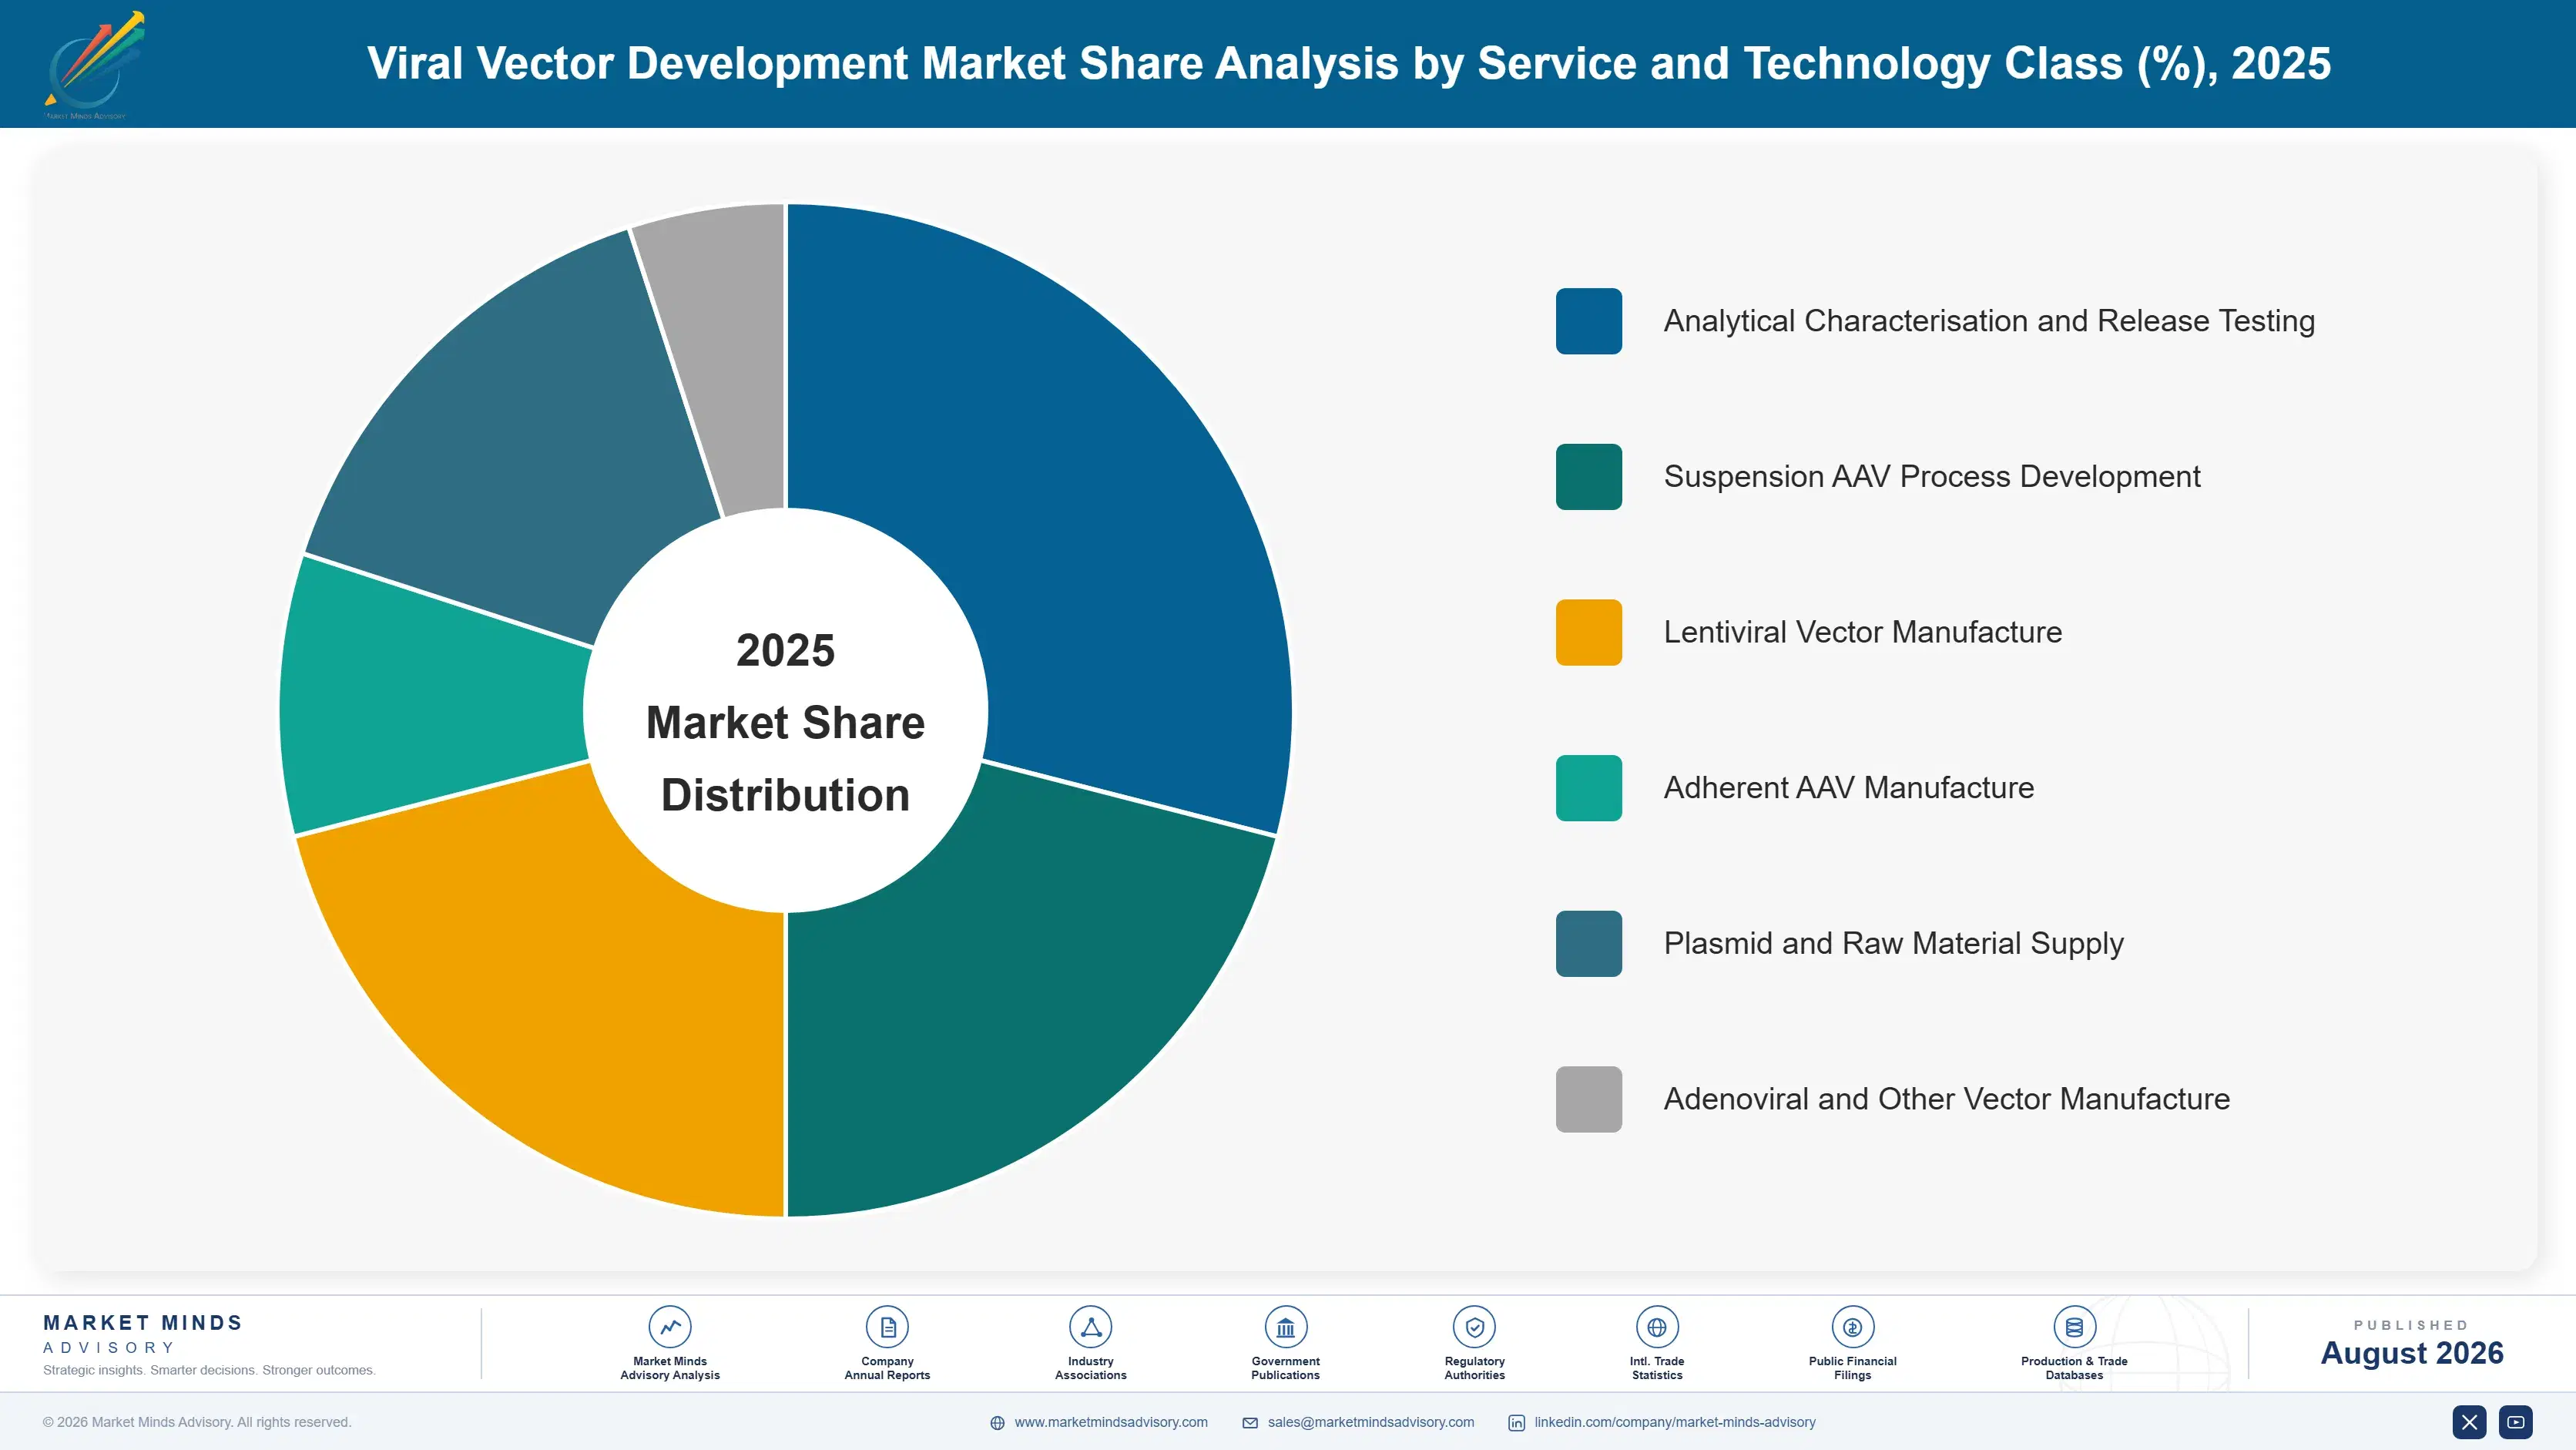
Segmentation follows the service and technology class, because each carries a distinct capacity requirement, skill base and pricing basis. Vector type, programme stage and geography all matter commercially but cut across every class, so they belong in later discussion. Six classes cover current viral vector development and manufacturing practice worldwide, and their utilisation economics differ sharply.
viral-vector-development-market-market-share-analysis-1787309974399

Analytical Characterisation and Release Testing

Analytical services compound at 17.1%, exactly 1.50 times the market rate, and they became the bottleneck because nobody built for them. Determining what fraction of particles carry the intended payload, profiling impurities and demonstrating potency now holds regulatory submissions up more often than manufacturing capacity does. Three commercial features follow. Analytical spend has reached 27% of programme cost and keeps rising as expectations tighten. Suite conversion into analytical capacity is the most sensible use of overhang anybody has found. And specialist analytical providers are being acquired rather than competed with, at valuations manufacturing assets no longer command anywhere. Analytical capacity was built far less aggressively than manufacturing capacity, which is precisely why it binds.
CAGR 17.1%

Suspension AAV Process Development

Suspension process development grows at 14.2%, second fastest, and it is displacing adherent manufacture for reasons of arithmetic rather than preference. Adherent systems scale by adding vessels while suspension scales by bioreactor volume, which matters enormously as a programme approaches commercial requirement. Yield per unit of suite time is considerably better. The commercial constraint is timing: transferring an existing adherent process to suspension requires comparability work sponsors resist once clinical material has been made, so conversion happens at programme start or effectively never happens at all. Yield per unit of suite time is considerably better, which matters most when utilisation is scarce and every suite hour has to earn. Sponsors will not contemplate comparability work late.
CAGR 14.2%
Full segment breakdown across 6 segments available in the complete report.

Regional Architecture and Country Demand Map

North America holds 32% of value because gene therapy development and the manufacturing capacity serving it are both concentrated there. Western Europe follows at 26% on established contract capacity. South Asia and Pacific grows fastest, led by India at 14.2%, on contract and academic capacity building.

North America

Thirty-two percent of global value sits in North America, growing at 10.7%, and gene therapy development concentration explains it rather than any manufacturing cost advantage. Most clinical-stage programmes originate here and most contract capacity was built here to serve them, which means the suite overhang is also concentrated here. Providers who expanded most aggressively through 2021 carry the heaviest fixed cost against 52% utilisation. Analytical capability is where investment has redirected, and specialist testing businesses are being acquired at valuations manufacturing assets no longer command. Sponsors insourcing at commercial scale remove the most valuable programmes from exactly the suites that that expansion was originally built to fill. Analytical acquisition activity is concentrated here too.
Share: 32% | CAGR: 10.7% (2026 to 2036)

Western Europe

Twenty-six percent of value and 9.9% growth reflect a long-established contract manufacturing base serving both European and American sponsors. Swiss, British and German providers hold deep process development capability built over decades in biologics before gene therapy existed. Regulatory expectation on capsid characterisation has tightened here in parallel with American review practice. Suite overhang is real but less severe than in North America, partly because European expansion was more measured. Academic and hospital manufacturing units serve early-phase programmes across several countries independently. Technology transfer friction protects incumbent providers here as everywhere, which is why utilisation has held up considerably better than pricing has. Academic units serve early-phase programmes independently across several countries.
Share: 26% | CAGR: 9.9% (2026 to 2036)
Regional intelligence for 5 additional markets available in the complete report: East Asia, South Asia and Pacific, Latin America, Middle East and Africa, Eastern Europe. Contact sales@marketmindsadvisory.com.
viral-vector-development-market-country-cagr-analysis-1787309974918

Four Ways To Fill The Suites

Capacity built against a pipeline that did not arrive now runs at 52% utilisation, while the analytical work everybody under-built holds submissions up. The levers that matter redirect capacity toward where demand genuinely is, and protect the programmes already qualified at a site. Each carries returns tested against disclosed provider economics and primary interview evidence.

Convert manufacturing suites into analytical capacity

Analytical characterisation consumes 27% of programme spend, compounds at 17.1% and constrains submission timelines, while manufacturing suites sit at 52% utilisation carrying full fixed cost. Providers converting suite space to analytical capability report facility contribution roughly 45% above leaving it idle. Conversion costs real capital and requires analytical scientists who are scarce and expensive, and it is considerably better than discounting manufacturing slots into a market that has too many of them already. Analytical scientists are scarce and expensive, which is the genuine constraint on how fast conversion can proceed.
Market Impact: Lifts facility contribution roughly

Sell technology transfer friction as a reason to commit

Moving a qualified process between sites takes roughly 14 months and carries comparability risk sponsors genuinely fear, which means a sponsor who commits early rarely moves regardless of pricing elsewhere. Providers presenting that lock-in honestly as a reason to choose carefully report programme retention roughly 60% above those competing on batch price. It requires the confidence to tell a sponsor the decision is difficult to reverse, which commercial teams instinctively avoid saying out loud. Sponsors respect the honesty and choose more carefully, which is the entire point of saying it aloud.
Market Impact: Improves programme retention roughl

Pursue regional pipelines Western providers have ignored

Chinese, Korean, Indian and Japanese gene therapy programmes are developing against domestic regulatory pathways and contracting regionally, and Western providers carrying overhang are largely absent from the fastest growing part of the market. Providers establishing regional presence report utilisation roughly 15 points above those serving Western sponsors alone. It requires local capability and pricing at regional contract rates that Western cost structures struggle to reach, which is precisely why so few have attempted it seriously. Domestic regulatory pathways also differ enough to require genuine local capability rather than export selling.
Market Impact: Raises suite utilisation roughly 15

Win programmes on analytical depth, not batch pricing

Regulators now expect capsid ratio, impurity and potency characterisation controlled rather than reported, and sponsors discovering that late face delay measured in quarters. Providers leading with analytical capability report programme win rates roughly 50% above those leading with manufacturing capacity and price. It requires investment in scientists and instrumentation that shows as cost long before it shows as revenue, and it wins the programmes that manufacturing discounting never reaches at all. Sponsor process development functions rather than procurement now make the initial selection, and procurement negotiates whatever they have already chosen.
Market Impact: Lifts programme win rates roughly 5

Who Controls the Margin Pool

Five providers deliver 41% of manufacturing batch slots, the basis on which MMA assesses every participant here, and that fragmentation reflects how many entrants built capacity simultaneously. Thermo Fisher Scientific leads on combined manufacturing and analytical breadth. Lonza holds the deepest process development capability, built through decades of biologics work before viral vectors became a category at all.
Competitive activity runs along three lines. Analytical capability is the primary contest, because it constrains timelines and manufacturing capacity no longer does. Suite consolidation and conversion is being pursued quietly by everybody carrying overhang. And regional pipeline access is being built by providers who recognise that Western sponsor demand alone will not fill what was constructed.

Pressure arrives from two directions. Sponsors with approved products insource manufacture once volumes justify it, which removes the best customers precisely when they become valuable. Meanwhile Chinese and Korean providers serve domestic pipelines at contract rates Western cost structures cannot match. Rankings shift toward providers holding genuine analytical depth and regional access, because manufacturing capacity alone has stopped being scarce and stopped commanding a premium anywhere. Technology transfer friction is what keeps any of the existing programmes in place.
viral-vector-development-market-company-positioning-matrix-1787309975440

Competitive Moat and Risk Dimensions

THERMO FISHER SCIENTIFIC

Moat: Manufacturing and analytical breadth together

The company combines vector manufacturing capacity with analytical instrumentation, reagents and testing services, which lets it serve the constraint that now holds programmes up rather than the one that no longer does. Sponsors value a single accountable provider across development, manufacture and release. Its instrumentation business also gives visibility into analytical method development pure service providers reach later.
THERMO FISHER SCIENTIFIC

Risk: Heavy capacity expansion exposure

The company expanded viral vector capacity substantially against pipeline projections that did not materialise, and carries fixed cost against utilisation near 52% alongside everybody else. Analytical growth offsets that partially rather than fully. Sponsors insourcing at commercial scale also remove the largest and most predictable volumes from exactly the suites the expansion was built to fill.
LONZA

Moat: Process development depth and record

The company brought decades of biologics process development discipline into viral vectors, which shows in comparability packages, scale-up predictability and regulatory documentation that newer entrants assemble far less convincingly. Sponsors facing a technology transfer weigh that record heavily. Its global site network also lets it place programmes where capacity and jurisdiction suit a sponsor.
LONZA

Risk: Western cost structure against Asia

Regional providers in China, Korea and India serve domestic pipelines at contract rates a Swiss-headquartered cost structure cannot approach, and those pipelines are the fastest growing part of the market. Establishing regional presence at regional pricing is difficult without undermining existing rates. Suite overhang across its Western footprint compounds the pressure while that question stays unresolved.

Players Tracked

Prominent Players

Thermo Fisher Scientific
Lonza
Catalent
Charles River Laboratories
WuXi Advanced Therapies

Other Key Players

Merck KGaA
Samsung Biologics
Fujifilm Diosynth Biotechnologies
Oxford Biomedica
Aldevron
Andelyn Biosciences
Forge Biologics
Vigene Biosciences
Batavia Biosciences
ProBioGen
Cytiva
Sartorius
Genezen
Vibalogics
Yposkesi

Recent Developments

MARCH 2025

Lonza consolidated viral vector manufacturing into fewer suites

The company combined vector capacity across its network and converted part of the released space to analytical and process development use, citing utilisation well below the levels the original expansion assumed. It was an internal restructuring and capital reallocation decision rather than any acquisition or partnership arrangement whatsoever.
Signal: Converting manufacturing space into analyt
SEPTEMBER 2025

Thermo Fisher expanded viral vector analytical characterisation capability

The company added capsid ratio, potency and impurity characterisation capacity across several sites, addressing the constraint that now holds regulatory submissions up more often than manufacturing capacity does anywhere. It was an organic capability expansion rather than an acquisition, joint venture or partnership arrangement whatsoever.
Signal: Expanding analytics while the suites sit i
JANUARY 2026

Charles River acquired a gene therapy analytical testing specialist

The acquisition brings capsid characterisation and potency assay capability that would take years to build internally, at a point when analytical demand is growing far faster than manufacturing demand is. Terms were not disclosed. It was an outright acquisition rather than a licensing or service arrangement.
Signal: Analytical specialists are now being bough

Plasmid, Consumables And Scientists

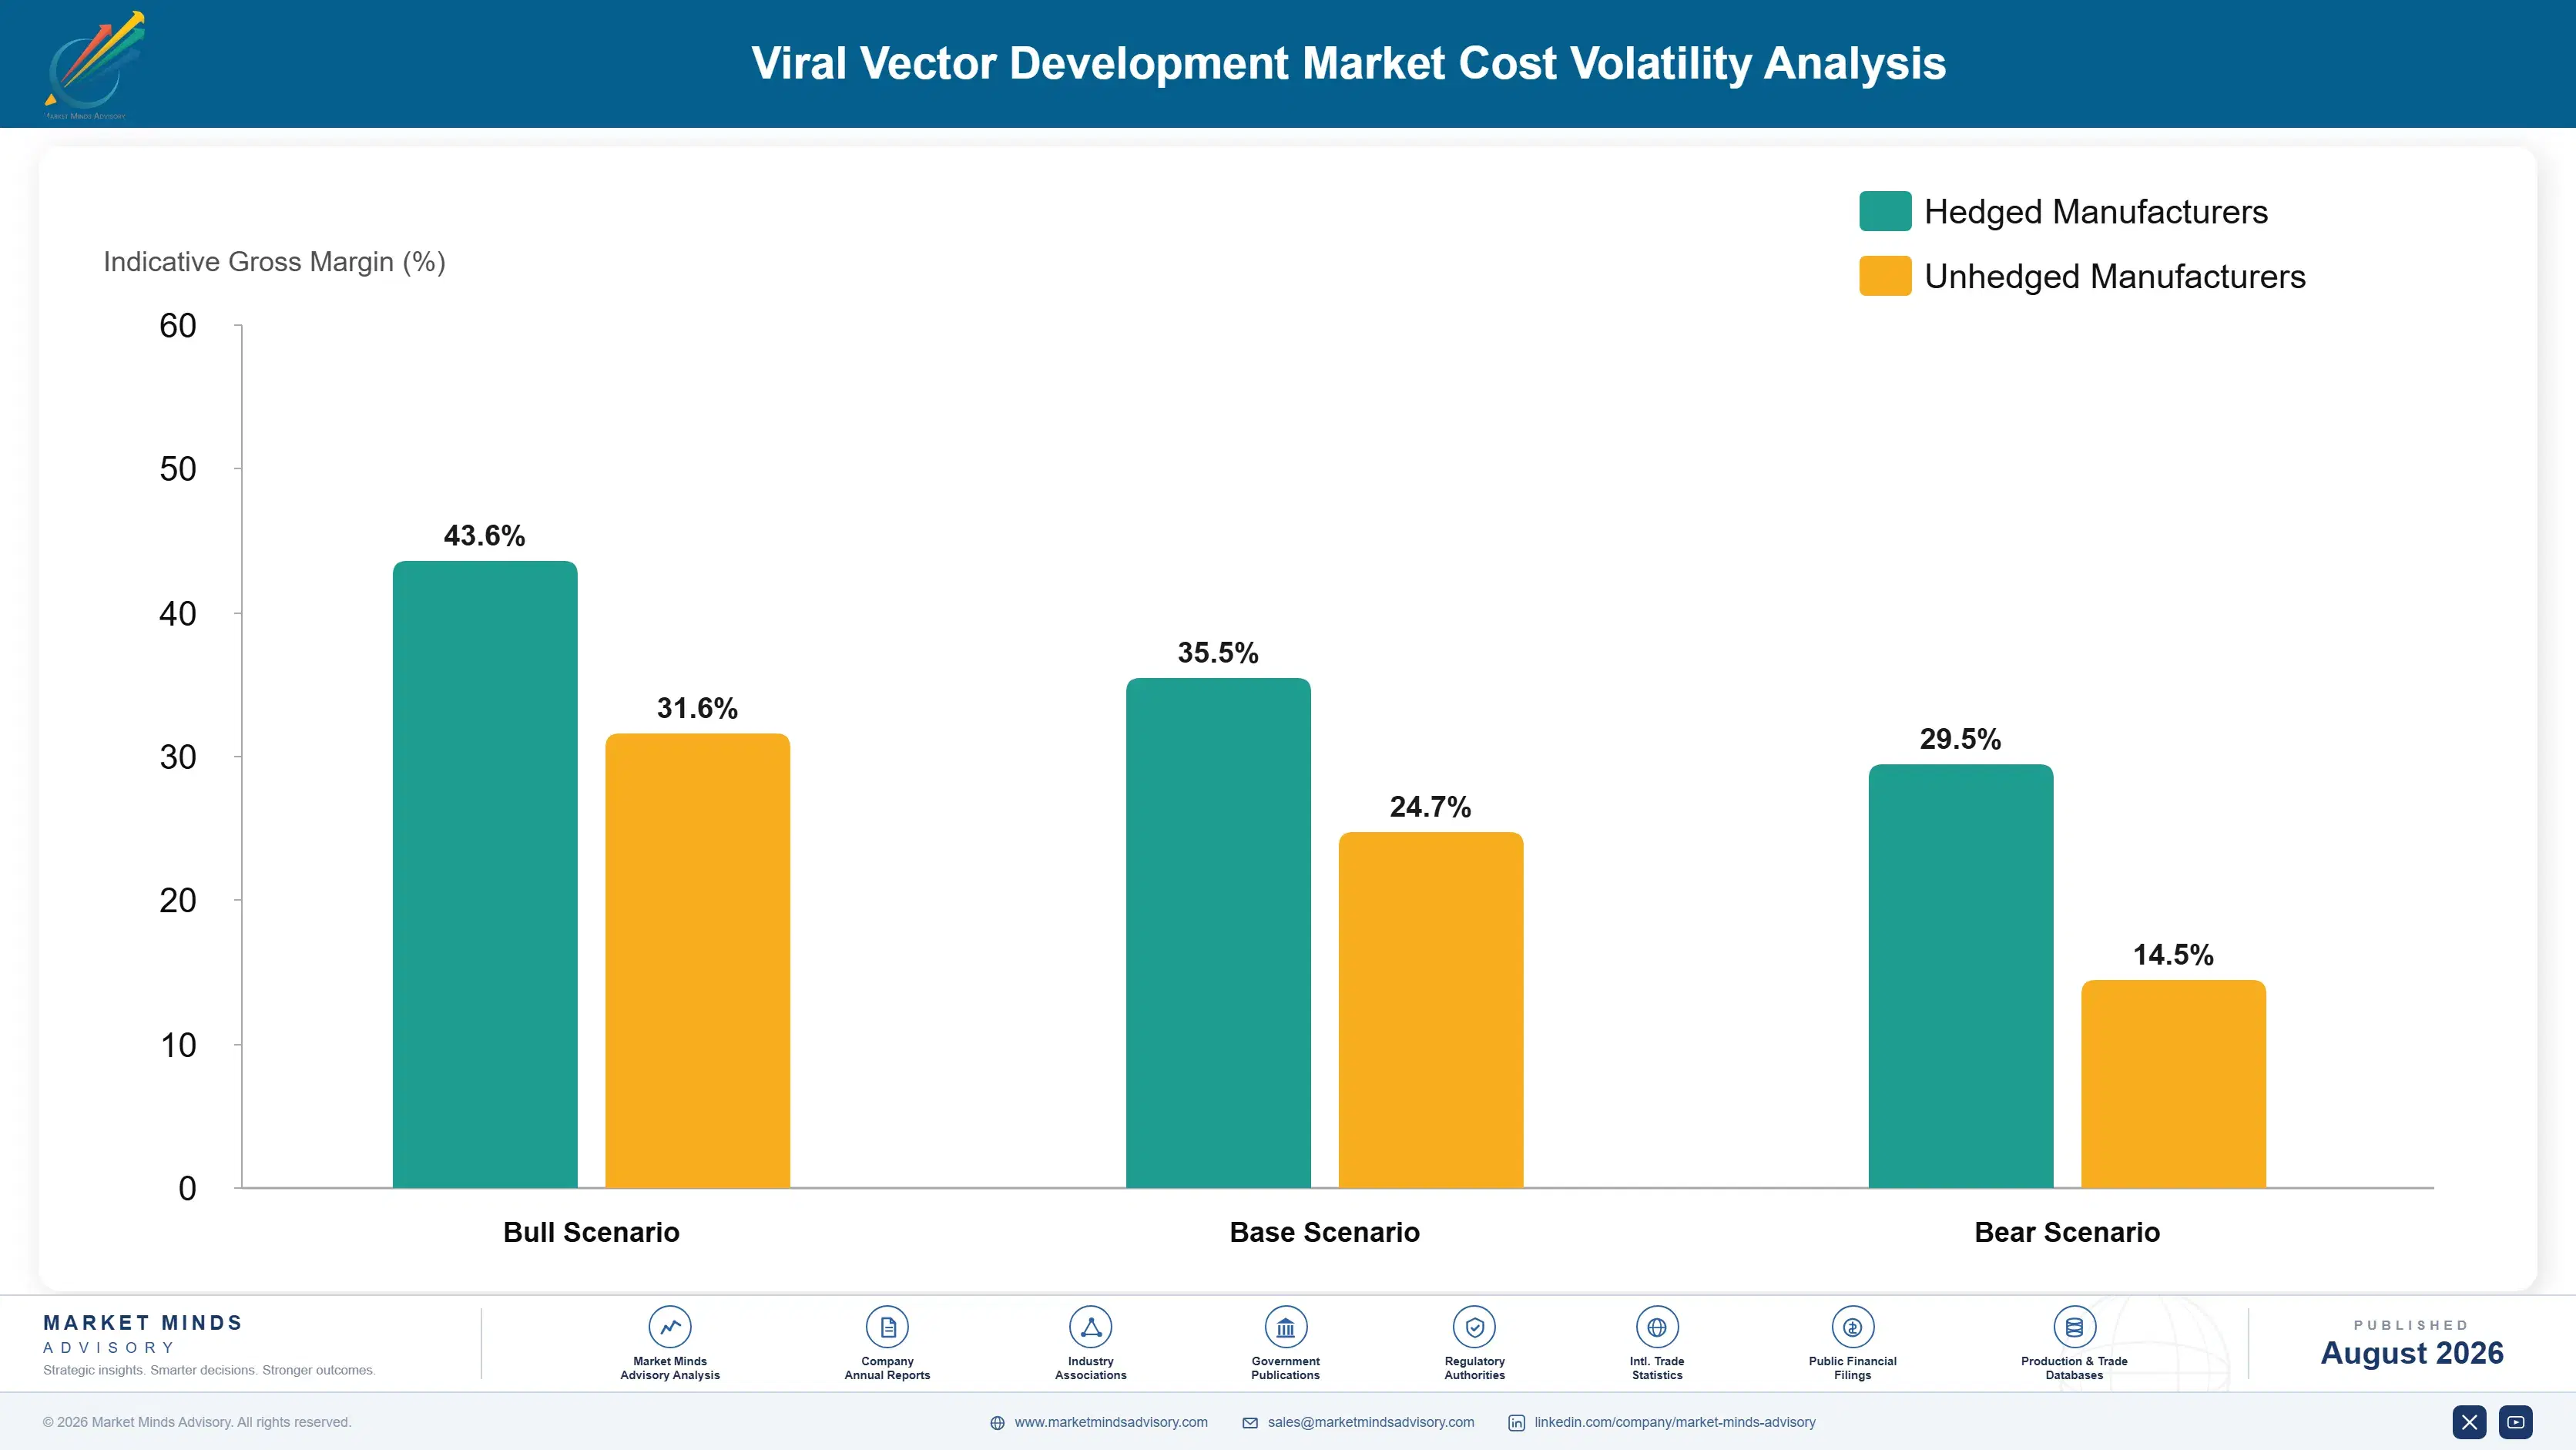
Cost structure here is dominated by things that are scarce rather than expensive in principle. Skilled scientific and manufacturing staff are roughly 38% of delivered cost, and qualified people rather than floor space constrain capacity. Plasmid DNA and cell culture media contribute 21%, with plasmid lead times measured in months. Single-use bags, filters and chromatography resins add 24%, with cleanroom operating cost making the balance.
Two input movements hit the industry within three years. Single-use bags, filters and tubing ran into severe allocation across 2021 and 2022 as biologics and vaccine demand consumed supplier capacity, and gene therapy programmes were served last. US Bureau of Labor Statistics data recorded sharp increases in scientific and technical labour costs across the same window. Several providers disclosed elevated staffing and consumable costs for those years.

Exposure varies by contract structure and staffing model, and the mechanism is fixed programme pricing against rising staff cost. Providers on multi-year fixed-price programme contracts absorbed the whole movement without recourse. Those pricing per batch with pass-through clauses recovered considerably more. Asian providers with lower scientific labour cost were better placed on the largest cost line, which is part of why regional pricing stays low.
viral-vector-development-market-cost-volatility-analysis-1787309975635

Contract single-use consumable supply on committed volumes

Bioreactor bags, filters and tubing sets ran into severe allocation across 2021 and 2022, and gene therapy programmes were served after far larger biologics accounts because nobody had committed volumes. Multi-year commitments cost a premium and secure the consumables a batch cannot run without. Qualifying an alternative bag or filter requires extractables work taking quarters to complete.

Price programmes with staff cost pass-through clauses

Skilled staff are 38% of delivered cost and multi-year fixed-price programme contracts transferred the entire 2021 and 2022 wage movement onto providers with no recourse at all. Pass-through clauses tied to published labour benchmarks share that exposure, and sponsors accept them more readily than providers expect. Those who priced firm absorbed it entirely as margin compression.

Build scientific capacity where the people actually are

Qualified process and analytical scientists rather than suite space constrain what any provider can deliver, and recruiting them into over-built Western clusters means competing against everybody else who expanded at the same time. Establishing capability in Indian and Eastern European scientific centres reaches people at lower cost. Regulatory and client acceptance takes time and is no longer in serious question.

Portfolio Architecture for Margin Defence

Portfolio economics separate on whether capacity is scarce. Adherent manufacture and general vector production earn gross margin in the low twenties, because suites sit at 52% utilisation and providers discount against each other to fill them. Suspension process development earns considerably more, since yield and scalability differences are demonstrable and sponsors pay for them. Analytical characterisation earns most, because capability is genuinely scarce, demand grows at 17.1% and nobody bui
The tension is that the scarce capability sits in people and the abundant one sits in buildings, and buildings were what everybody financed. Converting suite space addresses that, and needs analytical scientists who are equally scarce and harder to recruit than construction was to commission. Providers who expanded manufacturing hardest face the worst version, since fixed cost is highest and analytical position weakest.

High-value pools concentrate in three places: analytical characterisation where regulatory expectation keeps tightening, suspension process development taken on at programme start before comparability locks a sponsor in, and regional pipeline access in markets Western providers never served. None is large against total installed capacity. Each is defended by scientific capability, timing or local presence rather than suite availability, which stopped being scarce.

Volume / Commodity-Adjacent Tier

Adherent adeno-associated virus manufacture, adenoviral production and general vector batch work sold against available suite capacity. Utilisation near half means providers discount against each other for whatever programmes actually exist to be won.
Gross Margin: 18-28%

Premium / Certified Tier

Suspension process development, lentiviral manufacture and plasmid supply with qualified comparability packages. Demonstrable yield and regulatory documentation defend pricing. The ten-point range reflects the gap between early-stage and qualified commercial programme economics.
Gross Margin: 36-46%

Sustainability / Regulatory / Next-Generation Tier

Analytical characterisation, capsid ratio determination, potency assay development and release testing. Genuine capability scarcity and tightening regulatory expectation defend pricing entirely. The twelve-point range reflects routine release against method development work.
Gross Margin: 52-64%
viral-vector-development-market-portfolio-architecture-1787309976137

High-value Sub-segments and Strategic Watch-out

Analytical characterisation capability

Where regulatory expectation keeps tightening and capability is genuinely scarce because nobody built for it. Specialists are being acquired rather than competed with. Suite conversion is the sensible response to overhang. Analytical scientists rather than capital limit how fast any of that can actually happen.
Gross Margin: 54-64%

Programme-start suspension development

Won at programme start or effectively never, because comparability work after clinical material exists is something sponsors will not contemplate. Yield arithmetic makes the case easily. Timing rather than capability decides these. A provider not chosen at the start reaches nothing at all later on, whatever it offers.
Gross Margin: 38-46%

General manufacturing suite capacity

Utilisation near half with providers discounting against each other for the programmes that actually exist rather than the projected ones. Fixed cost per batch rises as utilisation falls. Consolidation is the only real answer. Discounting into an over-supplied market fills very little and costs a great deal.
Gross Margin: 18-28%

Regional pipeline access positions

Chinese, Korean, Indian and Japanese programmes contracting domestically at rates Western cost structures cannot reach at all. It is the fastest growing part of the market. Almost no Western provider is present. Local capability rather than export selling is what entering this segment actually requires.
Gross Margin: 30-42%

How Programme Demand Actually Commits

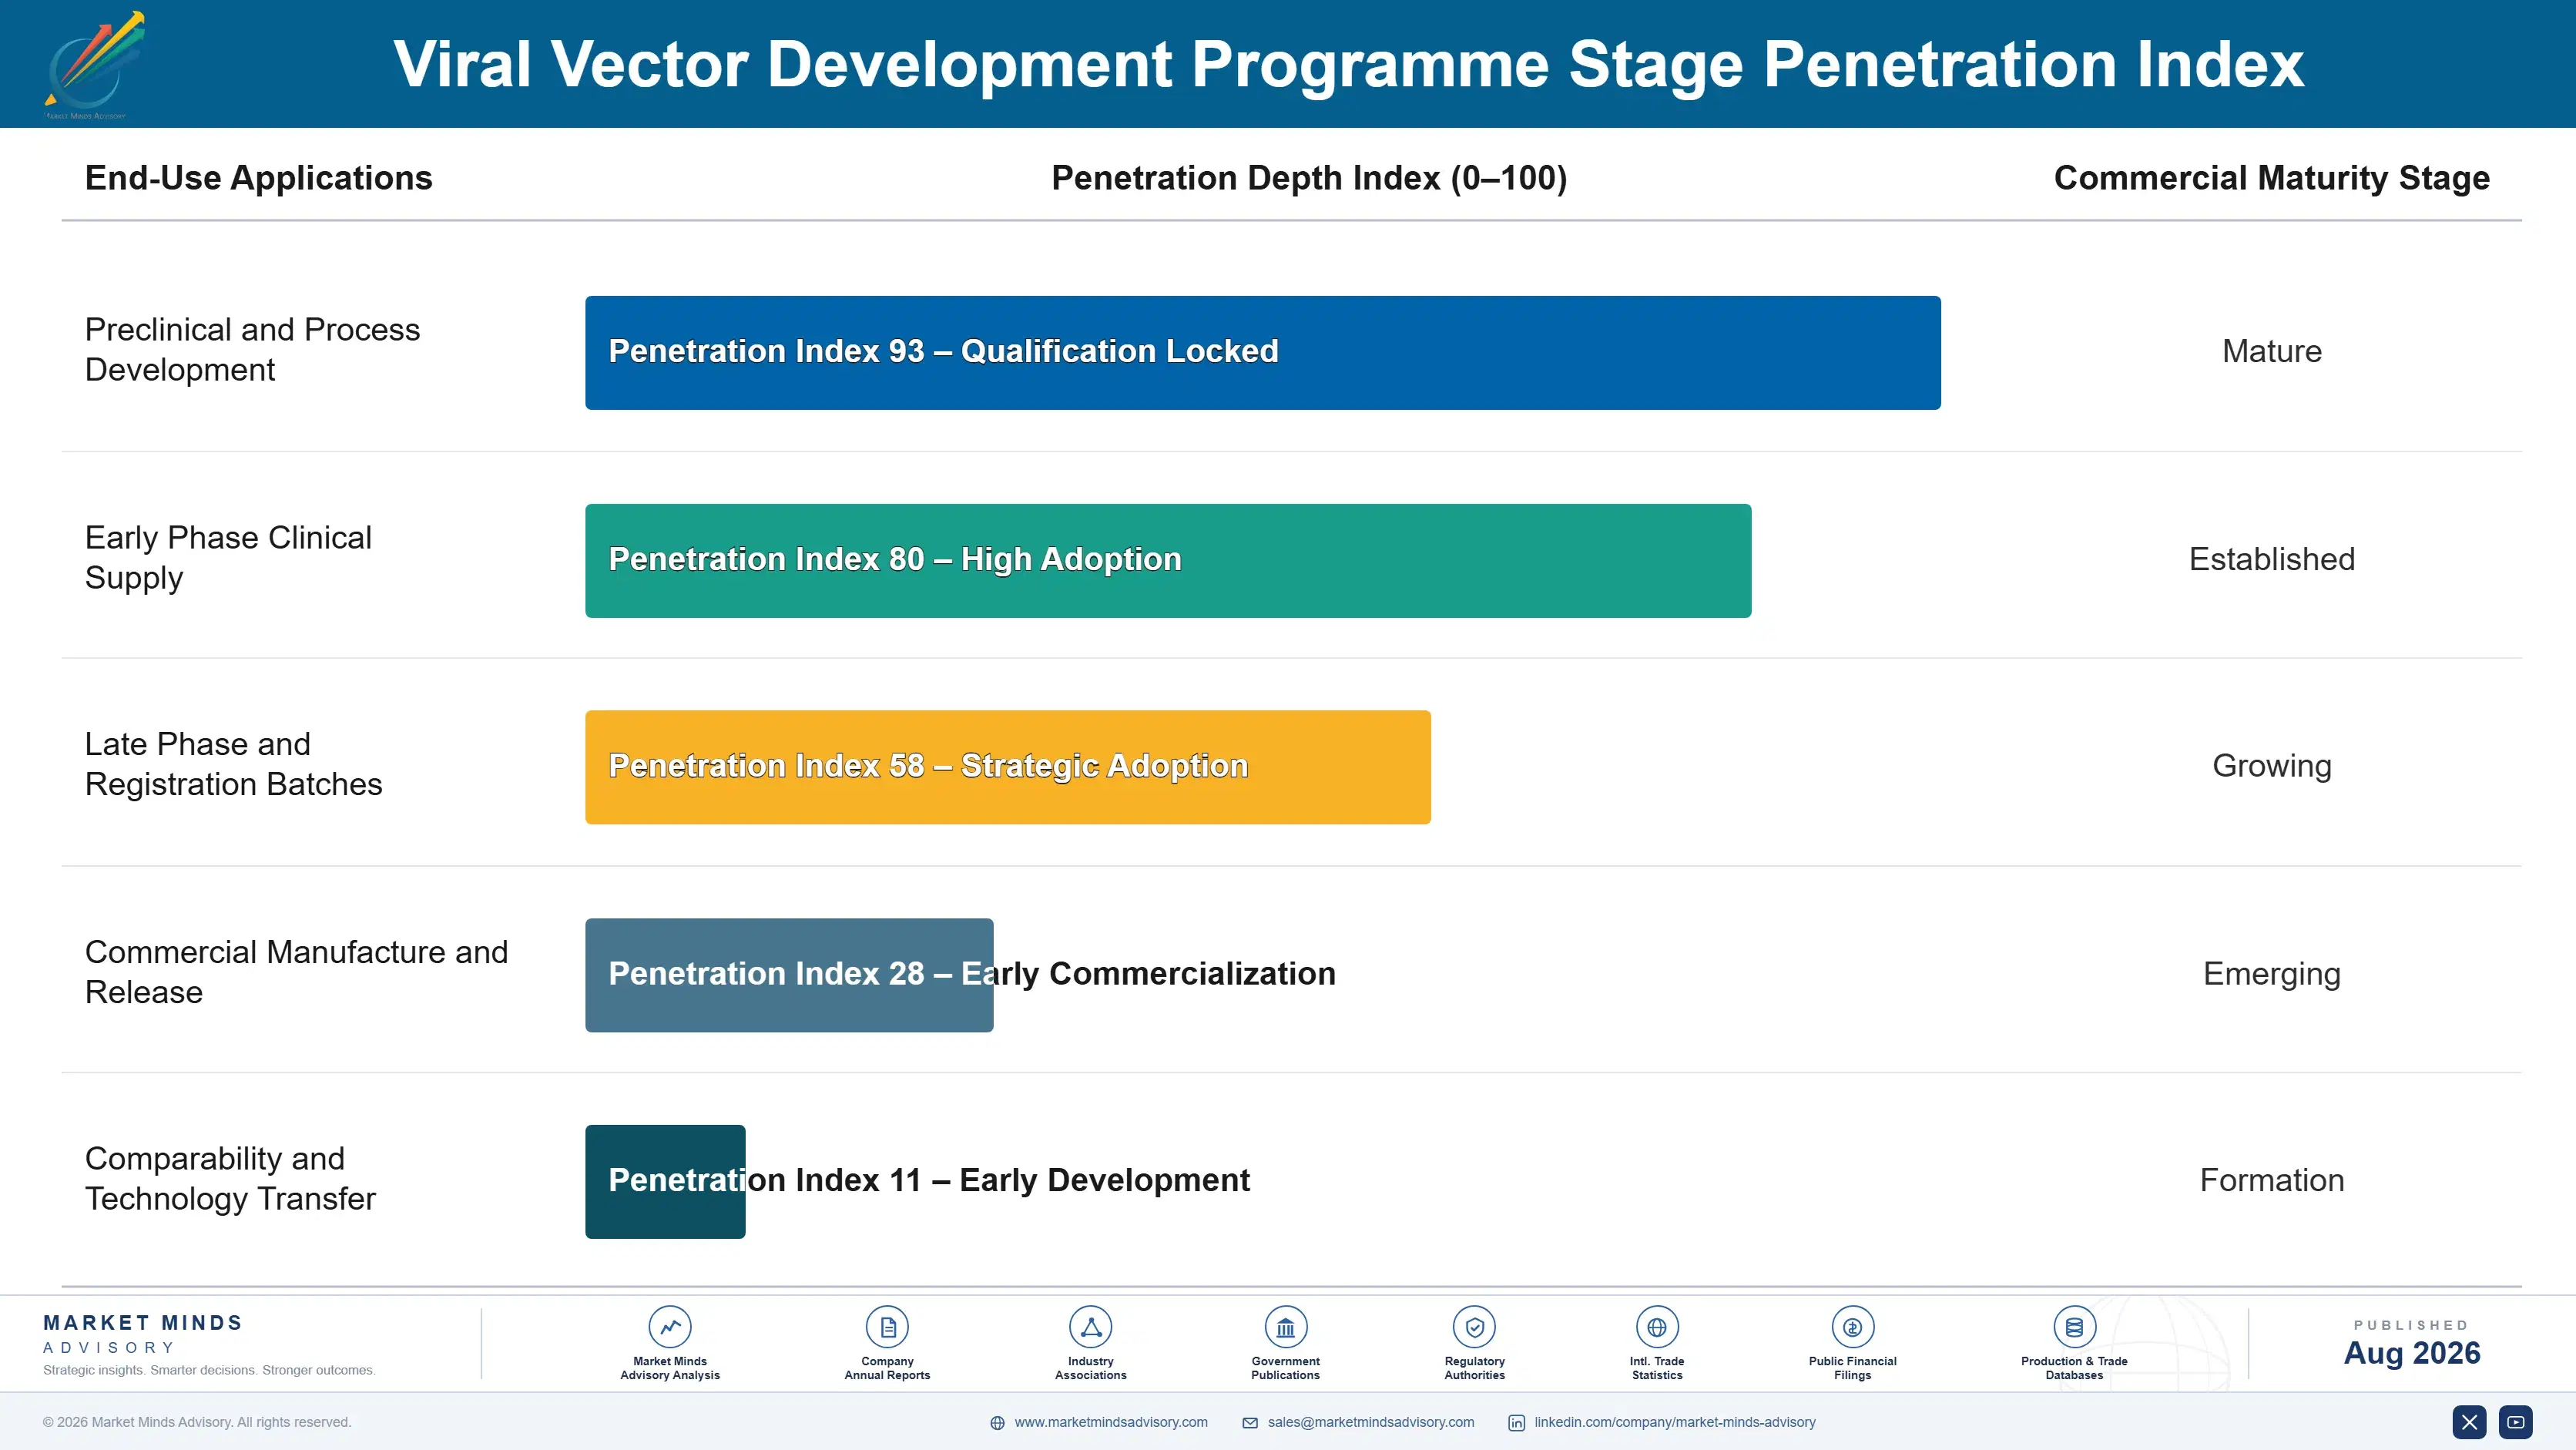
Demand here commits early and then persists, which is what makes the utilisation problem so painful. A sponsor qualifies a process at a provider during development, and moving it afterwards costs roughly 14 months of technology transfer plus comparability risk that could jeopardise a clinical timeline. That means a provider winning a programme at preclinical stage holds it through clinical development and frequently to approval, and a provider not chosen then reaches nothing later regardless of
Adoption depth varies sharply by programme stage and sponsor type. Small biotechnology sponsors contract everything because they own no capacity and never will. Mid-sized sponsors contract manufacture and increasingly build analytical capability in-house. Large pharmaceutical sponsors with approved products insource manufacture once volumes justify the fixed cost, which removes the most valuable programmes at their most valuable point. Academic and hospital units manufacture their own early-phase material and rarely contract anything at all.

Buyer profiles have shifted toward technical evaluation and away from commercial negotiation. Programme placement was once decided substantially on capacity availability and price. Now a sponsor's process development and quality functions assess analytical depth and regulatory record first, and procurement negotiates whatever they have already chosen.
viral-vector-development-market-end-use-penetration-index-1787309976624

What We Would Do Here

These are among the four positions where our research anticipates prominent divergence between winners and laggards over the coming forecast period. Each is grounded in the demand model, the regulatory perimeter, and the announced capacity pipeline.
01 / SUITE CONVERSION PRIORITY

Turn empty manufacturing space into analytical capacity

Analytical characterisation consumes 27% of programme spend, compounds at 17.1% and now constrains submission timelines, while manufacturing suites sit at 52% utilisation carrying their full fixed cost regardless. Providers converting suite space to analytical capability report facility contribution roughly 45% above what simply leaving it idle produces. Conversion costs real capital and needs analytical scientists who are scarce and expensive to recruit, and it is considerably better than discounting manufacturing slots into a market that already has far too many of them.
02 / TRANSFER FRICTION HONESTY

Tell sponsors the decision is hard to reverse

Moving a qualified process between manufacturing sites takes roughly 14 months and carries comparability risk that sponsors genuinely fear disrupting a clinical timeline. Providers presenting that lock-in honestly, as a reason to choose carefully rather than quickly, report programme retention roughly 60% above competitors competing on batch price alone. It requires the confidence to tell a sponsor that the commitment is difficult to unwind, which commercial teams instinctively avoid saying out loud and which sponsors respect when they hear it.
03 / REGIONAL PIPELINE ACCESS

Follow the programmes Western providers never served

Chinese, Korean, Indian and Japanese gene therapy programmes develop against domestic regulatory pathways and contract regionally, and Western providers carrying suite overhang are almost entirely absent from what is now the fastest growing part of this whole market. Providers establishing genuine regional presence report utilisation roughly 15 points above competitors serving Western sponsors alone. It requires local capability and pricing at regional contract rates that Western cost structures struggle to reach, which is precisely why so few have seriously attempted it so far.
04 / ANALYTICAL-LED COMMERCIAL SELLING

Lead with capsid data, never with suite availability

Regulators now expect capsid ratio, impurity profile and potency characterised and controlled rather than merely reported once, and sponsors who discover that late face delay measured in quarters rather than weeks. Providers leading commercially with analytical capability report programme win rates roughly 50% above those leading with manufacturing capacity and batch price. It requires investment in scientists and instrumentation that shows as cost long before it shows as revenue, and it reaches programmes that manufacturing discounting never touches at all.

Engagement Snapshot From the Field

A live engagement with an industry participant carrying material or product regulatory and market exposure ahead of a defining policy shift, showing how our research translates into a defensible multi-year portfolio strategy.
MARKET MINDS ADVISORY · CLIENT ENGAGEMENT SUMMARY
Viral Vector Development Producer Strategic Portfolio Review and Transition Roadmap 2026·Investment Scenario on Viral Vector Development Exposure Evaluation 2025-26
CLIENT PROFILE
A contract viral vector manufacturer with revenue near USD 210 million annually (client-reported, unverified by MMA), suite capacity expanded threefold between 2020 and 2022, analytical capability limited to routine release testing, no presence in Asian markets, and a commercial organisation selling on capacity availability and batch price. Roughly 88% of revenue came from Western sponsors and suites ran below half utilisation.
STRATEGIC CHALLENGE
Utilisation had not recovered since 2022 and management proposed aggressive batch price reductions to fill suites, accepting margin compression to absorb fixed cost. The board doubted that discounting into an over-supplied market would fill anything, and nobody had modelled what the capacity would actually earn under any of the alternative uses available.
MMA APPROACH
MMA modelled contribution across four uses for each of the client's suites: discounted manufacturing, analytical conversion, process development capacity and closure. Forty-seven expert interviews with sponsor process development leads, quality functions, regulatory consultants and analytical specialists established where demand genuinely sat and what genuinely constrained programme timelines in practice across the industry.
KEY FINDINGS
  1. Discounted manufacturing at achievable prices delivered contribution below analytical conversion at every suite modelled, and below closure economics at two of them entirely.
  2. Sponsor process development leads at eleven of fourteen companies interviewed named analytical capability rather than manufacturing capacity or price as their primary selection criterion.
  3. Every programme the client had lost in two years had been lost before pricing was discussed, on analytical depth or regulatory documentation rather than on commercial terms at all.
  4. No Asian sponsor had ever approached the client, and the client had never approached one, despite regional programmes growing considerably faster than Western ones.
CLIENT PROFILE
A contract viral vector manufacturer with revenue near USD 210 million annually (client-reported, unverified by MMA), suite capacity expanded threefold between 2020 and 2022, analytical capability limited to routine release testing, no presence in Asian markets, and a commercial organisation selling on capacity availability and batch price. Roughly 88% of revenue came from Western sponsors and suites ran below half utilisation.
STRATEGIC CHALLENGE
Utilisation had not recovered since 2022 and management proposed aggressive batch price reductions to fill suites, accepting margin compression to absorb fixed cost. The board doubted that discounting into an over-supplied market would fill anything, and nobody had modelled what the capacity would actually earn under any of the alternative uses available.
MMA APPROACH
MMA modelled contribution across four uses for each of the client's suites: discounted manufacturing, analytical conversion, process development capacity and closure. Forty-seven expert interviews with sponsor process development leads, quality functions, regulatory consultants and analytical specialists established where demand genuinely sat and what genuinely constrained programme timelines in practice across the industry.
KEY FINDINGS
  1. Discounted manufacturing at achievable prices delivered contribution below analytical conversion at every suite modelled, and below closure economics at two of them entirely.
  2. Sponsor process development leads at eleven of fourteen companies interviewed named analytical capability rather than manufacturing capacity or price as their primary selection criterion.
  3. Every programme the client had lost in two years had been lost before pricing was discussed, on analytical depth or regulatory documentation rather than on commercial terms at all.
  4. No Asian sponsor had ever approached the client, and the client had never approached one, despite regional programmes growing considerably faster than Western ones.
RECOMMENDED STRATEGY
Phase 1: Phase 1 (0 to 9 months): Abandon the batch price reduction, and begin converting two suites to analytical characterisation capacity immediately. Phase 2: Phase 2 (9 to 24 months): Recruit analytical scientists including an Indian development centre, and rebuild commercial selling around analytical depth. Phase 3: Phase 3 (24 to 42 months): Establish regional business development for Asian pipelines, and close the weakest suite rather than subsidising it.
OUTCOME
The price reduction was abandoned before implementation and utilisation stayed flat while margin held. Two suites converted to analytical capacity within five quarters and both filled ahead of the modelled schedule (client-reported, unverified by MMA). An Indian analytical development centre was established. Asian business development began in one market, and the weakest suite closure was approved and remains in progress.

Frequently Asked Questions

Foundational context covering the market sizes, CAGR, scope, country, region and competition that inform every finding below. This section is provided to cover basics and most often pre-purchase conversations, answered from the MMA Primary Research Dataset.

What is the current size of the Viral Vector Development Market?

MMA sizes the global viral vector development market at USD 6.8 billion in 2025, rising to USD 7.58 billion in 2026. That covers contract development, manufacturing and testing revenue plus captive in-house equivalent spend.

How large will the Viral Vector Development Market be by 2036?

MMA forecasts USD 22.31 billion by 2036, an expansion multiple of 2.94 times the 2026 base. That represents roughly USD 14.73 billion of incremental revenue across the forecast period.

What is the CAGR for the Viral Vector Development Market 2026 to 2036?

The base case compounds at 11.4% annually, with a bull case of 12.7% and a bear case of 10.1%. Whether late-stage programmes progress near original projections decides which case materialises.

Which segment is growing fastest?

Analytical characterisation and release testing compounds at 17.1%, exactly 1.50 times the market rate. Proving what fraction of particles carry the payload now holds submissions up more than manufacturing does.

Who are the major companies in the Viral Vector Development Market?

The top five providers deliver 41% of manufacturing batch slots, led by Thermo Fisher Scientific and Lonza. Twenty participants are profiled in full, spanning manufacturing, analytical and raw material suppliers.

Which country is growing fastest?

India compounds at 14.2%, ahead of every other national market MMA tracks here. Contract and academic capacity building against domestic cell and gene therapy programmes drives that growth.

Report Segmentation Architecture

The full report scope spans multiple orthogonal segmentation dimensions, with cross-tabulated demand data provided for each dimension pair. Coverage extends further to regional breakdowns, trend trajectories, and the competitive detail needed to support segment-level decision-making.

By Service and Technology Class

  • Analytical Characterisation and Release Testing
  • Suspension AAV Process Development
  • Lentiviral Vector Manufacture
  • Adherent AAV Manufacture
  • Plasmid and Raw Material Supply
  • Adenoviral and Other Vector Manufacture

By Programme Stage

  • Preclinical and Process Development
  • Early Phase Clinical Supply
  • Late Phase and Registration Batches
  • Commercial Manufacture and Release
  • Comparability and Technology Transfer

By Sponsor Type

  • Small Biotechnology Sponsors
  • Mid-Sized Specialty Developers
  • Large Pharmaceutical Sponsors
  • Academic and Hospital Manufacturing Units

By Region

  • North America
  • Western Europe
  • East Asia
  • South Asia and Pacific
  • Latin America
  • Middle East and Africa
  • Eastern Europe

Scope, Methodology, and Coverage

Every figure in this report is reproducible from documented input assumptions. The scope below maps the historical period, the forecast horizon, the segmentation dimensions, and the countries covered, alongside the underlying primary and qualitative methodology.
Historical Period
2020 to 2025
Forecast Period
2026 to 2036
Base Year
2025 (USD billions; MMA Primary Research Dataset, August 2026)
Market Definition
The market comprises development, manufacturing and analytical services for viral vectors used in gene and cell therapy, spanning analytical characterisation and release testing, suspension adeno-associated virus process development, lentiviral vector manufacture, adherent adeno-associated virus manufacture, plasmid and raw material supply, and adenoviral and other vector manufacture. Sizing captures contract development, manufacturing and testing revenue at realised contract value plus captive in-house equivalent spend. Non-viral delivery including lipid nanoparticles, messenger RNA manufacture, cell processing and expansion services, plasmid supply for non-vector applications, clinical trial services, and gene therapy product revenue are outside scope.
Quantitative Units
USD billions (current prices); manufacturing batch slots delivered annually; USD per commercial scale batch at realised contract value
Segmentation Dimensions
By Service and Technology Class; By Programme Stage; By Sponsor Type; By Region
Regions Covered
North America, Western Europe, East Asia, South Asia and Pacific, Latin America, Middle East and Africa, Eastern Europe
Countries Covered
USA, Canada, UK, Switzerland, Germany, Netherlands, Belgium, France, Ireland, Denmark, Sweden, Spain, Italy, China, Japan, South Korea, Singapore, India, Australia, Brazil, Mexico, Argentina, Israel, UAE, Saudi Arabia, Turkey, South Africa, Poland, Czech Republic, Hungary, and additional markets relevant to this sector
Key Companies Profiled
Thermo Fisher Scientific, Lonza, Catalent, Charles River Laboratories, WuXi Advanced Therapies, Merck KGaA, Samsung Biologics, Fujifilm Diosynth Biotechnologies, Oxford Biomedica, Aldevron, Andelyn Biosciences, Forge Biologics, Vigene Biosciences, Batavia Biosciences, ProBioGen, Cytiva, Sartorius, Genezen, Vibalogics, Yposkesi.
Quantitative Methodology
Primary survey, n=3,800 respondents, Q4 2025, six countries; demand-side model with trade association cross-validation
Qualitative Methodology
47 expert interviews, Q4 2025; applied to validate demand model assumptions, identify emerging dynamics, and assess competitive positioning
Report Format
PDF and XLSX data workbook (Word format preview document)
Publisher
Market Minds Advisory
Report Code
MMA-2026-HLT-368
Published
August 2026
Contact
sales@marketmindsadvisory.com | www.marketmindsadvisory.com

Purchase the full Viral Vector Development Market Report (2026 to 2036).

The full report sizes the viral vector development market across six service and technology classes, five programme stages, four sponsor types and seven regions, with annual forecasts to 2036 in revenue and batch slots delivered. It models suite contribution across discounted manufacturing, analytical conversion, process development and closure, which is the analysis that establishes what over-built capacity is actually worth under each realistic use. Twenty participants are assessed on a consistent batch slots basis, with analytical capability depth and regional pipeline access mapped separately. Utilisation is quantified provider by provider, and technology transfer duration is benchmarked across sites.
Six service and technology classes sized and forecast annually
Suite contribution modelled across four alternative capacity uses
Twenty participants on consistent batch slots delivered basis
Analytical capability depth mapped provider by provider
Regional pipeline access compared across every participant
Utilisation and transfer duration benchmarked site by site

Built For The People Who Decide

From boardroom strategy to bench-side execution, this report is read cover-to-cover by leaders shaping the next decade of their industry, turning demand scenarios, market dynamics and valuation benchmarks into decisions.
CXOs/ Presidents/ VPs/ Managers
M&A and Corporate Development
Strategy Teams and R&D Heads
Procurement and Product Directors
Regulatory and Compliance Leaders
Investor Relations and Equity Analysts