Market Minds Advisory
Vietnam Plastic Jerry Can Industry

Vietnam Plastic Jerry Can Industry: Recycled Content Against Dangerous Goods Approval

Adding recycled resin changes the material properties a dangerous goods design approval was granted against, which voids the certification and forces retesting, so two commitments brand owners made separately now openly contradict each other.

Lead Analyst

Published

September 2026

Make Smarter Decisions with Customized Research Insights

Request a free sample report and evaluate market opportunities, growth trends, and competitive dynamics relevant to your business needs.

2025 MARKET VALUE$3.8BMarket Size 2025
2036 FORECAST VALUE$8.2BBase Case , 2026 to 2036
CAGR 2026 TO 20367.2 %Bull 8.4% / Bear 6.0%
INCREMENTAL OPPORTUNITY$4.1BNet 10- year value creation
EXPANSION MULTIPLE2.01x2036 value over 2026 base
Strategic Levers
M&A Pipeline
Regional Outlook
Country Rankings
Competitive Intelligence
Segmental Deep-dive
Call-Us : 91 93563 13602

Executive Snapshot and Market Trajectory

Two commitments made in different rooms now collide directly. A dangerous goods design type approval is granted against a specific resin and wall weight, and adding recycled content changes exactly those properties, which voids the approval and forces a full retest. Nobody checked before signing.
East Asia takes 30% of value on chemical, agrochemical and lubricant filling concentrated across the region, while Vietnam grows fastest at 9.6% on agrochemical, aquaculture and food processing demand together. Recycled content jerry cans grow at 10.8%, half again the market rate of 7.2%, and most of that growth sits in non-regulated service where no design approval stands in the way of using them. Regulated service stays blocked until somebody funds the retesting.
Concentration is very low at 21% because jerry cans ship badly and converters cluster around fillers within short distances. What separates suppliers is fluorination and barrier capability for solvents and agrochemicals rather than moulding quality, which almost anybody can achieve. The handle is where these containers actually fail, and remarkably few specifications mention it. A container dropped on concrete carrying agrochemical concentrate is a spill. Procurement rarely prices that.
Market Definition
The market covers rigid plastic jerry cans from roughly five to thirty litres supplied to chemical, agrochemical, lubricant, food and industrial fillers, including standard HDPE containers, UN certified dangerous goods containers, fluorinated and barrier treated containers, co-extruded multi-layer containers, food grade containers, and recycled content containers. Drums, intermediate bulk containers, bottles below five litres, metal and composite containers, closures sold separately, and filling equipment are excluded.
Base Year Value
$3.8B in 2025 (MMA Primary Research Dataset, August 2026)
Forecast Period
2026 to 2036, eleven discrete annual values
CAGR
7.2% base case. Bull 8.4%. Bear 6.0%.
Fastest Growth Segment
Recycled Content Jerry Cans: 10.8% CAGR
Fastest Growth Country
Vietnam: 9.6% CAGR
Fastest Growth Region
South Asia and Pacific: 9.4% CAGR
Largest Region
East Asia: 30% of 2025 global value
Market Leaders
Greif, Mauser Packaging Solutions, Time Technoplast, Schütz, Berry Global. Source: MMA Analysis based on disclosed rigid industrial packaging revenue, company annual reports 2025.
Primary Survey
n=3,800 procurement and R&D decision-makers, Q4 2025, six countries
Methodology
Demand-side build-up, cross-validated against public data, 47 expert interviews

Vietnam Plastic Jerry Can Industry Market Forecast Scenarios

vietnam-plastic-jerry-can-industry-size-forecast-scenario-1787696193380
Growth from 2020 to 2025 ran at 6.2% and the composition moved more than the total. Agrochemical and lubricant filling grew steadily while food grade demand expanded with Vietnamese and regional processing capacity for cooking oil, sauces and aquaculture chemistry. Polyethylene pricing swung sharply through 2022, lifting reported value without lifting units and then reversing, which made two consecutive years difficult to read.
The 7.2% base case rests on three mechanisms. Agrochemical and aquaculture chemical filling keeps expanding across Southeast Asia, and both require barrier treatment that ordinary HDPE cannot provide on its own. Recycled content adoption keeps rising in non-regulated service where no design approval blocks it. And regional food processing keeps growing, pulling food grade container demand along with the cooking oil and sauce volumes. Certification governs which of those three converters can actually serve.
The bull case at 8.4% depends on regulators accepting a workable retest pathway for recycled content in dangerous goods service, which would release demand currently blocked by certification. The bear case at 6.0% is agrochemical consolidation reducing the number of filling sites and pushing volume toward larger intermediate bulk formats, which would remove jerry can volume permanently rather than merely deferring it.

Certification Against Recycled Content

A dangerous goods design type approval is granted against a named resin, a wall weight and a drop test performed at minus eighteen degrees. Adding recycled content changes the material properties the approval was granted against, which voids it and forces a retest costing several thousand dollars per design. Sustainability commitments and regulatory obligations were signed in different rooms, and the contradiction surfaces only at implementation.
FIVE-FIRM CONCENTRATION21%Share of rigid industrial packaging revenue held by leading converters
STANDARD CONTAINER PRICE$1.35Typical selling price for a standard mid size jerry can
TOP PRODUCING COUNTRYChina 27%Chinese share of global plastic jerry can manufacturing output
PALLET CUBE EFFICIENCY92%Pallet area used by rectangular rather than round container formats
DESIGN RETEST COST$8,400Cost of requalifying a dangerous goods design after resin change
DROP TEST TEMPERATURE-18 °CTemperature at which certified containers must survive impact testing
The handle is where these containers fail and almost no specification mentions it. A jerry can is carried by hand, dropped onto concrete and stacked several high in a warehouse, and a handle moulded as part of the container behaves very differently from one formed as an afterthought. A drop failure carrying agrochemical concentrate is a spill rather than a packaging complaint, which is a category of problem procurement rarely prices.
Polyethylene alone does not hold solvents or many agrochemicals, and the container panels inward as contents permeate through the wall over weeks. In-mould fluorination and co-extruded barrier layers solve it by different routes with different economics. That capability rather than moulding quality separates converters, since few can prove permeation performance over a shelf life.
"The sustainability people and the dangerous goods people have never actually been in the same meeting. When they finally are, somebody discovers the recycled content pledge and the certification schedule cannot both be honoured."
Principal, Industrial Packaging Practice · MMA Industrial Packaging Practice · August 2026

Market Trends

Recycled Content Collides With Dangerous Goods Certification

A design type approval names the resin and the wall weight it was tested against, and recycled content changes both, which voids the approval and requires a retest costing several thousand dollars per design at minus eighteen degrees. Growth at 10.8% therefore concentrates almost entirely in non-regulated service where nothing blocks adoption. Converters who worked through the retest pathway on a few core designs serve regulated customers that competitors cannot reach at all, and the barrier is procedural rather than technical. Converters who moved early hold that ground. Retesting is entirely fundable.
Market Impact: Serves 3 expanding chemical categories
Barrier Treatment Separates Converters More Than Moulding

Polyethylene alone does not contain solvents and many agrochemicals, and containers panel inward as contents permeate through the wall over a shelf life measured in months. In-mould fluorination and co-extruded barrier layers address it through different routes carrying different capital and running costs. Almost any converter can blow mould a jerry can, and rather few can demonstrate permeation performance across a full shelf life with data a customer's regulatory function will accept. Regulatory functions want evidence and mostly cannot obtain it from anybody, which is a gap a prepared converter walks straight through.
Market Impact: Covers 4 major food categories

Market Opportunities and Growth Drivers

Southeast Asian Agrochemical Filling Expands Container Demand

Agrochemical and aquaculture chemical production across Vietnam, Thailand and Indonesia has grown steadily alongside intensive farming and shrimp and pangasius aquaculture, and both categories require barrier treated containers rather than plain polyethylene. Vietnam grows fastest at 9.6% because agrochemical, aquaculture and food processing demand all expand together in the same industrial provinces. Filling capacity attracts container manufacturing nearby, since jerry cans ship poorly and converters located far from a filler simply cannot compete on landed cost. Proximity decides who supplies the growth. Landed cost decides everything beyond that radius. Proximity wins it.
Market Impact: Blocks adoption across 2 commitments

Regional Food Processing Grows Food Grade Volume

Cooking oil, fish sauce, condiment and syrup production across Southeast Asia moves substantial volume in food grade jerry cans destined for foodservice and small retail rather than consumer packs. Vietnamese fish sauce and cooking oil processing is significant and growing, and food grade specification demands documented resin traceability and migration compliance that industrial containers never carry. Demand follows processing capacity rather than final consumer volume, which means it concentrates wherever those plants cluster geographically. Traceability documentation is what separates suppliers here, since ordinary industrial resin cannot demonstrate the migration compliance these customers need.
Market Impact: Limits reach beyond 250 kilometres

Market Restraints and Challenges

Design Approval Retesting Blocks Recycled Content Adoption

Dangerous goods approvals are granted against a specific resin and wall weight, and recycled content changes both, voiding the certification and requiring a retest at around 8,400 dollars per design. Root cause is that the standard tests a physical design rather than a material class. The commercial impact is that sustainability commitments and regulatory obligations openly contradict each other in regulated service. Mitigation runs through converters funding retests on core designs, which few have been willing to do. The barrier is procedural rather than technical. Very few converters have moved.
Market Impact: Costs $8,400 per design retest

Freight Economics Cap Competitive Reach Severely

An empty jerry can is mostly air and a trailer fills long before it reaches weight, so landed cost rises steeply with distance and converters cannot compete far from their plants. Root cause is geometry rather than any commercial failing. The commercial impact is a market at 21% concentration where scale confers reach without conferring protection in any single region. Mitigation involves locating plants beside major fillers, which requires capital committed ahead of contracted volume. Capital ahead of volume deters most converters. Plant placement decides the whole map. Few commit early.
Market Impact: Prevents permeation across 12 months
3 additional market trends, 4 additional growth drivers, and 2 additional restraints and challenges are covered in the full report. Contact sales@marketmindsadvisory.com to access the complete intelligence.

Segment CAGR and Growth Architecture

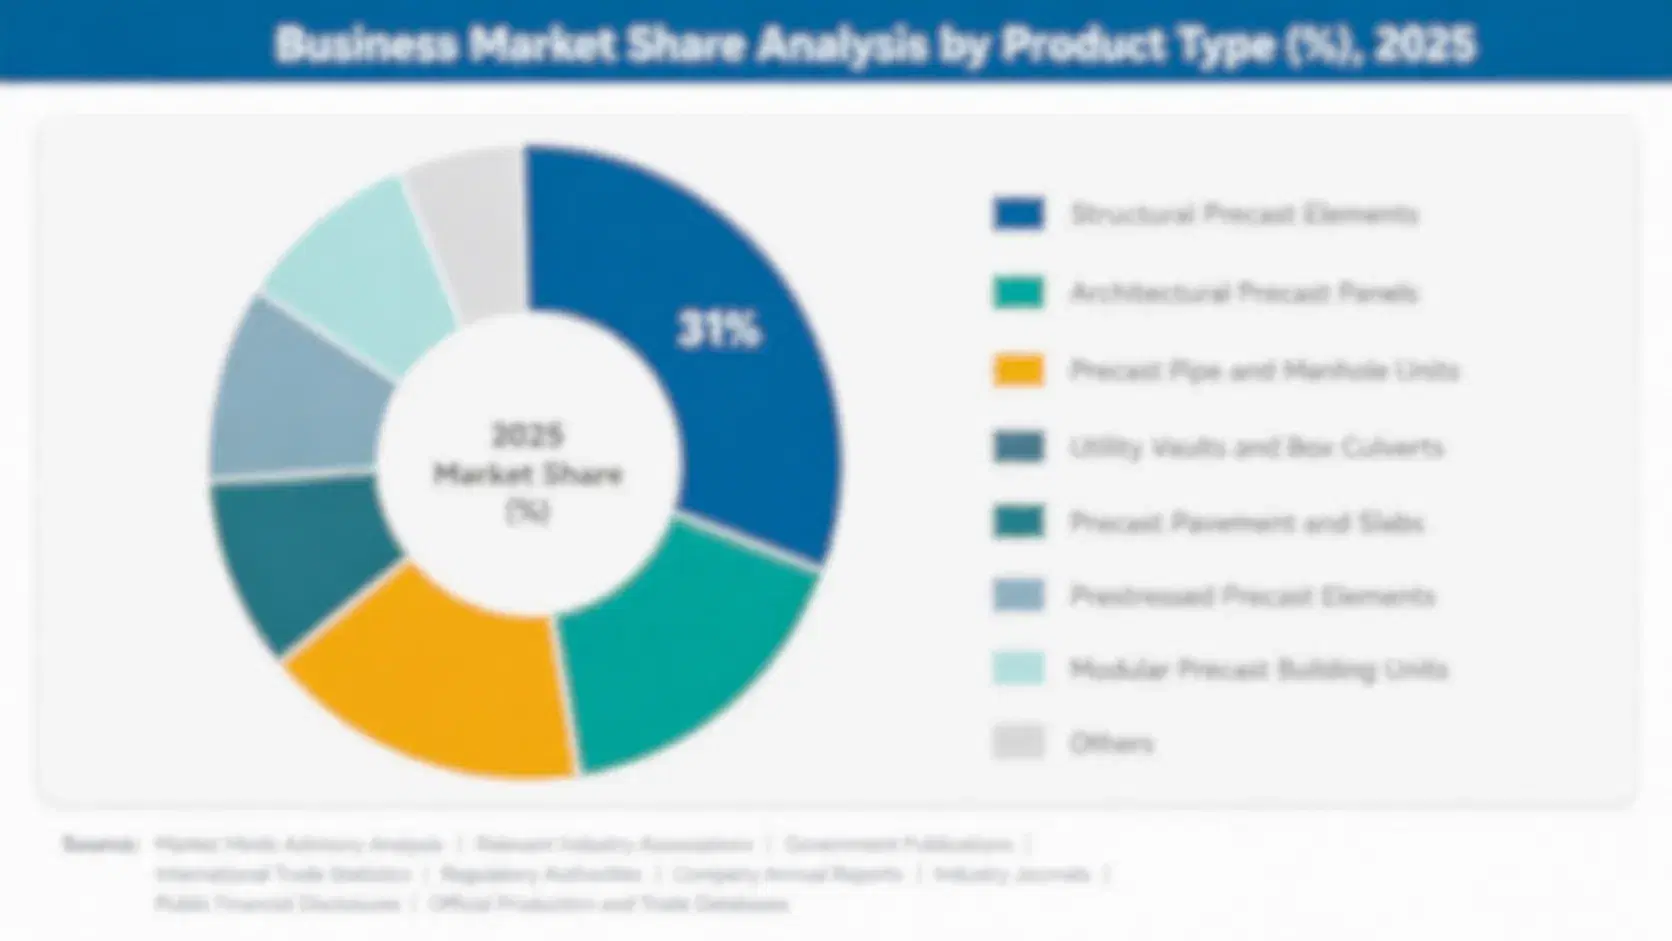
Segmentation follows container specification: what the vessel is built and certified to contain, rather than which industry fills it or how it is commercially supplied. Six specifications cover the market without overlap, from standard polyethylene containers through to recycled content constructions. End-use industry and commercial arrangement are treated as separate dimensions here. Certification status cuts across all six.
vietnam-plastic-jerry-can-industry-market-share-analysis-1787696193557

Recycled Content Jerry Cans

Growth at 10.8%, half again the market rate of 7.2%, concentrates almost entirely in non-regulated service because a dangerous goods design approval is granted against a named resin and wall weight that recycled content changes. Retesting costs around 8,400 dollars per design and few converters have funded it. Food grade service carries its own barrier, since recycled resin requires migration compliance documentation that most streams cannot supply. What looks like a sustainability segment is really a certification segment, and the converters who understood that early hold positions competitors cannot reach quickly. Regulated volume stays with whoever paid for the testing, which makes the position unusually durable once established. Certification is the real product.
CAGR 10.8%

Fluorinated and Barrier Treated Jerry Cans

Polyethylene alone does not contain solvents and many agrochemical formulations, and untreated containers panel inward as contents permeate through the wall across a shelf life measured in months rather than years. In-mould fluorination treats the container surface during moulding while co-extruded barrier layers build the resistance into the wall itself, and the two carry different capital and running costs. Growth at 9.4% follows agrochemical and solvent filling across Southeast Asia. Demonstrating permeation performance over a full shelf life is what separates converters here, not moulding capability. Almost any converter can mould the container, and rather few can prove what happens to the contents inside it over time. Evidence takes months to generate.
CAGR 9.4%
Full segment breakdown across 6 segments available in the complete report.

Regional Architecture and Country Demand Map

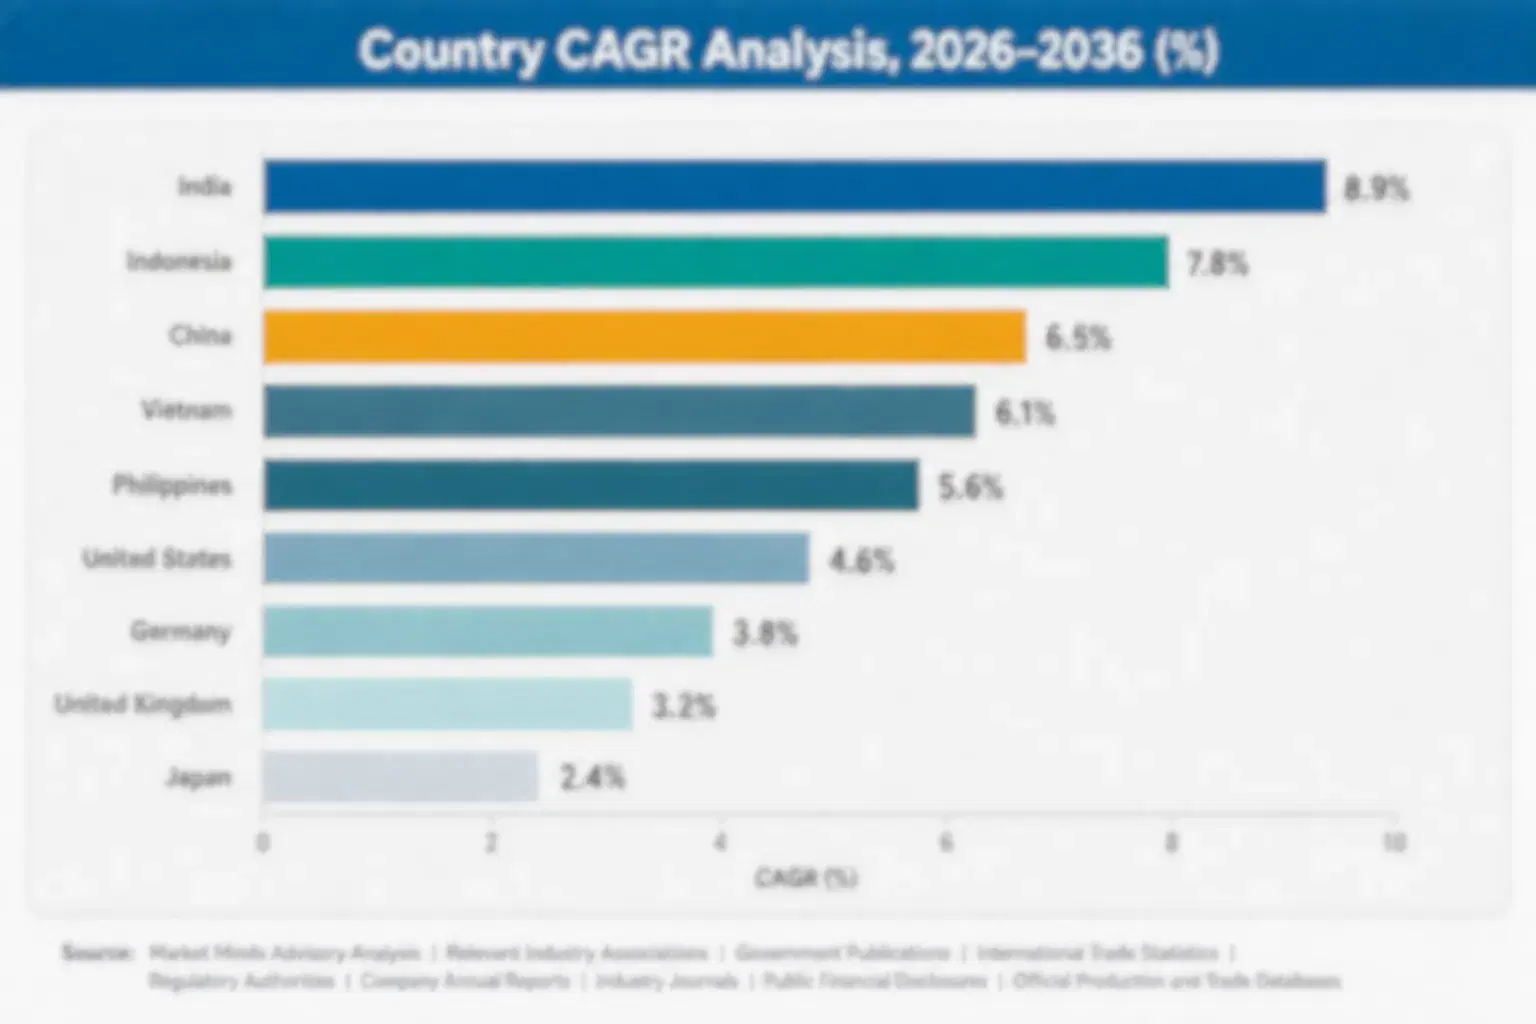
Geography follows chemical, agrochemical and food filling capacity, since jerry cans ship badly and converters locate beside their customers. East Asia leads on regional filling scale, North America follows on regulated volume, and Vietnam grows fastest of all countries. Barrier capability separates converters everywhere. Certification does likewise.

North America

Dangerous goods enforcement is consistent here, which makes design type approval a genuine commercial asset rather than a formality that gets deferred when convenient. Agrochemical filling across the Midwest and lubricant blending nationally generate the bulk of container demand. The recycled content and certification conflict is more visible here than anywhere, since brand commitments are public and compliance is actively audited. Converters cluster around filling operations because freight on empty containers rises steeply with distance, which keeps the regional supplier base fragmented despite considerable national scale among the leaders. Barrier capability is widely held among the larger converters, which leaves regional competitors serving standard container volume where price is the only real variable.
Share: 24% | CAGR: 6.4% (2026 to 2036)

Western Europe

European dangerous goods rules follow the same international framework but enforcement and recycled content pressure are both more intense, which sharpens the certification conflict considerably for converters serving regulated customers. German, Dutch and Italian converters hold technical positions in fluorination and co-extruded barrier construction. Agrochemical filling has consolidated across the region, reducing the number of sites while raising volume at each. Food grade demand follows cooking oil and condiment processing concentrated in southern Europe. Energy costs weigh on moulding operations and have compressed conversion margins since 2022. The recycled content and certification conflict is sharpest here, since public commitments and active enforcement collide directly in dangerous goods service. Enforcement is genuinely active.
Share: 20% | CAGR: 5.6% (2026 to 2036)
Regional intelligence for 5 additional markets available in the complete report: East Asia, South Asia and Pacific, Latin America, Middle East and Africa, Eastern Europe. Contact sales@marketmindsadvisory.com.
vietnam-plastic-jerry-can-industry-country-cagr-analysis-1787696193739

Selling Through The Certification Conflict

Retesting a dangerous goods design costs around 8,400 dollars, barrier capability rather than moulding separates converters, handles fail where nobody specifies them, and freight caps reach at roughly 250 kilometres. Four levers work on certification, permeation evidence, drop performance and plant location rather than on container price. Price is the weakest of them. Certification carries most weight.

Fund Recycled Design Retests On Core Containers

A dangerous goods approval names the resin and wall weight it was granted against, and recycled content voids it at a retest cost of roughly 8,400 dollars per design. Almost no converter has funded that work, which is why growth at 10.8% sits in non-regulated service. A converter who retests a handful of core designs serves regulated customers holding public recycled content commitments that competitors cannot serve at all. The barrier is procedural and the capital involved is genuinely modest. Public commitments create the pull. Regulated volume follows the testing.
Market Impact: Unblocks the 2 directly conflicting customer commitments entirely

Prove Permeation Performance Across Full Shelf Life

Polyethylene does not contain solvents and many agrochemicals, and containers panel inward as contents permeate over months rather than years. Converters quote fluorination or barrier layers as a specification and rarely produce permeation data across a full 12 month shelf life in the customer's actual formulation. Regulatory functions want that evidence and mostly cannot get it. A converter who runs the testing and publishes it competes on a dimension nobody else has bothered to measure properly. Nobody else is measuring it. Evidence beats specification claims. Publishing it changes the conversation completely.
Market Impact: Documents a full 12 months of permeation performance

Specify The Handle Nobody Currently Specifies

Jerry cans are carried by hand, dropped onto concrete and stacked several high, and a handle moulded as part of the container performs very differently from one added as an afterthought. A drop failure carrying agrochemical concentrate is a spill rather than a complaint. Certification requires a drop test at minus 18 degrees that most buyers never think about again after approval. Converters who bring drop performance data reframe the purchase around consequence rather than around unit price. Consequence outweighs unit price entirely. A spill is not a complaint. Consequence sells it.
Market Impact: Addresses the drop failures occurring at -18 degrees

Place Plants Beside Major Filling Operations

An empty jerry can is mostly air and a trailer fills long before reaching weight, so landed cost climbs steeply and competitive reach ends around 250 kilometres from a plant. That is why concentration sits at 21% despite genuine scale among the leaders. Locating capacity beside a major filler removes the freight disadvantage entirely and makes displacement difficult, though it requires committing capital ahead of contracted volume. Converters who moved first hold positions competitors cannot economically attack. Displacement becomes practically impossible. Freight decides the whole map. Capital precedes the volume.
Market Impact: Removes the whole 250 kilometre reach ceiling entirely

Who Controls the Margin Pool

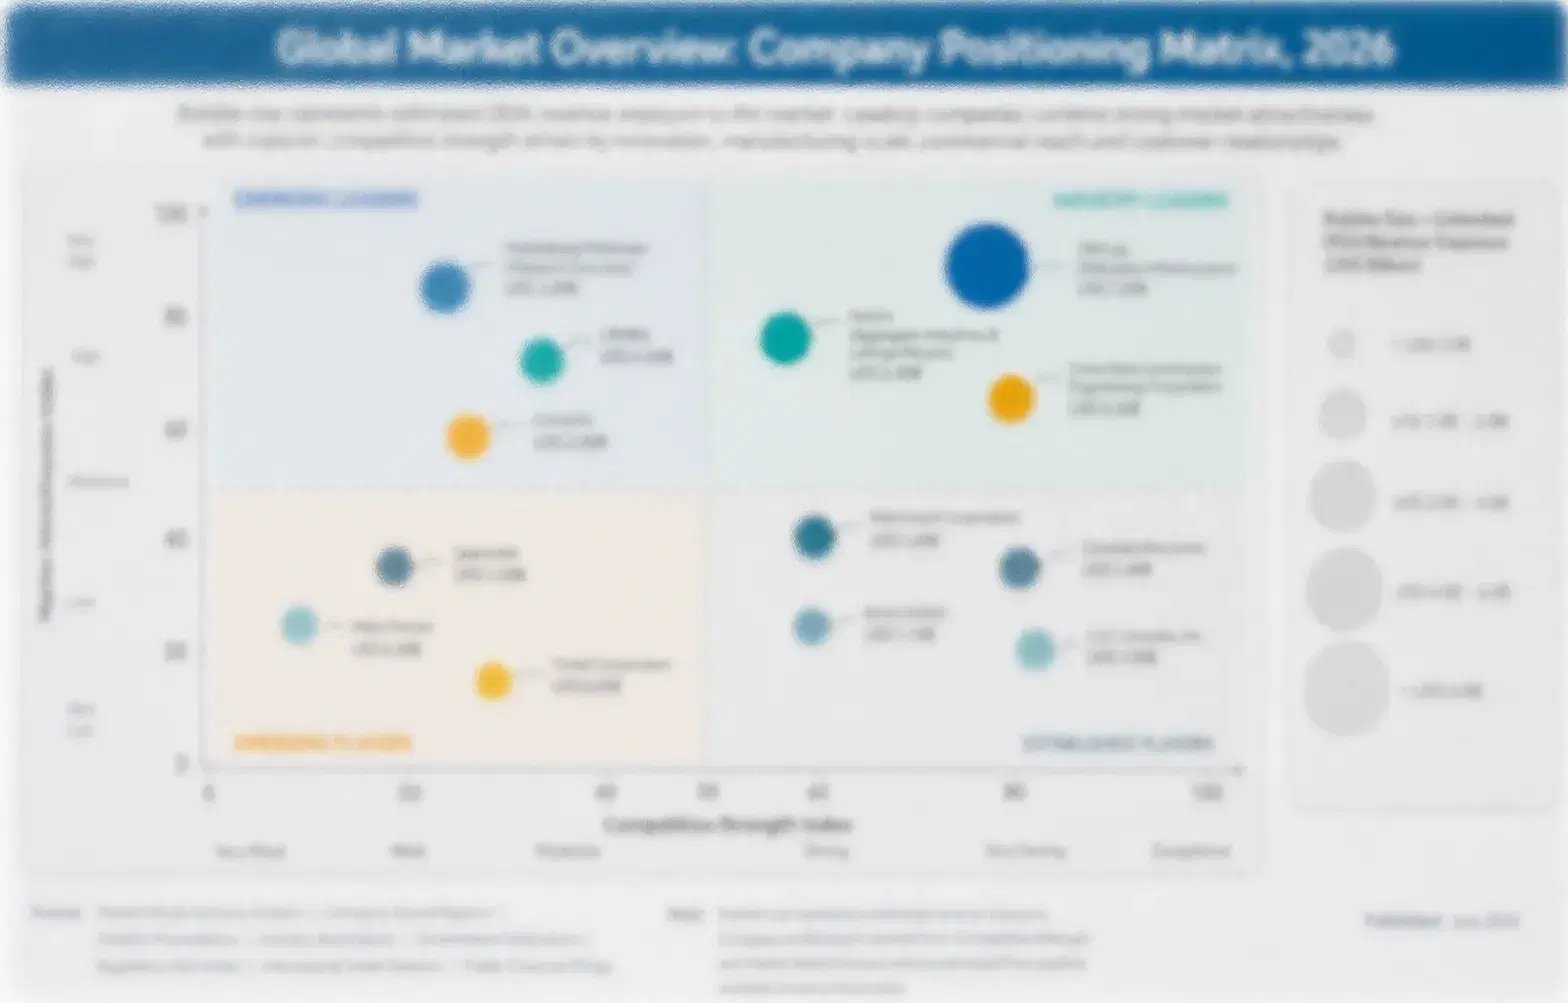
Measured on disclosed rigid industrial packaging revenue, the five largest converters hold a CR5 of just 21%, which reflects freight economics rather than any absence of scale among the leaders. Greif, Mauser, Time Technoplast and Schütz all operate substantial plant networks and still compete plant by plant against regional converters inside each supply radius, since an empty container cannot travel far and remain competitive on landed cost. Scale buys presence rather than protection here.
Three contests define activity. Standard container supply competes on price within a supply radius where converters are broadly interchangeable. Barrier and fluorinated containers compete on permeation evidence that few can produce across a full shelf life. Dangerous goods service competes on held design approvals, and increasingly on whether a converter has funded recycled content retests that customers with public commitments now need. A converter organised around standard supply is rarely equipped for the other two.

Pressure builds as brand owners discover their sustainability and certification commitments contradict each other in regulated service. Rankings shift toward converters who worked through the retest pathway early. Vietnamese and regional converters are moving up on cost and proximity while barrier capability remains their principal gap. Barrier capability remains the gap.
vietnam-plastic-jerry-can-industry-company-positioning-matrix-1787696193921

Competitive Moat and Risk Dimensions

GREIF

Moat: Plant Network Supply Radius

Greif operates a plant network dense enough to serve most major filling clusters inside economic supply distance, which is the only durable advantage available where landed cost rises steeply beyond a couple of hundred kilometres. That network took decades and considerable acquisition to build. A converter with better barrier capability cannot deliver profitably without a nearby plant.
GREIF

Risk: Standard Container Price Exposure

A large share of volume sits in standard containers where regional converters compete purely on price and network scale confers reach rather than pricing power. Agrochemical consolidation toward larger intermediate bulk formats removes jerry can volume permanently rather than moving it. Breadth provides presence across regions without protecting margin within any of them.
SCHÜTZ

Moat: Barrier Construction Technical Depth

Schütz holds strong positions in barrier and multi-layer container construction for solvents and aggressive chemistry, where permeation performance must be demonstrated rather than asserted. Those specifications are written into customer regulatory documentation, which makes substitution a change control matter rather than a purchasing decision. A competitor offering an equivalent container still faces requalification nobody wants to schedule.
SCHÜTZ

Risk: Limited Low-Cost Region Presence

Technical depth concentrates in markets where customers will pay for demonstrated barrier performance, which leaves fast-growing Southeast Asian volume served largely by regional converters competing on cost and proximity. Vietnam growing at 9.6% is the clearest example. Capability that commands a premium in one geography does not automatically travel to another.

Players Tracked

Prominent Players

Greif
Mauser Packaging Solutions
Time Technoplast
Schütz
Berry Global

Other Key Players

Duy Tan Plastics
Tan Phu Plastics
An Phat Holdings
Binh Minh Plastics
Rang Dong Plastic
Jokey Group
Curtec
Sonoco Products
Nampak
Alpla
Zhuhai Zhongfu
Taiwan Hon Chuan
Supreme Industries
Nilkamal
Pact Group

Recent Developments

JANUARY 2025

Agrochemical filler suspends recycled content target for certified containers

An agrochemical filler suspended its recycled content target for dangerous goods packaging after establishing that design type approvals would require retesting across its container range. The decision was an internal policy revision rather than any corporate transaction, and the retest cost per design proved the deciding factor.
Signal: Sustainability targets and dangerous goods certification were set independently and cannot both be met without funded retesting.
MAY 2025

Vietnamese converter commissions in-mould fluorination capability

A Vietnamese converter commissioned in-mould fluorination capacity for agrochemical and solvent containers, an organic capital investment rather than any acquisition or joint venture. Regional agrochemical and aquaculture chemical filling had been importing barrier treated containers because domestic capability was thin relative to demand. Local capability had lagged demand.
Signal: Barrier capability rather than moulding capacity is the gap that separates regional converters from international competitors.
SEPTEMBER 2025

Converter publishes twelve month permeation data for solvent service

A container converter published permeation test results measured across a full twelve month shelf life in customer formulations rather than in standard reference fluids, an organic technical disclosure rather than any transaction. Regulatory functions had been accepting specification claims because comparable evidence simply did not exist anywhere.
Signal: Permeation evidence across a real shelf life separates converters where specification claims tell customers almost nothing.

What A Jerry Can Costs

Polyethylene dominates and little else comes close. High density polyethylene accounts for 58 to 66% of manufacturing cost depending on wall weight and whether the container carries a co-extruded barrier layer. Moulding energy follows and varies sharply by region. Fluorination adds process gas and handling cost, while design type approval testing amortises across whatever volume a certified design eventually carries, which converters frequently underestimate at the outset.
The volatility that mattered was polyethylene through 2022. Pricing moved sharply alongside petrochemical feedstock and European energy costs, which IEA and EIA industrial energy data document across that period, and converters on fixed annual pricing absorbed the movement on an input that is roughly two thirds of their cost. Those with indexed pass-through clauses did not. Recycled polyethylene has also traded above virgin at times.

Exposure divides by contract structure and by region rather than by scale. Converters with indexed resin clauses compete on conversion cost alone while those on fixed pricing carry the full swing on their dominant input. European moulders carry energy intensity that Southeast Asian and Gulf competitors do not. Gulf converters benefit from regional polyethylene production, and Vietnamese converters from lower conversion cost, though both import barrier technology.
vietnam-plastic-jerry-can-industry-cost-volatility-analysis-1787696194111

Index virgin and recycled polyethylene separately

Recycled polyethylene has traded above virgin at times, which contracts written on the assumption that recycled material costs less absorbed badly. Indexing the two separately costs negotiation effort and removes a divergence that a single benchmark cannot capture. Converters who assumed recycled resin would always be the cheaper input found out otherwise during the last cycle.

Amortise design approval testing across container families

Design type approval testing costs the same whether it supports one container or a family sharing geometry and wall construction, so converters who certify across a family spread the cost. Those testing container by container repeat it unnecessarily. The approach requires planning the range before certifying it, which converters rarely do because approvals get pursued reactively when a customer asks.

Locate moulding capacity beside major filling operations

An empty container is mostly air and landed cost climbs steeply beyond roughly 250 kilometres, which caps competitive reach regardless of manufacturing efficiency. Placing capacity beside a major filler removes freight entirely and makes displacement difficult. It requires committing capital ahead of contracted volume, which is the reason most converters hesitate and a few move decisively.

Portfolio Architecture for Margin Defence

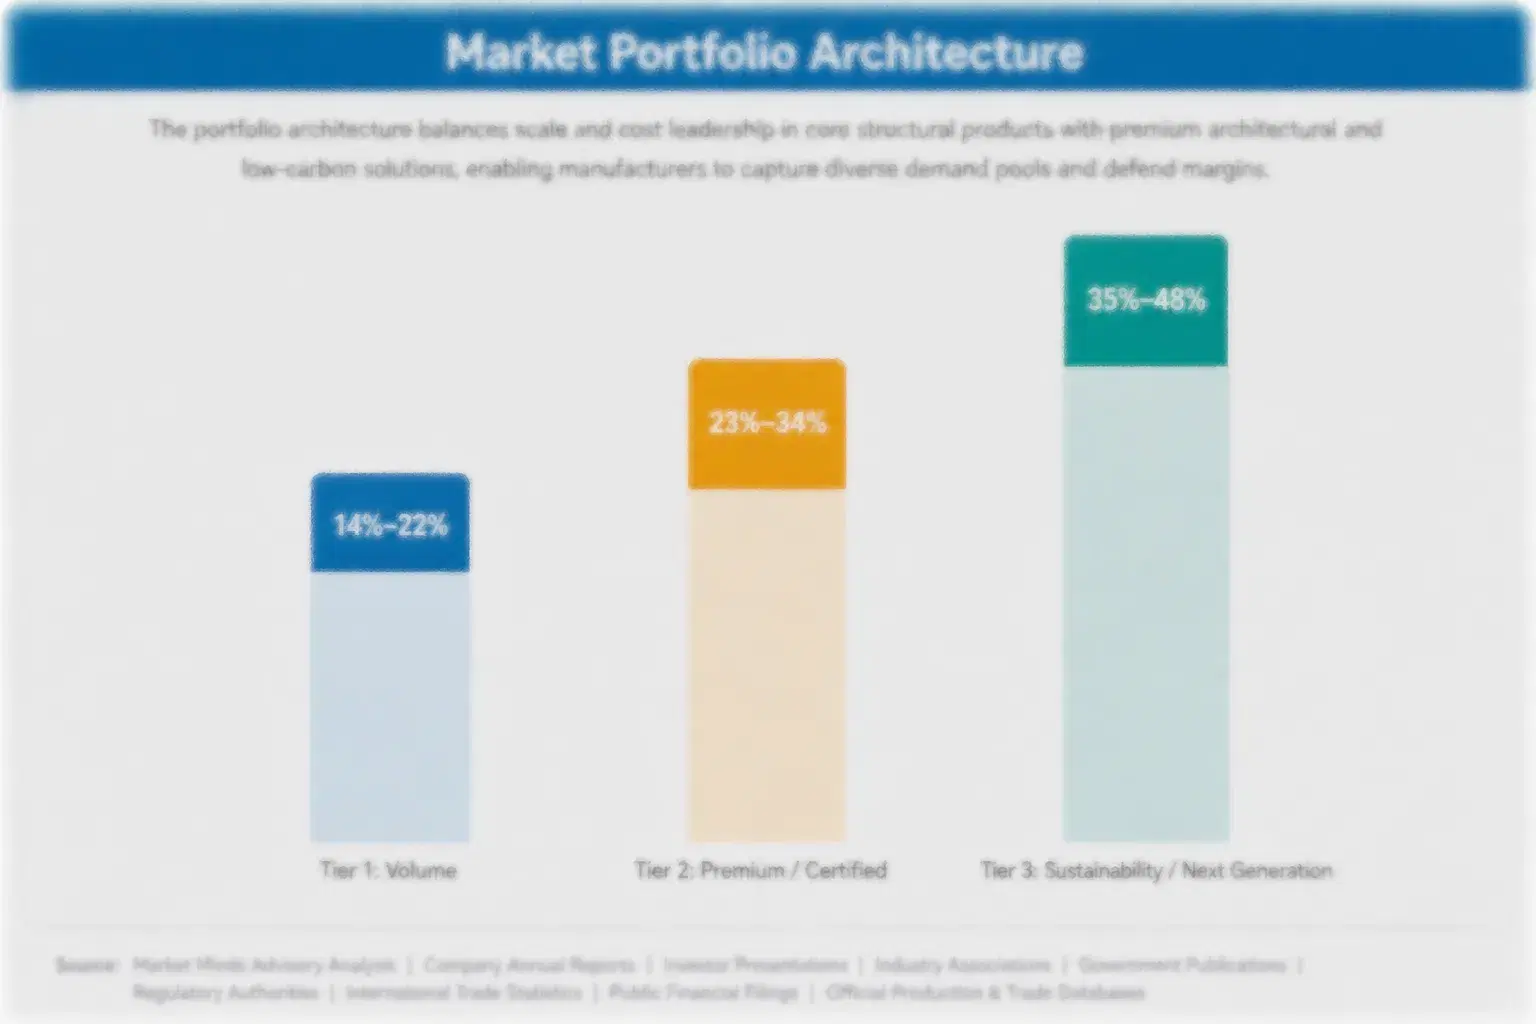
Margin follows certification and barrier capability rather than moulding quality. Standard containers are comparable within a supply radius and priced accordingly. Food grade containers earn modestly better on traceability documentation. Dangerous goods certified containers earn considerably more because approvals take time and money to hold. Fluorinated and barrier treated containers earn most, since permeation performance must be demonstrated across a shelf life and very few converters produce that evidence.
The tension is between volume that fills moulding capacity and certified work that carries margin, and the two need different investment. Standard containers keep plants utilised and generate the scale that makes moulding economics work at all. Barrier treatment, certification testing and recycled retesting require capital that produces no volume by itself. Converters weighted entirely to the first compete on price against every regional competitor within reach of their customers.

High-value pools sit in three places. Barrier and fluorinated containers supported by permeation evidence across a real shelf life. Dangerous goods certified designs including funded recycled content retests, which almost nobody has completed. And plant positions beside major fillers, where freight disappears and a regional competitor cannot reach the customer economically at all.

Volume / Commodity-Adjacent

Standard polyethylene containers supplied within a supply radius where converters are broadly interchangeable on specification. The 7-point range separates converters with indexed resin clauses and hedged energy from those absorbing polyethylene movements on fixed annual pricing agreements.
Gross Margin: 12-19%

Premium / Certified

United Nations certified dangerous goods containers and food grade containers with documented resin traceability and migration compliance. The 7-point spread separates converters holding current design approvals across a family from those certifying reactively container by container.
Gross Margin: 23-30%

Sustainability / Regulatory / Next-Generation

Fluorinated and co-extruded barrier containers, and recycled content constructions including funded design retests for regulated service. The 17-point range is wide because barrier capability commands a durable premium while recycled content in non-regulated service does not.
Gross Margin: 26-43%
vietnam-plastic-jerry-can-industry-portfolio-architecture-1787696194316

High-value Sub-segments and Strategic Watch-out

Barrier Treated and Fluorinated Containers

Highest value with strong growth at 9.4%, where permeation evidence across a full shelf life separates converters far more effectively than any moulding capability does. The risk is that barrier technology is licensable, so the advantage rests on testing evidence rather than on the process itself.
Gross Margin: 38-43%

Certified Recycled Content Designs

Fastest growth at 10.8% and almost entirely blocked in regulated service by retesting that few converters have funded at around 8,400 dollars per design. The risk is that regulators establish a simplified pathway, which would remove the barrier and the advantage together. Timing decides the return.
Gross Margin: 33-38%

Standard Polyethylene Containers

The volume core, comparable across converters within a supply radius and exposed to resin movements that arrive after pricing was agreed. Converters hold the position because it carries moulding utilisation, and utilisation is what makes the certified work possible. Nobody exits it deliberately. Utilisation funds everything else.
Gross Margin: 13-18%

Bulk Format Substitution

The strategic watch-out. Agrochemical consolidation reduces filling sites while raising volume at each, which pushes chemistry toward intermediate bulk containers and larger returnable formats. The risk is that jerry can volume lost to bulk substitution never returns, unlike volume lost to a competitor. Bulk substitution is permanent.
Gross Margin: 18-23%

Approval Creates The Annuity

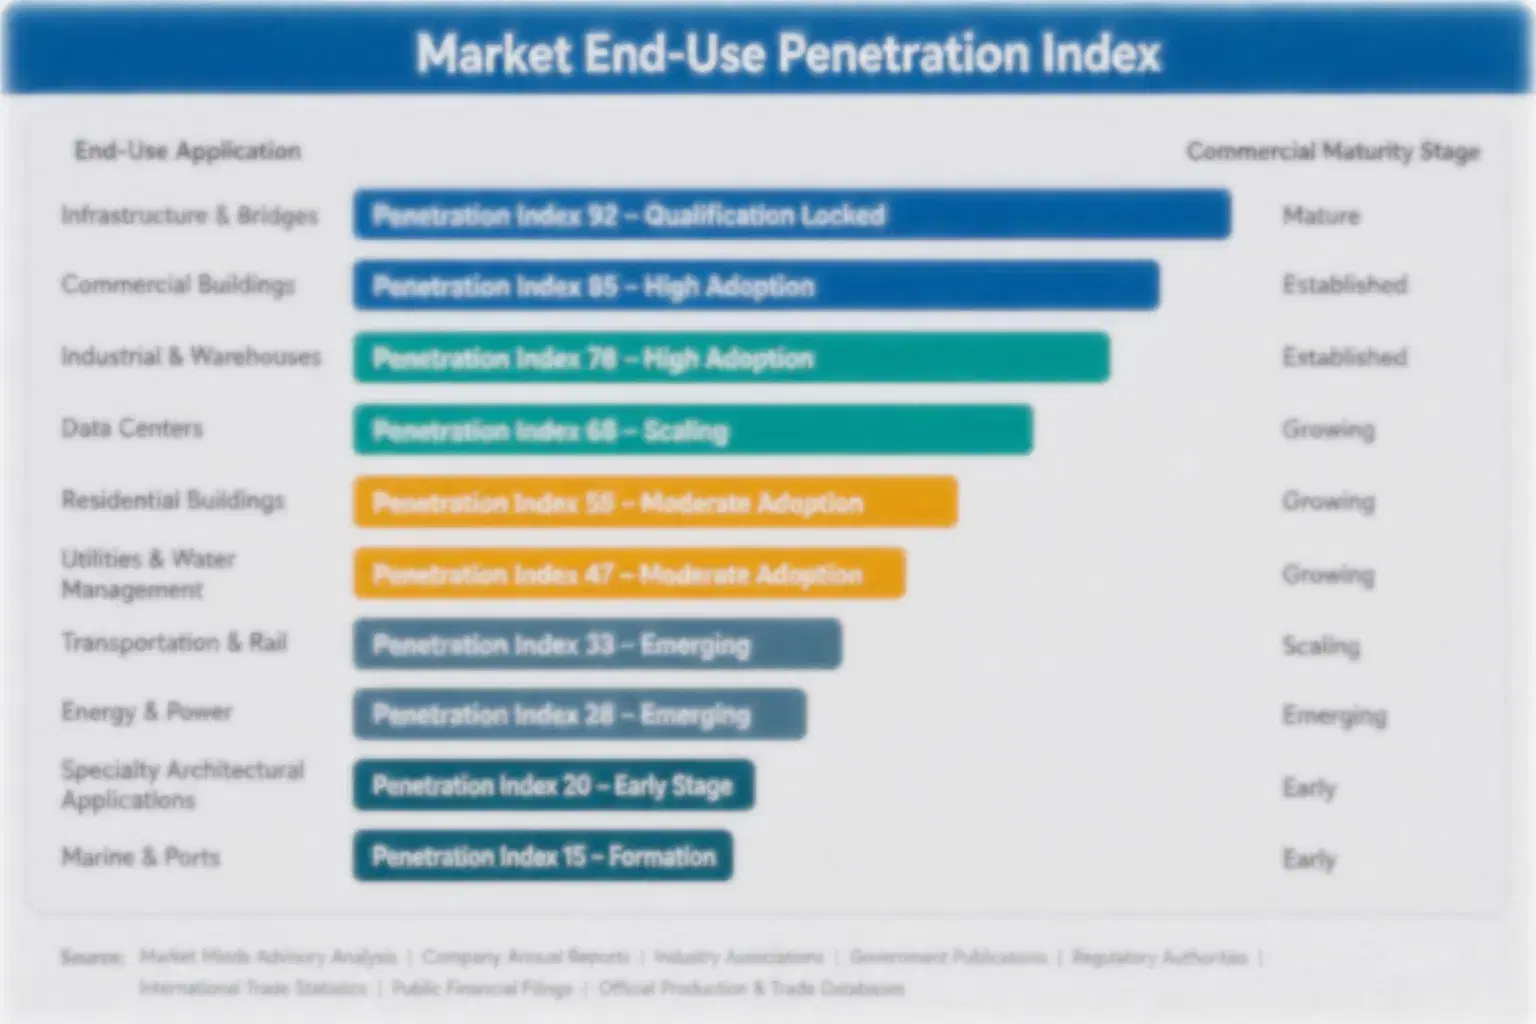
Containers are consumed with every filled unit and never accumulate, which ties demand directly to a customer's filling volume rather than to any decision revisited periodically. What creates genuine stickiness is certification. A dangerous goods design approval or a documented barrier specification sits inside a customer's regulatory file, and changing it means requalification nobody schedules without a real reason. Standard containers carry none of that protection and get requoted annually.
Stickiness therefore varies enormously within one product category. Certified dangerous goods designs are effectively permanent for the life of the formulation. Barrier specifications supported by permeation data are similar, since the evidence took months to generate and a replacement would need its own. Food grade traceability is moderately sticky. Standard containers are not sticky at all, and a converter holding only that volume competes purely on landed cost.

The buyer differs accordingly. Standard containers are repriced by procurement comparing converters within a supply radius. Certified and barrier containers are specified by regulatory affairs and product safety functions who care about test evidence and approval status rather than cost per thousand. Younger regulatory staff expect permeation data as standard, which converters selling specification claims cannot provide.
vietnam-plastic-jerry-can-industry-end-use-penetration-index-1787696194504

Where Certification Creates Position

These are among the four positions where our research anticipates prominent divergence between winners and laggards over the coming forecast period. Each is grounded in the demand model, the regulatory perimeter, and the announced capacity pipeline.
01 / RETEST PATHWAY FUNDING

Pay for the retest competitors will not fund

A dangerous goods design type approval is granted against a named resin and wall weight, and adding recycled content changes both, which voids that approval and forces a full retest costing roughly 8,400 dollars for each design affected. Almost no converter has funded that work, which is exactly why growth running at 10.8% sits in non-regulated service. A converter who retests even a handful of core designs then serves customers with public commitments that competitors simply cannot reach at all.
02 / PERMEATION EVIDENCE GENERATION

Test the shelf life nobody has measured

Polyethylene does not contain solvents and many agrochemical formulations, and untreated containers panel inward as the contents permeate through the wall over months rather than years of ordinary storage. Converters quote fluorination or barrier layers as a line on a specification and almost never produce permeation data across a full twelve month shelf life in the customer's own formulation. Regulatory functions want that evidence badly and mostly cannot obtain it from anybody at all, which leaves the gap wide open.
03 / DROP PERFORMANCE SELLING

The handle is the failure nobody specifies

Jerry cans are carried by hand, dropped onto concrete floors and stacked several units high, and a handle moulded as an integral part of the container performs very differently from one added as an afterthought. Certification requires a drop test at minus eighteen degrees that most buyers never think about again once approval is granted. A drop failure carrying agrochemical concentrate is a chemical spill rather than a packaging complaint, which procurement almost never prices into the purchase at all.
04 / PLANT PLACEMENT DISCIPLINE

Reach ends where the freight cost starts

An empty jerry can is mostly air and a trailer fills long before it reaches weight, so landed cost climbs steeply and a converter's competitive reach effectively ends around 250 kilometres from its plant. That single fact explains why concentration sits at only 21% today, despite the genuine scale that the leading converters have assembled. Placing moulding capacity directly beside a major filler removes that disadvantage entirely, though it does require committing capital well ahead of any contracted volume actually arriving.

Engagement Snapshot From the Field

A live engagement with an industry participant carrying material or product regulatory and market exposure ahead of a defining policy shift, showing how our research translates into a defensible multi-year portfolio strategy.
MARKET MINDS ADVISORY · CLIENT ENGAGEMENT SUMMARY
Vietnam Plastic Jerry Can Industry Producer Strategic Portfolio Review and Transition Roadmap 2026·Investment Scenario on Vietnam Plastic Jerry Can Industry Exposure Evaluation 2025-26
CLIENT PROFILE
A Southeast Asian rigid packaging converter operating four moulding plants and supplying jerry cans to agrochemical, lubricant and food processing customers, with reported revenue of 74 million dollars (client-reported, unverified by MMA). Roughly 88% of volume sat in standard and food grade containers. Dangerous goods approvals were held on three designs and barrier treatment was outsourced to a third party.
STRATEGIC CHALLENGE
Two agrochemical customers had shifted barrier treated volume to international suppliers and margins on standard containers had eroded steadily for three years. Management was pursuing moulding cost reduction and a plant expansion. Neither addressed why barrier volume was leaving, or why the certified range had never extended beyond its original three approved designs.
MMA APPROACH
MMA reviewed the two account losses against customer regulatory requirements, which the company had never requested or examined in any detail. Fifteen expert interviews with agrochemical regulatory affairs and packaging development leads established how barrier and certified containers are actually specified. The analysis treated permeation evidence and approval coverage, rather than conversion cost, as the probable causes.
KEY FINDINGS
  1. Both lost accounts cited absence of permeation data across a full shelf life rather than price, and neither had ever been asked what evidence they needed.
  2. Outsourced fluorination meant the company could not generate permeation evidence itself, since the treatment process it depended on belonged to somebody else entirely.
  3. The three certified designs covered a narrow size range, so every enquiry outside it went to competitors holding broader approval coverage across container families.
  4. No customer had been offered recycled content in certified service, and two held public commitments they could not currently meet in dangerous goods packaging.
CLIENT PROFILE
A Southeast Asian rigid packaging converter operating four moulding plants and supplying jerry cans to agrochemical, lubricant and food processing customers, with reported revenue of 74 million dollars (client-reported, unverified by MMA). Roughly 88% of volume sat in standard and food grade containers. Dangerous goods approvals were held on three designs and barrier treatment was outsourced to a third party.
STRATEGIC CHALLENGE
Two agrochemical customers had shifted barrier treated volume to international suppliers and margins on standard containers had eroded steadily for three years. Management was pursuing moulding cost reduction and a plant expansion. Neither addressed why barrier volume was leaving, or why the certified range had never extended beyond its original three approved designs.
MMA APPROACH
MMA reviewed the two account losses against customer regulatory requirements, which the company had never requested or examined in any detail. Fifteen expert interviews with agrochemical regulatory affairs and packaging development leads established how barrier and certified containers are actually specified. The analysis treated permeation evidence and approval coverage, rather than conversion cost, as the probable causes.
KEY FINDINGS
  1. Both lost accounts cited absence of permeation data across a full shelf life rather than price, and neither had ever been asked what evidence they needed.
  2. Outsourced fluorination meant the company could not generate permeation evidence itself, since the treatment process it depended on belonged to somebody else entirely.
  3. The three certified designs covered a narrow size range, so every enquiry outside it went to competitors holding broader approval coverage across container families.
  4. No customer had been offered recycled content in certified service, and two held public commitments they could not currently meet in dangerous goods packaging.
RECOMMENDED STRATEGY
Phase 1: Phase one: bring fluorination in house so permeation testing can be generated and published rather than depending entirely on a third party. Phase 2: Phase two: extend dangerous goods approvals across container families sharing geometry rather than certifying reactively design by design. Families share the testing. Phase 3: Phase three: fund recycled content retests on core certified designs to serve customers holding commitments competitors cannot currently meet. Commitments create the pull.
OUTCOME
Fluorination was brought in house and twelve month permeation testing began across the principal agrochemical formulations. Approval coverage extended from three designs to nine across two container families (client-reported, unverified by MMA). One lost account returned on the strength of published permeation evidence, and a recycled retest programme was funded on two core designs.

Frequently Asked Questions

Foundational context covering the market sizes, CAGR, scope, country, region and competition that inform every finding below. This section is provided to cover basics and most often pre-purchase conversations, answered from the MMA Primary Research Dataset.

What is the current size of the Vietnam Plastic Jerry Can Industry?

The market was worth 3.8 billion dollars in 2025, covering standard, certified, fluorinated, multi-layer, food grade and recycled content containers. It reaches 4.07 billion dollars in 2026.

How large will the Vietnam Plastic Jerry Can Industry be by 2036?

MMA forecasts 8.16 billion dollars by 2036, an increase of 4.09 billion dollars over the 2026 base. That represents an expansion multiple of 2.01 times across the forecast period.

What is the CAGR for the Vietnam Plastic Jerry Can Industry 2026 to 2036?

The base case compounds at 7.2% annually. The bull case reaches 8.4% if a workable recycled retest pathway emerges, while the bear case sits at 6.0% on substitution toward bulk formats.

Which segment is growing fastest?

Recycled content jerry cans, at 10.8%, half again the market rate of 7.2%. Growth concentrates in non-regulated service because dangerous goods approvals require retesting at around 8,400 dollars per design.

Who are the major companies in the Vietnam Plastic Jerry Can Industry?

Greif, Mauser Packaging Solutions, Time Technoplast, Schütz and Berry Global lead on disclosed rigid industrial packaging revenue. Duy Tan, Tan Phu and An Phat Holdings hold strong Vietnamese positions.

Which country is growing fastest?

Vietnam at 9.6%, as agrochemical production, aquaculture chemistry and food processing expand together across the same industrial provinces. China remains the largest producer at roughly 27% of output.

Report Segmentation Architecture

The full report scope spans multiple orthogonal segmentation dimensions, with cross-tabulated demand data provided for each dimension pair. Coverage extends further to regional breakdowns, trend trajectories, and the competitive detail needed to support segment-level decision-making.

By Container Specification

  • Standard HDPE Jerry Cans
  • UN Certified Dangerous Goods Jerry Cans
  • Fluorinated and Barrier Treated Jerry Cans
  • Co-Extruded Multi-Layer Jerry Cans
  • Food Grade and Beverage Jerry Cans
  • Recycled Content Jerry Cans

By End-Use Industry

  • Agrochemicals and Crop Protection
  • Lubricants and Automotive Fluids
  • Industrial and Specialty Chemicals
  • Food, Sauces and Edible Oils
  • Aquaculture and Animal Health
  • Cleaning and Sanitation Products

By Commercial Dimension

  • Direct Filler Supply
  • Contract Packer Supply
  • Certified Design Supply Agreement
  • Annual Contract Supply
  • Resin Indexed Contract
  • Distributor and Spot Supply

By Region

  • North America
  • Western Europe
  • East Asia
  • South Asia and Pacific
  • Latin America
  • Middle East and Africa
  • Eastern Europe

Scope, Methodology, and Coverage

Every figure in this report is reproducible from documented input assumptions. The scope below maps the historical period, the forecast horizon, the segmentation dimensions, and the countries covered, alongside the underlying primary and qualitative methodology.
Historical Period
2020 to 2025
Forecast Period
2026 to 2036
Base Year
2025 (USD billions; MMA Primary Research Dataset, August 2026)
Market Definition
Scope covers rigid plastic jerry cans of approximately five to thirty litres supplied to chemical, agrochemical, lubricant, food and industrial fillers, spanning standard high density polyethylene containers, United Nations certified dangerous goods containers, fluorinated and barrier treated containers, co-extruded multi-layer containers, food grade containers, and recycled content containers. Steel and fibre drums, intermediate bulk containers, bottles and containers below five litres, metal and composite jerry cans, closures and fitments sold separately, and filling and capping equipment are excluded. Vietnamese dynamics are examined as the analytical focus within the global category.
Quantitative Units
USD billions (current prices); units moulded; tonnes of resin converted; certified design count; permeation rate over shelf life
Segmentation Dimensions
By Container Specification; By End-Use Industry; By Commercial Dimension; By Region
Regions Covered
North America, Western Europe, East Asia, South Asia and Pacific, Latin America, Middle East and Africa, Eastern Europe
Countries Covered
Vietnam, China, USA, India, Germany, Thailand, Indonesia, Brazil, Japan, Netherlands, Italy, Turkey, Saudi Arabia, Australia, Poland
Key Companies Profiled
Greif, Mauser Packaging Solutions, Time Technoplast, Schütz, Berry Global, Duy Tan Plastics, Tan Phu Plastics, An Phat Holdings, Binh Minh Plastics, Rang Dong Plastic, Jokey Group, Curtec, Sonoco Products, Nampak, Alpla, Zhuhai Zhongfu, Taiwan Hon Chuan, Supreme Industries, Nilkamal, Pact Group
Quantitative Methodology
Primary survey, n=3,800 respondents, Q4 2025, six countries; demand-side model with trade association cross-validation
Qualitative Methodology
47 expert interviews, Q4 2025; applied to validate demand model assumptions, identify emerging dynamics, and assess competitive positioning
Report Format
PDF and XLSX data workbook (Word format preview document)
Publisher
Market Minds Advisory
Report Code
MMA-2026-PAC-109
Published
August 2026
Contact
sales@marketmindsadvisory.com | www.marketmindsadvisory.com

Purchase the full Vietnam Plastic Jerry Can Industry Report (2026 to 2036).

The full report runs to 168 pages and covers all six container specification segments, seven regions and 20 profiled companies, with Vietnamese dynamics examined as the analytical focus throughout. It includes the complete segment CAGR set, regional certification and barrier capability mapping, and analysis of the recycled content conflict with dangerous goods approval. Company profiles carry evaluation on disclosed rigid industrial packaging revenue, with moat and risk assessment for the top five converters. The competitive section extends to 15 tracked corporate and regulatory developments across 2024 and 2025. Primary research inputs include a quantitative survey of 3,800 respondents and 47 expert interviews conducted in Q4 2025.
Six container specification segments with individual CAGR forecasts
Seven regional markets with certification and barrier capability mapping
Twenty company profiles on consistent revenue evaluation basis
Fifteen tracked developments with commercial interpretation and context
Recycled content and dangerous goods approval conflict analysis
Permeation performance comparison across barrier treatment approaches

Built For The People Who Decide

From boardroom strategy to bench-side execution, this report is read cover-to-cover by leaders shaping the next decade of their industry, turning demand scenarios, market dynamics and valuation benchmarks into decisions.
CXOs/ Presidents/ VPs/ Managers
M&A and Corporate Development
Strategy Teams and R&D Heads
Procurement and Product Directors
Regulatory and Compliance Leaders
Investor Relations and Equity Analysts