Market Minds Advisory
Vietnam Plastic Bottle Market

Vietnam Plastic Bottle Market: Imported Resin Economics, Certified Recyclate Scarcity and Specifications Written Abroad

Resin is roughly 68% of a finished bottle and almost all of it is imported, which makes this a currency and commodity business wearing a manufacturing costume rather than a converting one.

Lead Analyst

Bilal Shaikh

Published

September 2026

Make Smarter Decisions with Customized Research Insights

Request a free sample report and evaluate market opportunities, growth trends, and competitive dynamics relevant to your business needs.

2025 MARKET VALUE$0.9BMarket Size 2025
2036 FORECAST VALUE$2.1BBase Case , 2026 to 2036
CAGR 2026 TO 20368.4 %Bull 9.6% / Bear 7.2%
INCREMENTAL OPPORTUNITY$1.1BNet 10- year value creation
EXPANSION MULTIPLE2.24x2036 value over 2026 base
Strategic Levers
M&A Pipeline
Regional Outlook
Country Rankings
Competitive Intelligence
Segmental Deep-dive
Call-Us : 91 93563 13602

Executive Snapshot and Market Trajectory

Vietnam converts bottles on top of a resin industry it does not own. Roughly 94% of bottle grade polymer arrives imported, and resin accounts for about 68% of finished bottle cost. Converter margin is a spread between a dollar priced import and a dong priced bottle.
The recycled content constraint is not collection, which surprises people. Informal waste networks recover roughly 82% of beverage bottles, a rate that embarrasses several European municipal systems, yet only around 31% of recovered material meets certified food contact standards. The material exists in quantity. Certified, traceable, auditable material does not, and that is a documentation problem rather than a waste one. Investment has been misdirected at the wrong end of the process for years now.
The customer is frequently not Vietnamese either. Around 58% of volume is produced to specifications, lightweighting targets and recycled content commitments written in a global sustainability policy elsewhere. A converter either passes an international audit or supplies domestic brands at lower margins, and that split is the entire competitive structure of this whole industry. Audit qualification is the boundary between them, and it takes years to earn.
Market Definition
Rigid plastic bottles and preforms manufactured and sold within Vietnam, covering PET beverage bottles, PET non-beverage bottles, HDPE bottles, PP bottles, multilayer and barrier bottles, and preforms supplied for third party blowing. Measured at converter selling value for containers up to twenty litres. Industrial drums and intermediate bulk containers above twenty litres, closures and caps, jars, tubs, flexible packaging and resin production are excluded.
Base Year Value
$0.9B in 2025 (MMA Primary Research Dataset, August 2026)
Forecast Period
2026 to 2036, eleven discrete annual values
CAGR
8.4% base case. Bull 9.6%. Bear 7.2%.
Fastest Growth Segment
Multilayer and Barrier Bottles: 12.6% CAGR
Fastest Growth Country
Ho Chi Minh City: 11.4% CAGR
Fastest Growth Region
South Asia and Pacific: 10.6% CAGR
Largest Region
South Asia and Pacific: 87% of 2025 global value
Market Leaders
Ngoc Nghia Industry, Duy Tan Plastics, An Phat Holdings, Tan Phu Vietnam, SCG Packaging. Source: MMA Primary Research Dataset, July 2026.
Primary Survey
n=3,800 procurement and R&D decision-makers, Q4 2025, six countries
Methodology
Demand-side build-up, cross-validated against public data, 47 expert interviews

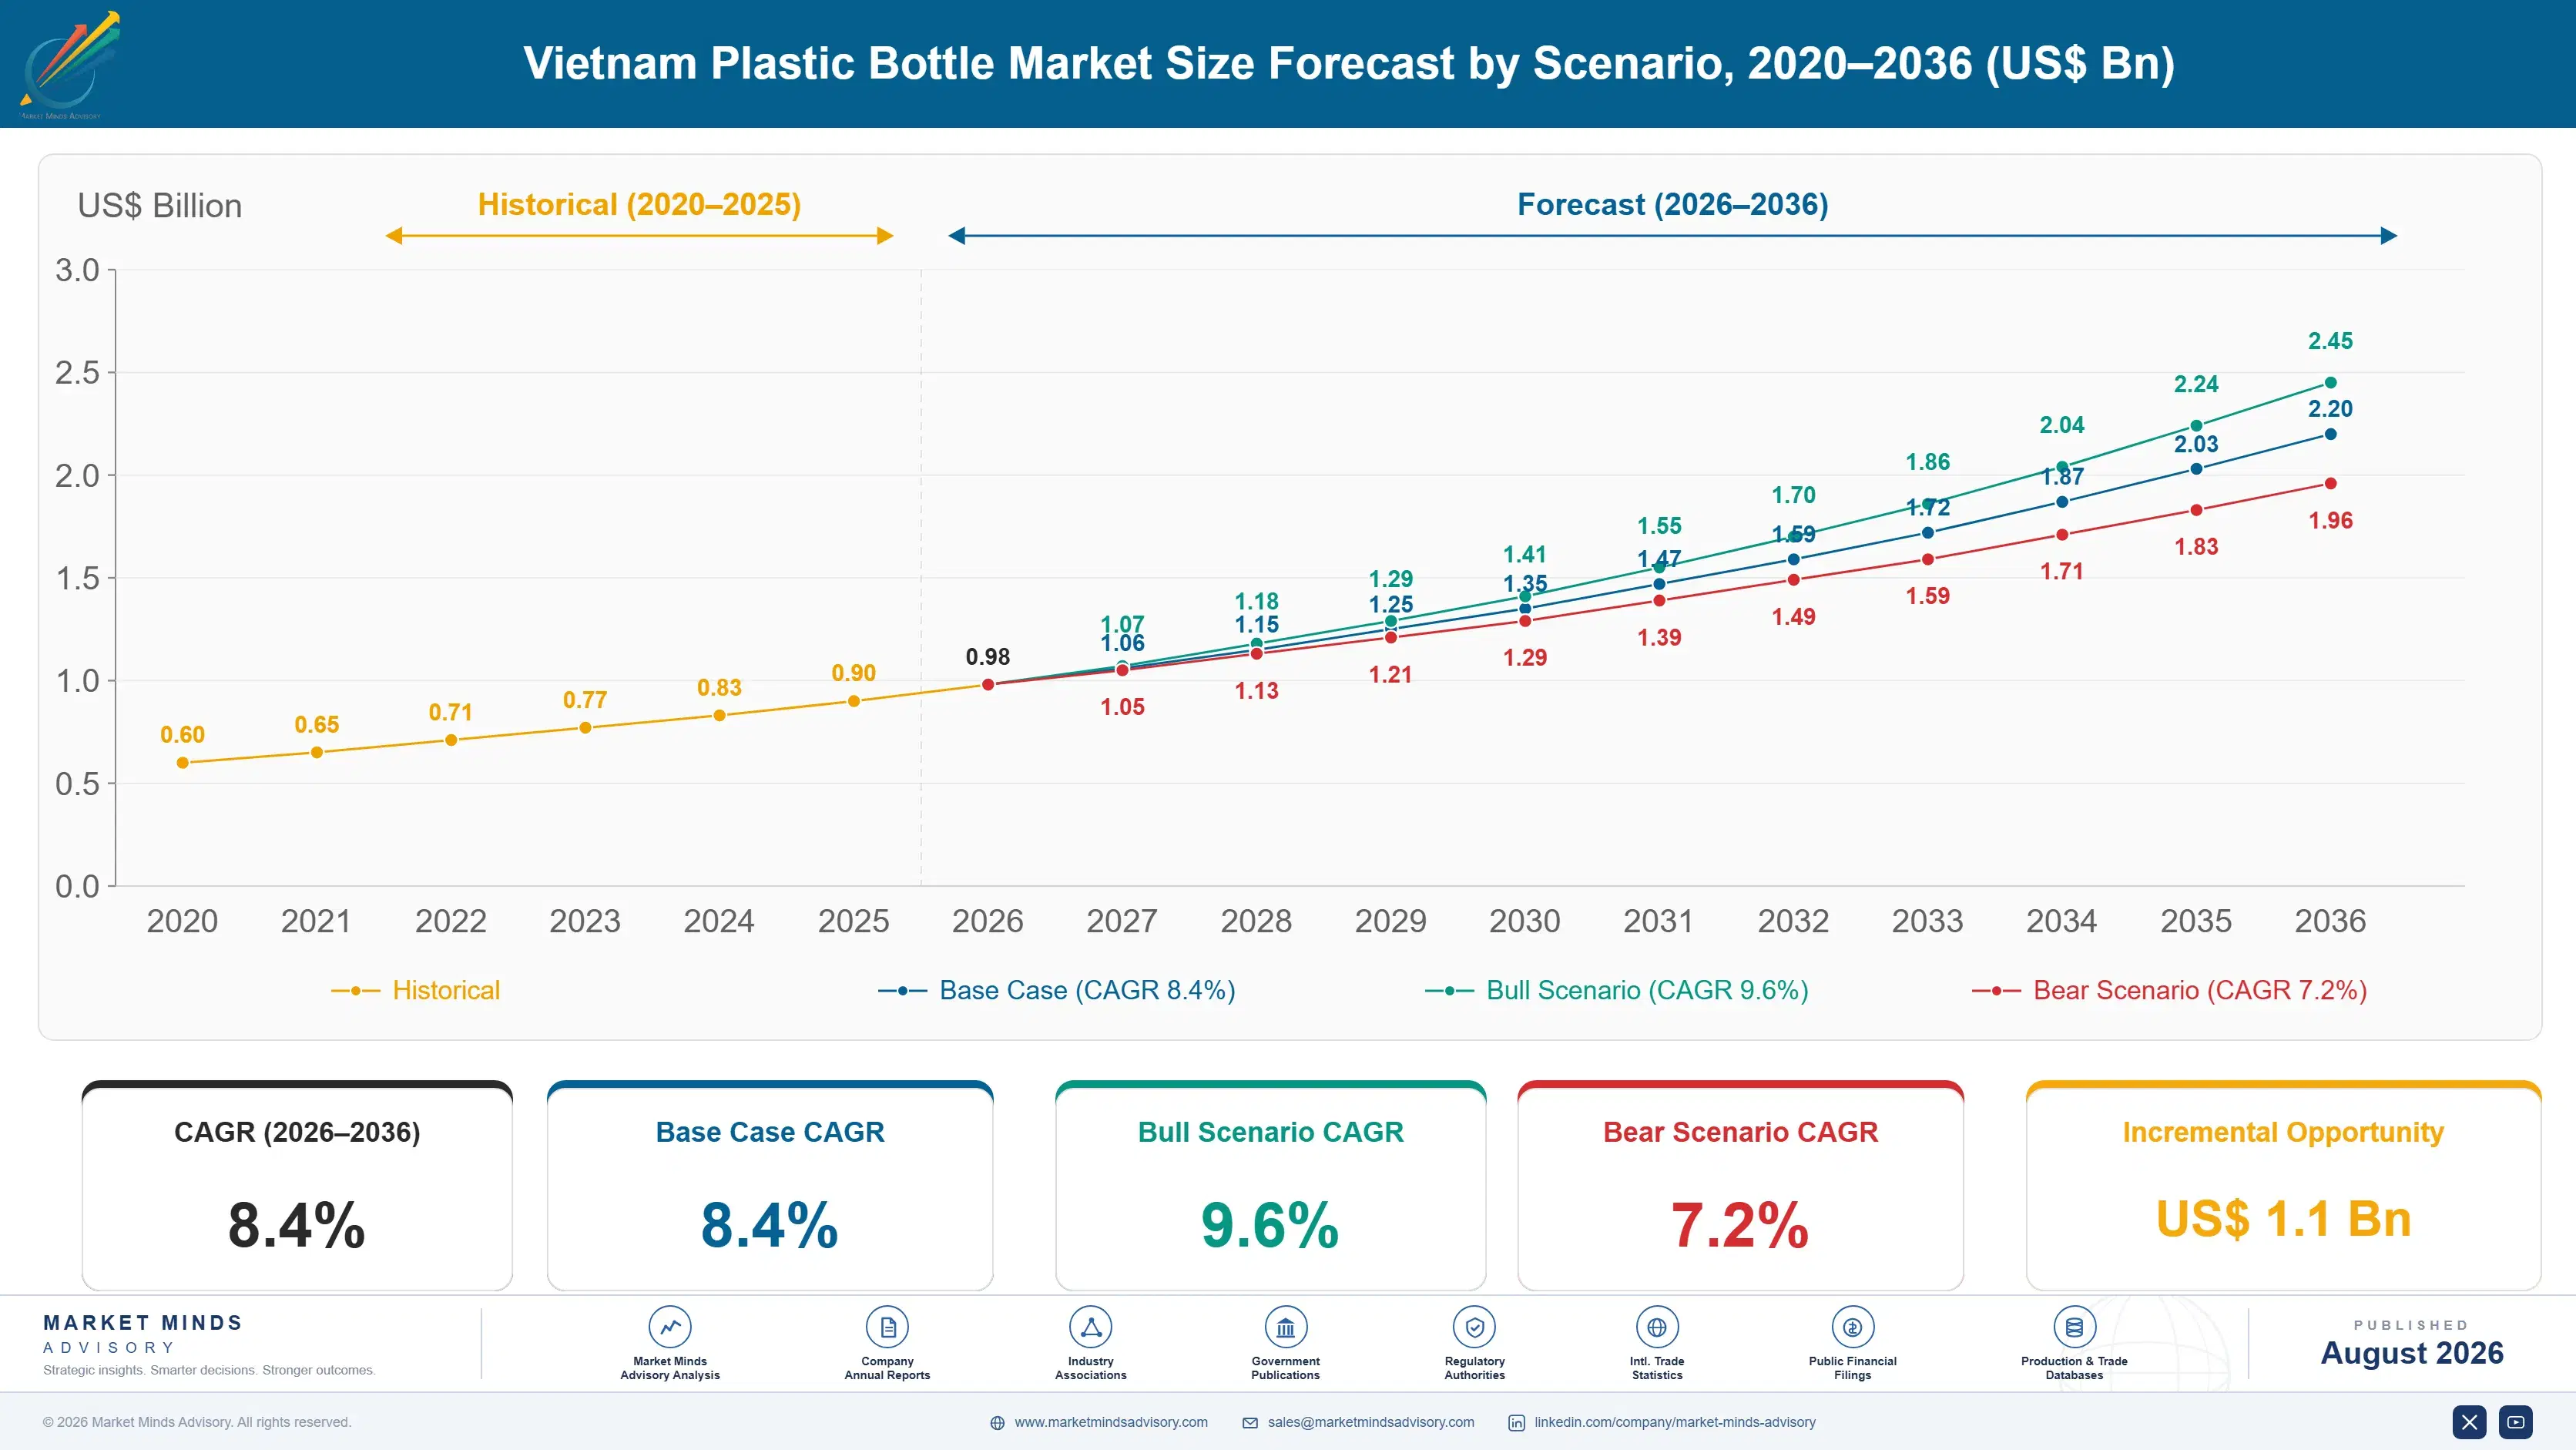
Vietnam Plastic Bottle Market Forecast Scenarios

vietnam-plastic-bottle-market-size-forecast-scenario-1787641601861
The five years to 2025 were shaped by resin prices and by brand owner commitments arriving together. Polymer costs swung violently on energy and feedstock movements while multinational customers introduced recycled content targets that Vietnamese converters had no certified supply to meet. Domestic consumption of packaged beverages and personal care products grew steadily throughout. The 7.2% historical rate reflects volume growth against margin that moved with somebody else's resin market.
The 8.4% base case rests on three mechanisms. Packaged beverage and personal care consumption keeps rising with urban incomes, and bottle volume follows household consumption closely in a market where formal retail is still expanding. Multinational recycled content commitments keep pulling investment into certified food grade recycling capacity that barely existed five years ago. And barrier formats keep taking dairy, juice and sauce volume from containers that cannot deliver the shelf life required.
The 9.6% bull case turns on food grade recycling capacity expanding fast enough to serve brand owner commitments domestically rather than through imported recyclate. The 7.2% bear case is resin volatility combined with annual customer pricing: a converter holding fixed price contracts through a polymer spike absorbs the entire movement, and several have done exactly that.

Converting on Somebody Else's Polymer

The economics of this industry are set elsewhere. Roughly 94% of bottle grade PET and HDPE arrives imported from Thailand, South Korea, China and the Gulf, priced in dollars against contracts negotiated abroad, and resin represents about 68% of finished bottle cost. A Vietnamese converter therefore earns a spread rather than a manufacturing margin, and the spread moves with polymer markets and exchange rates nobody here influences.
TOP FIVE CONCENTRATION42%Combined bottle volume supplied by the largest converters
RESIN COST SHARE68%Portion of finished bottle cost sitting in polymer
IMPORTED RESIN DEPENDENCE94%Bottle grade polymer arriving from outside the country
INFORMAL PET RECOVERY RATE82%Beverage bottles collected through the informal waste networks
FOOD GRADE RECYCLING CAPACITY31%Recovered material meeting certified food contact grade standards
MULTINATIONAL SPECIFIED SHARE58%Volume produced to specifications written outside the country
Recycling presents an unexpected picture. Informal waste picker networks recover roughly 82% of beverage PET, a rate exceeding several European municipal systems, because the material has genuine resale value and collection is somebody's livelihood rather than a municipal obligation. Only around 31% of recovered material meets certified food contact standards, though. The constraint is washing capacity, decontamination technology and traceability documentation rather than any shortage of bottles.
Specification authority sits outside the country for most of the volume. Around 58% of bottles are produced to designs, weights and recycled content requirements written into a multinational brand owner's global policy, audited to standards set at head office. Converters meeting those standards access premium volume and considerably tighter compliance obligations. Those that cannot supply domestic brands at thinner margins on shorter contracts.
"Everyone assumes the recycling problem here is collection. Walk through any city at night and you will see the collection working better than most of Europe manages. The problem is that nobody can prove where a flake came from."
Director, Packaging and Circular Materials Practice · MMA Packaging and Materials Practice · August 2026

Market Trends

Certified Recyclate Scarcity Blocks Brand Owner Commitments

Informal networks recover roughly 82% of beverage PET, which is a genuinely high rate, yet only around 31% of that material reaches certified food contact grade. The gap is washing capacity, decontamination technology and above all traceability documentation that an international audit demands, since a brand owner cannot claim recycled content it cannot evidence. Converters are investing in certified recycling capacity or importing recyclate at a premium, both of which raise cost. Material availability was never the constraint and describing it that way has misdirected investment for several years. Nobody looked at the certification end.
Market Impact: Ho Chi Minh City grows 11.4%
Barrier Formats Take Dairy and Juice From Simpler Bottles

Vietnamese dairy, juice and sauce categories increasingly require shelf life and oxygen protection that monolayer bottles cannot deliver, particularly given ambient distribution across a hot country with incomplete cold chain. Multilayer and barrier bottles grow at 12.6% against a market rate of 8.4%, fastest in the market, and the driver is distribution reality rather than premium positioning. Converting capability for multilayer requires different machinery and considerably more process control than standard blowing. That capital requirement concentrates the segment among larger converters and keeps margins better than anywhere else in the category.
Market Impact: Specifications govern 58% of volume

Market Opportunities and Growth Drivers

Urban Consumption Growth Drives Bottle Volume Directly

Packaged beverage and personal care consumption tracks urban income growth closely in a market where formal retail continues expanding into secondary cities and modern trade keeps taking share from traditional channels. Ho Chi Minh City grows at 11.4%, faster than anywhere else covered, on population, income and retail density together. Bottle volume follows household consumption almost directly, since packaging formats change slowly once a category establishes them. The relationship is unusually predictable, which makes capacity planning here easier than in most converting markets anywhere. Formats change slowly once a category settles them.
Market Impact: Imports supply 94% of resin

Multinational Sustainability Policy Sets Domestic Specification

Around 58% of bottle volume is produced to specifications written in a global brand owner policy covering weight, recycled content, colourant restriction and design for recycling. Those requirements arrive as instructions rather than negotiations, and a converter either invests to meet them or loses the account to somebody who did. Compliance requires certified recyclate, documented traceability and audit readiness that domestic customers never ask for. Converters that invested early hold premium volume on longer contracts, and the gap between them and everybody else keeps widening. The gap between compliant and non compliant converters keeps widening.
Market Impact: Resin is 68% of bottle cost

Market Restraints and Challenges

Imported Resin Leaves Converters Holding Currency Risk

Roughly 94% of bottle grade polymer is imported and priced in dollars while bottles are sold in dong on annual customer contracts, so a converter carries both commodity and currency exposure on a component representing about 68% of cost. The root cause is that Vietnam has almost no domestic PET or HDPE production capacity and building it requires petrochemical investment at a scale nobody has committed. Commercially this makes a converter a spread taker. Responses include indexation clauses, forward purchasing and inventory positioning, none of which removes the underlying dependence.
Market Impact: Only 31% reaches food grade

Annual Contract Pricing Absorbs Every Resin Movement

Multinational customers negotiate annual pricing and expect it to hold, while resin moves quarterly or faster on energy and feedstock, which leaves the converter absorbing the entire difference across a component worth 68% of cost. The root cause is that packaging is a small line in a brand owner's cost structure and renegotiation costs more attention than it saves. Commercially a single bad polymer year erases several good ones. Converters respond with indexed contracts where customers permit, and with resin inventory positions that are effectively unhedged directional bets. Inventory positions are unhedged directional bets.
Market Impact: Barrier formats grow 12.6% annually
3 additional market trends, 4 additional growth drivers, and 2 additional restraints and challenges are covered in the full report. Contact sales@marketmindsadvisory.com to access the complete intelligence.

Segment CAGR and Growth Architecture

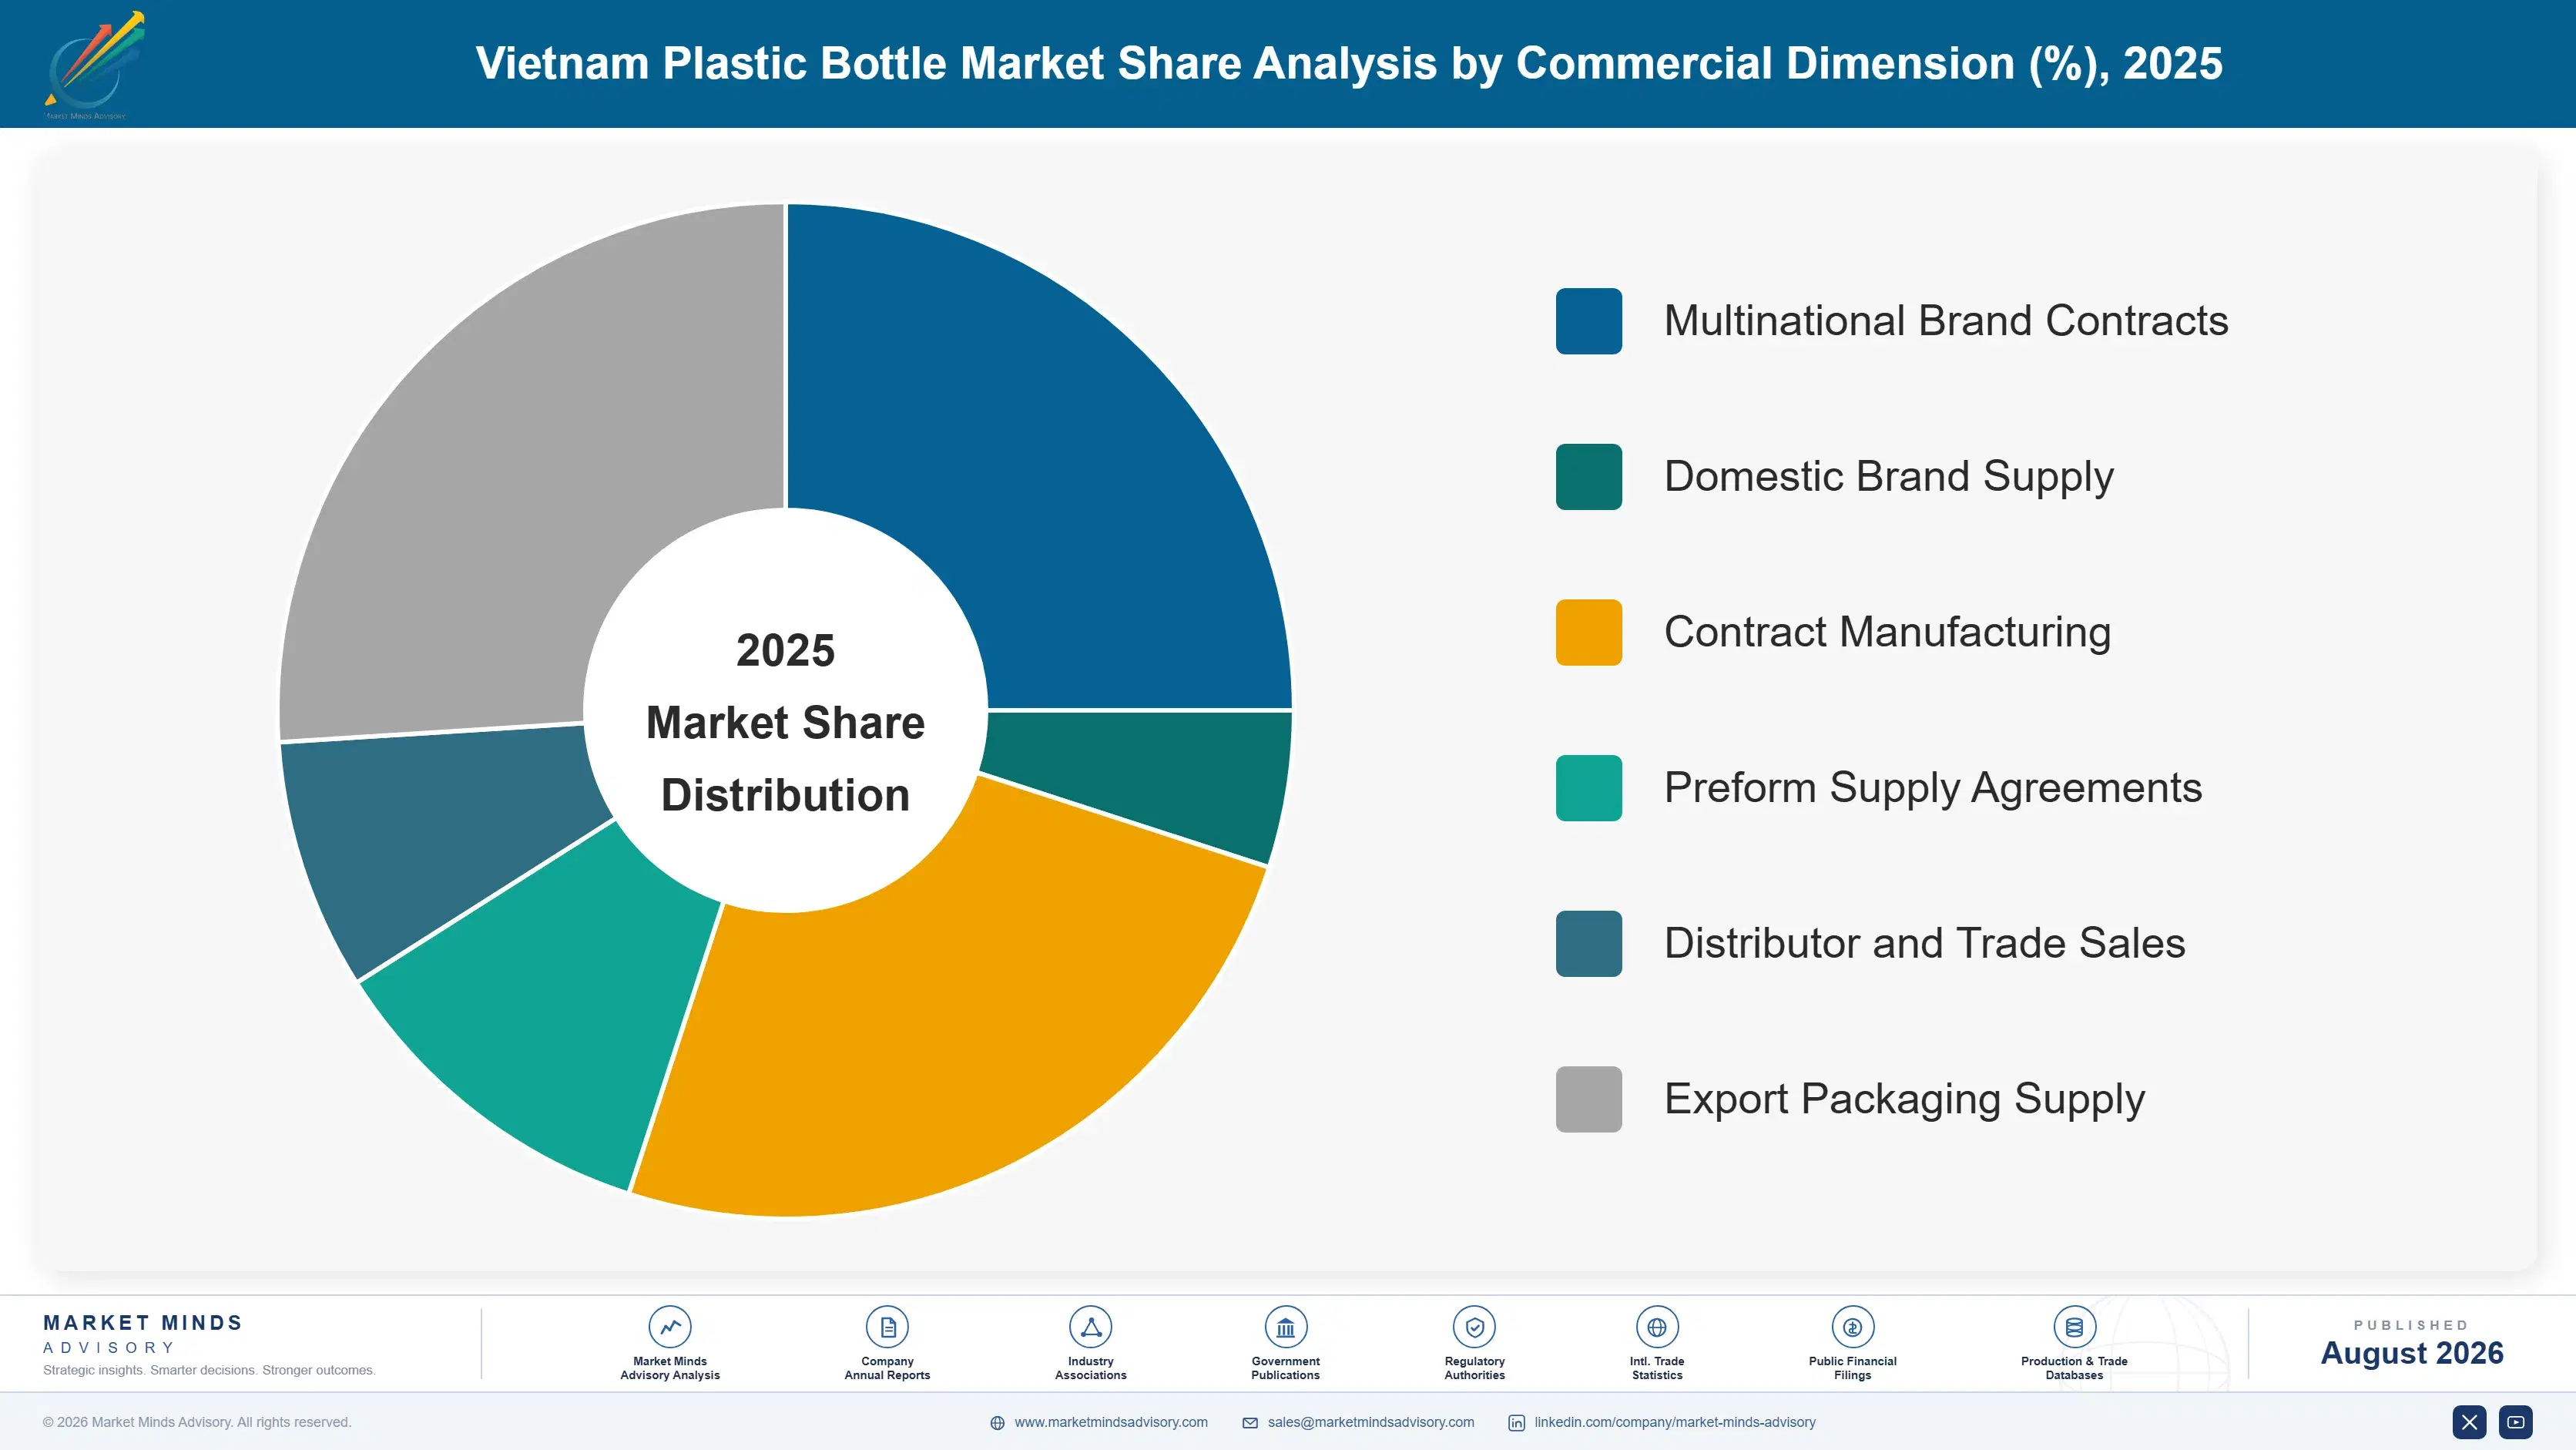
Segmentation follows product format, since format determines resin type, machinery required, customer category and margin. Six formats cover Vietnamese bottle output, from a standard PET beverage bottle to a multilayer barrier container for ambient dairy. Growth follows shelf life requirements and brand owner specification rather than any change in consumer preference. Consumer preference changes nothing.
vietnam-plastic-bottle-market-market-share-analysis-1787641602427

Multilayer and Barrier Bottles

Co-extruded and coated containers providing oxygen and light protection for dairy, juice, sauces and nutritional products distributed at ambient temperature across a hot country with incomplete cold chain. At 12.6% this is the fastest growing format in the market, half again the market rate of 8.4%, and distribution reality rather than premium positioning drives it. Multilayer conversion requires different machinery, tighter process control and considerably more technical capability than standard blowing, which concentrates production among larger converters. Margins are the best available in the category because few competitors can produce to specification consistently, and brand owners will not compromise on shelf life in this climate. Shelf life is not negotiable in this climate.
CAGR 12.6%

Preforms Supplied for Third Party Blowing

Injection moulded PET preforms sold to beverage fillers who blow bottles on their own lines, which removes bottle transport from the equation entirely since a preform occupies a fraction of the volume. Growth of 10.8% is second fastest in the market, driven by fillers investing in in house blowing to cut logistics cost across a country whose geography makes bottle freight expensive. The economics suit a converter well, since preform manufacture is capital intensive and technically demanding while transport cost falls dramatically. It also deepens the customer relationship, because a filler with installed blowing equipment is committed to a preform specification. A filler with installed equipment stays committed to that specification for years.
CAGR 10.8%
Full segment breakdown across 6 segments available in the complete report.

Regional Architecture and Country Demand Map

South Asia and Pacific holds 87% of the market by definition, since scope covers Vietnamese production and consumption. Remaining shares represent resin supply origins and export destinations rather than demand. Ho Chi Minh City grows fastest of any market covered. Specification authority sits abroad. Resin origin decides input cost.

South Asia and Pacific

Scope places this market here entirely, so the 87% share sits far outside the standard band by construction and everything else represents supply origin or export destination. Within Vietnam, Ho Chi Minh City and the surrounding southern industrial provinces carry the largest converting capacity and the densest consumption, growing at 11.4%, faster than anywhere covered. Hanoi and the northern provinces follow with a different customer mix weighted toward dairy and household products. Regional neighbours matter commercially: Thai and Indonesian converters compete for multinational contracts on cost, and Thai resin supply reaches Vietnam quickly. Regional growth of 10.6% reflects Vietnamese consumption expansion within a wider Southeast Asian packaging market. Regional converters compete for the same accounts.
Share: 87% | CAGR: 10.6% (2026 to 2036)

East Asia

This 4% share represents resin supply and equipment origin rather than any demand relevant to a Vietnamese scope. Chinese and South Korean petrochemical producers supply a substantial proportion of the bottle grade PET and HDPE arriving in Vietnam, and their pricing and export availability set converter input costs directly. Chinese converting machinery dominates the smaller Vietnamese producers on capital cost, while Japanese and Korean equipment serves the larger multinational supplying converters. Chinese recyclate also reaches Vietnam where domestic certified capacity falls short of brand owner requirements. Growth of 9.4% reflects regional petrochemical and equipment supply rather than any consumption within scope. Export availability from those producers sets Vietnamese input cost directly each quarter.
Share: 4% | CAGR: 9.4% (2026 to 2036)
Regional intelligence for 5 additional markets available in the complete report: North America, Western Europe, Latin America, Middle East and Africa, Eastern Europe. Contact sales@marketmindsadvisory.com.
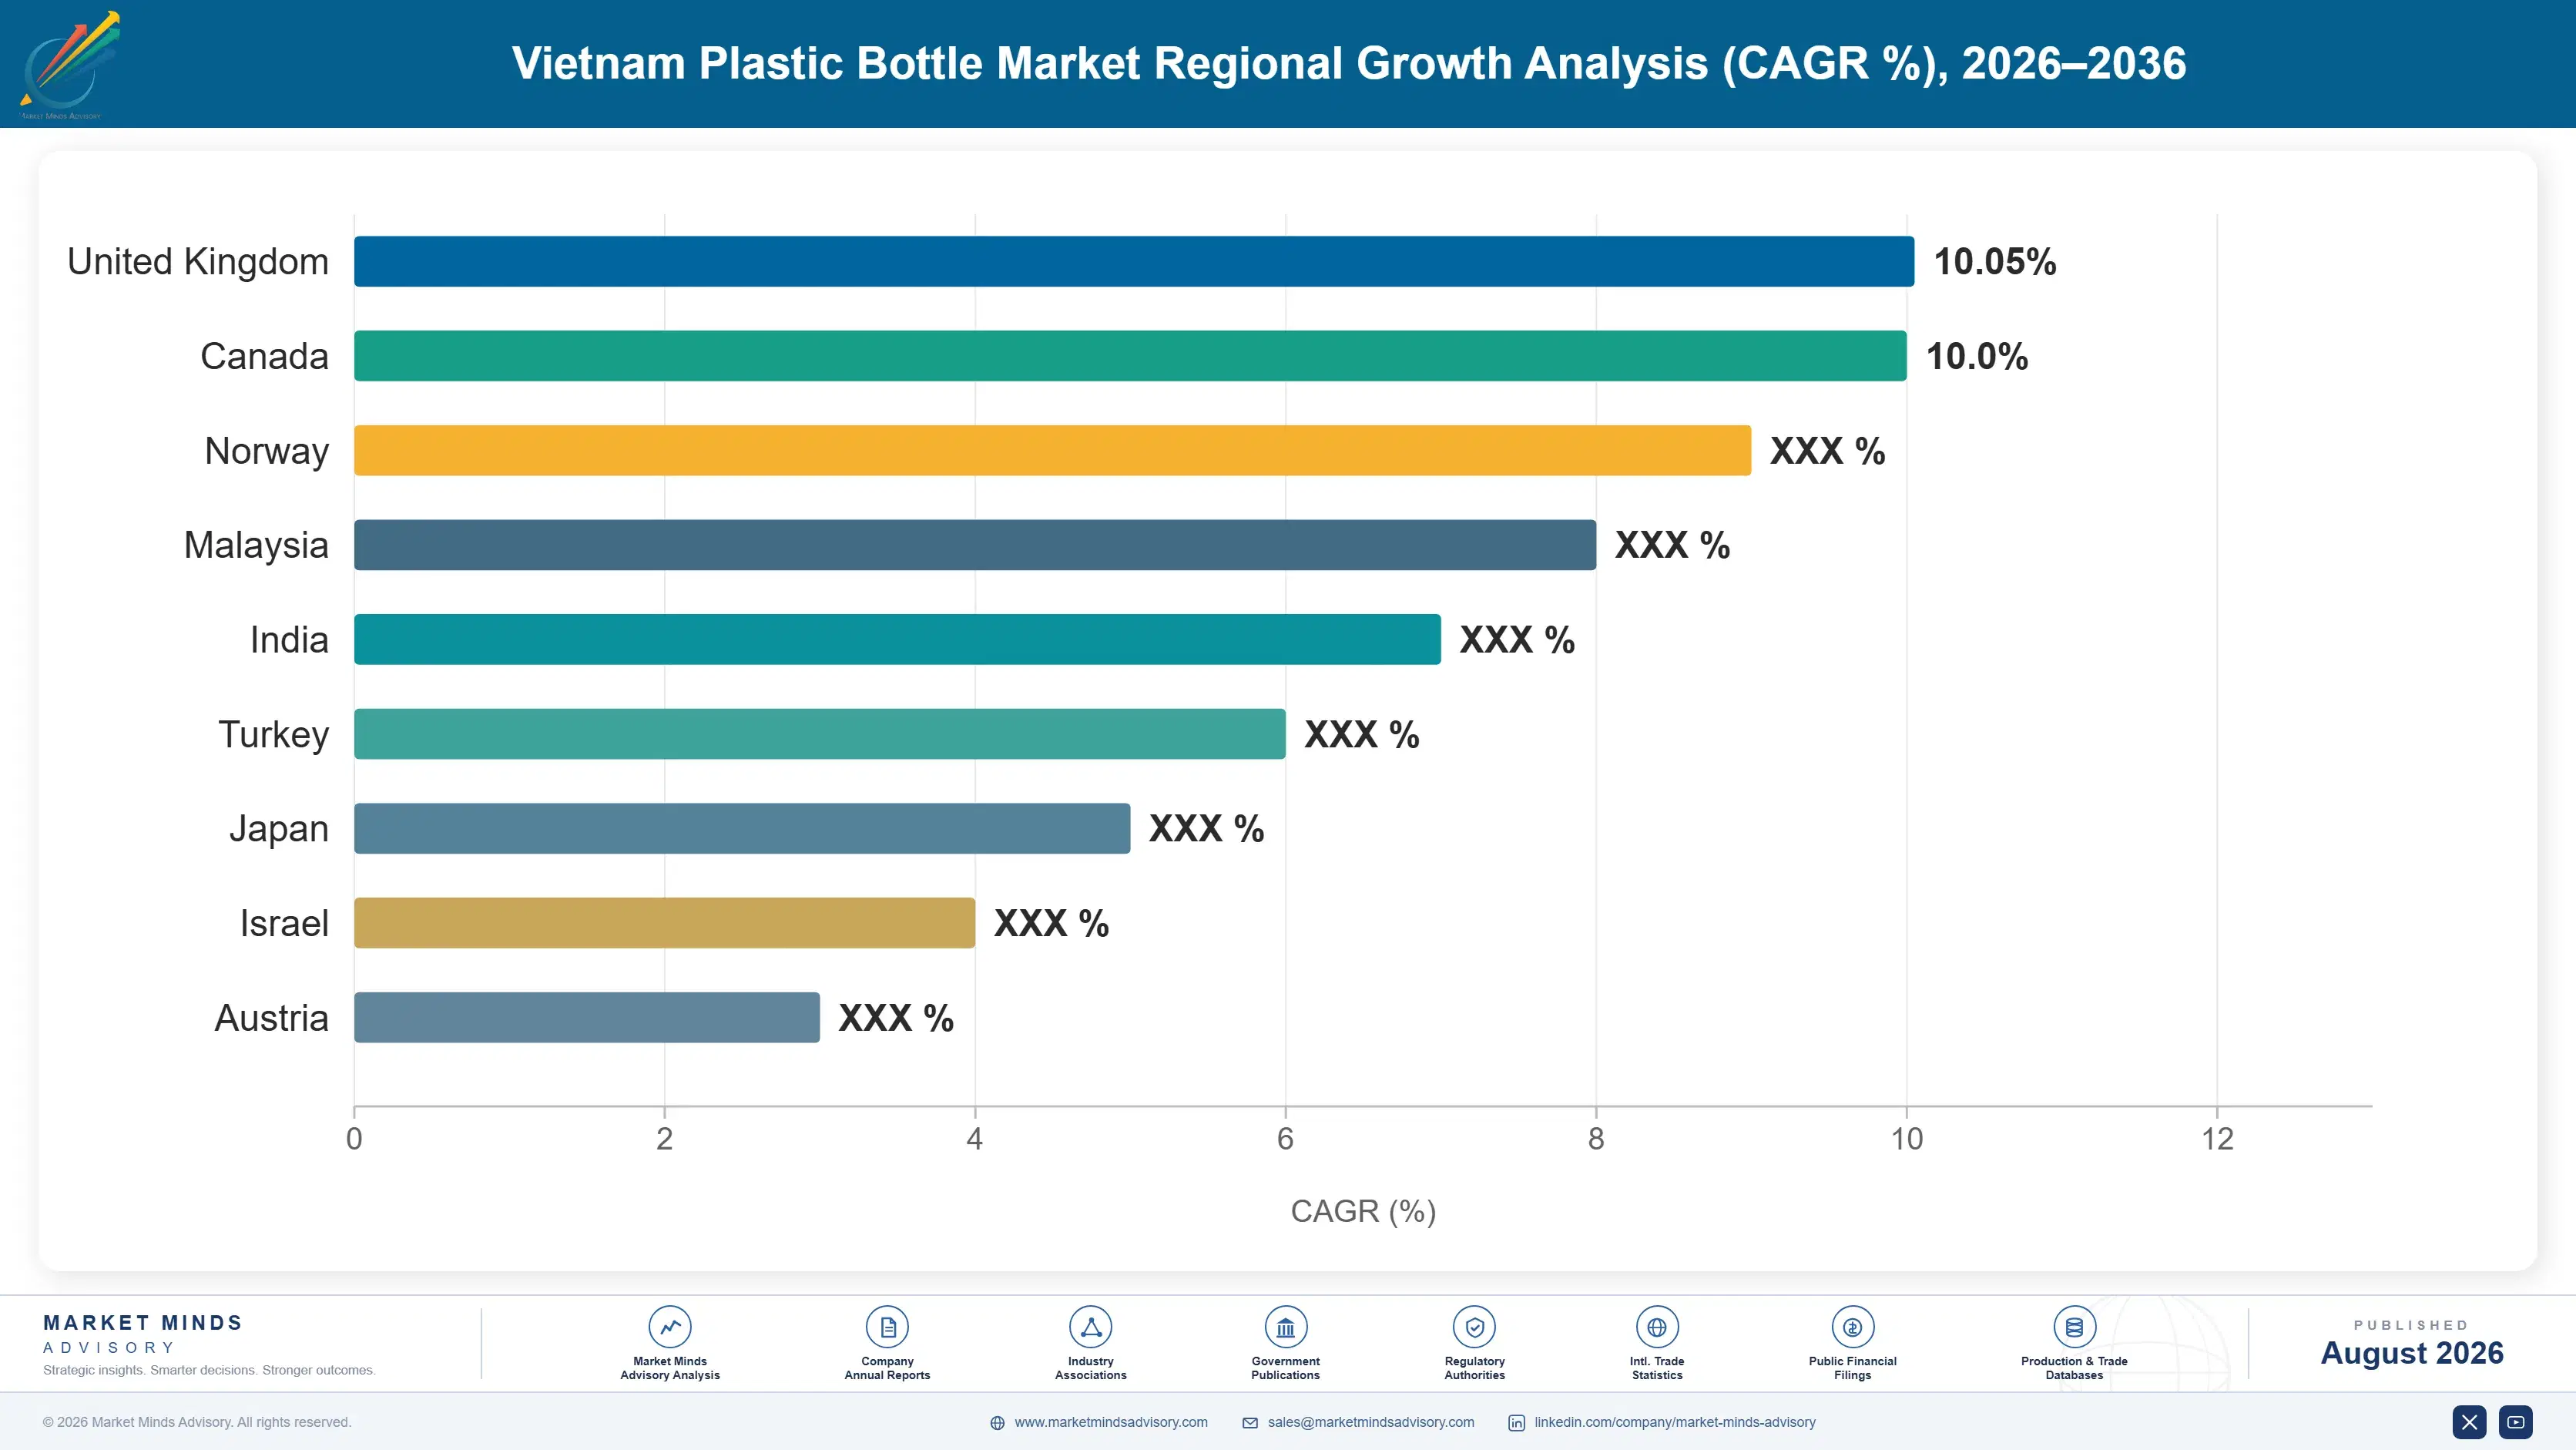
vietnam-plastic-bottle-market-country-cagr-analysis-1787641602971

Where Vietnamese Converters Actually Earn

Nothing here is won on blowing capability, which is widely available and improving everywhere. Value accrues to whoever escapes commodity spread economics, whoever can evidence recycled content to an audit standard, and whoever produces formats few competitors can make consistently. Four routes carry weight, and three of them are about proving something rather than making it.

Build Certified Recyclate Supply Before Competitors Do

Informal networks recover roughly 82% of beverage PET while only around 31% reaches certified food contact grade, and the gap is washing, decontamination and traceability documentation rather than material availability. Brand owners cannot claim recycled content they cannot evidence, so certified supply commands a premium and secures volume regardless of price. Converters investing in certified capacity or in verified collection chains hold something competitors cannot assemble quickly. Everyone describing this as a collection problem has been looking at the wrong end of the process for several years. Certification is the whole problem.
Market Impact: Closes the gap between 82% and 31% recovery

Move Into Formats Few Competitors Can Produce

Multilayer and barrier bottles grow at 12.6% against a market rate of 8.4% because ambient distribution across a hot country with incomplete cold chain demands shelf life that monolayer containers cannot deliver. Production requires different machinery, tighter process control and technical capability that concentrates the segment among larger converters. Margins are the best in the category for that reason rather than because of any premium positioning. Capital investment here buys a position that resin price movements cannot erode the way they erode standard bottle economics. Machinery capability decides who can bid.
Market Impact: Grows 12.6% at the best available category margins

Index Contracts Against a 68% Cost Exposure

Resin is roughly 68% of bottle cost, imported at 94% and priced in dollars, while customer contracts are annual and denominated in dong. A converter holding fixed prices through a polymer spike absorbs the entire movement across two thirds of its cost base, and a single bad year erases several good ones. Indexation clauses tied to published polymer benchmarks are the only structural answer, and multinational customers accept them more readily than domestic brands do. Converters without indexation are running an unhedged commodity position they never chose. Nobody chose that position deliberately.
Market Impact: Protects the 68% resin share of total cost

Sell Preforms Rather Than Finished Bottles

A preform occupies a fraction of the volume of a blown bottle, which removes most of the freight cost from a country whose geography makes bottle transport expensive relative to the value carried. Preform supply grows at 10.8%, second fastest in the market, as fillers install their own blowing lines to capture that saving. The converter keeps the capital intensive and technically demanding part while shedding logistics, and a filler with installed equipment is committed to a preform specification for years afterwards. Logistics savings fund the switch entirely. Fillers rarely reverse it afterwards.
Market Impact: Grows 10.8% while removing most of freight cost

Who Controls the Margin Pool

This market is fragmented with a clear split running through it. The top five supply 42% of bottle and preform volume into Vietnam, the basis applied consistently here, and the division that matters is between converters audited to multinational standards and those supplying domestic brands. Ngoc Nghia leads on multinational beverage volume, and the distance to smaller converters reflects audit qualification rather than manufacturing scale.
Competition runs on three fronts. Audited converters compete for multinational contracts on certified recyclate supply, traceability and compliance capability rather than on price alone. Domestic focused converters compete on price for local brand volume where no audit applies. International packaging groups with Vietnamese operations compete on global account relationships that were won at customer head offices rather than in Vietnam. Very little overlap exists between them.

Rankings will move as recycled content requirements tighten, since converters without certified supply lose accounts regardless of manufacturing quality. Investment in food grade recycling capacity is the decisive variable and it takes years. The other pressure point is regional competition, with Thai and Indonesian converters bidding for the same multinational contracts on cost bases Vietnamese producers must match.
vietnam-plastic-bottle-market-company-positioning-matrix-1787641603505

Competitive Moat and Risk Dimensions

NGOC NGHIA INDUSTRY

Moat: Multinational Audit Qualification

Long standing qualification to international brand owner audit standards covering traceability, food safety and recycled content documentation gives access to premium volume that smaller converters cannot bid for at any price. Those qualifications took years to establish and are re-audited continuously, which makes them genuinely difficult for a competitor to assemble from a standing start.
NGOC NGHIA INDUSTRY

Risk: Imported Resin Exposure

Roughly 94% of bottle grade polymer is imported and priced in dollars against dong denominated annual contracts, leaving the company carrying commodity and currency risk on about 68% of its cost base. Scale improves purchasing terms marginally and does nothing about the underlying exposure, which no Vietnamese converter can escape.
DUY TAN PLASTICS

Moat: Integrated Recycling Capability

Investment in food grade recycling capacity addresses the constraint that actually limits brand owner recycled content commitments, since only around 31% of recovered material currently reaches certified grade. Holding certified supply internally secures volume from customers who cannot source it elsewhere and converts a compliance obligation into a commercial position.
DUY TAN PLASTICS

Risk: Recyclate Feedstock Competition

Certified food grade recycling capacity attracts competition for the same informal collection streams, and recovered bottle prices rise as more capacity chases the same material. The economics depend on a feedstock spread that narrows precisely as the strategy succeeds, which is an uncomfortable position for a business built on it.

Players Tracked

Prominent Players

Ngoc Nghia Industry
Duy Tan Plastics
An Phat Holdings
Tan Phu Vietnam
SCG Packaging

Other Key Players

Rang Dong Holding
Nhua Sai Gon
Alta Group
Dai Dong Tien
Long Thanh Plastic
Bao Van Plastic
Nam Viet Plastic
Thai Binh Plastic
ALPLA
Amcor
Berry Global
Indorama Ventures
Vinaplast
Nhua Tien Phong
Viet Han Plastic

Recent Developments

FEBRUARY 2025

Food grade recycling capacity commissioned for domestic bottle supply

A Vietnamese converter commissioned certified food grade PET recycling capacity aimed at supplying multinational customers whose recycled content commitments could not previously be met from domestic material. Collection was never the constraint, since informal networks already recover most beverage bottles, but certified and traceable output was.
Signal: Certification rather than collection has been the real binding constraint on recycled content in this market
JUNE 2025

Brand owner tightens recycled content requirement across Asian supply

A multinational consumer goods company raised recycled content requirements across its Asian packaging supply, applying a global sustainability commitment written at head office to converters in markets with very different recycling infrastructure. Vietnamese suppliers without certified recyclate access faced losing volume regardless of manufacturing quality.
Signal: Global commitments arrive as instructions rather than negotiations wherever a brand owner actually holds the account
SEPTEMBER 2025

Beverage filler installs in house blowing to cut freight cost

A Vietnamese beverage producer installed bottle blowing equipment at its filling site and moved to preform supply, cutting transport cost substantially since a preform occupies a fraction of a blown bottle's volume. The converter retained the capital intensive preform business while shedding the logistics burden entirely.
Signal: Shipping air is expensive enough that fillers keep bringing blowing in house wherever volumes justify it

What a Bottle Costs to Convert

Polymer dominates everything else and it arrives from somewhere else. Bottle grade PET and HDPE account for roughly 68% of finished bottle cost of goods, with electricity for injection and blowing adding around 11% and labour, colourant and packaging covering the remainder. Approximately 94% of that resin is imported, principally from Thailand, South Korea, China and the Gulf, priced in dollars against contracts negotiated well outside Vietnam.
PET pricing moved sharply through the period on paraxylene and energy costs, and Vietnamese converters absorbed most of it because customer contracts run annually while resin reprices far more often. EIA petrochemical price series document the underlying feedstock movement, and company annual reports across the packaging sector recorded the margin effect. Electricity costs also rose as Vietnamese industrial tariffs adjusted, which matters for an energy intensive moulding and blowing operation.

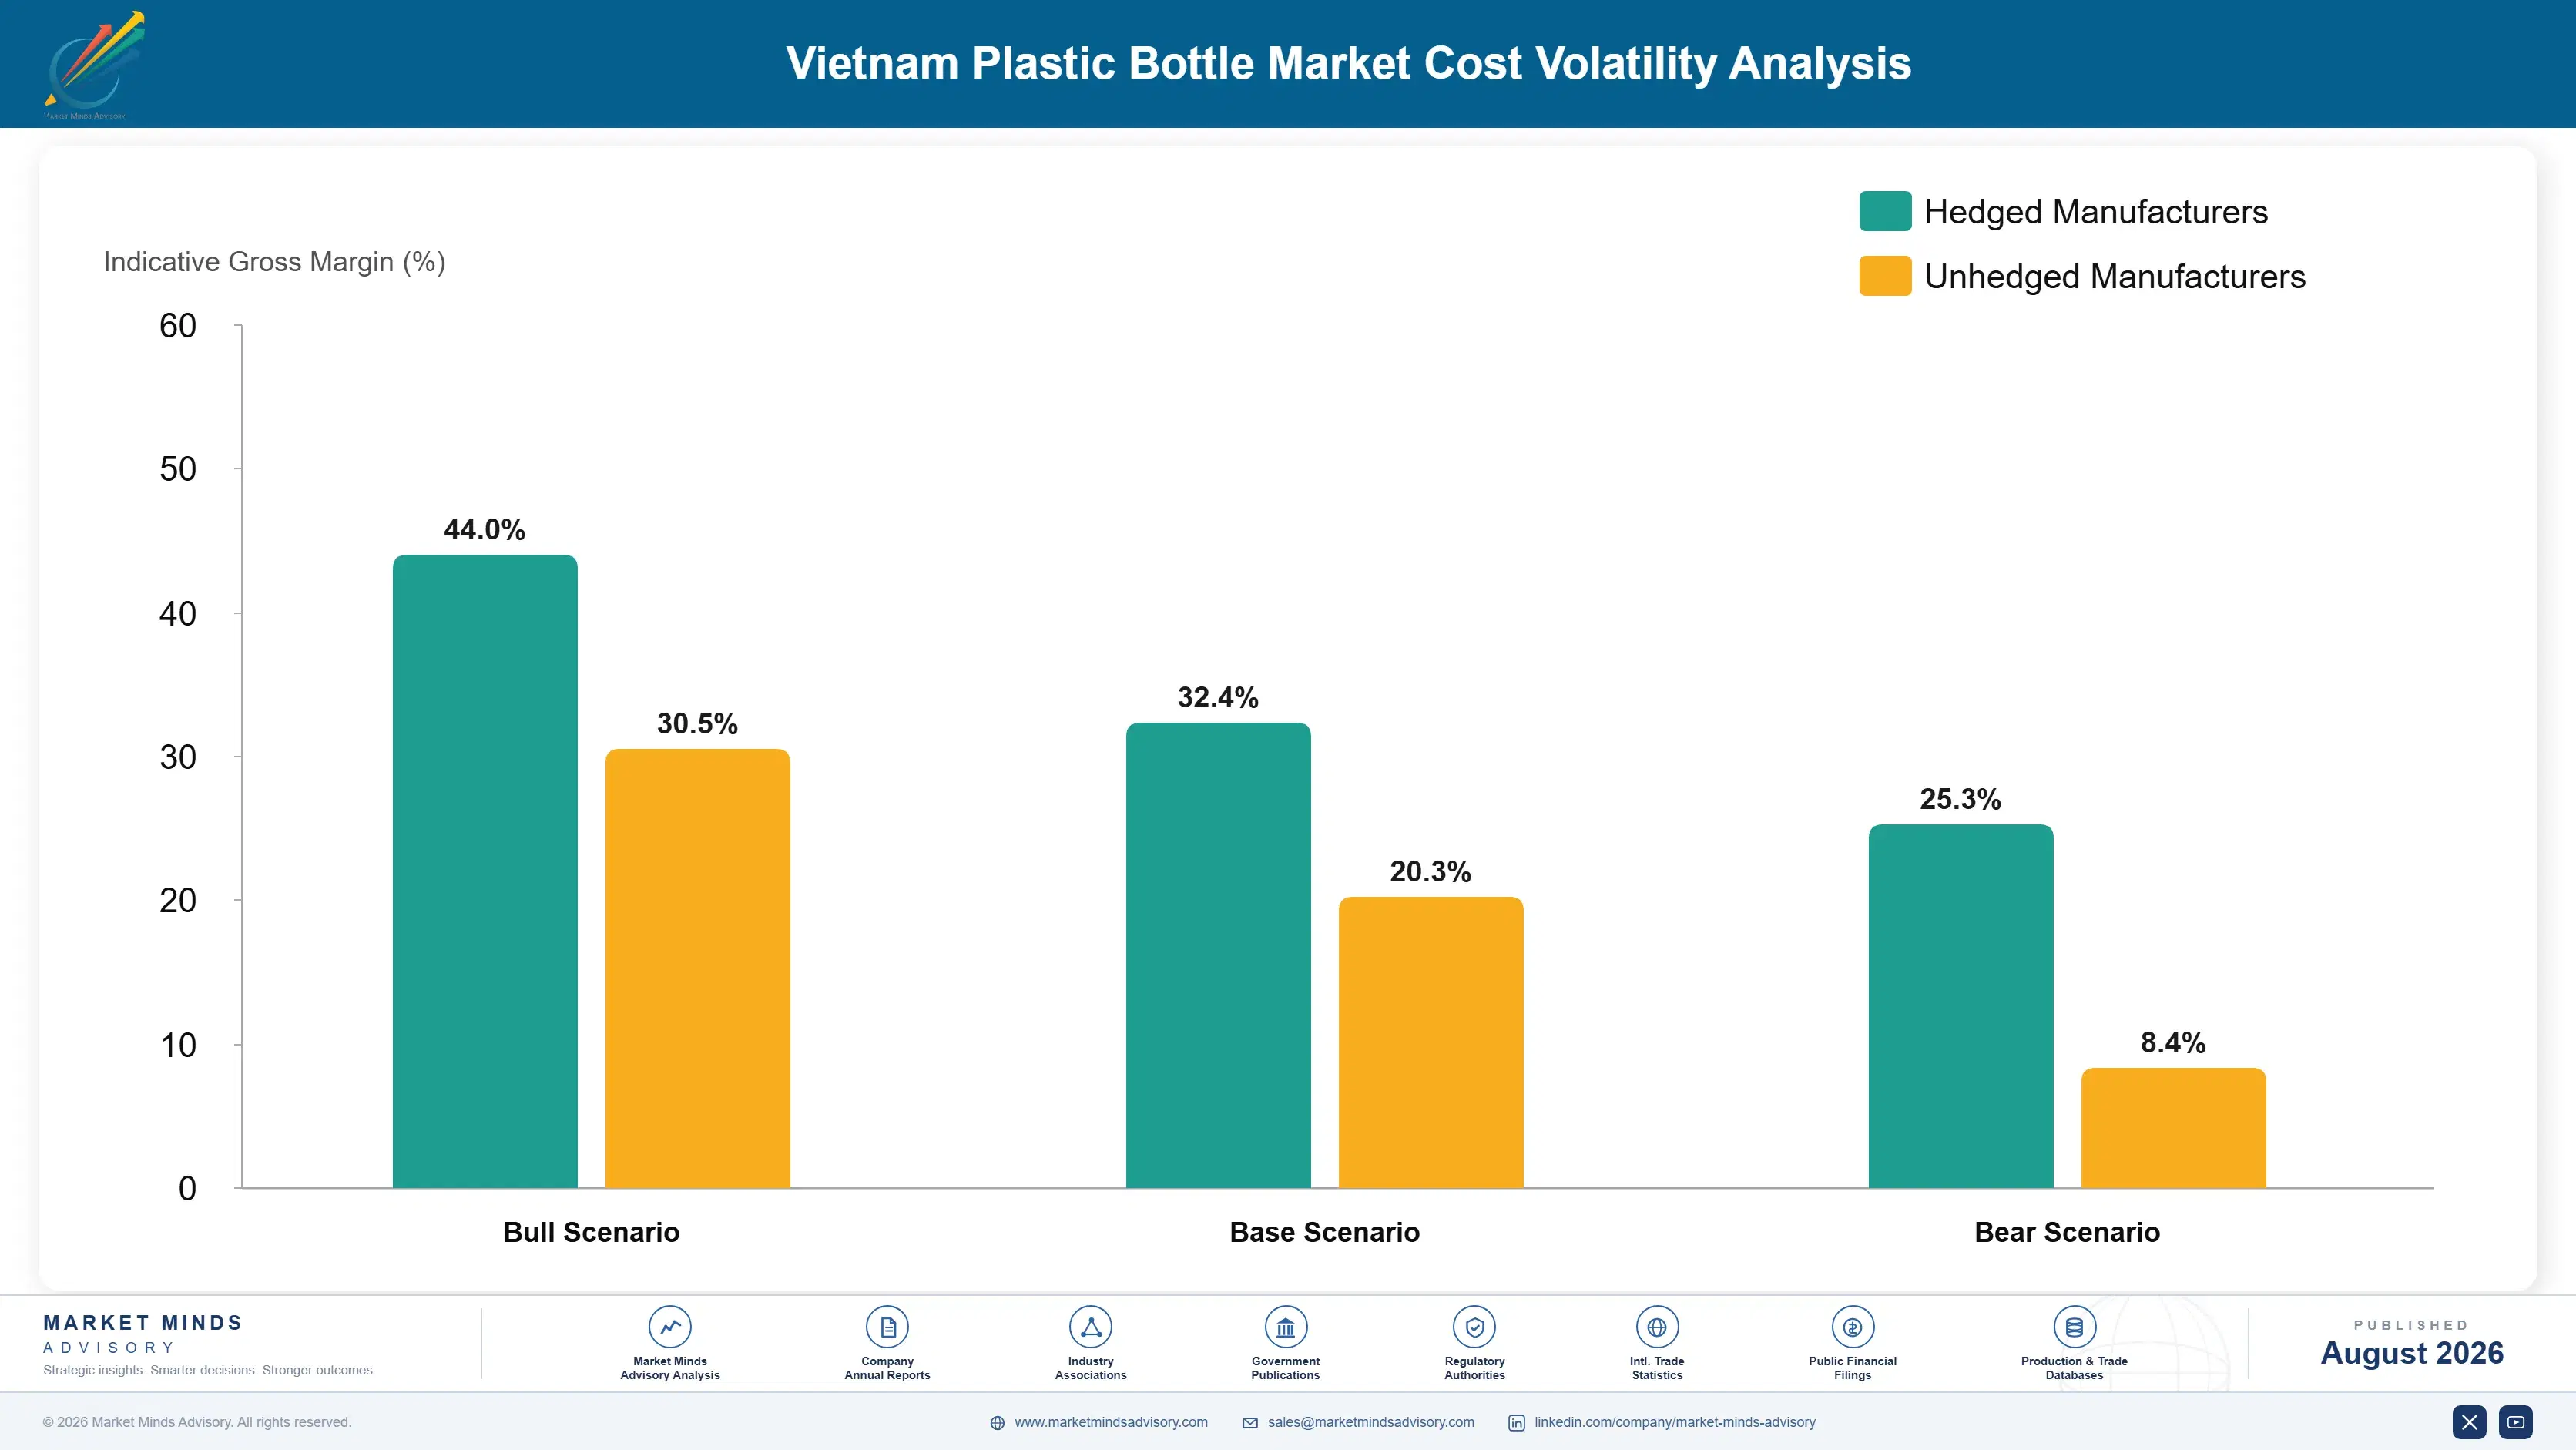
Exposure divides by contract structure rather than by scale. A converter holding indexation clauses passes polymer movement through to customers with a lag, while one on fixed annual pricing absorbs the entire swing across two thirds of its cost base. Multinational customers accept indexation more readily than domestic brands, so audited converters carry less commodity risk as well as better volume.
vietnam-plastic-bottle-market-cost-volatility-analysis-1787641603702

Write polymer indexation into every customer contract

Resin represents roughly 68% of cost and reprices far more often than an annual customer contract does, which leaves a converter absorbing swings it never agreed to carry. Indexation tied to published polymer benchmarks transfers that movement to a formula rather than to a negotiation. Multinational customers accept it far more readily than domestic brands do.

Position resin inventory against known price cycles

Polymer pricing follows feedstock and energy movements predictably across a quarter, and converters holding inventory ahead of a rising market protect margin fixed contracts would surrender. The position is a directional bet rather than a hedge, since no futures market covers these imports. Getting it wrong costs working capital and getting it right funds a difficult year.

Lightweight aggressively where specifications permit

Every gram removed from a bottle removes resin cost directly from the largest line in the bill of materials, and multinational specifications frequently already require it for sustainability reasons. The constraint is that lighter bottles need better process control and tighter machinery, which smaller converters cannot always deliver consistently. The saving reaches the bottom line immediately and permanently once achieved.

Portfolio Architecture for Margin Defence

Margin architecture follows how many converters can produce a given format. Standard PET beverage bottles are made by everybody and priced accordingly, with resin pass through determining whether the business earns anything at all. Preforms earn better because injection moulding is capital intensive and technically harder than blowing. Multilayer and barrier bottles earn best, since few converters produce them consistently and brand owners will not compromise on shelf life.
The tension is between volume that fills a plant and margin that pays for it. Standard beverage bottles carry the overwhelming majority of Vietnamese output and almost none of the profit, while barrier formats carry high margin on a fraction of the volume. A converter shifting entirely toward specialty formats loses the utilisation that makes fixed cost bearable, and one staying with commodity output is a spread taker on somebody else's polymer market.

High value pools concentrate in certified recyclate supply and in barrier formats, both of which competitors cannot quickly replicate. Everything else is exposed to resin pricing set abroad and to regional converters in Thailand and Indonesia bidding for the same multinational contracts. Audit qualification is the boundary, and it takes years to establish.

Standard PET and HDPE Bottles

Monolayer containers produced by every converter in the market and priced against imported resin nobody controls. Volume fills plants and margin depends entirely on whether polymer movement can be passed through to customers.
Gross Margin: 8-11%

Preforms and Audited Supply

Injection moulded preforms and bottle supply produced to multinational audit standards covering traceability, food safety and recycled content documentation. Margin holds on qualification competitors cannot assemble quickly rather than on manufacturing.
Gross Margin: 16-19%

Barrier Formats and Certified Recyclate

Multilayer containers for ambient dairy and juice alongside certified food grade recycled material that brand owners cannot source elsewhere. Margin is the best available because very few competitors can supply either consistently.
Gross Margin: 24-27%
vietnam-plastic-bottle-market-portfolio-architecture-1787641604206

High-value Sub-segments and Strategic Watch-out

Multilayer and Barrier Bottles

The fastest growing format at 12.6% and the best margin in the market, driven by ambient distribution in a hot climate rather than by any premium positioning. Machinery and process control requirements concentrate production among larger converters considerably. Brand owners will not compromise on shelf life anywhere in this climate.
Gross Margin: 24-27%

Preforms for Third Party Blowing

Second fastest at 10.8% as fillers install blowing lines to escape the cost of transporting air across a long country. The converter keeps the capital intensive part and sheds logistics, which suits both parties well. Transporting air across a long country is expensive enough to justify the equipment.
Gross Margin: 16-19%

PET Beverage Bottles

Growing at 7.8% and carrying the bulk of Vietnamese output on margins that depend entirely on passing imported resin movement through to customers. Every converter makes them and nothing distinguishes one supplier's output from another. Resin pass through determines whether the business earns anything at all.
Gross Margin: 8-11%

PP Bottles

Growing at only 5.2% in household and personal care applications where flexible packaging keeps taking share on cost and shelf space. Volume is stable rather than growing and no format innovation is changing that trajectory. Flexible packaging keeps taking share on cost and on shelf space.
Gross Margin: 8-11%

How Bottle Volume Actually Repeats

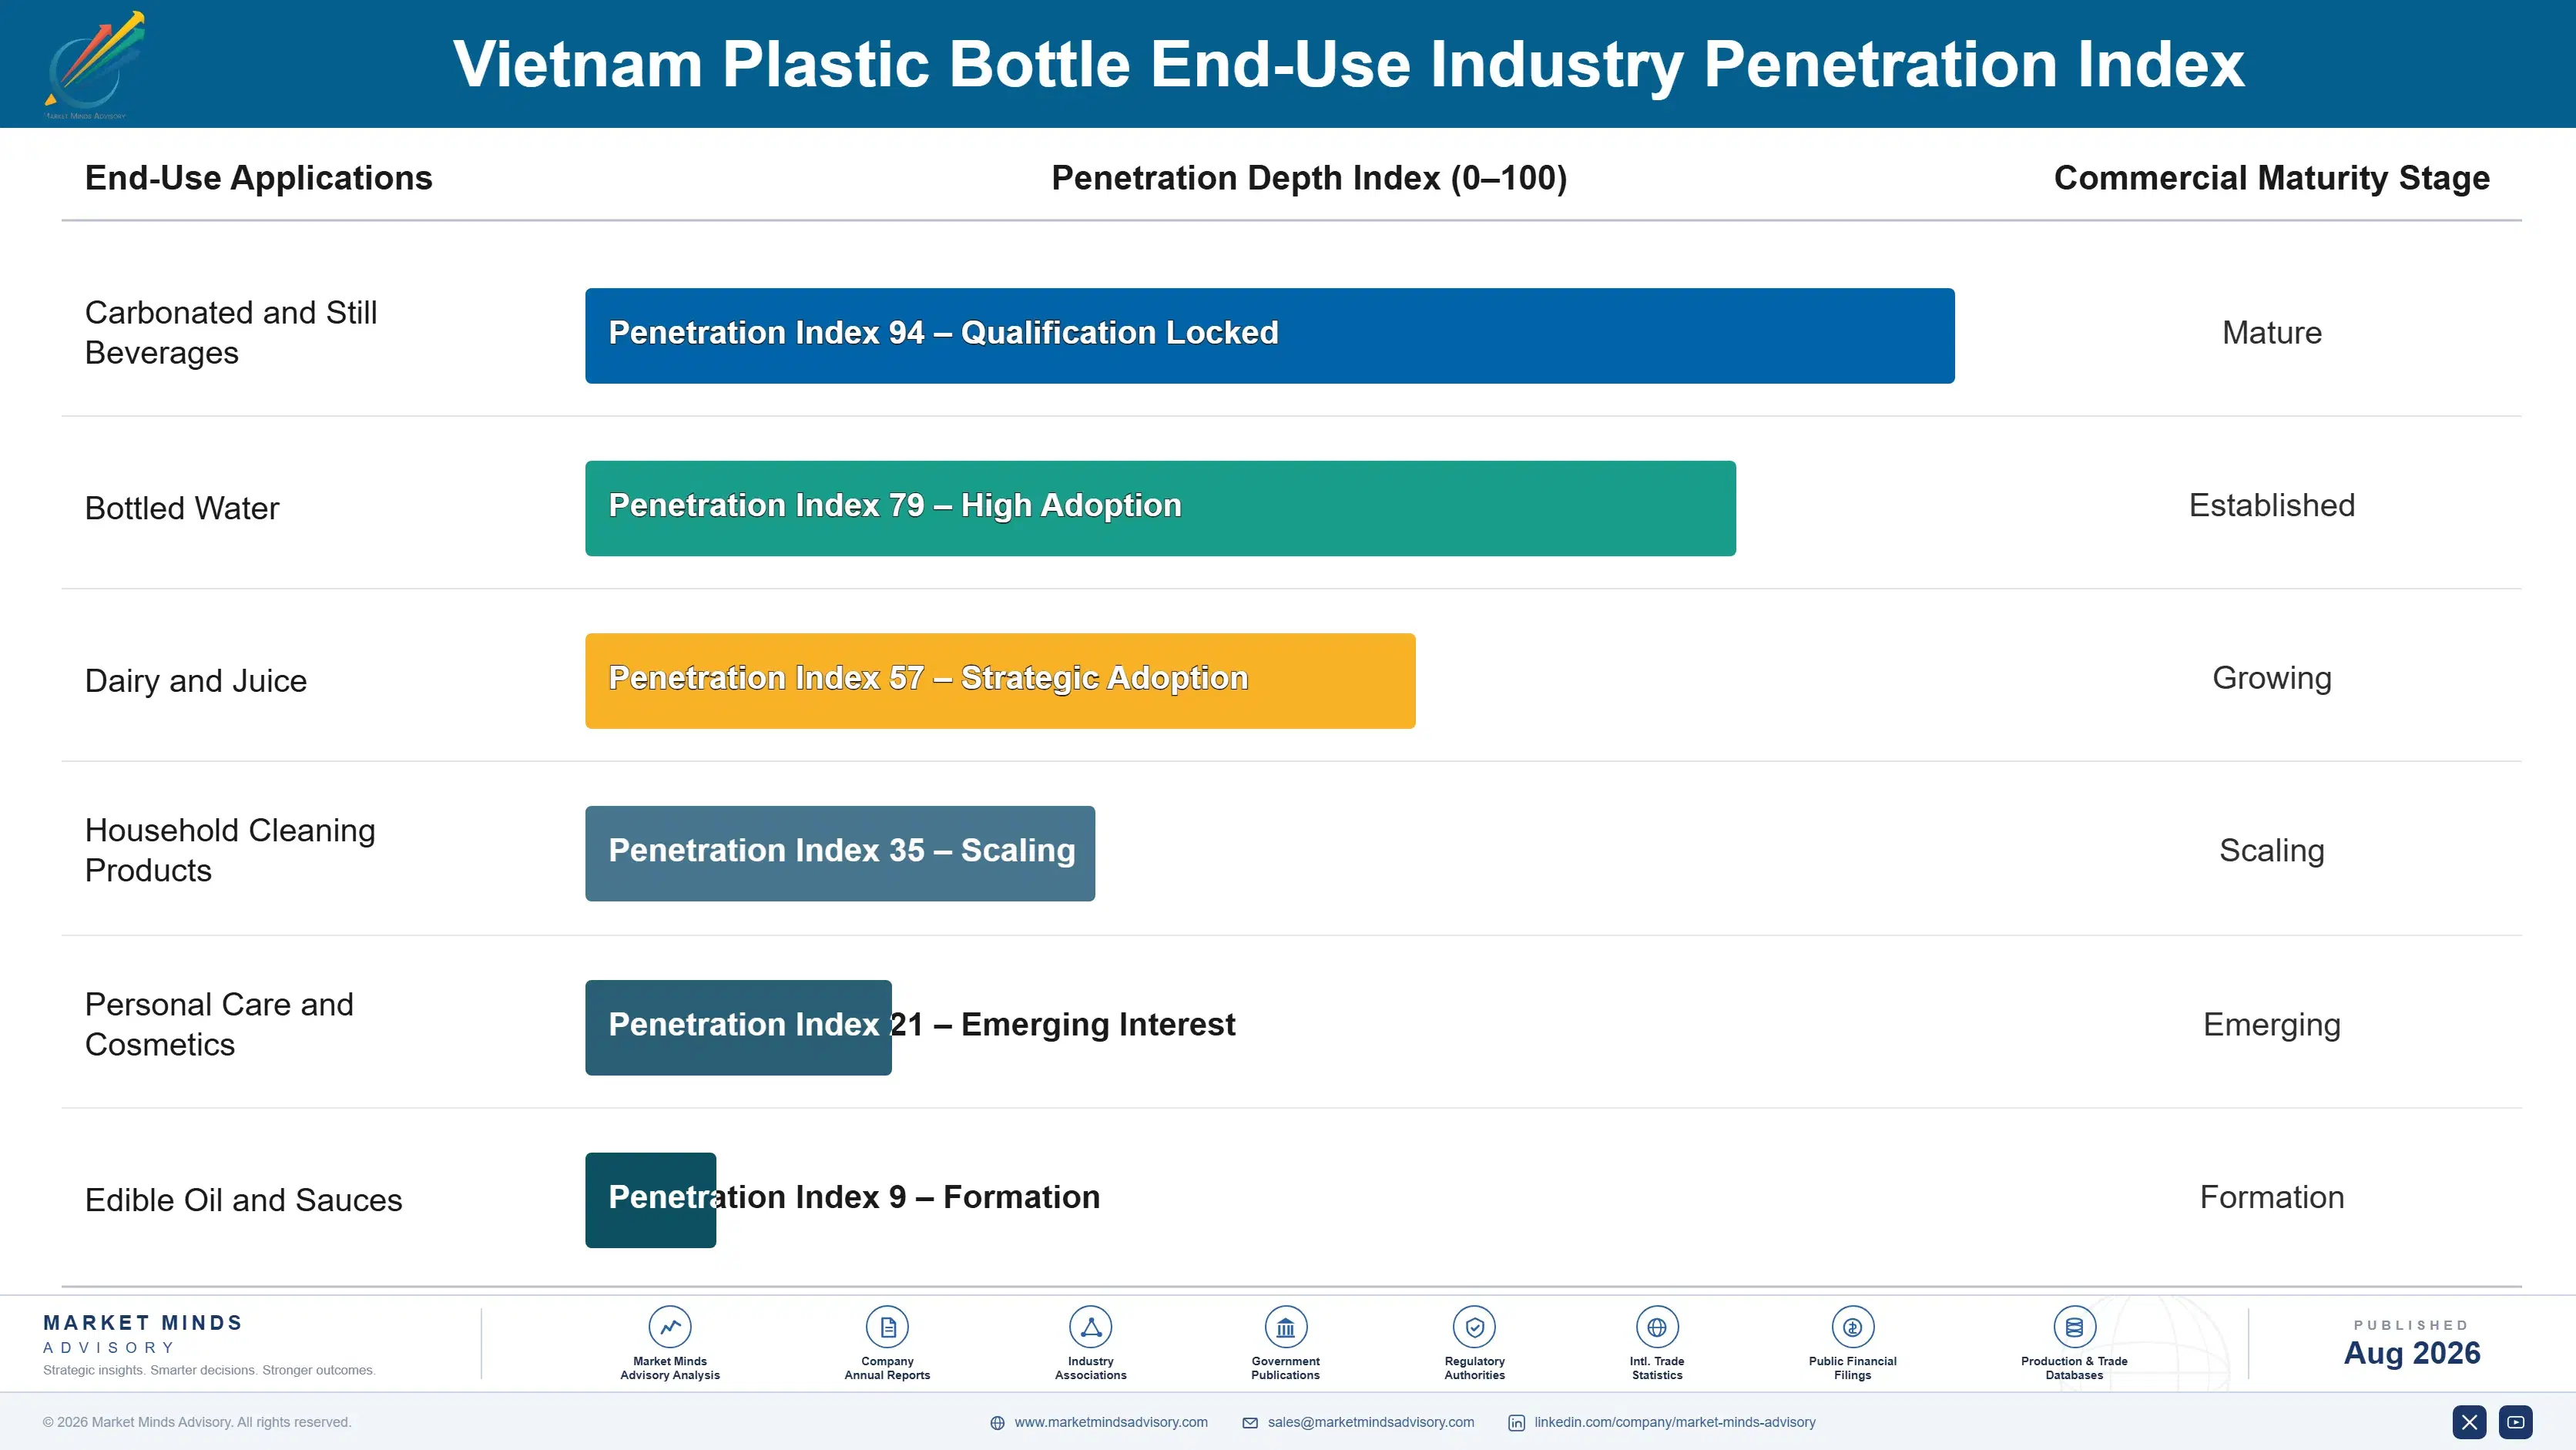
Demand here repeats with a filler's production schedule rather than with any purchasing decision. A converter qualified on a brand owner's specification supplies against forecast volumes week after week, and the qualification rather than the order is what generates revenue. That makes an audited position an annuity tied to the customer's own market share rather than to selling.
Stickiness depends on how the qualification was earned. A converter audited to multinational standards with certified recyclate supply is genuinely difficult to replace, since requalification takes months and the alternatives are few. A converter supplying domestic brands on price competes at every contract renewal against anybody with a blowing machine. Preform customers who installed blowing equipment sit between the two, committed by their own capital rather than by any contract.

The specification moved abroad while the relationship stayed local. Bottle design, weight and material requirements were once negotiated between a Vietnamese converter and a Vietnamese buyer. Roughly 58% of volume now follows a global policy written at a head office, with local teams implementing rather than deciding. Converters whose commercial capability is entirely local are serving a customer whose real decision maker they have never met.
vietnam-plastic-bottle-market-end-use-penetration-index-1787641604737

Where Vietnamese Converters Should Focus

These are among the four positions where our research anticipates prominent divergence between winners and laggards over the coming forecast period. Each is grounded in the demand model, the regulatory perimeter, and the announced capacity pipeline.
01 / CERTIFIED RECYCLATE INVESTMENT

The bottles are collected, the paperwork is missing

Informal waste networks already recover roughly 82% of beverage PET, a rate exceeding several European municipal systems, while only around 31% of recovered material reaches certified food contact grade. The gap is washing capacity, decontamination technology and traceability documentation rather than any shortage of bottles, and brand owners cannot claim recycled content they are unable to evidence at audit. Converters that invested in certified capacity hold something competitors cannot assemble quickly, and everyone describing this as a collection problem has misdirected investment for years.
02 / FORMAT CAPABILITY ESCALATION

Barrier bottles are where resin pricing stops deciding

Multilayer and barrier containers grow at 12.6% against a market rate of 8.4% because ambient distribution across a hot country with incomplete cold chain demands shelf life monolayer bottles cannot provide anywhere. Production requires different machinery and tighter process control, which concentrates the segment among larger converters and produces the best margins in the category. Capital invested here buys a position that imported resin price movements cannot erode in the way they routinely erode standard bottle economics every single year.
03 / CONTRACT INDEXATION DISCIPLINE

Two thirds of your cost is somebody else's market

Resin represents roughly 68% of finished bottle cost, arrives imported at 94% and is priced in dollars, while customer contracts run annually and settle in dong. A converter holding fixed prices through a polymer spike absorbs the entire movement across two thirds of its cost base, and one bad year erases several good ones without any operational failure occurring. Indexation tied to published benchmarks is the only structural answer, and multinational customers accept it considerably more readily than domestic brands do.
04 / AUDIT QUALIFICATION PRIORITY

The specification is written where you have no presence

Around 58% of Vietnamese bottle volume is produced to designs, weights and recycled content requirements written into a multinational brand owner's global policy, arriving as instructions rather than as negotiations with anybody local. Converters meeting those audit standards access premium volume on longer contracts while everybody else supplies domestic brands at thinner margins and shorter terms. That qualification takes years to establish and is then re-audited continuously, which makes it the single most durable competitive position available in this entire industry.

Engagement Snapshot From the Field

A live engagement with an industry participant carrying material or product regulatory and market exposure ahead of a defining policy shift, showing how our research translates into a defensible multi-year portfolio strategy.
MARKET MINDS ADVISORY · CLIENT ENGAGEMENT SUMMARY
Vietnam Plastic Bottle Producer Strategic Portfolio Review and Transition Roadmap 2026·Investment Scenario on Vietnam Plastic Bottle Exposure Evaluation 2025-26
CLIENT PROFILE
A Vietnamese rigid packaging converter operating four blowing and injection sites, supplying PET beverage bottles and HDPE household containers to both multinational and domestic brand customers. Annual revenue was approximately 74 million dollars (client-reported, unverified by MMA), with 81% from standard monolayer formats. No barrier capability existed, no certified recyclate supply was held and most contracts carried fixed annual pricing.
STRATEGIC CHALLENGE
A polymer price movement had eliminated margin across a full contract year, and two multinational customers had signalled that recycled content requirements would soon exceed what the company could evidence. Management wanted to know whether to invest in recycling capacity, barrier capability, or simply improve purchasing. The board regarded resin exposure as an unavoidable feature of the industry.
MMA APPROACH
MMA modelled margin outcomes across three polymer scenarios for indexed and fixed price contract structures, which the company had never compared. Certified recycling and barrier investment options were costed against the volume each would protect or win. Forty-seven expert interviews with brand owner procurement leads, sustainability managers and regional converters established what actually determines supplier selection and how quickly requirements tighten.
KEY FINDINGS
  1. Indexed contracts would have preserved roughly 84% of margin through the polymer movement that fixed pricing surrendered entirely, at no cost beyond negotiation effort.
  2. Brand owner sustainability managers in 34 of the 47 interviews said certified recyclate availability would determine supplier selection within three years regardless of price.
  3. Barrier format capability carried gross margin roughly 2.6 times standard monolayer bottles, and only three converters in the country produced it consistently.
  4. Multinational customers accepted indexation in 9 of 11 contracts where it was requested, while domestic brands accepted it in only 2 of 8 approached.
CLIENT PROFILE
A Vietnamese rigid packaging converter operating four blowing and injection sites, supplying PET beverage bottles and HDPE household containers to both multinational and domestic brand customers. Annual revenue was approximately 74 million dollars (client-reported, unverified by MMA), with 81% from standard monolayer formats. No barrier capability existed, no certified recyclate supply was held and most contracts carried fixed annual pricing.
STRATEGIC CHALLENGE
A polymer price movement had eliminated margin across a full contract year, and two multinational customers had signalled that recycled content requirements would soon exceed what the company could evidence. Management wanted to know whether to invest in recycling capacity, barrier capability, or simply improve purchasing. The board regarded resin exposure as an unavoidable feature of the industry.
MMA APPROACH
MMA modelled margin outcomes across three polymer scenarios for indexed and fixed price contract structures, which the company had never compared. Certified recycling and barrier investment options were costed against the volume each would protect or win. Forty-seven expert interviews with brand owner procurement leads, sustainability managers and regional converters established what actually determines supplier selection and how quickly requirements tighten.
KEY FINDINGS
  1. Indexed contracts would have preserved roughly 84% of margin through the polymer movement that fixed pricing surrendered entirely, at no cost beyond negotiation effort.
  2. Brand owner sustainability managers in 34 of the 47 interviews said certified recyclate availability would determine supplier selection within three years regardless of price.
  3. Barrier format capability carried gross margin roughly 2.6 times standard monolayer bottles, and only three converters in the country produced it consistently.
  4. Multinational customers accepted indexation in 9 of 11 contracts where it was requested, while domestic brands accepted it in only 2 of 8 approached.
RECOMMENDED STRATEGY
Phase 1: Phase one: request indexation on every multinational contract at renewal, since 9 of 11 accepted it when asked and margin protection reaches 84%. Phase 2: Phase two: invest in certified food grade recycling capacity, since 34 of 47 sustainability managers said it decides selection within three years. Phase 3: Phase three: add barrier capability at one site, where gross margin runs roughly 2.6 times standard monolayer output at similar volumes.
OUTCOME
The client secured indexation on seven multinational contracts within a year and committed to certified recycling capacity the following quarter. Margin stabilised through a further polymer movement that would previously have erased it, and barrier capability at one site now supplies two dairy customers the company could not previously serve (client-reported, unverified by MMA).

Frequently Asked Questions

Foundational context covering the market sizes, CAGR, scope, country, region and competition that inform every finding below. This section is provided to cover basics and most often pre-purchase conversations, answered from the MMA Primary Research Dataset.

What is the current size of the Vietnam Plastic Bottle Market?

The market was valued at 0.86 billion dollars in 2025, covering PET, HDPE, PP, barrier bottles and preforms produced and sold within Vietnam. It reaches an estimated 0.93 billion dollars during 2026.

How large will the Vietnam Plastic Bottle Market be by 2036?

MMA forecasts 2.08 billion dollars by 2036, an increase of 1.15 billion dollars over the 2026 base. That represents an expansion multiple of 2.24 times across the forecast period.

What is the CAGR for the Vietnam Plastic Bottle Market 2026 to 2036?

The base case compound annual growth rate is 8.4%, with a bull case of 9.6% and a bear case of 7.2%. Certified recycling capacity and resin volatility separate those scenarios.

Which segment is growing fastest?

Multilayer and barrier bottles grow at 12.6%, half again the market rate of 8.4%, on ambient distribution needs in a hot climate. Preforms for third party blowing follow at 10.8%.

Who are the major companies in the Vietnam Plastic Bottle Market?

Ngoc Nghia Industry, Duy Tan Plastics, An Phat Holdings, Tan Phu Vietnam and SCG Packaging lead on bottle and preform volume supplied. Together they account for 42% of the market.

Which country is growing fastest?

The market is defined as Vietnamese production and consumption, and Ho Chi Minh City grows fastest of any area at 11.4% on population, income and retail density.

Report Segmentation Architecture

The full report scope spans multiple orthogonal segmentation dimensions, with cross-tabulated demand data provided for each dimension pair. Coverage extends further to regional breakdowns, trend trajectories, and the competitive detail needed to support segment-level decision-making.

By Product Format

  • PET Beverage Bottles
  • PET Non-Beverage Bottles
  • HDPE Bottles
  • PP Bottles
  • Multilayer and Barrier Bottles
  • Preforms for Third Party Blowing

By End-Use Industry

  • Carbonated and Still Beverages
  • Bottled Water
  • Dairy and Juice
  • Household Cleaning Products
  • Personal Care and Cosmetics
  • Edible Oil and Sauces

By Commercial Dimension

  • Multinational Brand Contracts
  • Domestic Brand Supply
  • Contract Manufacturing
  • Preform Supply Agreements
  • Distributor and Trade Sales
  • Export Packaging Supply

By Region

  • North America
  • Western Europe
  • East Asia
  • South Asia and Pacific
  • Latin America
  • Middle East and Africa
  • Eastern Europe

Scope, Methodology, and Coverage

Every figure in this report is reproducible from documented input assumptions. The scope below maps the historical period, the forecast horizon, the segmentation dimensions, and the countries covered, alongside the underlying primary and qualitative methodology.
Historical Period
2020 to 2025
Forecast Period
2026 to 2036
Base Year
2025 (USD billions; MMA Primary Research Dataset, August 2026)
Market Definition
Rigid plastic bottles and preforms manufactured and sold within Vietnam, covering PET beverage bottles, PET non-beverage bottles, HDPE bottles, PP bottles, multilayer and barrier bottles, and preforms supplied for third party blowing, in container sizes up to twenty litres. Measured at converter selling value. Industrial drums and intermediate bulk containers above twenty litres, closures and caps, jars and tubs, flexible packaging, resin production and recycling equipment are excluded from scope.
Quantitative Units
USD billions (current prices); bottles and preforms produced; USD per thousand units by format
Segmentation Dimensions
Product format; end-use industry; commercial dimension; region
Regions Covered
North America, Western Europe, East Asia, South Asia and Pacific, Latin America, Middle East and Africa, Eastern Europe
Countries Covered
Vietnam, Thailand, Indonesia, Malaysia, Singapore, Philippines, China, South Korea, Japan, Taiwan, India, Australia, United States, Germany, United Kingdom, France, Brazil, Mexico, Saudi Arabia, Poland
Key Companies Profiled
Ngoc Nghia Industry, Duy Tan Plastics, An Phat Holdings, Tan Phu Vietnam, SCG Packaging, Rang Dong Holding, Nhua Sai Gon, Alta Group, Dai Dong Tien, Long Thanh Plastic, Bao Van Plastic, Nam Viet Plastic, Thai Binh Plastic, ALPLA, Amcor, Berry Global, Indorama Ventures, Vinaplast, Nhua Tien Phong, Viet Han Plastic
Quantitative Methodology
Primary survey, n=3,800 respondents, Q4 2025, six countries; demand-side model with trade association cross-validation
Qualitative Methodology
47 expert interviews, Q4 2025; applied to validate demand model assumptions, identify emerging dynamics, and assess competitive positioning
Report Format
PDF and XLSX data workbook (Word format preview document)
Publisher
Market Minds Advisory
Report Code
MMA-2026-PAC-105
Published
August 2026
Contact
sales@marketmindsadvisory.com | www.marketmindsadvisory.com

Purchase the full Vietnam Plastic Bottle Market Report (2026 to 2036).

The full report treats Vietnamese bottle converting as a spread business rather than a manufacturing one, since imported resin is most of the cost and specifications are written at brand owner head offices abroad. It sizes all six product formats independently through 2036, models margin outcomes across polymer scenarios for indexed and fixed price contracts, and separates recovered material volume from certified food grade availability. Regional chapters cover all seven regions, with resin origin and specification authority assessed separately from Vietnamese demand. Competitive profiling covers 20 participants on one consistent volume supplied basis.
Six product formats sized independently through 2036
Margin modelled across polymer scenarios and contract structures
Recovered volume separated from certified food grade availability
Audit qualification mapped against premium contract access
Resin origin and specification authority assessed separately from demand
Twenty participants profiled on one consistent volume basis

Built For The People Who Decide

From boardroom strategy to bench-side execution, this report is read cover-to-cover by leaders shaping the next decade of their industry, turning demand scenarios, market dynamics and valuation benchmarks into decisions.
CXOs/ Presidents/ VPs/ Managers
M&A and Corporate Development
Strategy Teams and R&D Heads
Procurement and Product Directors
Regulatory and Compliance Leaders
Investor Relations and Equity Analysts