Market Minds Advisory
Veterinary Imaging Market

Veterinary Imaging Market: Second Hand Human Scanners, the Anaesthetic Constraint and an Interpretation Bottleneck

An animal cannot be told to hold still, so the modality that won was the one that shortened the anaesthetic rather than the one offering better soft tissue contrast on any image.

Lead Analyst

Alice Ballenger

Published

September 2026

Make Smarter Decisions with Customized Research Insights

Request a free sample report and evaluate market opportunities, growth trends, and competitive dynamics relevant to your business needs.

2025 MARKET VALUE$2.1BMarket Size 2025
2036 FORECAST VALUE$5.1BBase Case , 2026 to 2036
CAGR 2026 TO 20368.4 %Bull 9.6% / Bear 7.2%
INCREMENTAL OPPORTUNITY$2.8BNet 10- year value creation
EXPANSION MULTIPLE2.24x2036 value over 2026 base
Strategic Levers
M&A Pipeline
Regional Outlook
Country Rankings
Competitive Intelligence
Segmental Deep-dive
Call-Us : 91 93563 13602

Executive Snapshot and Market Trajectory

Veterinary imaging is human imaging arriving second hand, and that is the business model rather than a criticism. Roughly 44% of advanced systems installed are reconditioned hospital equipment, because a scanner retired at ten years old images a dog superbly and costs a fraction of new.
The constraint is the anaesthetic rather than the scanner. Around 92% of advanced studies require full general anaesthesia, since an animal cannot be asked to lie still, and that brings an anaesthetist, monitoring, recovery and genuine risk. Computed tomography grows fastest at 12.6%, half again the market rate of 8.4%, because a modern scan takes under a minute. Magnetic resonance takes forty and never got there. Contrast lost to a shorter anaesthetic, entirely and permanently.
Interpretation is the other bottleneck and it is worse. Board certified veterinary radiologists number roughly one per fourteen hundred practising veterinarians, so a clinic buying a scanner acquires images nobody there can read. Teleradiology returning a report within about six hours is what makes the equipment sale possible at all, and scanners still run near a third of available capacity. Scanners still run at roughly 31% of available capacity.
Market Definition
Diagnostic imaging equipment used in veterinary practice, covering digital radiography systems, veterinary ultrasound systems, computed tomography systems, magnetic resonance systems, fluoroscopy and C-arm systems, and dental and extremity imaging systems. Measured at supplier selling value including new and reconditioned equipment, service contracts and associated software. In clinic laboratory analysers, point of care diagnostic tests, endoscopy systems, radiation therapy equipment and standalone anaesthesia equipment are excluded.
Base Year Value
$2.1B in 2025 (MMA Primary Research Dataset, August 2026)
Forecast Period
2026 to 2036, eleven discrete annual values
CAGR
8.4% base case. Bull 9.6%. Bear 7.2%.
Fastest Growth Segment
Computed Tomography Systems: 12.6% CAGR
Fastest Growth Country
China: 14.6% CAGR
Fastest Growth Region
South Asia and Pacific: 10.6% CAGR
Largest Region
North America: 32% of 2025 global value
Market Leaders
IDEXX Laboratories, Esaote, Canon Medical Systems, Fujifilm, Mindray. Source: MMA Primary Research Dataset, July 2026.
Primary Survey
n=3,800 procurement and R&D decision-makers, Q4 2025, six countries
Methodology
Demand-side build-up, cross-validated against public data, 47 expert interviews

Veterinary Imaging Market Forecast Scenarios

veterinary-imaging-market-size-forecast-scenario-1787641523651
The five years to 2025 were shaped by cost falling rather than by capability rising. Reconditioned human computed tomography reached price points general practices could finance, and retired multi slice scanners proved more than adequate for veterinary work. Teleradiology capacity expanded in parallel, which made those installations usable. The 7.2% historical rate reflects equipment becoming affordable rather than any new modality arriving.
The 8.4% base case rests on three mechanisms. Computed tomography keeps moving from referral centres into larger general practices as reconditioned pricing and financing make it accessible, and each installation generates study volume that did not previously exist. Dental radiography adoption continues rising as dentistry becomes a standard rather than optional service line. And Asian veterinary hospital construction keeps specifying imaging capability from the start, with China growing faster than any market covered.
The 9.6% bull case turns on sedation only protocols reaching wider acceptance for fast computed tomography, which would remove the anaesthetic burden that limits study volume more than any equipment shortage does. The 7.2% bear case is utilisation: scanners already run at roughly 31% of available capacity, and practices that cannot fill one struggle to justify replacing it later.

Where the Anaesthetic Decides the Modality

Pricing in this market is set by a replacement cycle happening somewhere else. Roughly 44% of advanced veterinary installations are reconditioned human systems, because a scanner a hospital retires at ten years old remains technically excellent for imaging a dog and costs a fraction of new equipment. Veterinary manufacturers therefore compete against the depreciation schedule of human healthcare rather than against each other.
TOP FIVE CONCENTRATION48%Combined installed base held by the largest suppliers
REFURBISHED INSTALLATION SHARE44%Advanced systems installed as reconditioned former human equipment
ANAESTHESIA REQUIREMENT RATE92%Advanced imaging studies requiring full general anaesthesia throughout
RADIOLOGIST AVAILABILITY RATIO1 per 1,400Specialist readers available across the practising veterinary population
TELERADIOLOGY REPORT TURNAROUND6 hoursTypical time from study submission to specialist report
SCANNER UTILISATION RATE31%Portion of available scanning capacity actually used weekly
What limits study volume is the anaesthetic, not the machine. Around 92% of advanced imaging requires full general anaesthesia because an animal cannot be instructed to hold still, and that means an anaesthetist, monitoring equipment, recovery space and a risk conversation with an owner. Computed tomography won on scan duration rather than on image quality, since a study taking under a minute changes the anaesthetic burden completely.
Interpretation is the constraint nobody accounts for when buying. Board certified veterinary radiologists number roughly one per fourteen hundred practising veterinarians, so a general practice acquiring a scanner acquires the ability to produce images it cannot confidently read. Teleradiology returning a specialist report in about six hours resolved that, and scanners still run at only around 31% of available capacity.
"Practices buy the scanner and discover afterwards that the hard parts are anaesthetising the patient and reading the images. The equipment was never the difficult purchase, which is why so many of them sit idle four days a week."
Director, Veterinary Diagnostics and Imaging Practice · MMA Medical Devices and Diagnostics Practice · August 2026

Market Trends

Reconditioned Human Systems Set the Price Ceiling

Roughly 44% of advanced veterinary installations are human scanners reconditioned after a hospital replacement cycle, and a ten year old multi slice computed tomography system images animal anatomy to a standard that comfortably exceeds clinical requirements. That means veterinary pricing is anchored to human healthcare depreciation rather than to any manufacturer decision. Purpose built veterinary systems compete on patient positioning, table design and workflow rather than on imaging performance, which is a narrower argument than manufacturers would prefer. Service capability and parts availability across ageing platforms matter more to a buyer than specification comparisons do.
Market Impact: Reports return within 6 hours
Scan Duration Rather Than Image Quality Chose the Winner

Around 92% of advanced veterinary imaging requires general anaesthesia, and every additional minute under anaesthesia adds cost, risk and recovery time that the practice and the owner both feel. A modern computed tomography study completes in under a minute and can occasionally be performed under deep sedation, while magnetic resonance takes forty minutes and always requires full anaesthesia. Computed tomography grows at 12.6% against a market rate of 8.4% and magnetic resonance at 7.6% for that reason alone. Superior soft tissue contrast lost to a shorter anaesthetic, which is not how the modalities compare in human medicine.
Market Impact: Dental imaging grows 10.4% annually

Market Opportunities and Growth Drivers

Teleradiology Makes General Practice Equipment Viable

Board certified veterinary radiologists number roughly one for every fourteen hundred practising veterinarians, which means most practices buying advanced imaging acquire a capability they cannot interpret confidently. Teleradiology services returning specialist reports within about six hours resolved that entirely, and equipment sales into general practice depend on it existing. Suppliers bundling reading services with hardware close installations that hardware alone would not, since the buyer's real anxiety is producing an image nobody can read. The reading service is the product that makes the scanner purchasable rather than an accessory to it.
Market Impact: Utilisation sits at only 31%

Dental Radiography Becomes Standard Rather Than Optional

Veterinary dentistry moved from an occasional procedure to a standard service line within a decade, and dental disease cannot be assessed properly without intraoral radiography, since most pathology sits below the gum line where nothing is visible. Dental and extremity imaging grows at 10.4%, second fastest in the market, on equipment that is inexpensive, requires no separate room and generates study volume at every dental procedure. Practices adopting dentistry as a service line specify imaging alongside it as a matter of course, which makes this the least contested equipment decision anywhere in the category.
Market Impact: Risk conversation affects 92% of studies

Market Restraints and Challenges

Scanner Utilisation Undermines the Investment Case

Advanced imaging systems in general practice run at roughly 31% of available capacity, which means most of the depreciation is carried by studies that never happen. The root cause is that referral flow, anaesthesia capacity and clinician confidence all have to develop after the equipment arrives rather than before it, and practices frequently underestimate how long that takes. Commercially this makes the second purchase considerably harder than the first. Suppliers respond with utilisation support, referral network building and shared equipment arrangements between neighbouring practices, which raise usage where anything does.
Market Impact: Reconditioned units reach 44% of installations

Anaesthesia Risk Limits Which Animals Get Scanned

General anaesthesia is required for around 92% of advanced studies and carries genuine risk in older animals and those with existing disease, which is precisely the population most likely to need imaging. Owners decline scans on that basis regularly, and clinicians recommend them less readily than the diagnostic value would justify. The root cause is anatomical rather than technical, since an animal cannot be asked to hold still. Responses include faster acquisition protocols, sedation only imaging where scan times allow, and improved anaesthetic monitoring, none of which removes the underlying conversation with an owner.
Market Impact: Anaesthesia needed for 92% of studies
3 additional market trends, 4 additional growth drivers, and 2 additional restraints and challenges are covered in the full report. Contact sales@marketmindsadvisory.com to access the complete intelligence.

Segment CAGR and Growth Architecture

Segmentation follows imaging modality, since modality determines anaesthetic requirement, capital cost, room requirements and who can interpret the result. Six modalities cover practice imaging, from an intraoral dental sensor to a magnetic resonance system needing a shielded room. Growth follows anaesthetic burden considerably more closely than it follows diagnostic capability. Capability follows well behind.
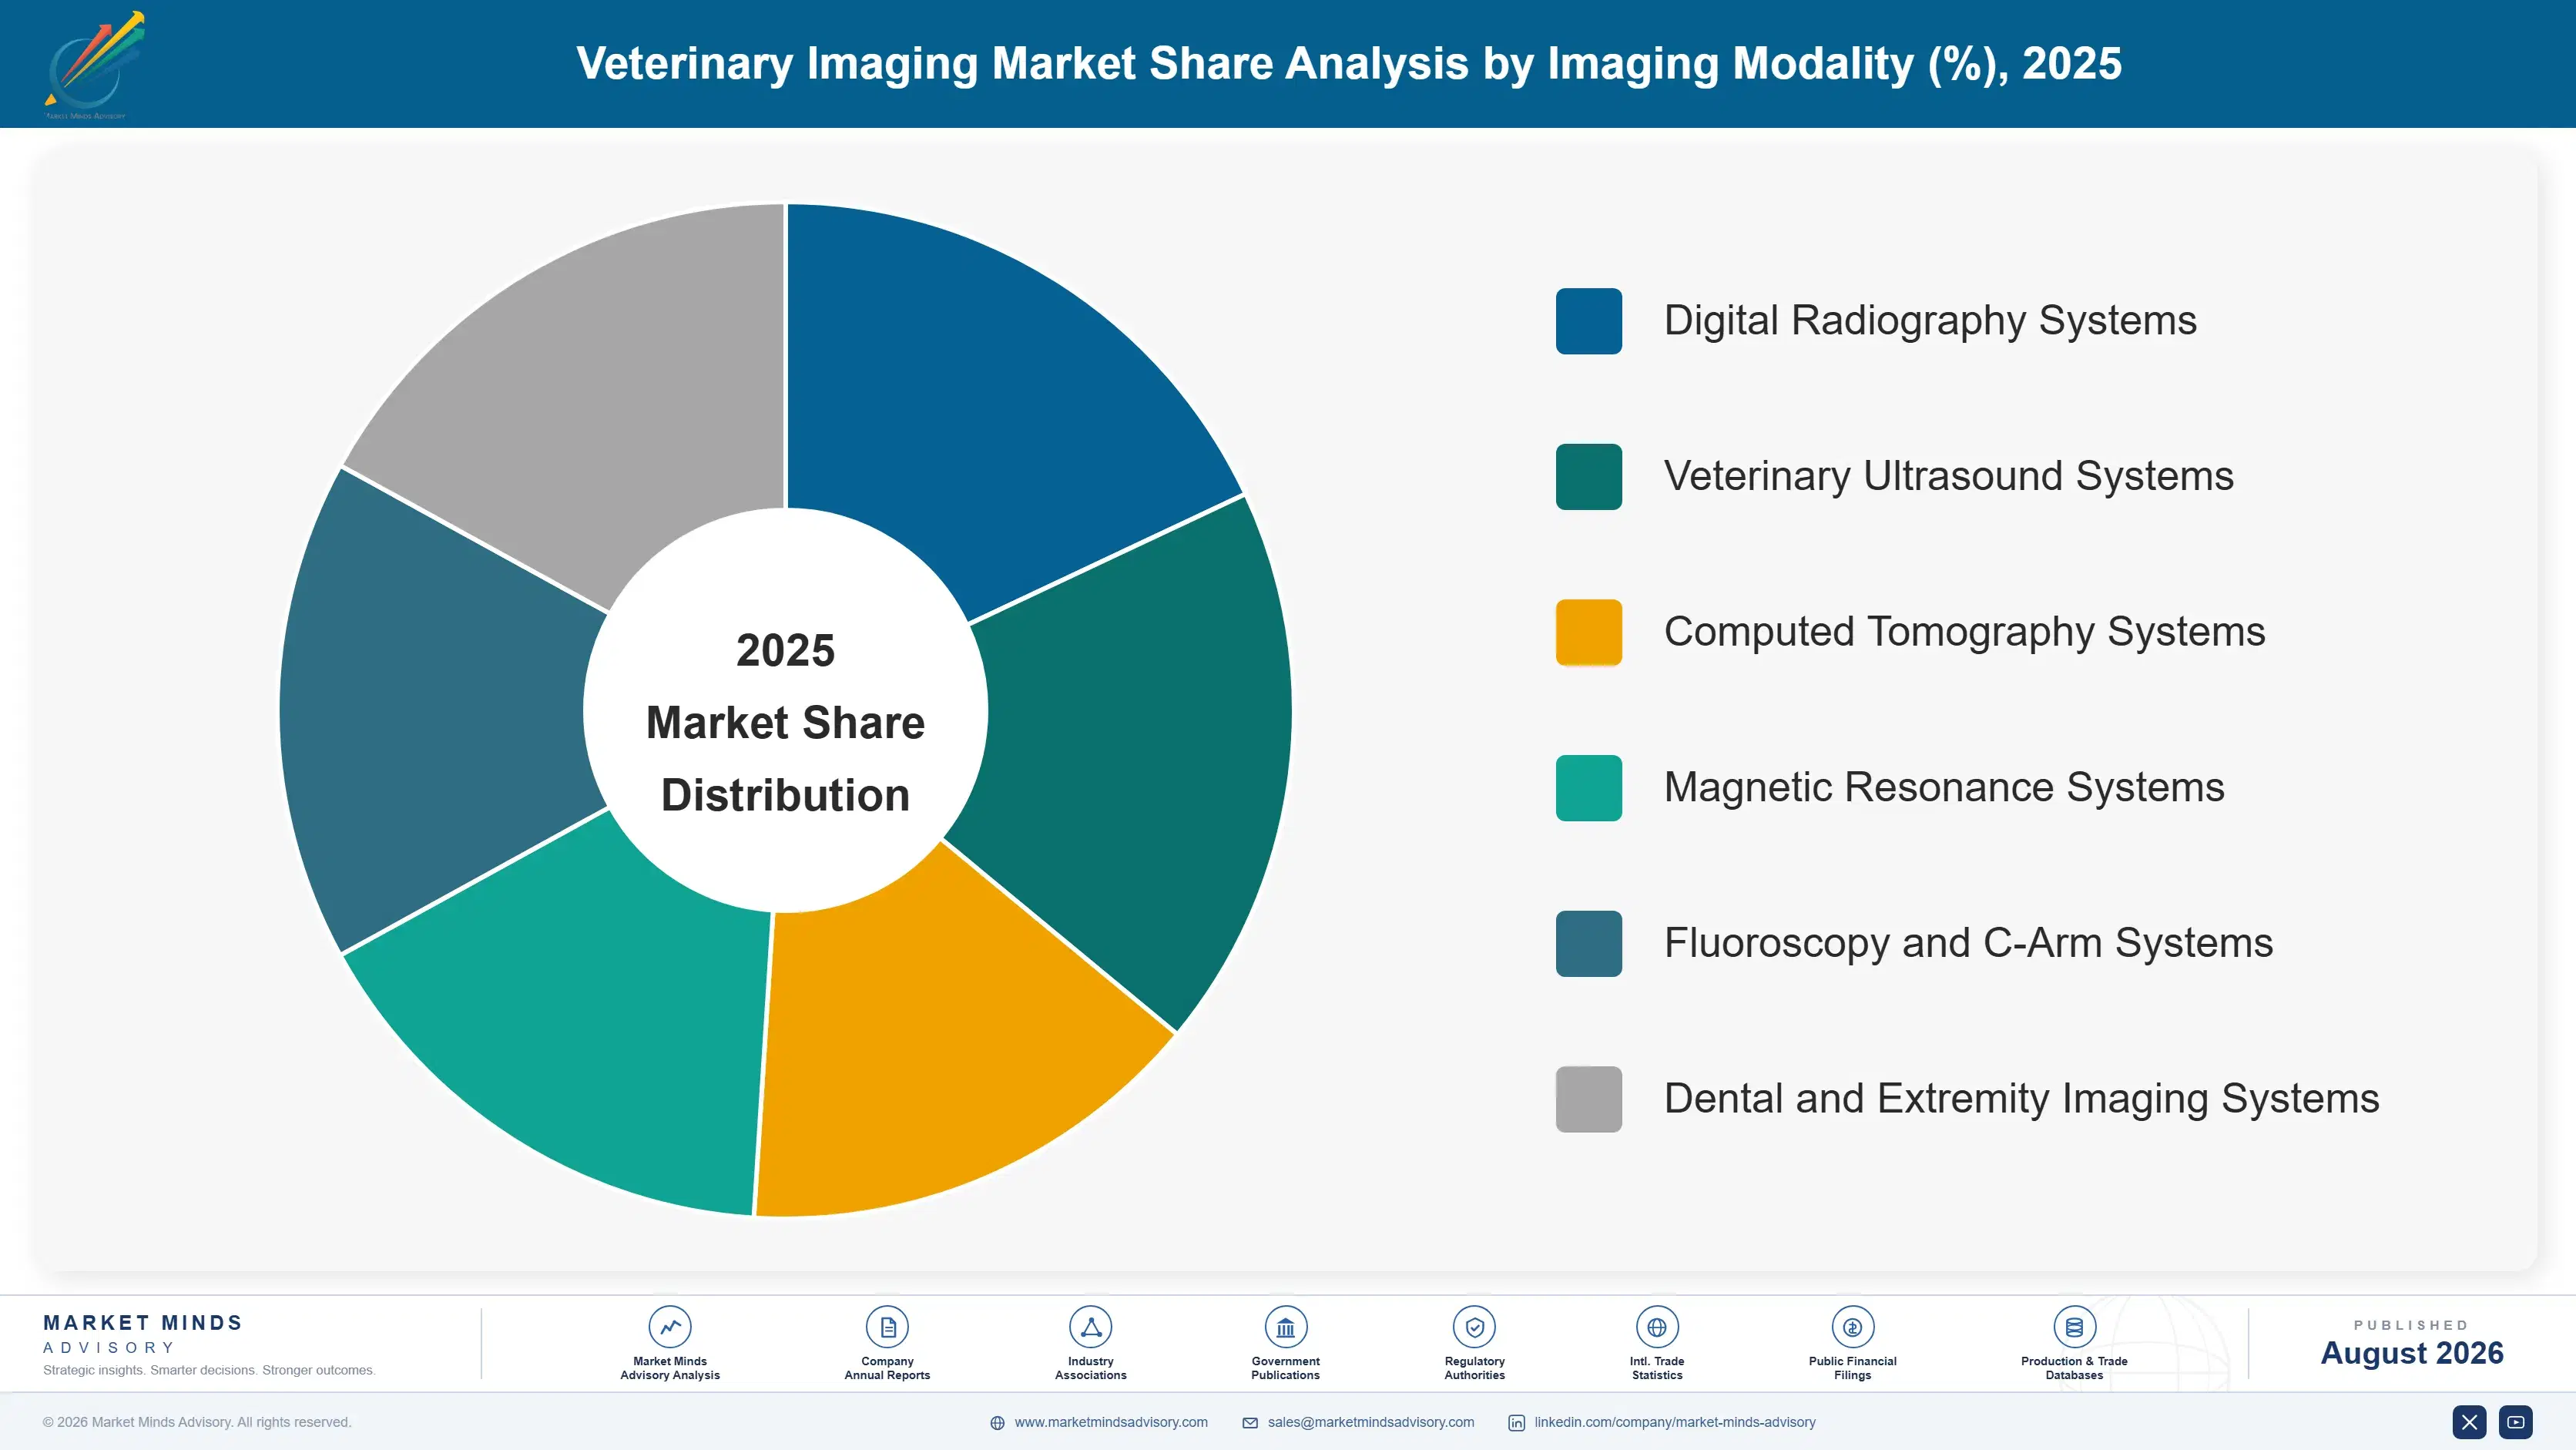
veterinary-imaging-market-market-share-analysis-1787641524215

Computed Tomography Systems

Multi slice systems producing cross sectional imaging in under a minute, increasingly installed in larger general practices rather than remaining confined to referral hospitals. At 12.6% this is the fastest growing modality in the market, half again the market rate of 8.4%, and scan duration explains the lead more than image quality does. A study completing that quickly reduces anaesthetic time substantially and occasionally permits deep sedation instead, which changes the clinical conversation with an owner entirely. Roughly 44% of installations are reconditioned human systems, which sets pricing well below purpose built alternatives. Utilisation after installation is the practical challenge rather than the capability itself. Referral flow has to develop after installation rather than before it.
CAGR 12.6%

Dental and Extremity Imaging Systems

Intraoral sensors, dental generators and small field extremity units producing high resolution images of teeth, jaws and distal limbs without any dedicated room requirement. Growth of 10.4% is second fastest in the market, driven by veterinary dentistry moving from an occasional procedure to a standard service line across general practice. Dental pathology sits largely below the gum line, so it cannot be assessed at all without intraoral radiography, which makes the equipment decision essentially automatic once dentistry is adopted. Capital cost is low, no shielding or room modification is required, and study volume follows every dental procedure performed. Interpretation is also within general practitioner competence, unlike advanced cross sectional work.
CAGR 10.4%
Full segment breakdown across 6 segments available in the complete report.

Regional Architecture and Country Demand Map

North America holds the largest share at 32%, on referral capacity and general practice equipment adoption. Western Europe follows at 24%. China grows fastest of any country covered at 14.6%, on veterinary hospitals built with imaging specified from the outset. Interpretation capacity constrains all of them.

North America

Referral density and general practice adoption together explain this 32% share. American specialty referral hospitals hold the deepest advanced imaging capability anywhere, and computed tomography has moved into larger general practices faster here than in any other market as reconditioned pricing and equipment financing made it accessible. Teleradiology services are most developed here too, which is what makes general practice installation viable given how few board certified radiologists exist relative to practising veterinarians. Corporate veterinary groups increasingly specify imaging centrally across estates rather than practice by practice. Growth of 7.8% reflects a market where general practice penetration continues rather than referral capacity expanding much further. Corporate groups increasingly specify imaging centrally.
Share: 32% | CAGR: 7.8% (2026 to 2036)

Western Europe

Referral structure rather than general practice equipment explains this 24% share. British, German and Dutch specialty hospitals hold strong advanced imaging capability, and referral pathways from general practice are well established, which concentrates equipment in fewer sites than the North American pattern produces. Insurance penetration in Britain and the Nordic markets supports advanced imaging volumes that uninsured markets cannot sustain, since a computed tomography study becomes fundable rather than declined. Radiation regulations and room requirements are stricter than elsewhere, which raises installation cost meaningfully. Growth of 6.8% is the lowest of the seven regions, reflecting mature referral provision and slower general practice adoption. Referral pathways concentrate equipment in fewer sites.
Share: 24% | CAGR: 6.8% (2026 to 2036)
Regional intelligence for 5 additional markets available in the complete report: East Asia, South Asia and Pacific, Latin America, Middle East and Africa, Eastern Europe. Contact sales@marketmindsadvisory.com.
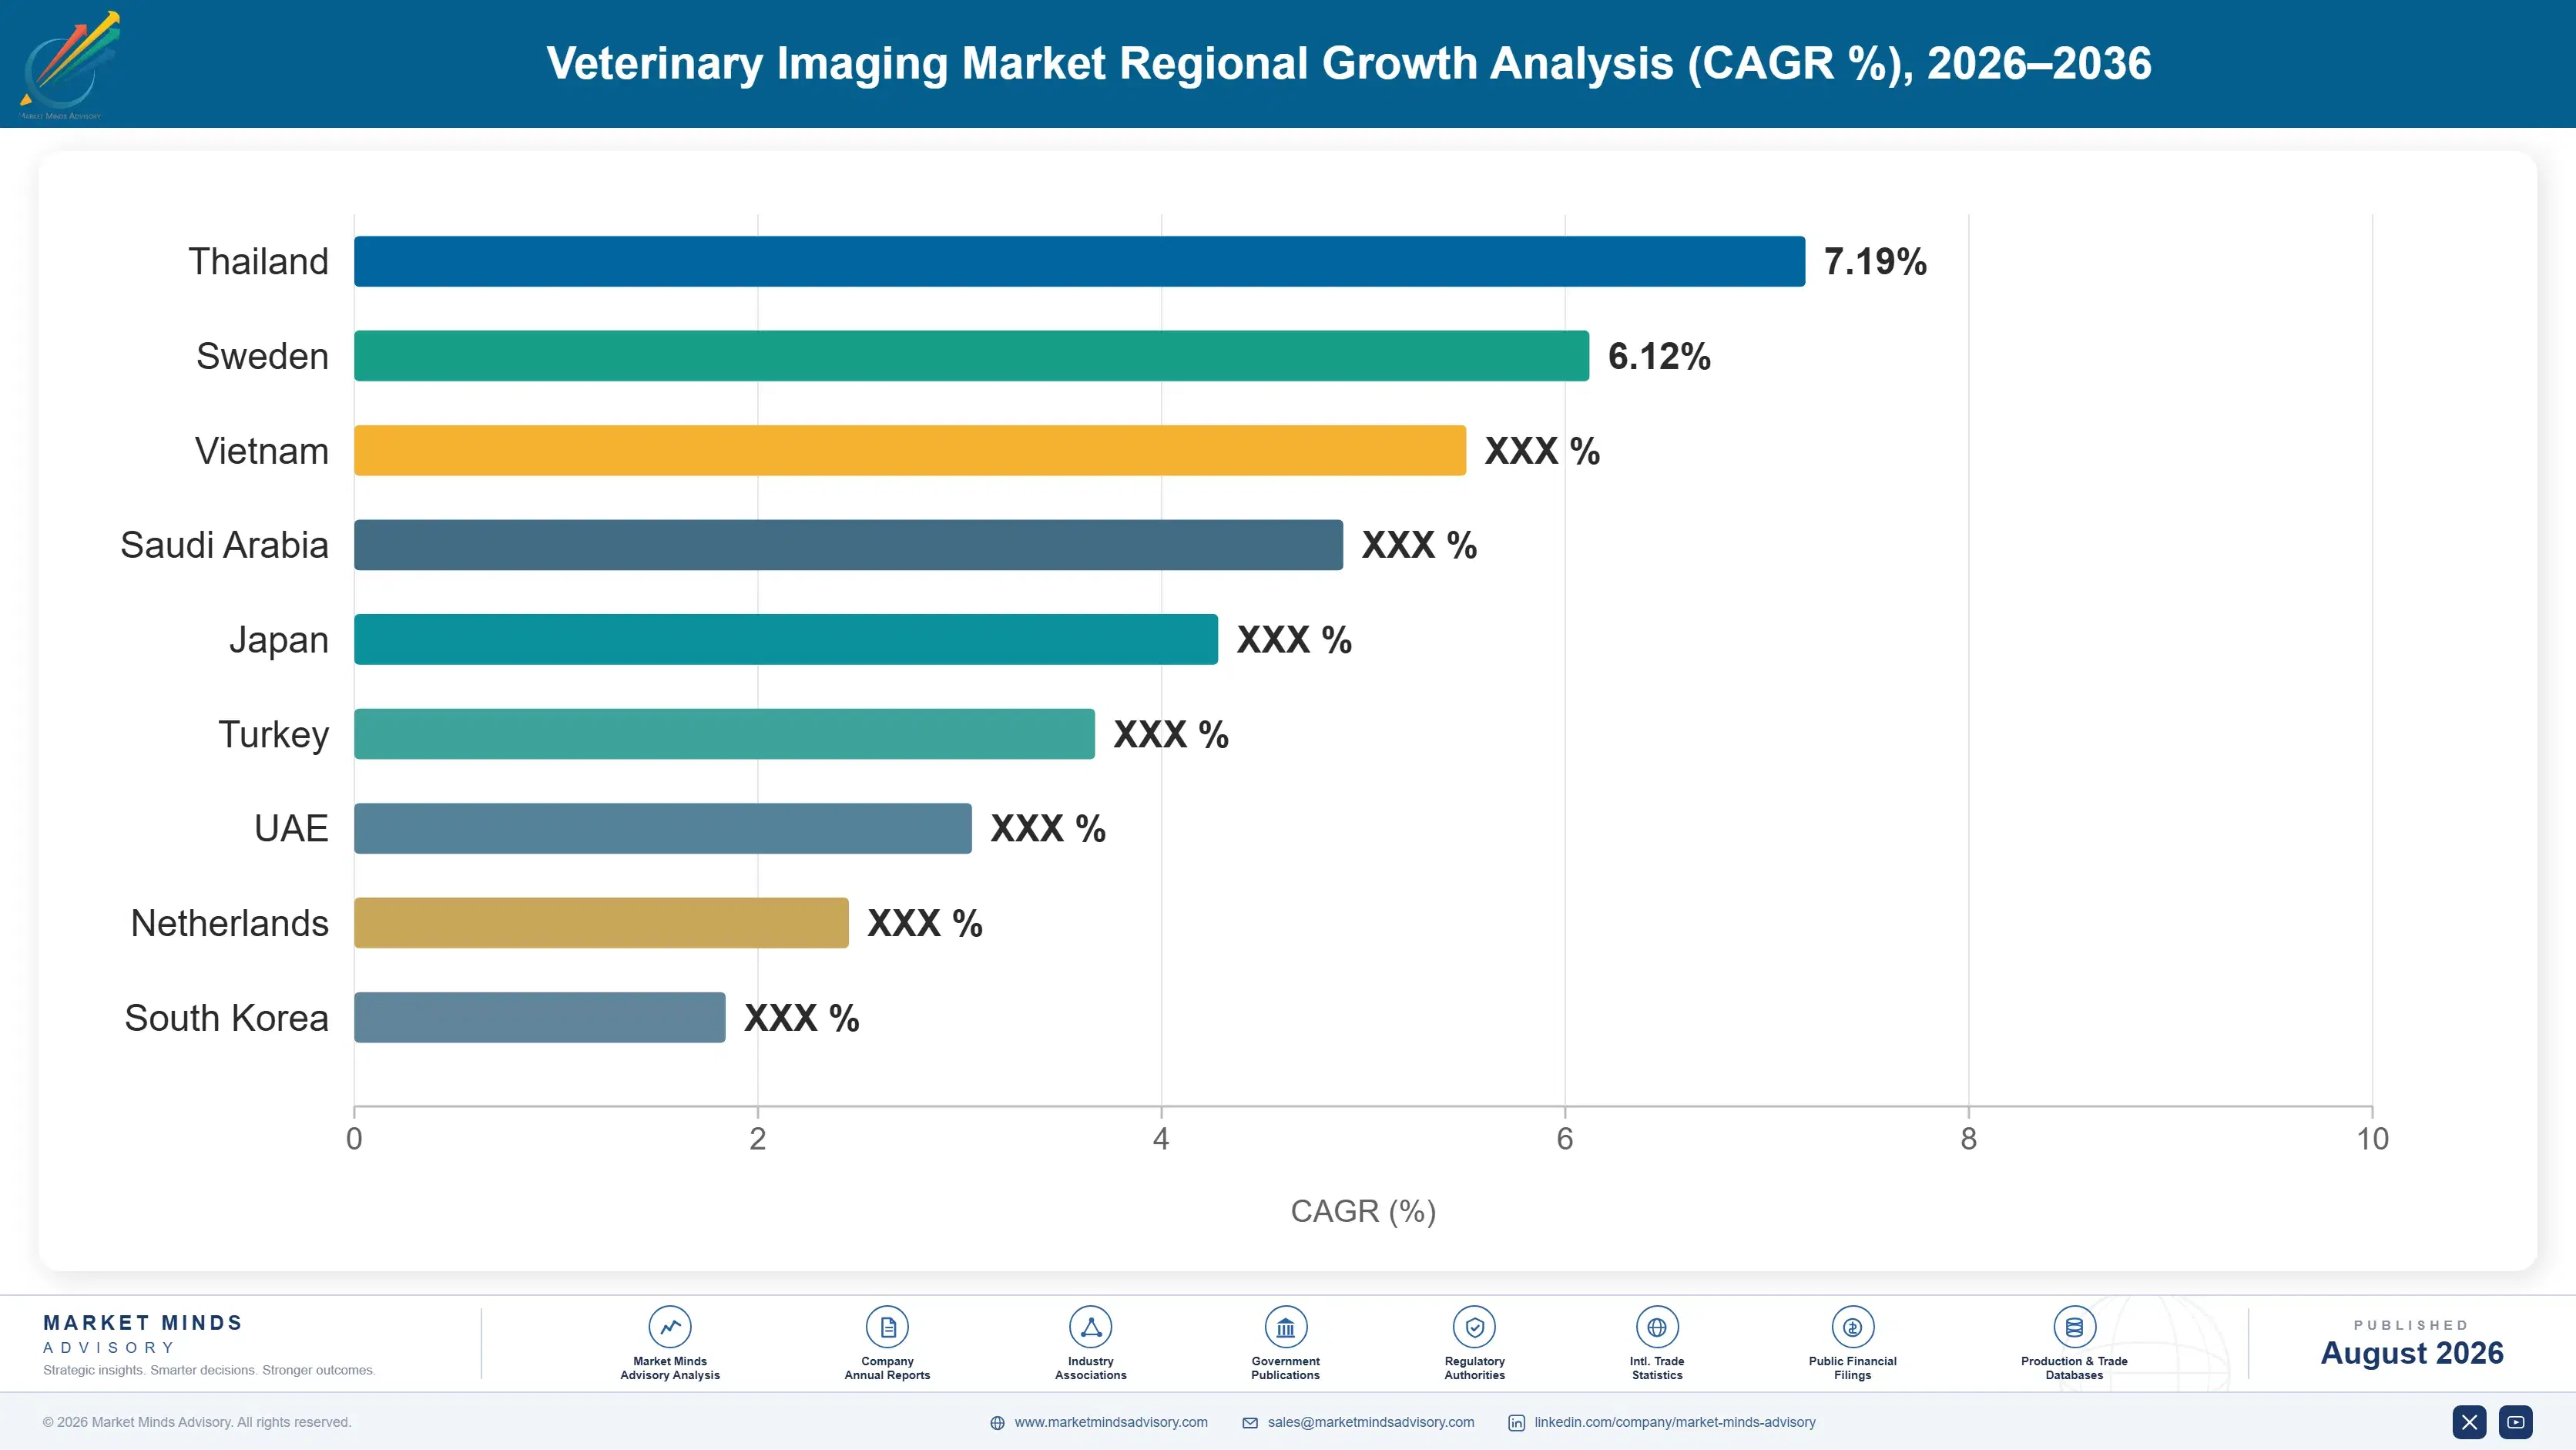
veterinary-imaging-market-country-cagr-analysis-1787641524739

Where Imaging Revenue Actually Comes From

Nothing here is won on image quality, because a reconditioned human scanner already exceeds what veterinary work requires. Value accrues to whoever shortens the anaesthetic, whoever supplies the interpretation the buyer lacks, and whoever raises utilisation on equipment already installed. Four routes carry weight, and only one of them concerns the scanner itself. The rest is service.

Sell the Reading Service With the Scanner

Board certified veterinary radiologists number roughly one per fourteen hundred practising veterinarians, so a general practice buying advanced imaging acquires a capability it cannot interpret. Teleradiology returning a specialist report within about six hours removes that anxiety entirely and is what makes the equipment purchase possible rather than merely attractive. Suppliers bundling reading services close installations that hardware alone would not, and the service revenue recurs long after the capital sale completes. Competitors selling a scanner without an interpretation answer are selling an expensive way to generate uncertainty. Roughly 44% of buyers cite it first.
Market Impact: Delivers specialist reports within about 6 hours reliably

Compete on Anaesthetic Time, Not Image Quality

Around 92% of advanced studies require general anaesthesia and every minute adds cost, risk and a conversation with an owner who may decline entirely. Computed tomography grows at 12.6% against a market rate of 8.4% because a study completes in under a minute, while magnetic resonance takes forty and grows at 7.6% despite better soft tissue contrast. Faster acquisition protocols, positioning aids and sedation only capability address the constraint that actually limits volume. Manufacturers presenting resolution comparisons are competing on a dimension that stopped deciding purchases some time ago. Owners decline studies on that basis regularly.
Market Impact: Cuts the anaesthesia burden across 92% of studies

Attach Imaging to the Dentistry Service Line

Veterinary dentistry moved from occasional to standard within a decade, and dental pathology sits below the gum line where it cannot be assessed without intraoral radiography at all. Dental and extremity imaging grows at 10.4%, second fastest in the market, on equipment that is inexpensive, needs no dedicated room and generates a study at every dental procedure performed. Interpretation sits within general practitioner competence, which removes the reading problem entirely. This is the least contested equipment decision in the category and the easiest sale available anywhere in it. Nobody is contesting it seriously.
Market Impact: Grows 10.4% alongside every single dental procedure performed

Sell Utilisation Support After the Installation

Advanced systems in general practice run at roughly 31% of available capacity, which means most installations disappoint the financial case that justified them and make a replacement conversation considerably harder later. Referral network building, protocol development, anaesthesia capacity support and clinician confidence programmes raise usage where nothing in the equipment can. Suppliers treating installation as the end of the engagement create dissatisfied references, while those treating it as the start generate both service revenue and a customer who buys again. Utilisation support costs little and protects the entire installed base.
Market Impact: Raises utilisation well above the current 31% baseline

Who Controls the Margin Pool

Concentration is moderate and unusually mixed. The top five hold 48% of the installed base and associated service revenue, the basis applied consistently here, and the list combines veterinary specialists with human imaging manufacturers whose reconditioned equipment reaches this market through independent channels. IDEXX leads on integrated diagnostics and interpretation services rather than on imaging hardware alone. Reconditioned dealers hold much of the remainder.
Competition runs on three fronts that reward different things. Purpose built veterinary manufacturers compete on patient positioning, workflow and service response against equipment that already exceeds imaging requirements. Reconditioned equipment dealers compete on price against new systems and among themselves on parts and service availability. Teleradiology providers compete on turnaround, specialist depth and integration with practice systems rather than on anything to do with hardware.

Rankings will move as interpretation capability becomes the differentiator rather than the equipment. Suppliers holding reading services alongside hardware hold a position that pure equipment vendors cannot match and cannot quickly build, since radiologist recruitment is the constraint. The other pressure point is Chinese domestic manufacture, which supplies ultrasound and radiography at prices established suppliers have not attempted to match anywhere.
veterinary-imaging-market-company-positioning-matrix-1787641525285

Competitive Moat and Risk Dimensions

IDEXX LABORATORIES

Moat: Integrated Diagnostics Position

Holding imaging alongside laboratory diagnostics, practice software and interpretation services means a practice buys a diagnostic workflow rather than a device, and switching any single element means unpicking connections to the others. That integration also puts the company in front of practices constantly rather than only when a capital decision arises.
IDEXX LABORATORIES

Risk: Reconditioned Equipment Pricing

Roughly 44% of advanced installations are reconditioned human systems priced against a hospital depreciation schedule rather than against any veterinary manufacturer's cost base. Competing on new equipment pricing against that is not winnable, which pushes the argument toward service and integration and away from anything a specification sheet can settle.
ESAOTE

Moat: Veterinary Specific Design

Systems designed around animal anatomy, table access and practice workflow rather than adapted from human equipment address the practical difficulties that reconditioned hospital systems create in a veterinary setting. Dedicated equine standing imaging capability in particular has no reconditioned equivalent, since human equipment was never built for a patient that weighs half a tonne.
ESAOTE

Risk: Narrow Modality Exposure

A portfolio weighted toward ultrasound and specialist systems misses the growth in computed tomography, where reconditioned human equipment dominates installations and grows at 12.6%. Competing there requires either accepting reconditioned pricing or persuading buyers that veterinary specific design justifies a premium the utilisation rates do not obviously support.

Players Tracked

Prominent Players

IDEXX Laboratories
Esaote
Canon Medical Systems
Fujifilm
Mindray

Other Key Players

Agfa-Gevaert
Konica Minolta
Carestream Health
Hallmarq Veterinary Imaging
Epica Medical Innovations
Universal Medical Systems
Siemens Healthineers
GE HealthCare
SonoScape
Chison Medical
DRE Veterinary
Examion
Vimago
Sedecal
Bionet

Recent Developments

FEBRUARY 2025

Teleradiology provider expands specialist reading capacity substantially

A veterinary teleradiology provider expanded board certified reading capacity and reduced typical turnaround, addressing the interpretation constraint that limits general practice imaging adoption more than equipment cost does. Radiologist recruitment rather than technology capacity determined how far the expansion could go in practice. Recruitment was the limit.
Signal: Reading capacity rather than equipment availability now decides just how far imaging reaches into general practice
JUNE 2025

Reconditioned scanner supplier reports rising general practice installations

A supplier of reconditioned computed tomography systems reported rising installation volumes into general practices rather than referral hospitals, as financing and pricing brought advanced imaging within reach of larger clinics. Reconditioned equipment now accounts for a substantial share of advanced veterinary installations across most markets.
Signal: Human healthcare depreciation schedules are now effectively setting the entire price ceiling across this market today
SEPTEMBER 2025

Sedation only protocol published for fast computed tomography studies

A veterinary anaesthesia group published protocols permitting selected computed tomography studies under deep sedation rather than general anaesthesia, taking advantage of scan times now measured in seconds. Removing full anaesthesia changes both the risk conversation with owners and the staffing required for each study. Staffing requirements fall too.
Signal: Shortening the anaesthetic does far more for study volume than any imaging improvement could ever achieve

What an Imaging System Costs

Component content and software dominate new system cost. Detectors, tubes, gantries and power electronics account for roughly 47% of manufacturing cost of goods on a new computed tomography system, with software, integration and regulatory compliance covering much of the rest. Detector and tube supply comes from few manufacturers in Japan, Germany and the United States, with alternatives limited by performance and service arrangements.
X-ray tube and detector pricing moved through the period on semiconductor content and on specialty materials, while reconditioned system availability depended entirely on human hospital replacement cycles that ran slower during pandemic capital deferral. Company annual reports across the imaging sector documented component cost and supply pressure in detail. Service parts for ageing platforms became a separate constraint, since manufacturers reduce parts support long before veterinary users retire the equipment.

Exposure divides by business model rather than by scale. A new equipment manufacturer carries component cost and competes against reconditioned pricing it cannot influence. A reconditioning business carries supply risk tied to somebody else's replacement cycle and parts availability that declines with platform age. Teleradiology providers carry only radiologist compensation, which is scarce and rising, and no equipment exposure whatever.
veterinary-imaging-market-cost-volatility-analysis-1787641525481

Secure parts supply for ageing reconditioned platforms

Manufacturers withdraw parts support for platforms long before veterinary users retire them, and a scanner without available parts becomes scrap regardless of how well it images. Stockpiling critical components, qualifying third party equivalents and acquiring end of life inventory all extend platform life materially. This is unglamorous work that decides whether an installed base remains serviceable or becomes a liability.

Contract radiologist capacity ahead of equipment sales

Teleradiology capacity limits how much equipment can usefully be placed, since a scanner without interpretation generates images nobody trusts. Radiologist recruitment takes far longer than equipment manufacturing does, so reading capacity has to be built ahead of the installed base rather than alongside it. Suppliers that grew hardware sales faster than reading capacity created turnaround problems that damaged both businesses.

Design around available detector and tube platforms

Detector and tube supply comes from very few manufacturers and qualification is constrained by performance and by service arrangements as much as by price. Designing systems around platforms with multiple qualified sources costs some performance and removes a single point of failure. Manufacturers locked to one detector supplier found production stopping for reasons outside their control.

Portfolio Architecture for Margin Defence

Margin architecture divides between hardware and everything attached to it. New equipment earns moderately and competes against reconditioned systems priced off a hospital depreciation schedule. Reconditioned equipment earns well on acquisition and refurbishment spread but carries supply risk nobody controls. Interpretation services earn best of all, because radiologist scarcity means the service prices on availability rather than on cost.
The tension is that the fastest growing modality carries the weakest hardware economics. Computed tomography grows at 12.6% and roughly 44% of installations are reconditioned, so a new equipment manufacturer watches its fastest growing category get supplied by somebody else's used inventory. Ultrasound and dental systems carry better new equipment economics and grow more slowly, which is not a comfortable portfolio position.

High value pools concentrate in teleradiology and in service contracts across an ageing installed base, both of which recur and neither of which depends on winning a capital sale. Everything selling new hardware into advanced modalities competes against reconditioned pricing it cannot match. Chinese domestic manufacture is compressing the ultrasound and radiography tiers further in exactly the markets growing fastest. That pressure is not reversing.

Reconditioned Advanced Systems

Human computed tomography and magnetic resonance systems refurbished for veterinary use at prices anchored to hospital depreciation rather than manufacturing cost. Supply depends entirely on replacement cycles happening in another industry altogether.
Gross Margin: 26-29%

Purpose Built Veterinary Equipment

Systems designed around animal anatomy, table access and practice workflow, including equine standing imaging that has no reconditioned equivalent anywhere. Margin holds on design rather than on imaging performance, which reconditioned equipment already satisfies.
Gross Margin: 44-47%

Teleradiology and Service Contracts

Specialist interpretation returned within hours alongside service and parts contracts across an ageing installed base. Margin is the best available because radiologist scarcity prices the service on availability rather than on any underlying cost.
Gross Margin: 58-61%
veterinary-imaging-market-portfolio-architecture-1787641525985

High-value Sub-segments and Strategic Watch-out

Computed Tomography Systems

The fastest growing modality at 12.6% and the one where reconditioned human equipment takes roughly 44% of installations, which caps new equipment economics severely. Sub minute scan times changed the anaesthetic conversation, and that rather than image quality drove the adoption. New equipment economics suffer accordingly.
Gross Margin: 26-29%

Dental and Extremity Imaging Systems

Second fastest at 10.4% on dentistry becoming a standard service line, with low capital cost, no room requirement and interpretation within general practitioner competence. It is the least contested equipment decision anywhere in this category. Volume follows every procedure performed, and interpretation never leaves the practice.
Gross Margin: 48-51%

Veterinary Ultrasound Systems

Growing at 8.2% with no anaesthetic requirement at all, which makes it the modality practices actually use most despite carrying less diagnostic reach. Chinese domestic manufacture is compressing pricing considerably in the markets growing fastest. No anaesthetic conversation is required at all, which is why usage runs so high.
Gross Margin: 38-41%

Magnetic Resonance Systems

Growing at only 7.6% despite superior soft tissue contrast, because a forty minute study under full anaesthesia is a conversation many owners decline outright. Capital cost, shielding and room requirements confine it to referral centres almost entirely. Referral centres hold almost all of the installed base for that reason.
Gross Margin: 34-37%

How Imaging Revenue Actually Recurs

The capital sale is a fraction of what an installation generates. A scanner placed today produces service contract revenue, parts consumption and teleradiology reading fees for a working life measured in a decade or more, and the reading fees continue at whatever rate the practice actually uses it. Utilisation therefore determines installation value, and at roughly 31% most underperform what the supplier modelled.
Stickiness follows integration rather than hardware. A practice whose imaging connects to its laboratory results, practice management system and teleradiology provider through one workflow rarely changes any component, because unpicking one connection disturbs the others. A standalone scanner is replaced on price at end of life. Referral hospitals are stickiest of all, since imaging protocols and specialist familiarity accumulate around specific equipment over years.

The buyer moved from the practice owner to the group. Imaging was once bought by a veterinarian who wanted the capability and financed it personally, weighing capability against a loan repayment. Corporate groups now specify imaging centrally across estates, evaluating utilisation forecasts, service coverage and interpretation arrangements rather than clinical enthusiasm. Suppliers selling capability to an interested clinician are addressing somebody who increasingly does not sign anything.
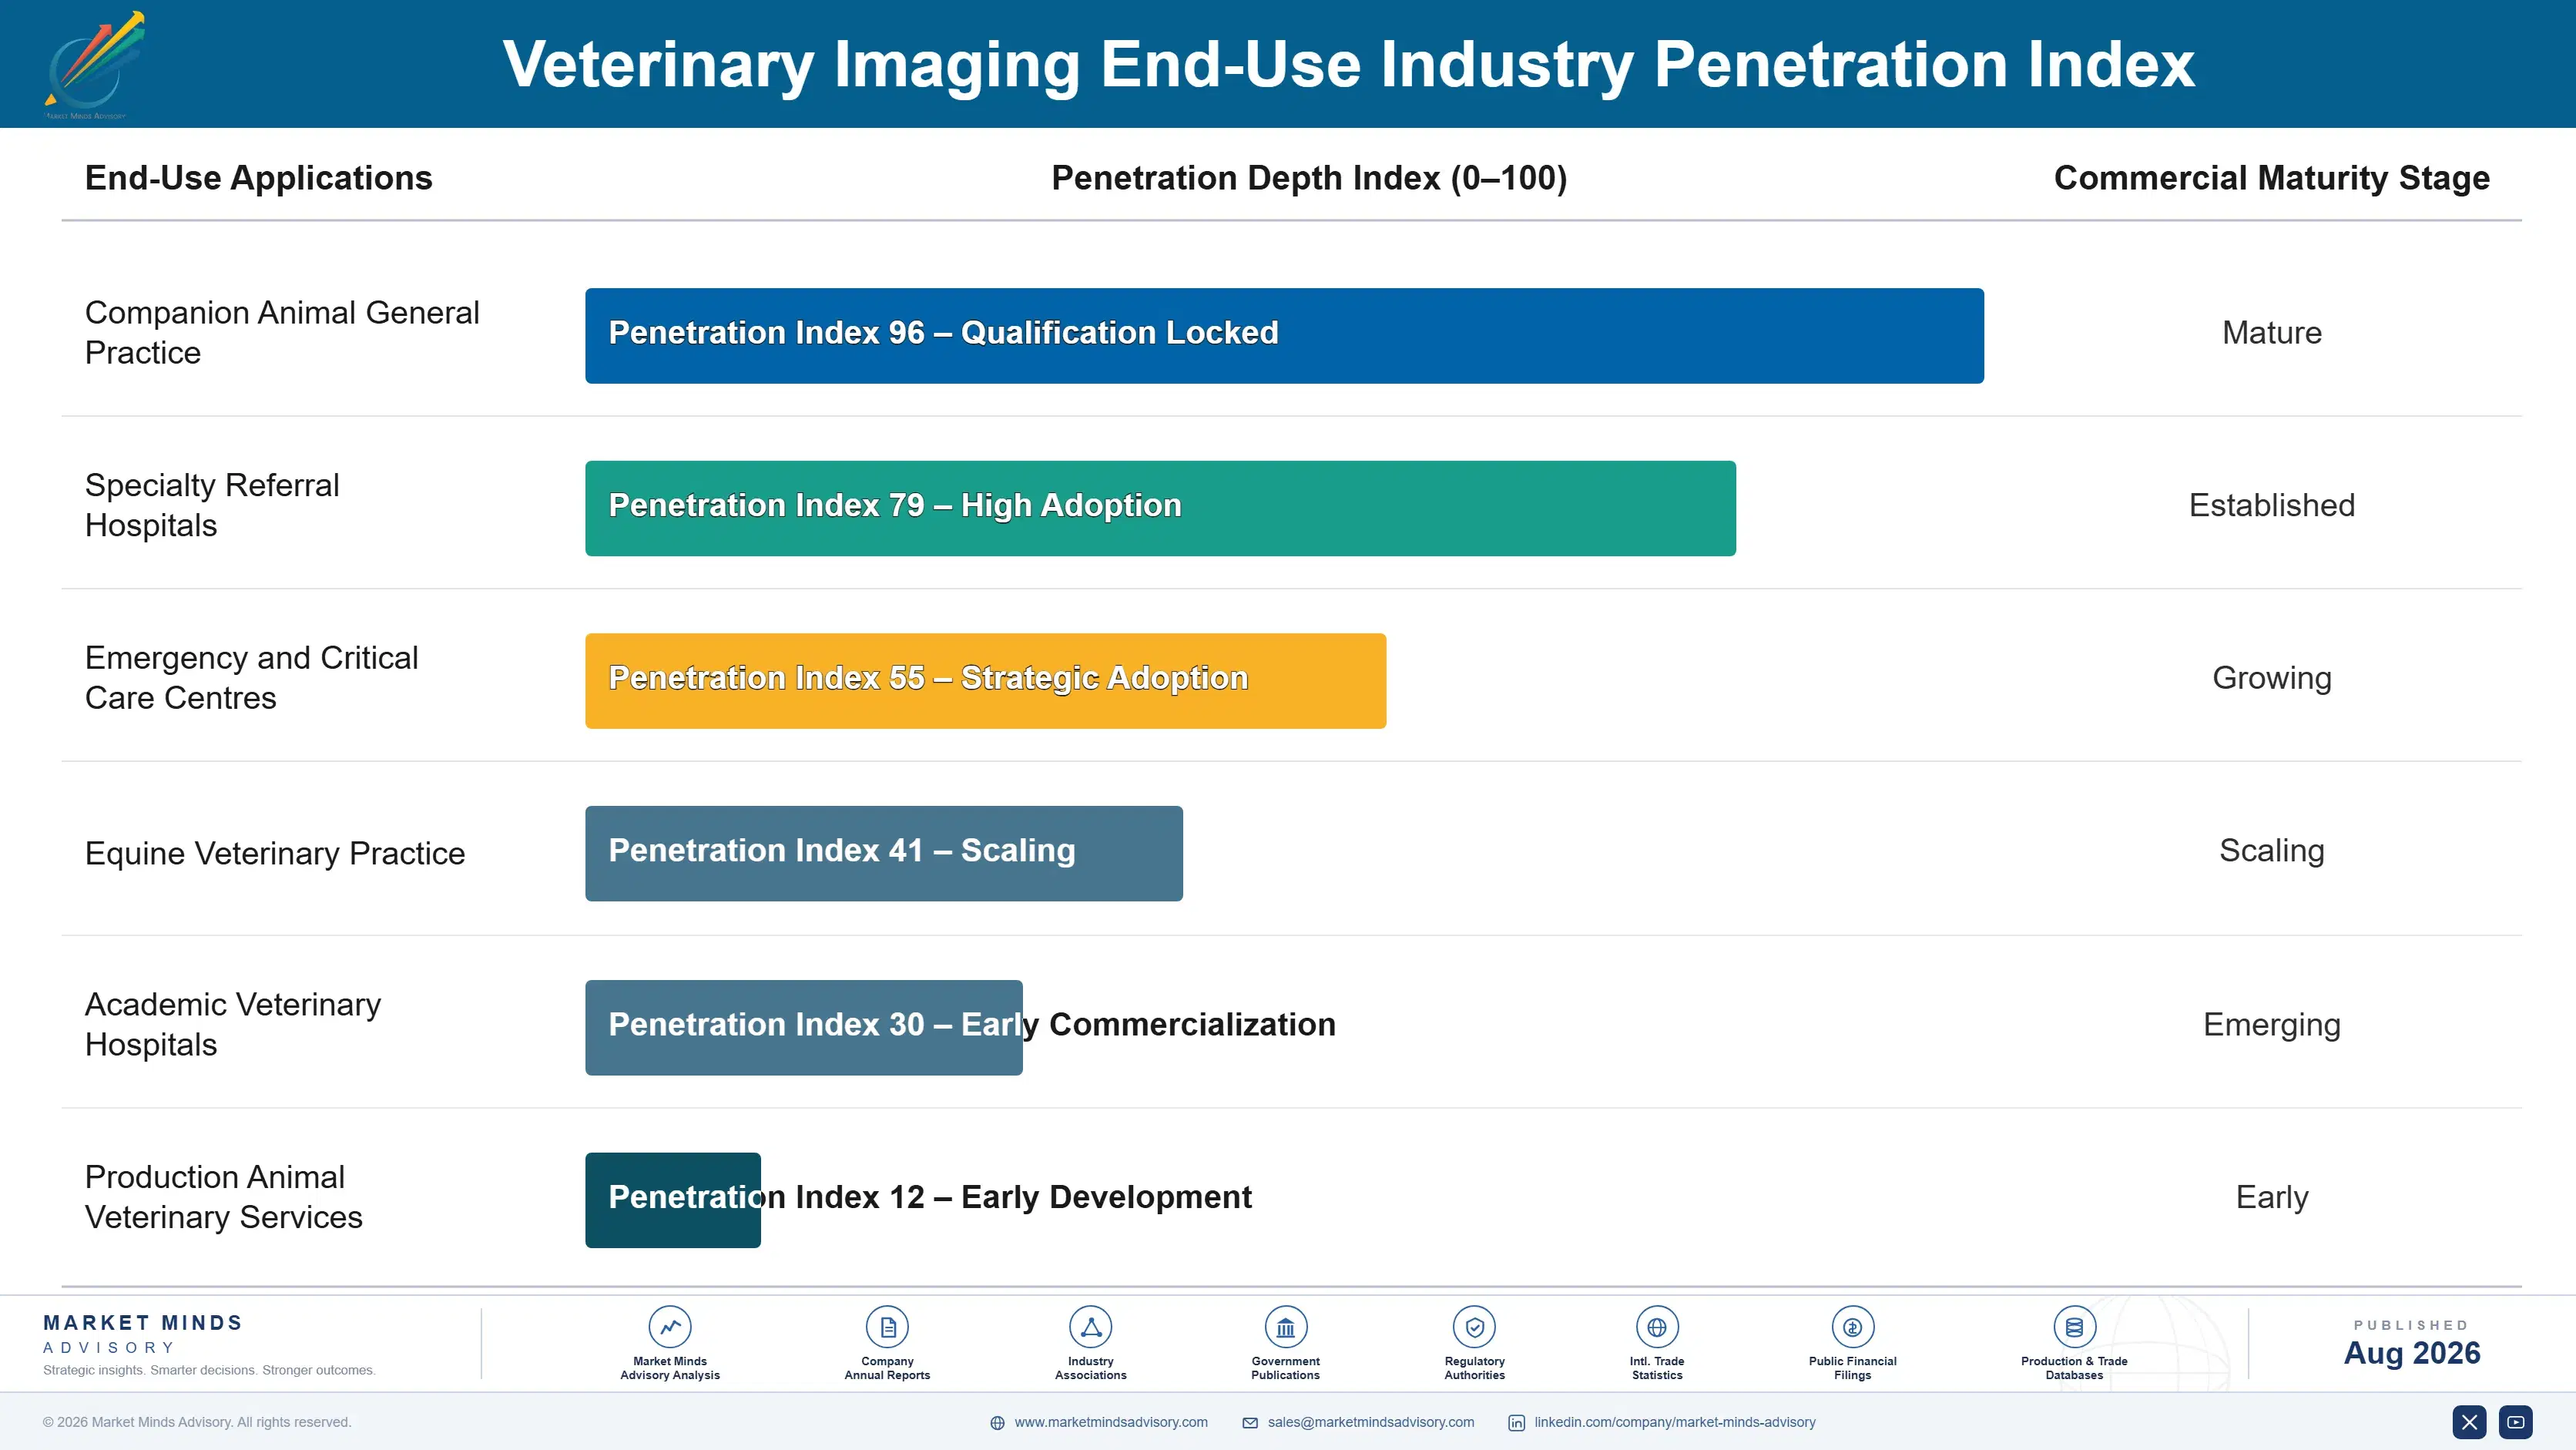
veterinary-imaging-market-end-use-penetration-index-1787641526473

Where Imaging Value Is Won

These are among the four positions where our research anticipates prominent divergence between winners and laggards over the coming forecast period. Each is grounded in the demand model, the regulatory perimeter, and the announced capacity pipeline.
01 / INTERPRETATION CAPACITY OWNERSHIP

A scanner without a reader is an expensive problem

Board certified veterinary radiologists number roughly one for every fourteen hundred practising veterinarians, so a general practice buying advanced imaging acquires a capability it cannot confidently interpret on its own. Teleradiology returning a specialist report within about six hours is what makes the equipment purchase possible rather than merely attractive, and the reading revenue recurs long after the capital sale completes. Suppliers selling hardware without an interpretation answer are competing to sell practices an expensive way to generate diagnostic uncertainty.
02 / ANAESTHETIC BURDEN COMPETITION

Scan duration beat soft tissue contrast outright

Around 92% of advanced veterinary studies require full general anaesthesia because an animal cannot be asked to lie still, and every minute adds cost, risk and a conversation the owner may end. Computed tomography grows at 12.6% against a market rate of 8.4% on sub minute acquisition while magnetic resonance grows at 7.6% despite better soft tissue contrast and a forty minute study. Manufacturers presenting resolution comparisons are competing on a dimension that stopped deciding veterinary purchases several years ago now.
03 / UTILISATION AFTER INSTALLATION

Thirty one percent capacity kills the second purchase

Advanced systems in general practice run at roughly 31% of available scanning capacity, which means most installations disappoint the financial case that justified them and make the replacement conversation considerably harder later on. Referral flow, anaesthesia capacity and clinician confidence all develop after the equipment arrives rather than before it, and practices consistently underestimate how long that takes. Suppliers treating installation as the end of an engagement create dissatisfied references, while those treating it as a beginning earn service revenue and a repeat customer.
04 / DENTAL LINE ATTACHMENT

The easiest imaging sale nobody is contesting

Veterinary dentistry moved from occasional procedure to standard service line within a decade, and dental pathology sits below the gum line where it cannot be assessed without intraoral radiography at all. Dental and extremity imaging grows at 10.4%, second fastest in the market, on equipment that is inexpensive, requires no dedicated room or shielding and generates a study at every dental procedure performed. Interpretation sits within general practitioner competence, which removes the reading constraint that complicates every other advanced modality sale.

Engagement Snapshot From the Field

A live engagement with an industry participant carrying material or product regulatory and market exposure ahead of a defining policy shift, showing how our research translates into a defensible multi-year portfolio strategy.
MARKET MINDS ADVISORY · CLIENT ENGAGEMENT SUMMARY
Veterinary Imaging Producer Strategic Portfolio Review and Transition Roadmap 2026·Investment Scenario on Veterinary Imaging Exposure Evaluation 2025-26
CLIENT PROFILE
A veterinary imaging manufacturer supplying purpose built ultrasound and digital radiography systems into practices across North America and Western Europe. Annual revenue was approximately 175 million dollars (client-reported, unverified by MMA), almost entirely from equipment sales. No computed tomography product existed, no teleradiology service was offered, and service contract attachment sat below a third of the installed base.
STRATEGIC CHALLENGE
Growth had slowed while computed tomography adoption accelerated in exactly the general practices the company served, supplied largely by reconditioned equipment dealers it could not price against. Management wanted to know whether to enter computed tomography, build interpretation services, or defend the existing modalities. The engineering team favoured a new product and finance doubted it could compete on price.
MMA APPROACH
MMA modelled installation economics including service, parts and reading fees across the equipment life rather than at point of sale, which the company had never done. Reconditioned pricing was analysed against new equipment cost structures to establish where competing was possible. Forty-seven expert interviews with practice owners, corporate group buyers and radiologists established what actually determines an imaging purchase and what determines usage afterwards.
KEY FINDINGS
  1. Lifetime revenue from service, parts and reading fees exceeded the original capital sale by roughly 2.8 times on installations where all three were attached properly.
  2. Practice buyers in 36 of the 47 interviews named interpretation arrangements as a decisive purchase factor, ahead of image specification which almost none mentioned at all.
  3. New computed tomography systems could not be priced within 40% of reconditioned equivalents at the client's volumes, making direct competition on hardware unwinnable.
  4. Scanner utilisation among installations with structured referral and protocol support ran roughly 2 times higher than among those left alone after commissioning.
CLIENT PROFILE
A veterinary imaging manufacturer supplying purpose built ultrasound and digital radiography systems into practices across North America and Western Europe. Annual revenue was approximately 175 million dollars (client-reported, unverified by MMA), almost entirely from equipment sales. No computed tomography product existed, no teleradiology service was offered, and service contract attachment sat below a third of the installed base.
STRATEGIC CHALLENGE
Growth had slowed while computed tomography adoption accelerated in exactly the general practices the company served, supplied largely by reconditioned equipment dealers it could not price against. Management wanted to know whether to enter computed tomography, build interpretation services, or defend the existing modalities. The engineering team favoured a new product and finance doubted it could compete on price.
MMA APPROACH
MMA modelled installation economics including service, parts and reading fees across the equipment life rather than at point of sale, which the company had never done. Reconditioned pricing was analysed against new equipment cost structures to establish where competing was possible. Forty-seven expert interviews with practice owners, corporate group buyers and radiologists established what actually determines an imaging purchase and what determines usage afterwards.
KEY FINDINGS
  1. Lifetime revenue from service, parts and reading fees exceeded the original capital sale by roughly 2.8 times on installations where all three were attached properly.
  2. Practice buyers in 36 of the 47 interviews named interpretation arrangements as a decisive purchase factor, ahead of image specification which almost none mentioned at all.
  3. New computed tomography systems could not be priced within 40% of reconditioned equivalents at the client's volumes, making direct competition on hardware unwinnable.
  4. Scanner utilisation among installations with structured referral and protocol support ran roughly 2 times higher than among those left alone after commissioning.
RECOMMENDED STRATEGY
Phase 1: Phase one: build or acquire teleradiology capability, since 36 of 47 buyers named interpretation as decisive and the revenue recurs for a decade. Phase 2: Phase two: abandon new computed tomography development entirely, since pricing cannot come within 40% of reconditioned systems at achievable volumes. Phase 3: Phase three: build utilisation support into every installation, since supported sites run roughly 2 times the usage of unsupported ones.
OUTCOME
The client acquired a regional teleradiology provider within a year and stopped its computed tomography development programme. Reading fees grew to a meaningful share of revenue at materially better margins than equipment, and service attachment across the installed base rose substantially once utilisation support was standard (client-reported, unverified by MMA).

Frequently Asked Questions

Foundational context covering the market sizes, CAGR, scope, country, region and competition that inform every finding below. This section is provided to cover basics and most often pre-purchase conversations, answered from the MMA Primary Research Dataset.

What is the current size of the Veterinary Imaging Market?

The market was valued at 2.1 billion dollars in 2025, covering radiography, ultrasound, computed tomography, magnetic resonance and dental imaging equipment. It reaches an estimated 2.28 billion dollars during 2026.

How large will the Veterinary Imaging Market be by 2036?

MMA forecasts 5.11 billion dollars by 2036, an increase of 2.83 billion dollars over the 2026 base. That represents an expansion multiple of 2.24 times across the forecast period.

What is the CAGR for the Veterinary Imaging Market 2026 to 2036?

The base case compound annual growth rate is 8.4%, with a bull case of 9.6% and a bear case of 7.2%. Sedation protocols and scanner utilisation separate those scenarios.

Which segment is growing fastest?

Computed tomography grows at 12.6%, half again the market rate of 8.4%, because sub minute scans shorten the anaesthetic. Dental and extremity imaging follows at 10.4%.

Who are the major companies in the Veterinary Imaging Market?

IDEXX Laboratories, Esaote, Canon Medical Systems, Fujifilm and Mindray lead on installed base and associated service revenue worldwide. Together they account for 48% of the market.

Which country is growing fastest?

China grows fastest at 14.6%, as urban veterinary hospitals are built with imaging capability specified at design stage rather than retrofitted into existing premises later.

Report Segmentation Architecture

The full report scope spans multiple orthogonal segmentation dimensions, with cross-tabulated demand data provided for each dimension pair. Coverage extends further to regional breakdowns, trend trajectories, and the competitive detail needed to support segment-level decision-making.

By Imaging Modality

  • Digital Radiography Systems
  • Veterinary Ultrasound Systems
  • Computed Tomography Systems
  • Magnetic Resonance Systems
  • Fluoroscopy and C-Arm Systems
  • Dental and Extremity Imaging Systems

By End-Use Industry

  • Companion Animal General Practice
  • Specialty Referral Hospitals
  • Emergency and Critical Care Centres
  • Equine Veterinary Practice
  • Academic Veterinary Hospitals
  • Production Animal Veterinary Services

By Commercial Dimension

  • New Equipment Purchase
  • Reconditioned Equipment Supply
  • Equipment Financing and Leasing
  • Service and Parts Contracts
  • Teleradiology Reading Services
  • Corporate Group Procurement

By Region

  • North America
  • Western Europe
  • East Asia
  • South Asia and Pacific
  • Latin America
  • Middle East and Africa
  • Eastern Europe

Scope, Methodology, and Coverage

Every figure in this report is reproducible from documented input assumptions. The scope below maps the historical period, the forecast horizon, the segmentation dimensions, and the countries covered, alongside the underlying primary and qualitative methodology.
Historical Period
2020 to 2025
Forecast Period
2026 to 2036
Base Year
2025 (USD billions; MMA Primary Research Dataset, August 2026)
Market Definition
Diagnostic imaging equipment used in veterinary practice worldwide, covering digital radiography systems, veterinary ultrasound systems, computed tomography systems, magnetic resonance systems, fluoroscopy and C-arm systems, and dental and extremity imaging systems, together with associated service contracts and reading services. Measured at supplier selling value including new and reconditioned equipment. In clinic laboratory analysers, point of care diagnostic tests, endoscopy systems, radiation therapy equipment and standalone anaesthesia and monitoring equipment are excluded from scope.
Quantitative Units
USD billions (current prices); systems installed; USD per system and per study by modality
Segmentation Dimensions
Imaging modality; end-use industry; commercial dimension; region
Regions Covered
North America, Western Europe, East Asia, South Asia and Pacific, Latin America, Middle East and Africa, Eastern Europe
Countries Covered
United States, Canada, United Kingdom, Germany, Netherlands, France, Italy, Sweden, China, Japan, South Korea, Taiwan, India, Australia, Thailand, Brazil, Mexico, Saudi Arabia, Israel, Poland
Key Companies Profiled
IDEXX Laboratories, Esaote, Canon Medical Systems, Fujifilm, Mindray, Agfa-Gevaert, Konica Minolta, Carestream Health, Hallmarq Veterinary Imaging, Epica Medical Innovations, Universal Medical Systems, Siemens Healthineers, GE HealthCare, SonoScape, Chison Medical, DRE Veterinary, Examion, Vimago, Sedecal, Bionet
Quantitative Methodology
Primary survey, n=3,800 respondents, Q4 2025, six countries; demand-side model with trade association cross-validation
Qualitative Methodology
47 expert interviews, Q4 2025; applied to validate demand model assumptions, identify emerging dynamics, and assess competitive positioning
Report Format
PDF and XLSX data workbook (Word format preview document)
Publisher
Market Minds Advisory
Report Code
MMA-2026-MED-130
Published
August 2026
Contact
sales@marketmindsadvisory.com | www.marketmindsadvisory.com

Purchase the full Veterinary Imaging Market Report (2026 to 2036).

The full report treats veterinary imaging as a market where the scanner was never the difficult purchase, since the anaesthetic limits study volume and interpretation capacity limits where equipment can usefully be placed. It sizes all six modalities independently through 2036, models installation economics across service, parts and reading fees rather than at point of sale, and quantifies reconditioned equipment pricing against new system cost structures. Regional chapters cover all seven regions, with referral concentration assessed separately from general practice adoption. Competitive profiling covers 20 participants on one consistent installed base measure.
Six imaging modalities sized independently through 2036
Installation economics modelled across the full equipment life
Reconditioned pricing compared against new system cost structures
Interpretation capacity mapped against installed base growth
Referral concentration assessed separately from general practice adoption
Twenty participants profiled on one consistent installed base

Built For The People Who Decide

From boardroom strategy to bench-side execution, this report is read cover-to-cover by leaders shaping the next decade of their industry, turning demand scenarios, market dynamics and valuation benchmarks into decisions.
CXOs/ Presidents/ VPs/ Managers
M&A and Corporate Development
Strategy Teams and R&D Heads
Procurement and Product Directors
Regulatory and Compliance Leaders
Investor Relations and Equity Analysts