Market Minds Advisory
Veterinary Hospitals Market

Veterinary Hospitals Market: The Clinician Constraint, Service Mix Inversion and a Payer Without Insurance

Consolidators assumed the scarce asset was the practice and it turned out to be the veterinarian, which is why four hundred clinics without staff are worth less than two with people who stay.

Lead Analyst

Alice Ballenger

Published

September 2026

Make Smarter Decisions with Customized Research Insights

Request a free sample report and evaluate market opportunities, growth trends, and competitive dynamics relevant to your business needs.

2025 MARKET VALUE$112.0BMarket Size 2025
2036 FORECAST VALUE$245.6BBase Case , 2026 to 2036
CAGR 2026 TO 20367.4 %Bull 8.6% / Bear 6.2%
INCREMENTAL OPPORTUNITY$125.3BNet 10- year value creation
EXPANSION MULTIPLE2.04x2036 value over 2026 base
Strategic Levers
M&A Pipeline
Regional Outlook
Country Rankings
Competitive Intelligence
Segmental Deep-dive
Call-Us : 91 93563 13602

Executive Snapshot and Market Trajectory

Veterinary practice was a cottage industry private equity discovered, and the consolidation thesis was right about economics and wrong about the constraint. Buyers assumed the scarce asset was the clinic. Roughly 34% of veterinarians intend to leave practice within five years, and four hundred sites without staff generate nothing.
The revenue model has quietly inverted underneath all of it. Preventive care and vaccination once carried practices and now grow slowest at 4.4%, as protocols extended intervals and retail and remote channels took routine work. Emergency and critical care grows fastest at 11.1%, half again the market rate of 7.4%, and specialty referral follows at 9.6%. What grows is the work that cannot be delivered anywhere else. Nothing outside a hospital delivers either.
The payer is a household carrying almost no insurance, with only around 17% of treated animals covered. That sets a pricing ceiling from disposable income, and it means the highest revenue moment in any practice is also the one where the owner can evaluate least and resents most. Economic euthanasia is the profession's own phrase for what tends to follow. Nobody in the profession pretends otherwise about it.
Market Definition
Clinical services delivered by veterinary hospitals, clinics and referral centres, covering preventive and wellness care, diagnostics and imaging services, surgical services, emergency and critical care, specialty referral services, and dentistry and ancillary services. Measured at practice revenue across companion animal, equine and production animal work. Veterinary pharmaceuticals and devices sold to practices, telehealth consultation services, pet insurance, grooming and boarding are excluded.
Base Year Value
$112.0B in 2025 (MMA Primary Research Dataset, August 2026)
Forecast Period
2026 to 2036, eleven discrete annual values
CAGR
7.4% base case. Bull 8.6%. Bear 6.2%.
Fastest Growth Segment
Emergency and Critical Care: 11.1% CAGR
Fastest Growth Country
China: 15.8% CAGR
Fastest Growth Region
South Asia and Pacific: 9.6% CAGR
Largest Region
North America: 32% of 2025 global value
Market Leaders
Mars Veterinary Health, JAB Holding Company, IVC Evidensia, Thrive Pet Healthcare, VetPartners. Source: MMA Primary Research Dataset, July 2026.
Primary Survey
n=3,800 procurement and R&D decision-makers, Q4 2025, six countries
Methodology
Demand-side build-up, cross-validated against public data, 47 expert interviews

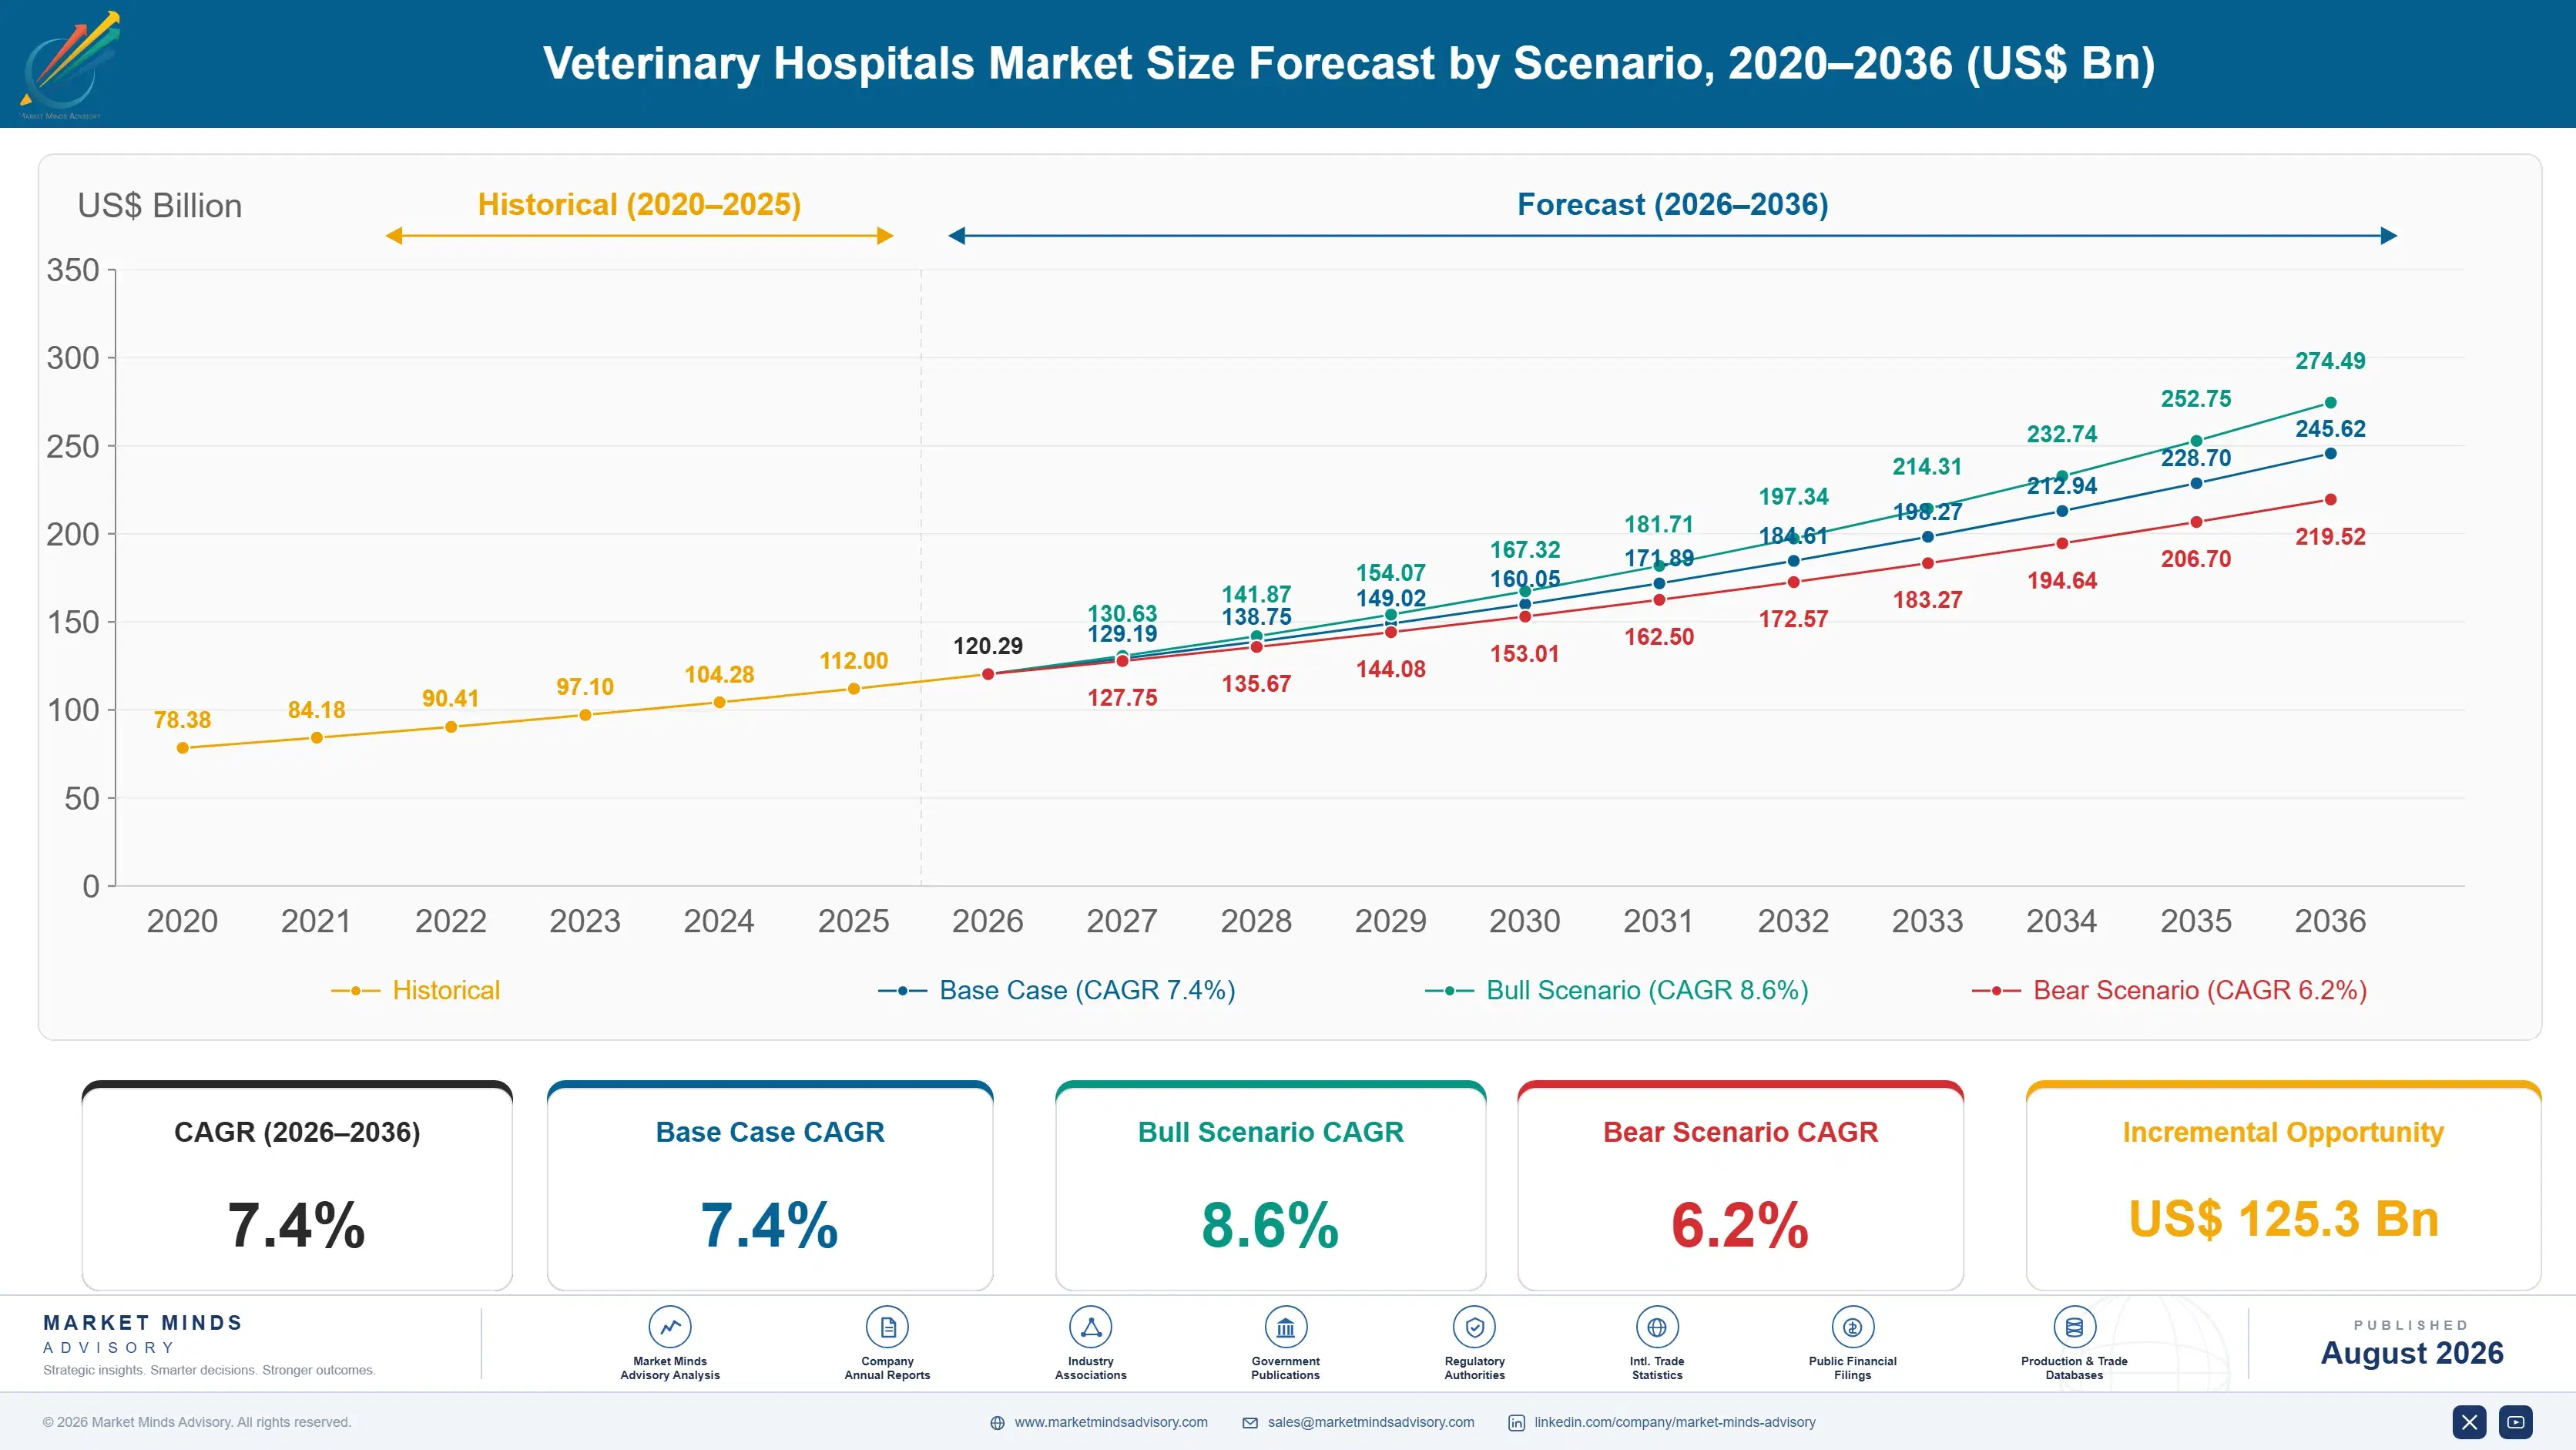
Veterinary Hospitals Market Forecast Scenarios

veterinary-hospitals-market-size-forecast-scenario-1787641504135
The five years to 2025 delivered a demand surge and a workforce crisis simultaneously. Pandemic pet acquisition raised caseloads sharply while veterinarians left clinical work at unprecedented rates, producing backlogs that persisted long after the spike faded. Consolidation continued throughout at valuations set before either trend was visible. The 6.2% historical rate averages rising demand against capacity that could not expand to meet it.
The 7.4% base case rests on three mechanisms. Service mix keeps shifting toward emergency, specialty and diagnostic work that carries higher value per visit and cannot be delivered outside a hospital. Veterinary capability keeps expanding across Asian cities where companion animal ownership rose sharply within a decade, with China growing faster than anywhere covered. And technician utilisation reform slowly raises throughput per veterinarian, the only capacity route not requiring more graduates.
The 8.6% bull case turns on veterinary technician scope expanding materially in more jurisdictions, which would raise clinical capacity without waiting on graduate numbers. The 6.2% bear case is household spending: with 17% insurance coverage and an average visit near 262 dollars, deferred and declined care rises quickly whenever discretionary budgets tighten. Declined care rises within a single quarter.

Where the Clinician Is the Binding Constraint

Consolidation transformed the ownership of this industry and did nothing about its constraint. Roughly 27% of practices now sit within group operators, acquired on multiples that assumed clinic count was the scarce asset. It is not. Around 34% of veterinarians report intent to leave clinical practice within five years, graduate output has not matched demand, and a clinic without a veterinarian generates nothing whatever its brand says above the door.
TOP FIVE CONCENTRATION14%Combined practice revenue held by the largest groups
VETERINARIAN ATTRITION INTENT34%Clinicians intending to leave practice within five years
AVERAGE TRANSACTION VALUEUSD 262Typical owner spend on one companion animal visit
INSURANCE COVERAGE RATE17%Share of treated animals carrying any health cover
CORPORATE OWNERSHIP SHARE27%Proportion of practices owned by consolidated group operators
EMERGENCY CASE GROWTH11%Annual rise in out of hours presentation volume
The service mix has inverted while nobody rewrote the business plans. Preventive care and vaccination built these practices and now grow slowest at 4.4%, as extended vaccine intervals, retail channels and remote consultation absorbed routine work. Emergency, specialty referral and diagnostic imaging grow fastest, because they cannot be unbundled and cannot happen anywhere else. Practices structured around wellness volume are structured for the wrong decade.
The economics run through a household with almost nothing behind it. Only around 17% of treated animals carry insurance, so an average visit near 262 dollars and an emergency running to several thousand are paid directly. That puts the highest revenue moment where an owner is frightened, cannot assess anything and resents it afterwards.
"Every investment memo in this sector modelled clinic count and none of them modelled who would be standing in it. The profession has been telling anyone who asked for a decade, and the answer was not what the models needed to hear."
Director, Animal Health Services and Veterinary Practice · MMA Animal Health and Veterinary Medicine Practice · August 2026

Market Trends

Clinician Supply Rather Than Clinic Count Limits Growth

Roughly 34% of veterinarians report intent to leave clinical practice within five years, driven by caseload, client conflict and compensation that has not kept pace with the debt required to qualify. Graduate output has not matched demand in most developed markets and cannot expand quickly, since veterinary school places are constrained by clinical teaching capacity rather than by applicant numbers. Consolidators holding large clinic estates find capacity limited by rota gaps rather than by premises. Groups that invested in retention, scheduling flexibility and technician scope are growing where competitors with more sites are not.
Market Impact: China grows at 15.8% annually
Emergency and Specialty Work Displaces Wellness Revenue

Preventive care once carried these practices and now grows at 4.4%, the slowest service line, because vaccine protocols extended intervals and retail pharmacy and remote consultation absorbed routine parasiticide and wellness work. Emergency and critical care grows at 11.1% against a market rate of 7.4%, and out of hours presentation volume rises around 11% annually. Owners now present at unsocial hours for conditions that previously waited until morning, which reflects changed attitudes to animals rather than any change in disease. Practices built around wellness throughput face a mix shift they did not choose.
Market Impact: Raises throughput 22% per veterinarian

Market Opportunities and Growth Drivers

Asian Urban Ownership Builds Hospital Capacity From Nothing

Companion animal ownership across Chinese, Korean and Southeast Asian cities rose sharply within a decade, and veterinary hospital capacity is being built to serve it rather than converted from existing provision. China grows at 15.8%, faster than any country covered, with chains opening multi site networks in second and third tier cities where formal veterinary care barely existed. Owners in these markets treat animals as family members and fund care accordingly, which supports specialty and emergency capability that mature markets took decades to develop. Capacity is being built with modern service mix assumptions from the start.
Market Impact: Only 17% of animals insured

Technician Scope Expansion Raises Capacity Per Veterinarian

Veterinary technicians and nurses can legally perform considerably more clinical work in some jurisdictions than others, and expanding that scope is the only realistic route to raising capacity without waiting years for graduate numbers to rise. Practices delegating dentistry, anaesthesia monitoring, sample collection and routine procedures to credentialled technicians see throughput per veterinarian rise materially. Regulatory change is slow and contested within the profession itself, which is the practical obstacle rather than any evidence about safety. Groups lobbying for scope expansion are pursuing the one lever that genuinely relieves the constraint.
Market Impact: Corporate ownership reaches 27%

Market Restraints and Challenges

Household Budgets Cap Pricing With No Insurance Behind

Only around 17% of treated animals carry insurance, so an average visit near 262 dollars and an emergency running to thousands are funded directly from household income. The root cause is that pet insurance penetration remains low outside a few markets and shows no sign of rapid change. Commercially this makes declined and deferred care a permanent feature rather than a downturn phenomenon, and the profession's own term for the consequence is economic euthanasia. Practices respond with payment plans, wellness subscriptions and tiered treatment options, which help without resolving anything fundamental.
Market Impact: Attrition intent reaches 34% of clinicians

Corporate Ownership Has Strained Clinician Relationships

Roughly 27% of practices sit within group operators, and clinicians report that acquisition frequently changed caseload targets, pricing discretion and clinical autonomy in ways nobody described during the transaction. The root cause is that a practice valued on earnings multiples is managed toward earnings, which is rational for an owner and corrosive for a professional workforce already under strain. Commercially this feeds directly into attrition. Responses include clinical governance separation, equity participation for veterinarians and slower integration, which the better operators have adopted and the rest have not. Attrition follows directly from it.
Market Impact: Wellness grows at only 4.4%
3 additional market trends, 4 additional growth drivers, and 2 additional restraints and challenges are covered in the full report. Contact sales@marketmindsadvisory.com to access the complete intelligence.

Segment CAGR and Growth Architecture

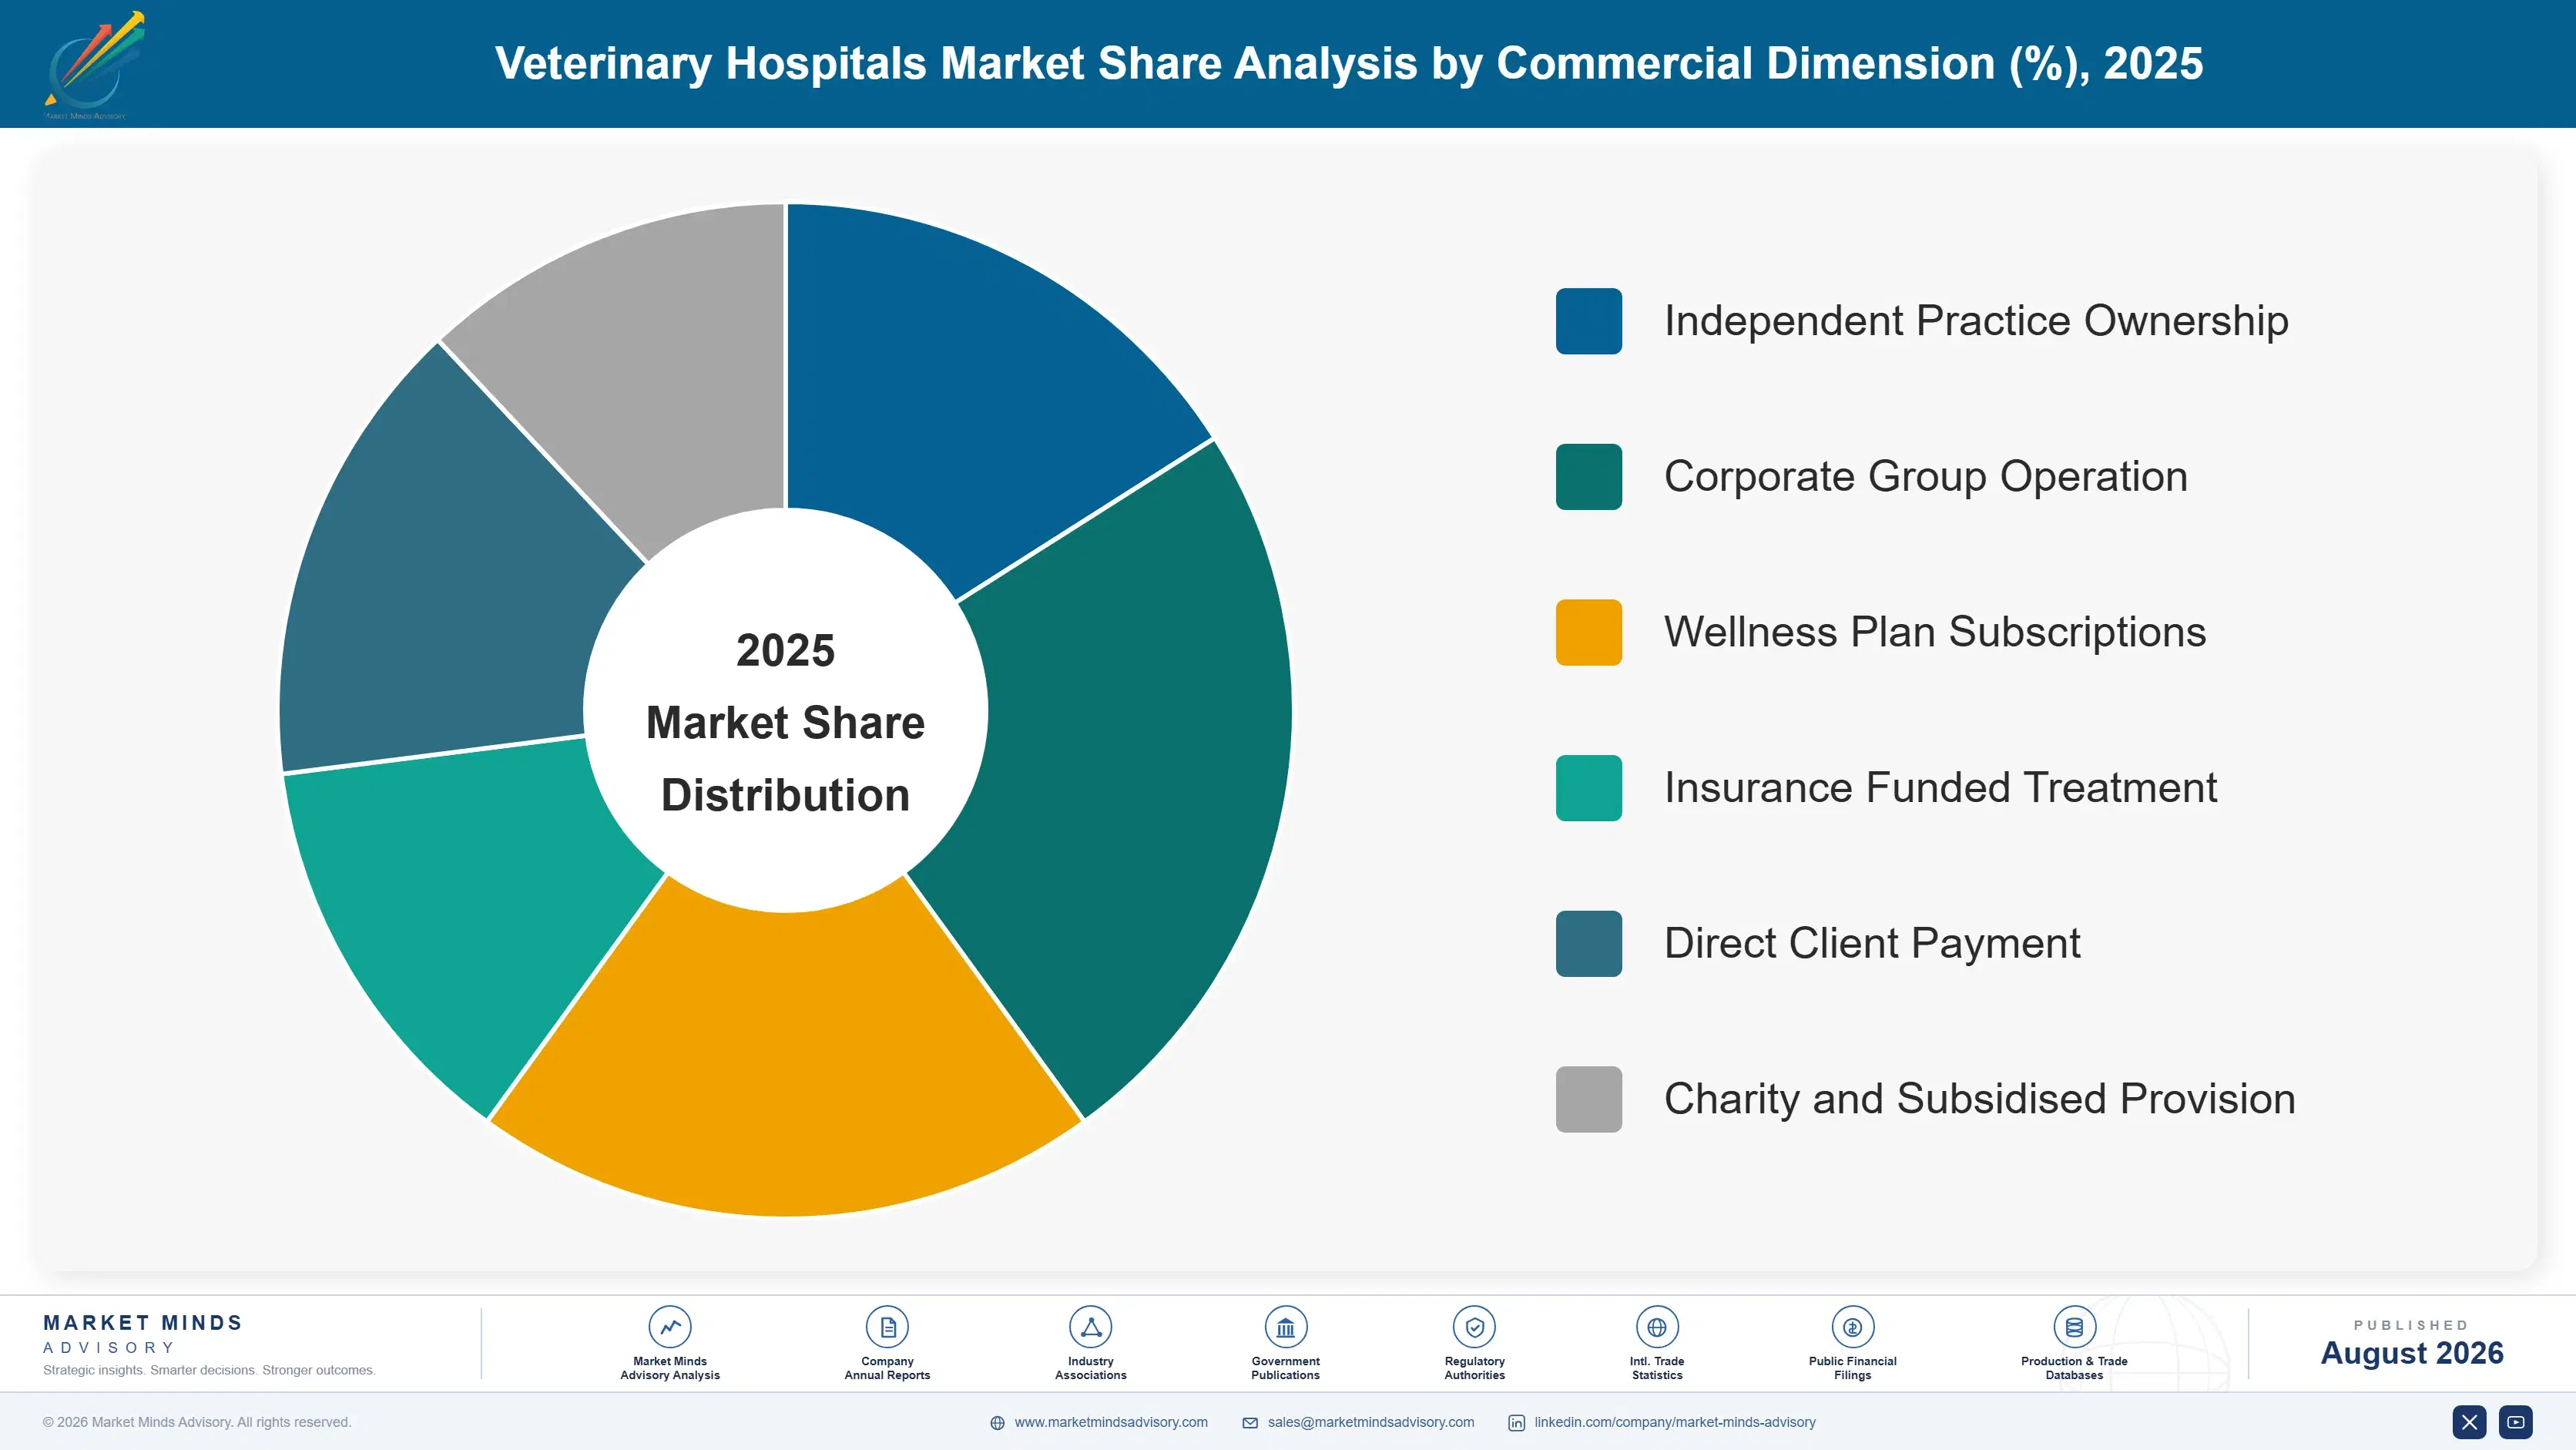
Segmentation follows clinical service line, since each line differs in what it earns per hour of veterinarian time and in whether anything outside a hospital can deliver it. Six lines cover practice revenue, from routine vaccination to overnight critical care. Growth concentrates where the work cannot be unbundled and cannot be moved elsewhere. Substitution decides the rest.
veterinary-hospitals-market-market-share-analysis-1787641504703

Emergency and Critical Care

Out of hours and critical presentations requiring immediate assessment, stabilisation, hospitalisation and frequently surgery, delivered by dedicated emergency hospitals or by general practices running rotas. At 11.1% this is the fastest growing service line, half again the market rate of 7.4%, and out of hours presentation volume rises around 11% each year. The driver is changed owner behaviour rather than changed disease patterns, since people now present at unsocial hours for conditions that previously waited until morning. Revenue per case is the highest anywhere in practice and so is the emotional difficulty, because owners arrive frightened, cannot evaluate what is proposed and frequently cannot fund it either. Staffing an overnight rota is the hardest problem in practice.
CAGR 11.1%

Specialty Referral Services

Board certified surgery, internal medicine, oncology, cardiology, dermatology and neurology delivered at referral hospitals taking cases beyond general practice capability. Growth of 9.6% is second fastest, driven by owner willingness to pursue treatment that would have been unthinkable a generation ago and by general practitioners referring more readily as specialty capacity expands. Revenue per case is high and so is capital intensity, since imaging, theatre and hospitalisation facilities all sit behind it. The binding constraint is specialist supply rather than demand: residency training positions are limited and take years to complete, so referral waiting times lengthen as demand rises. Waiting times lengthen as demand rises faster than residency output does.
CAGR 9.6%
Full segment breakdown across 6 segments available in the complete report.

Regional Architecture and Country Demand Map

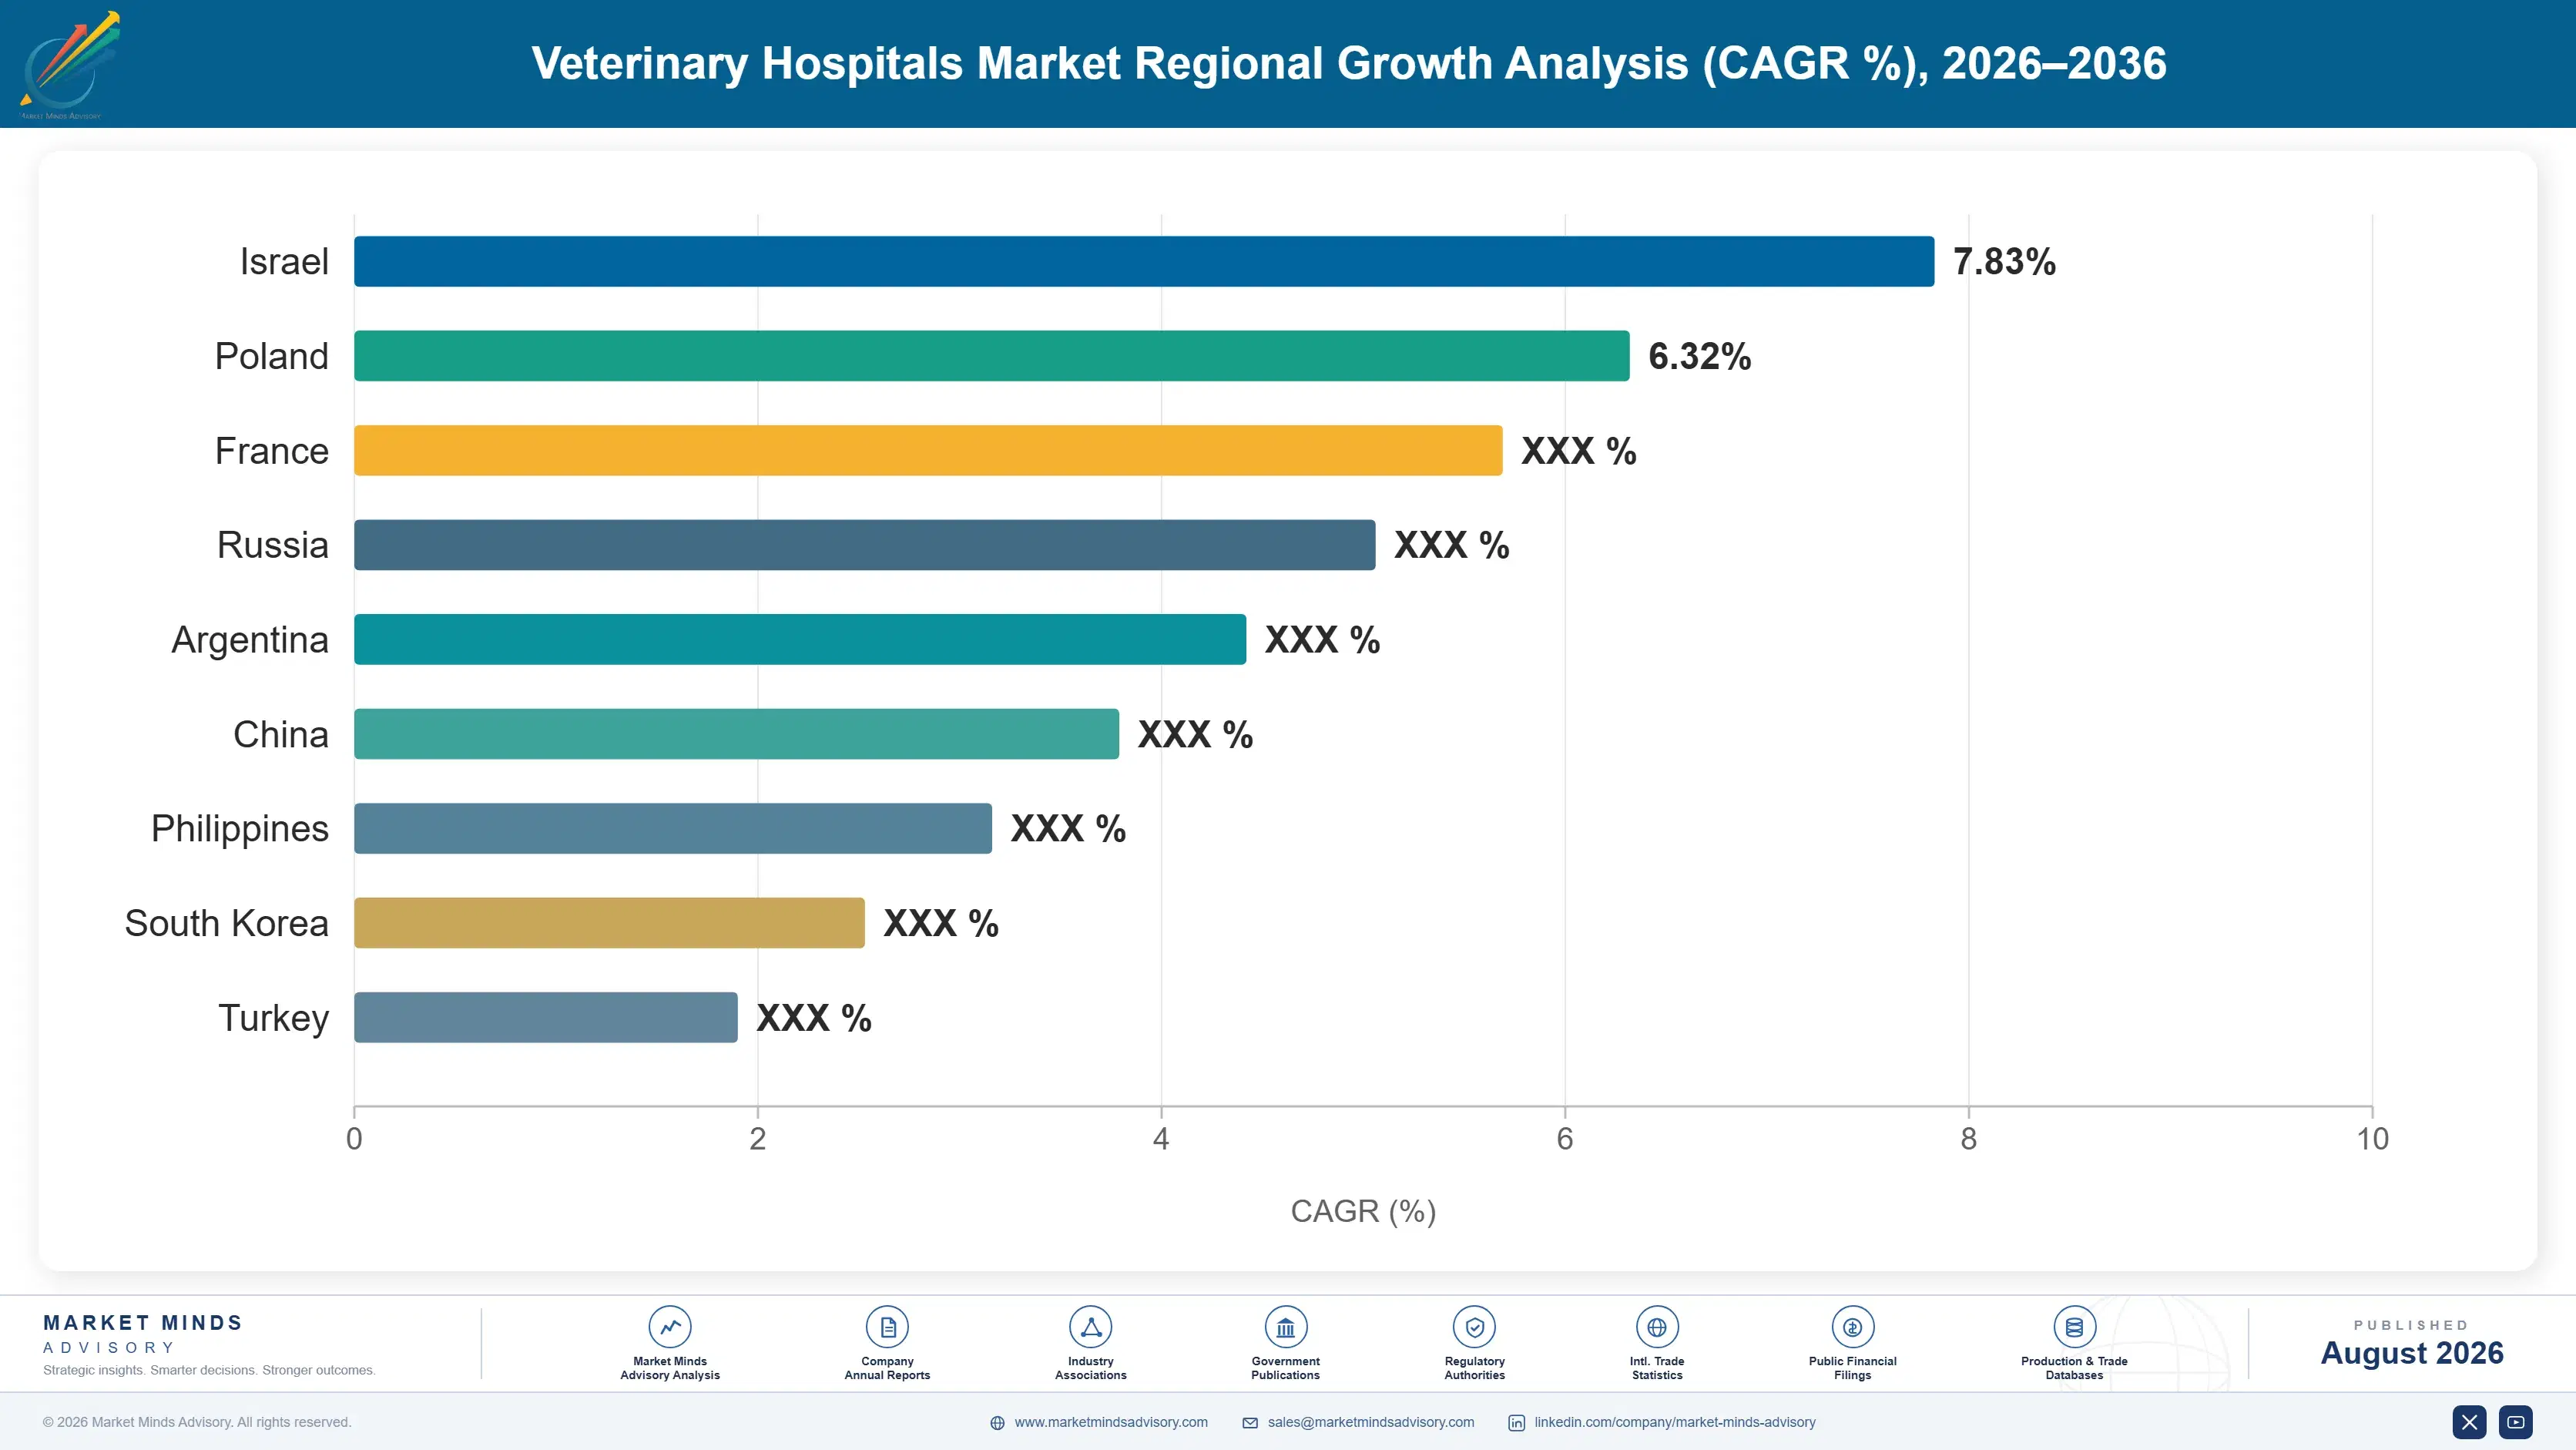
North America holds the largest share at 32%, on companion animal spending no other region approaches. Western Europe follows at 24% with higher insurance penetration. China grows fastest of any country covered at 15.8% on urban hospital capacity being built from nothing. Clinician supply constrains all of them.

North America

Spending per animal rather than animal numbers explains this 32% share. American owners fund treatment that would be declined almost anywhere else, and specialty referral capability here is the deepest in the world with board certified capacity across every discipline. Corporate consolidation has advanced furthest here too, with group operators holding a substantial share of clinics and facing the workforce consequences most acutely. Insurance penetration remains low at well under a fifth of animals, so an average visit near 262 dollars is paid directly. Emergency hospital networks have expanded rapidly as owners present out of hours at rising rates. Growth of 6.8% reflects capacity constrained by clinicians rather than by demand.
Share: 32% | CAGR: 6.8% (2026 to 2036)

Western Europe

Insurance penetration gives this 24% share a different character from North America. Swedish and British coverage is among the highest anywhere, which removes some of the discretionary character from treatment decisions and supports referral volumes that uninsured markets cannot sustain. British consolidation is advanced and has attracted competition authority attention over pricing transparency and referral practices within groups. German and Dutch practice is technically strong with good specialty provision. Southern European ownership and spending patterns differ considerably, with far less referral activity. Growth of 5.8% is the lowest of the seven regions, reflecting mature provision and workforce pressures similar to North America. Consolidation has drawn regulatory attention here. Workforce pressure mirrors America.
Share: 24% | CAGR: 5.8% (2026 to 2036)
Regional intelligence for 5 additional markets available in the complete report: East Asia, South Asia and Pacific, Latin America, Middle East and Africa, Eastern Europe. Contact sales@marketmindsadvisory.com.
veterinary-hospitals-market-country-cagr-analysis-1787641505299

Where Practice Value Is Actually Created

Nothing here scales by adding clinics, because the constraint is the person standing in one. Value accrues to whoever retains clinicians, whoever shifts mix toward work that cannot be delivered elsewhere, and whoever raises throughput without waiting on graduate numbers. Four routes carry weight, and three of them are workforce questions rather than commercial ones.

Treat Clinician Retention as the Core Asset

Roughly 34% of veterinarians intend to leave clinical practice within five years, and a clinic without one generates nothing regardless of what the sign says. Groups that invested in scheduling flexibility, clinical autonomy, mental health support and equity participation are growing where competitors holding more sites are not, because rota coverage rather than premises limits capacity. Acquisition multiples were set assuming clinic count was scarce, and the correction is arriving through occupancy rather than through price. Retention spending returns more per dollar than any acquisition currently available in this market.
Market Impact: Addresses the 34% who intend to leave practice

Shift Mix Toward Work Nobody Else Can Deliver

Preventive care grows at 4.4% because retail pharmacy, remote consultation and extended vaccine intervals absorbed routine work that once carried practices. Emergency and critical care grows at 11.1% and specialty referral at 9.6%, because neither can be unbundled or delivered outside a hospital with equipment and staff. Practices structured around wellness throughput are defending a service line that is being competed away from three directions at once. Building emergency rota capability and specialty referral relationships repositions a practice toward revenue that has no substitute available anywhere. Substitution arrived from three directions at once.
Market Impact: Emergency now grows 11.1% against 4.4% in wellness

Expand Technician Scope Wherever Regulation Allows

Delegating dentistry, anaesthesia monitoring, sample collection and routine procedures to credentialled technicians raises throughput per veterinarian by around 22% in practices that do it properly, which is the only capacity lever that does not require waiting years for graduate numbers. Regulatory scope varies enormously between jurisdictions and change is contested inside the profession rather than on evidence. Groups lobbying for expansion and building technician career structures ahead of it are positioned for capacity competitors cannot access. This is slow, unglamorous work with a larger payoff than any clinical investment. The payoff exceeds any clinical investment available.
Market Impact: Raises throughput 22% per clinician without any recruitment

Build Capacity Where Ownership Is Still Growing

China grows at 15.8%, faster than any country covered, with urban hospital networks being built rather than converted in cities where formal veterinary provision barely existed a decade ago. Those facilities are designed around emergency, specialty and diagnostic capability from the start instead of inheriting a wellness throughput model. Regional growth of 9.6% across South Asia and Pacific follows similar logic from a smaller base. Building clinician training pipelines alongside capacity is what separates operators who expand successfully from those who open sites and cannot staff them. Staffing pipelines matter more than premises.
Market Impact: Captures the 15.8% Chinese national market growth rate

Who Controls the Margin Pool

This market remains genuinely fragmented despite a decade of consolidation. The top five hold 14% of practice revenue and treated animal volume, the basis applied consistently here, and roughly 27% of practices sit within group operators of any size. Mars Veterinary Health leads on scale across general practice, referral and emergency, with the distance to others reflecting acquisition capacity rather than any operating advantage.
Competition runs on three fronts that have little to do with each other. Consolidated groups compete for acquisitions against each other and increasingly against clinician led buyouts. Practices compete for veterinarians rather than for clients, since demand exceeds capacity almost everywhere. Referral hospitals compete for general practitioner relationships, which is a professional network built over years rather than a commercial contest. None of it resembles ordinary competition.

Rankings will move on workforce outcomes rather than on transaction volume. A group that solves retention gains capacity competitors cannot buy, and several have begun reporting clinician turnover as a headline operating metric. The other pressure point is regulatory attention to consolidation, with competition authorities examining pricing transparency and internal referral practices within groups in more than one market.
veterinary-hospitals-market-company-positioning-matrix-1787641505834

Competitive Moat and Risk Dimensions

MARS VETERINARY HEALTH

Moat: Integrated Referral Network

Holding general practice, specialty referral, emergency and diagnostic laboratory capability within one organisation keeps a case inside the network from first presentation through to specialist treatment, which no independent practice can offer. That structure also gives clinicians career progression from general practice into specialty without changing employer, which matters considerably for retention.
MARS VETERINARY HEALTH

Risk: Internal Referral Scrutiny

Competition authorities in several markets are examining whether integrated groups direct referrals internally in ways that limit client choice or raise prices, and the same structure that creates the operating advantage is what attracts the attention. Remedies could require referral transparency or separation that would remove part of the rationale for building the network at all.
IVC EVIDENSIA

Moat: European Practice Density

Practice density across European markets creates local referral networks, shared rota coverage and relief staffing that individual clinics cannot arrange, which addresses the capacity constraint directly rather than through recruitment alone. Density also improves purchasing terms and allows specialist equipment to be justified across several sites rather than one.
IVC EVIDENSIA

Risk: Clinician Relationship Strain

Consolidation has strained relationships with a professional workforce reporting that acquisition changed caseload expectations and clinical autonomy in ways nobody described beforehand. With roughly 34% of veterinarians intending to leave practice, a group whose brand carries that association among clinicians faces a recruitment problem that operating improvements alone will not fix.

Players Tracked

Prominent Players

Mars Veterinary Health
JAB Holding Company
IVC Evidensia
Thrive Pet Healthcare
VetPartners

Other Key Players

CVS Group
Medivet
Greencross Vets
Pets at Home Vet Group
Rarebreed Veterinary Partners
Heart and Paw
PetIQ
Southern Veterinary Partners
Blue River PetCare
Innovetive Petcare
Alliance Animal Health
Veterinary Emergency Group
PetVet Care Centers
Amerivet Veterinary Partners
Vetsource

Recent Developments

FEBRUARY 2025

Competition authority opens review of veterinary group pricing practices

A national competition authority opened a review of veterinary services covering pricing transparency, internal referral within consolidated groups and client awareness of practice ownership. Group operators had grown to hold a substantial share of practices in the market without corresponding changes to disclosure requirements. Disclosure had not kept pace.
Signal: The very structure that creates operating advantage in consolidation is exactly what draws the regulatory attention
MAY 2025

Group operator reports clinician turnover as headline operating metric

A consolidated veterinary group began reporting clinician turnover alongside financial results, acknowledging that staffed capacity rather than clinic count determines revenue growth. Investors had previously assessed these businesses on site numbers and acquisition pipeline rather than on whether the sites could be staffed at all.
Signal: Reporting turnover publicly admits what these operators have understood privately for several years already by now
SEPTEMBER 2025

Jurisdiction expands credentialled veterinary technician clinical scope

A regulatory authority expanded the clinical procedures credentialled veterinary technicians may perform without direct veterinarian supervision, covering dentistry, anaesthesia monitoring and several routine interventions. Practices adopting delegation properly report meaningfully higher throughput per veterinarian without any additional clinical risk. Throughput rises without any additional clinical risk arising.
Signal: Scope expansion is the only capacity lever that does not require waiting years for more graduates

What Delivering Practice Care Costs

Clinical labour dominates everything else in this business. Veterinarian, technician and support staff compensation accounts for roughly 52% of practice operating cost, with drugs and consumables adding around 19% and premises, equipment and administration covering the remainder. Labour is sourced entirely locally in each market, since veterinary registration is jurisdiction specific and clinical work cannot be delivered remotely at any scale worth counting.
Veterinary wage inflation was the defining cost event of the period and it was driven by scarcity rather than by policy. Competition for clinicians pushed compensation up sharply through 2021 and 2022 across every developed market, and company annual reports from listed group operators documented the margin effect in detail. Drugs and consumables moved separately, tracking pharmaceutical manufacturer pricing and, for imported items in emerging markets, currency movement rather than any domestic factor.

Exposure divides by pricing freedom rather than by scale. A practice able to reprice annually passes wage inflation to clients, though only until household budgets refuse it at an average visit near 262 dollars with 17% insurance behind them. Group operators with centralised pricing move faster than independents, who frequently absorb increases instead. Emergency and referral work carries increases most easily.
veterinary-hospitals-market-cost-volatility-analysis-1787641506033

Delegate clinical work to credentialled technicians

Technician time costs a fraction of veterinarian time and can legally cover more clinical work than most practices delegate, particularly dentistry, anaesthesia monitoring and sample collection. Practices delegating properly raise throughput per veterinarian materially while reducing cost per procedure at the same time. The obstacle is clinical culture rather than regulation, since many delegate less than the law permits.

Reprice emergency and referral work ahead of wellness

Emergency and specialty work carries price increases considerably better than routine care does, because alternatives are limited and owners are not comparing across practices at two in the morning. Wellness pricing faces retail and remote competition that emergency work does not. Practices repricing uniformly lose wellness volume while leaving value unclaimed where it would have been accepted.

Build relief and rota sharing across nearby sites

Rota gaps rather than premises limit capacity, and a single clinician absence can close a site for a day in an independent practice. Groups with local density cover each other and reduce reliance on expensive relief agencies that price scarcity aggressively. Independents forming informal cover arrangements with neighbouring practices achieve much of the same benefit without any transaction taking place.

Portfolio Architecture for Margin Defence

Margin architecture follows how substitutable a service line is. Preventive care earns least, because retail pharmacy, remote consultation and extended vaccine intervals all compete for the same work and clients compare prices readily. Surgery and dentistry earn moderately on clinical capability. Emergency and specialty referral earn most, because nothing outside a hospital delivers them and nobody shops around during a crisis.
The tension is that the highest earning work is the hardest to staff and the hardest to feel good about. Emergency rotas are the leading cause of clinician burnout and specialty positions require years of residency training that limits supply absolutely. A practice shifting mix toward emergency and referral is shifting toward work that pays better and accelerates the workforce problem it already has.

High value pools concentrate in emergency capability and specialty referral, both of which require capital, staffing and reputation that take years to assemble. Everything in the preventive tier faces substitution from channels that did not exist a decade ago. Groups that built emergency and referral capability before consolidation multiples rose hold positions that cannot now be bought at any sensible price.

Preventive and Wellness Services

Vaccination, parasite control and routine health checks competing against retail pharmacy, remote consultation and extended protocol intervals. Clients compare prices readily and the work generates the least value per hour of clinician time available.
Gross Margin: 22-25%

Surgery, Dentistry and Diagnostics

Elective surgery, dental procedures and in house imaging and laboratory work requiring equipment and clinical capability a client cannot source elsewhere. Margin holds on capability rather than on any absence of alternatives.
Gross Margin: 38-41%

Emergency and Specialty Referral

Out of hours critical care and board certified specialty treatment that nothing outside a hospital can deliver and nobody shops around for. Margin is the best available and the staffing burden behind it is the heaviest in the profession.
Gross Margin: 48-51%
veterinary-hospitals-market-portfolio-architecture-1787641506548

High-value Sub-segments and Strategic Watch-out

Emergency and Critical Care

The fastest growing line at 11.1% and the hardest to staff, since overnight rotas drive clinician burnout more than any other work in practice. Owners present out of hours at rising rates for conditions that previously waited, which reflects changed attitudes rather than changed disease.
Gross Margin: 48-51%

Specialty Referral Services

Second fastest at 9.6% and constrained by specialist supply rather than by demand, since residency positions are limited and take years to complete. Referral waiting times lengthen as demand rises, which is a capacity problem no commercial decision resolves quickly. Residency output cannot be accelerated.
Gross Margin: 46-49%

Diagnostics and Imaging Services

Growing at 8.4% as advanced imaging becomes standard in general practice rather than referral only, supported by equipment financing that puts computed tomography within reach of larger clinics. It also generates referral flow into surgery and specialty work. Imaging also feeds surgery and specialty referral volume downstream.
Gross Margin: 38-41%

Preventive and Wellness Care

Growing at only 4.4% and losing work to retail pharmacy, remote consultation and vaccine protocols that extended intervals considerably. It remains the relationship that brings a client into a practice, which is why nobody abandons it despite the economics. It brings clients in, which is why nobody abandons it.
Gross Margin: 22-25%

How Practice Revenue Actually Recurs

Recurrence in this business is a relationship rather than a subscription. A household that registers an animal with a practice returns for years across wellness, illness and eventually end of life care, and the lifetime value of that relationship far exceeds any individual visit near 262 dollars. Wellness plans formalise some of it, though loyalty rests on trust in a clinician rather than a brand.
Stickiness therefore follows the veterinarian rather than the premises, which consolidators discovered expensively. Clients frequently move practice when a clinician leaves, particularly for complex cases where the relationship carries clinical history nobody else holds. Emergency presentations are the exception, since owners attend whatever is open at the time and rarely return afterwards. Referral relationships sit with the general practitioner rather than with the owner at all.

The client has changed in ways the profession finds difficult. Owners now research conditions before arriving, question recommendations, compare prices online and treat animals as family members whose treatment they will fund substantially. That produces higher spending and considerably more conflict, and client aggression appears near the top of every survey asking why veterinarians leave. The revenue and the attrition come from the same source.
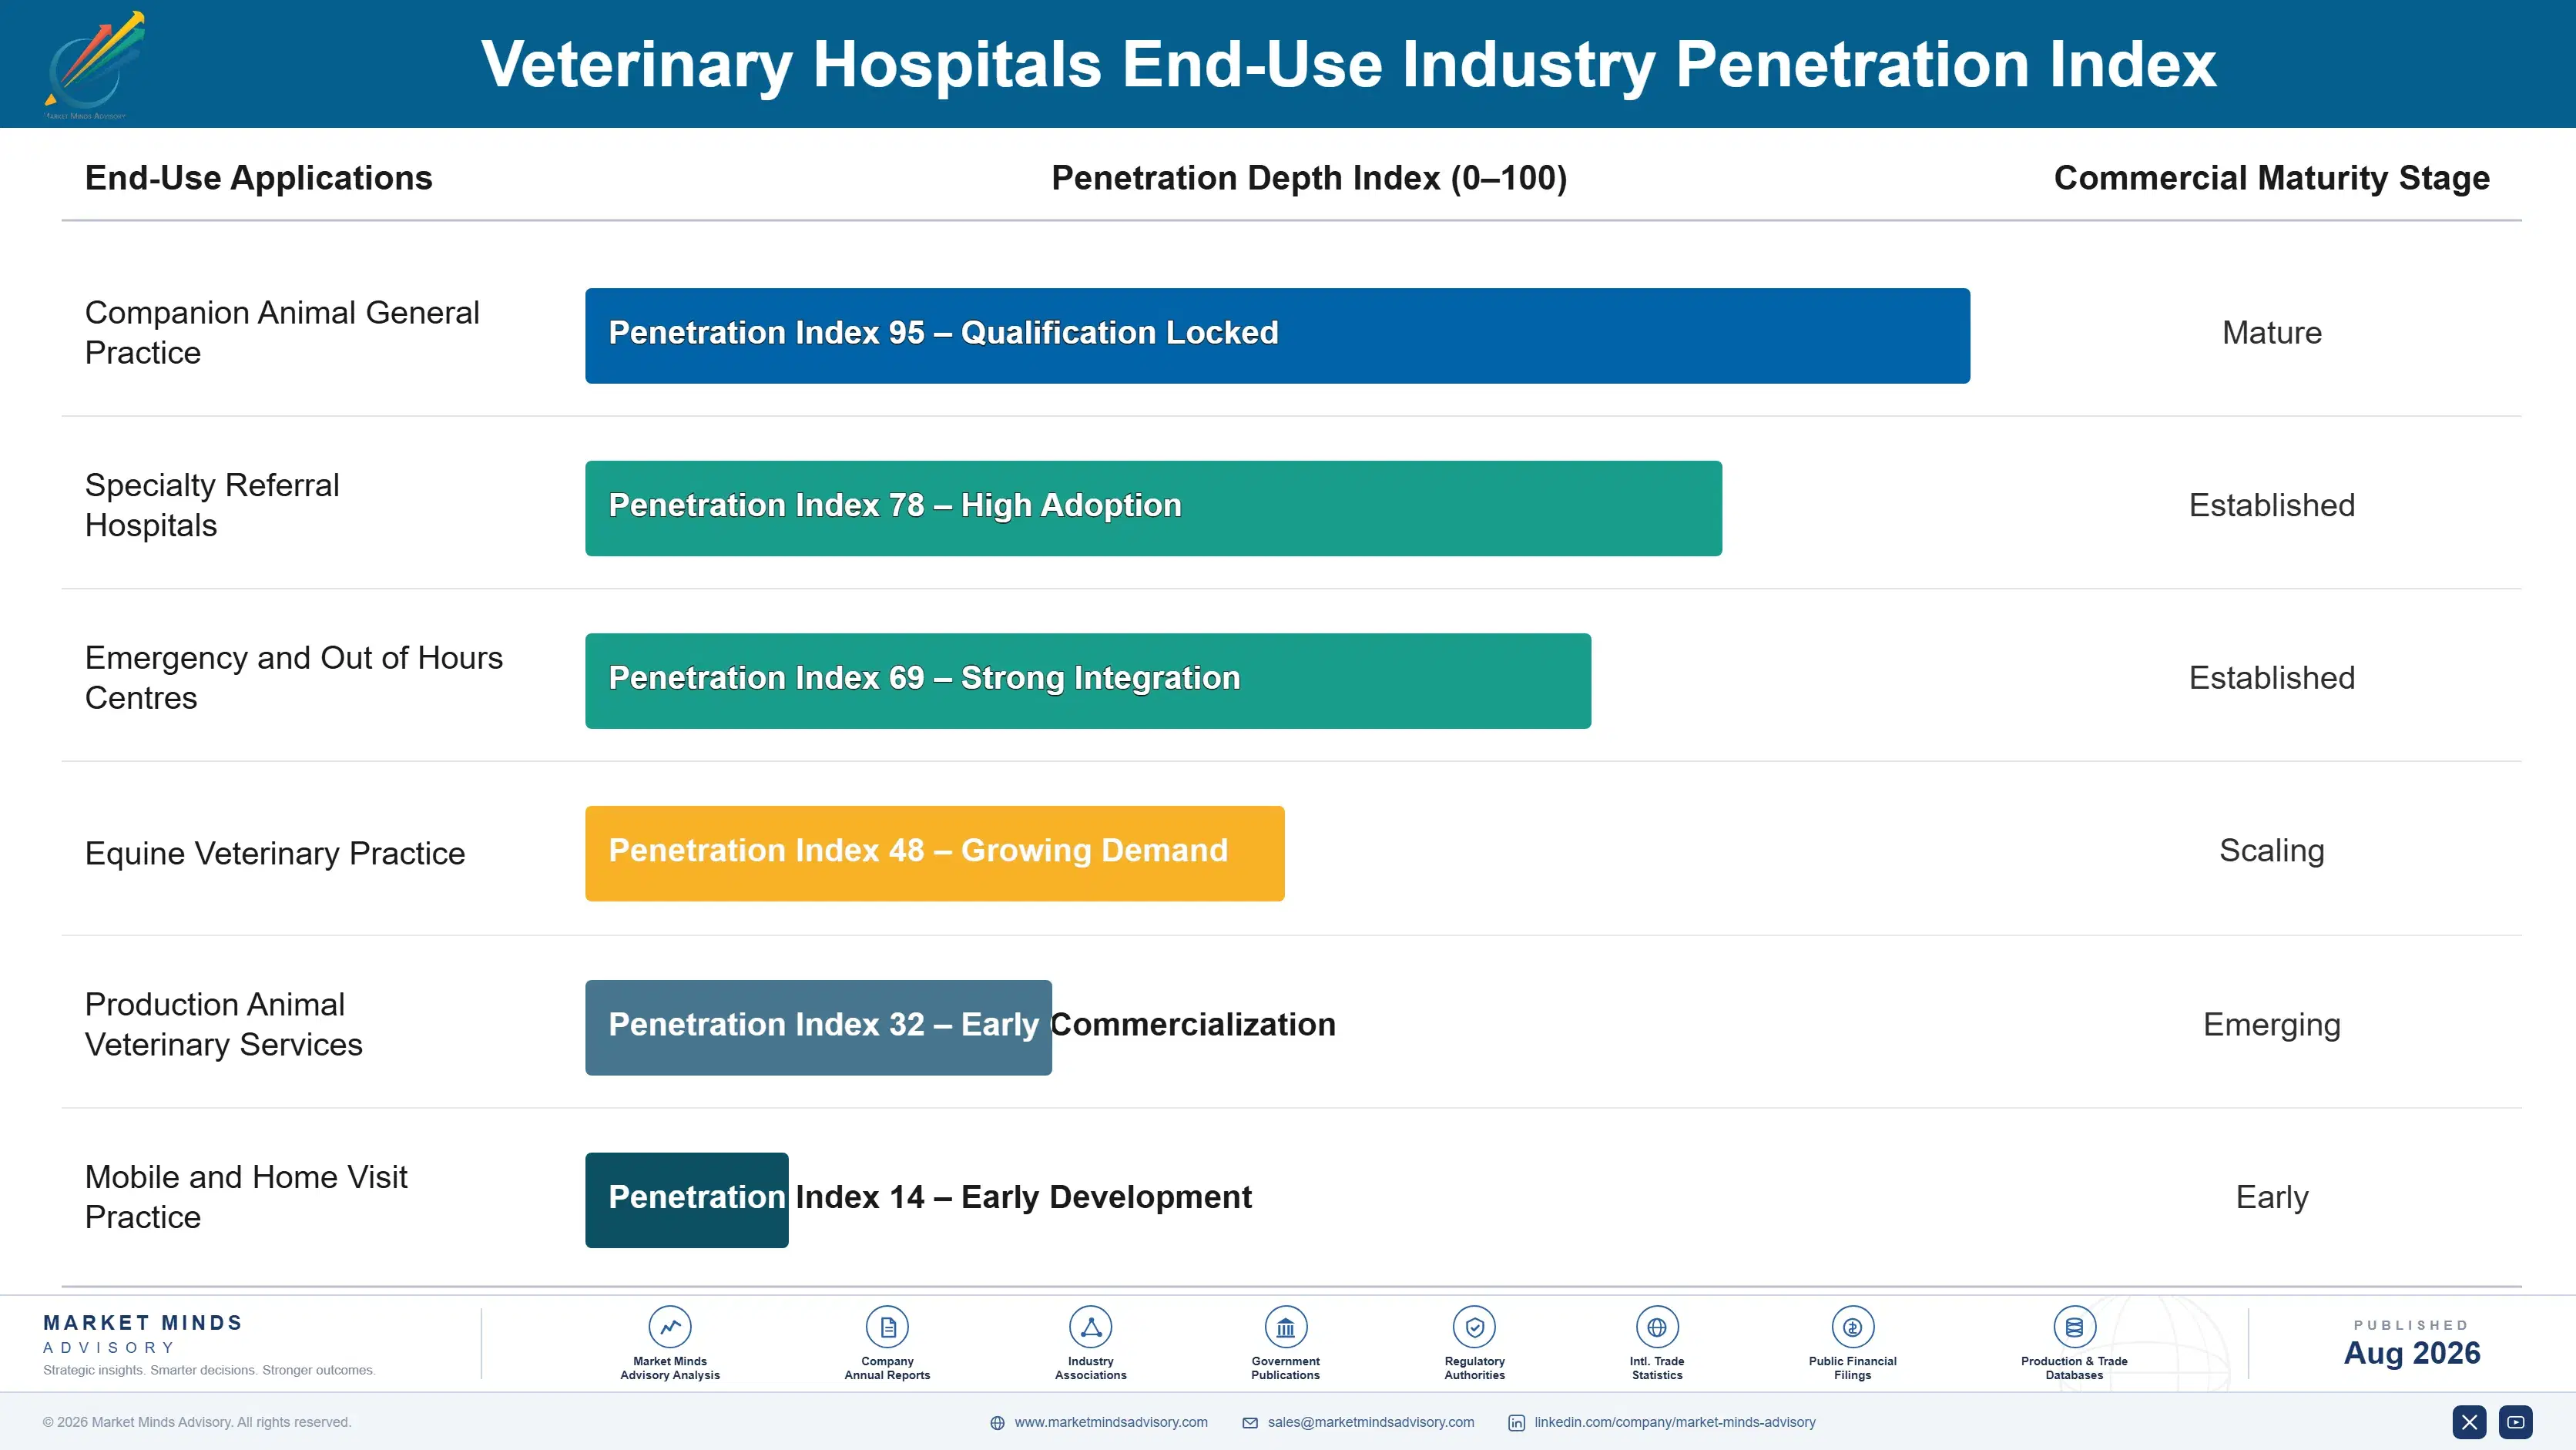
veterinary-hospitals-market-end-use-penetration-index-1787641507049

Where This Industry Rewards Focus

These are among the four positions where our research anticipates prominent divergence between winners and laggards over the coming forecast period. Each is grounded in the demand model, the regulatory perimeter, and the announced capacity pipeline.
01 / CLINICIAN RETENTION PRIORITY

Buying clinics solved nothing about the actual constraint

Roughly 34% of veterinarians intend to leave clinical practice within five years and graduate output cannot expand quickly, because school places are limited by clinical teaching capacity rather than by applicant numbers anywhere. A group holding four hundred sites with rota gaps generates less than an independent with two clinicians who stay, which is a correction arriving through occupancy rather than through valuation. Retention spending returns considerably more per dollar than any acquisition currently available at prevailing multiples in this market.
02 / SERVICE MIX REPOSITIONING

Wellness is being competed away from three directions

Preventive care grows at 4.4% because retail pharmacy, remote consultation and extended vaccine intervals have all absorbed work that once carried these practices entirely. Emergency and critical care grows at 11.1% against a market rate of 7.4% and specialty referral at 9.6%, because neither can be unbundled or delivered outside a hospital holding equipment and staff. Practices still structured around wellness throughput are defending a service line facing substitutes arriving from channels that did not exist ten years ago at all.
03 / CAPACITY LEVER ACCESS

Technician scope beats waiting for more graduates

Delegating dentistry, anaesthesia monitoring, sample collection and routine procedures to credentialled technicians raises throughput per veterinarian by around 22% where practices do it properly, and it is the only capacity lever that works inside a planning horizon. Regulatory scope varies enormously between jurisdictions and change is contested inside the profession rather than on any evidence about safety. Groups lobbying for expansion and building technician career structures ahead of it are pursuing the only lever that genuinely relieves this constraint at all.
04 / GREENFIELD MARKET BUILDING

New capacity carries no legacy service mix

China grows at 15.8%, faster than any country covered, with urban hospital networks being built rather than converted in cities where formal veterinary provision barely existed a decade ago. Those facilities are designed around emergency, imaging and specialty capability from the very outset rather than inheriting the wellness throughput model Western practices must now reposition away from. Building clinician training pipelines alongside physical capacity is what separates the operators who expand successfully from those opening sites they simply cannot staff.

Engagement Snapshot From the Field

A live engagement with an industry participant carrying material or product regulatory and market exposure ahead of a defining policy shift, showing how our research translates into a defensible multi-year portfolio strategy.
MARKET MINDS ADVISORY · CLIENT ENGAGEMENT SUMMARY
Veterinary Hospitals Producer Strategic Portfolio Review and Transition Roadmap 2026·Investment Scenario on Veterinary Hospitals Exposure Evaluation 2025-26
CLIENT PROFILE
A consolidated veterinary group operating roughly 240 general practice clinics and four referral hospitals across three European markets. Annual revenue was approximately 620 million dollars (client-reported, unverified by MMA), with 61% from preventive and general practice work. Clinician vacancy rates had risen for three consecutive years and two acquisitions had been paused for want of staffing.
STRATEGIC CHALLENGE
Revenue growth had slowed despite continued acquisition, because newly acquired clinics could not be fully staffed and existing sites were losing clinicians faster than recruitment replaced them. Management wanted to know whether to continue acquiring, invest in retention, or reposition service mix. The board still measured performance on clinic count and acquisition pipeline.
MMA APPROACH
MMA modelled revenue capacity by staffed clinician hours rather than by site count, which had never been done at group level. Retention economics were costed against acquisition economics on a comparable basis. Forty-seven expert interviews with employed veterinarians, practice managers and clinicians who had left the group established what actually drives departure and what would have prevented it.
KEY FINDINGS
  1. Staffed clinician hours rather than clinic count explained 79% of revenue variation across the estate, which meant the operating metric the board used was largely uninformative.
  2. Clinicians in 33 of the 47 interviews cited loss of clinical autonomy after acquisition rather than compensation as the primary reason for leaving the group.
  3. Retention investment returned roughly 2.4 times the revenue per pound spent that acquisition did at prevailing multiples, once staffing constraints on acquired sites were included.
  4. Emergency and referral work generated 3 times the contribution per clinician hour of preventive care, and the group was under indexed to both across most of its estate.
CLIENT PROFILE
A consolidated veterinary group operating roughly 240 general practice clinics and four referral hospitals across three European markets. Annual revenue was approximately 620 million dollars (client-reported, unverified by MMA), with 61% from preventive and general practice work. Clinician vacancy rates had risen for three consecutive years and two acquisitions had been paused for want of staffing.
STRATEGIC CHALLENGE
Revenue growth had slowed despite continued acquisition, because newly acquired clinics could not be fully staffed and existing sites were losing clinicians faster than recruitment replaced them. Management wanted to know whether to continue acquiring, invest in retention, or reposition service mix. The board still measured performance on clinic count and acquisition pipeline.
MMA APPROACH
MMA modelled revenue capacity by staffed clinician hours rather than by site count, which had never been done at group level. Retention economics were costed against acquisition economics on a comparable basis. Forty-seven expert interviews with employed veterinarians, practice managers and clinicians who had left the group established what actually drives departure and what would have prevented it.
KEY FINDINGS
  1. Staffed clinician hours rather than clinic count explained 79% of revenue variation across the estate, which meant the operating metric the board used was largely uninformative.
  2. Clinicians in 33 of the 47 interviews cited loss of clinical autonomy after acquisition rather than compensation as the primary reason for leaving the group.
  3. Retention investment returned roughly 2.4 times the revenue per pound spent that acquisition did at prevailing multiples, once staffing constraints on acquired sites were included.
  4. Emergency and referral work generated 3 times the contribution per clinician hour of preventive care, and the group was under indexed to both across most of its estate.
RECOMMENDED STRATEGY
Phase 1: Phase one: change the primary operating metric from clinic count to staffed clinician hours, since that explains 79% of revenue variation across the estate. Phase 2: Phase two: redirect acquisition capital toward retention and clinical autonomy restoration, which returns roughly 2.4 times more revenue per pound spent. Phase 3: Phase three: build emergency and referral capability across regional clusters, since both generate 3 times the contribution per clinician hour.
OUTCOME
The client paused acquisitions for four quarters and redirected capital into retention, clinical governance separation and rota flexibility. Clinician turnover fell materially, previously unstaffed acquired sites reached full operation, and revenue growth resumed without a single further transaction (client-reported, unverified by MMA). The board metric changed permanently as well.

Frequently Asked Questions

Foundational context covering the market sizes, CAGR, scope, country, region and competition that inform every finding below. This section is provided to cover basics and most often pre-purchase conversations, answered from the MMA Primary Research Dataset.

What is the current size of the Veterinary Hospitals Market?

The market was valued at 112.0 billion dollars in 2025, covering clinical services delivered by veterinary hospitals, clinics and referral centres worldwide. It reaches an estimated 120.29 billion dollars during 2026.

How large will the Veterinary Hospitals Market be by 2036?

MMA forecasts 245.63 billion dollars by 2036, an increase of 125.34 billion dollars over the 2026 base. That represents an expansion multiple of 2.04 times across the forecast period.

What is the CAGR for the Veterinary Hospitals Market 2026 to 2036?

The base case compound annual growth rate is 7.4%, with a bull case of 8.6% and a bear case of 6.2%. Technician scope expansion and household spending separate those scenarios.

Which segment is growing fastest?

Emergency and critical care grows at 11.1%, half again the market rate of 7.4%, as owners present out of hours at rising rates. Specialty referral services follow at 9.6%.

Who are the major companies in the Veterinary Hospitals Market?

Mars Veterinary Health, JAB Holding Company, IVC Evidensia, Thrive Pet Healthcare and VetPartners lead on practice revenue and treated animal volume. Together they account for 14% of the market.

Which country is growing fastest?

China grows fastest at 15.8%, as urban hospital networks are built rather than converted in cities where formal veterinary provision barely existed a decade ago.

Report Segmentation Architecture

The full report scope spans multiple orthogonal segmentation dimensions, with cross-tabulated demand data provided for each dimension pair. Coverage extends further to regional breakdowns, trend trajectories, and the competitive detail needed to support segment-level decision-making.

By Clinical Service Line

  • Preventive and Wellness Care
  • Diagnostics and Imaging Services
  • Surgical Services
  • Emergency and Critical Care
  • Specialty Referral Services
  • Dentistry and Ancillary Services

By End-Use Industry

  • Companion Animal General Practice
  • Specialty Referral Hospitals
  • Emergency and Out of Hours Centres
  • Equine Veterinary Practice
  • Production Animal Veterinary Services
  • Mobile and Home Visit Practice

By Commercial Dimension

  • Independent Practice Ownership
  • Corporate Group Operation
  • Wellness Plan Subscriptions
  • Insurance Funded Treatment
  • Direct Client Payment
  • Charity and Subsidised Provision

By Region

  • North America
  • Western Europe
  • East Asia
  • South Asia and Pacific
  • Latin America
  • Middle East and Africa
  • Eastern Europe

Scope, Methodology, and Coverage

Every figure in this report is reproducible from documented input assumptions. The scope below maps the historical period, the forecast horizon, the segmentation dimensions, and the countries covered, alongside the underlying primary and qualitative methodology.
Historical Period
2020 to 2025
Forecast Period
2026 to 2036
Base Year
2025 (USD billions; MMA Primary Research Dataset, August 2026)
Market Definition
Clinical veterinary services delivered by hospitals, clinics and referral centres worldwide, covering preventive and wellness care, diagnostics and imaging services, surgical services, emergency and critical care, specialty referral services, and dentistry and ancillary services across companion animal, equine and production animal work. Measured at practice revenue. Veterinary pharmaceuticals and devices sold to practices, remote telehealth consultation services, pet insurance products, grooming, boarding, and retail pet product sales are excluded from scope.
Quantitative Units
USD billions (current prices); animals treated; USD per visit by clinical service line
Segmentation Dimensions
Clinical service line; end-use industry; commercial dimension; region
Regions Covered
North America, Western Europe, East Asia, South Asia and Pacific, Latin America, Middle East and Africa, Eastern Europe
Countries Covered
United States, Canada, United Kingdom, Germany, Netherlands, Sweden, France, Spain, China, Japan, South Korea, Taiwan, India, Australia, Thailand, Brazil, Chile, Saudi Arabia, Israel, Poland
Key Companies Profiled
Mars Veterinary Health, JAB Holding Company, IVC Evidensia, Thrive Pet Healthcare, VetPartners, CVS Group, Medivet, Greencross Vets, Pets at Home Vet Group, Rarebreed Veterinary Partners, Heart and Paw, PetIQ, Southern Veterinary Partners, Blue River PetCare, Innovetive Petcare, Alliance Animal Health, Veterinary Emergency Group, PetVet Care Centers, Amerivet Veterinary Partners, Vetsource
Quantitative Methodology
Primary survey, n=3,800 respondents, Q4 2025, six countries; demand-side model with trade association cross-validation
Qualitative Methodology
47 expert interviews, Q4 2025; applied to validate demand model assumptions, identify emerging dynamics, and assess competitive positioning
Report Format
PDF and XLSX data workbook (Word format preview document)
Publisher
Market Minds Advisory
Report Code
MMA-2026-HLT-149
Published
August 2026
Contact
sales@marketmindsadvisory.com | www.marketmindsadvisory.com

Purchase the full Veterinary Hospitals Market Report (2026 to 2036).

The full report treats veterinary practice as an industry whose constraint is the clinician rather than the clinic, which is why consolidation transformed ownership without resolving capacity. It sizes all six clinical service lines independently through 2036, models revenue capacity by staffed clinician hours rather than by site count, and quantifies retention economics against acquisition economics on a comparable basis. Regional chapters cover all seven regions, with greenfield capacity building assessed separately from mature market repositioning. Competitive profiling covers 20 participants on one consistent practice revenue basis.
Six clinical service lines sized independently through 2036
Revenue capacity modelled by staffed clinician hours
Retention economics compared against acquisition at prevailing multiples
Technician scope expansion mapped by jurisdiction and procedure
Greenfield capacity assessed separately from mature market repositioning
Twenty participants profiled on one consistent revenue basis

Built For The People Who Decide

From boardroom strategy to bench-side execution, this report is read cover-to-cover by leaders shaping the next decade of their industry, turning demand scenarios, market dynamics and valuation benchmarks into decisions.
CXOs/ Presidents/ VPs/ Managers
M&A and Corporate Development
Strategy Teams and R&D Heads
Procurement and Product Directors
Regulatory and Compliance Leaders
Investor Relations and Equity Analysts