Market Minds Advisory
Veterinary Disinfectant for Pets and Farms Market

Veterinary Disinfectant for Pets and Farms Market: Organic Matter Limits, Regulatory Chemistry Loss and Biosecurity Priced as Insurance

Every disinfectant on the market loses most of its kill performance under heavy soiling, which means a farm that cleans badly and disinfects expensively does worse than one doing the reverse.

Lead Analyst

Alice Ballenger

Published

September 2026

Make Smarter Decisions with Customized Research Insights

Request a free sample report and evaluate market opportunities, growth trends, and competitive dynamics relevant to your business needs.

2025 MARKET VALUE$3.4BMarket Size 2025
2036 FORECAST VALUE$6.9BBase Case , 2026 to 2036
CAGR 2026 TO 20366.6 %Bull 7.8% / Bear 5.4%
INCREMENTAL OPPORTUNITY$3.2BNet 10- year value creation
EXPANSION MULTIPLE1.90x2036 value over 2026 base
Strategic Levers
M&A Pipeline
Regional Outlook
Country Rankings
Competitive Intelligence
Segmental Deep-dive
Call-Us : 91 93563 13602

Executive Snapshot and Market Trajectory

Farm disinfectant is bought as insurance and priced as a commodity, which is why almost nobody earns much on it in a normal year. African swine fever changed that by killing a quarter of the world's pigs and demonstrating that biosecurity preserves capital rather than consuming it.
The binding constraint on performance is not chemistry at all. Every product loses roughly 62% of its kill performance under heavy soiling, and only around 48% of farms complete a full wash before applying anything. A farm cleaning badly and disinfecting expensively gets a worse result than one doing the reverse, which makes the detergent and the protocol arguably worth more than the biocide. Spend per animal never returned to earlier levels.
Regulation is meanwhile removing the cheap actives. European biocidal product rules keep restricting formaldehyde and older chemistries, and aldehyde volumes fall around 9% a year across the region. Each removal pushes volume toward peroxygen systems that cost more and store worse. Those grow fastest at 9.9%, half again the market rate of 6.6%, on regulation rather than on preference. Producers have no appetite for that premium at all.
Market Definition
Chemical disinfectants and biosecurity products used in animal housing, veterinary premises and companion animal environments, covering quaternary ammonium compounds, peroxygen and peracetic acid systems, aldehyde based disinfectants, halogen based disinfectants, phenolic disinfectants, and biocide free and enzymatic systems. Measured at manufacturer selling value including associated application services. Teat dips and dairy hygiene chemicals, human and hospital disinfectants, antibiotics, feed additives and water treatment chemicals are excluded.
Base Year Value
$3.4B in 2025 (MMA Primary Research Dataset, August 2026)
Forecast Period
2026 to 2036, eleven discrete annual values
CAGR
6.6% base case. Bull 7.8%. Bear 5.4%.
Fastest Growth Segment
Peroxygen and Peracetic Acid Systems: 9.9% CAGR
Fastest Growth Country
Vietnam: 12.6% CAGR
Fastest Growth Region
South Asia and Pacific: 8.8% CAGR
Largest Region
East Asia: 30% of 2025 global value
Market Leaders
Ecolab, Neogen Corporation, Kersia Group, Lanxess, Diversey. Source: MMA Primary Research Dataset, July 2026.
Primary Survey
n=3,800 procurement and R&D decision-makers, Q4 2025, six countries
Methodology
Demand-side build-up, cross-validated against public data, 47 expert interviews

Veterinary Disinfectant for Pets and Farms Market Forecast Scenarios

veterinary-disinfectant-for-pets-and-farms-market-size-forecast-scenario-1787641485137
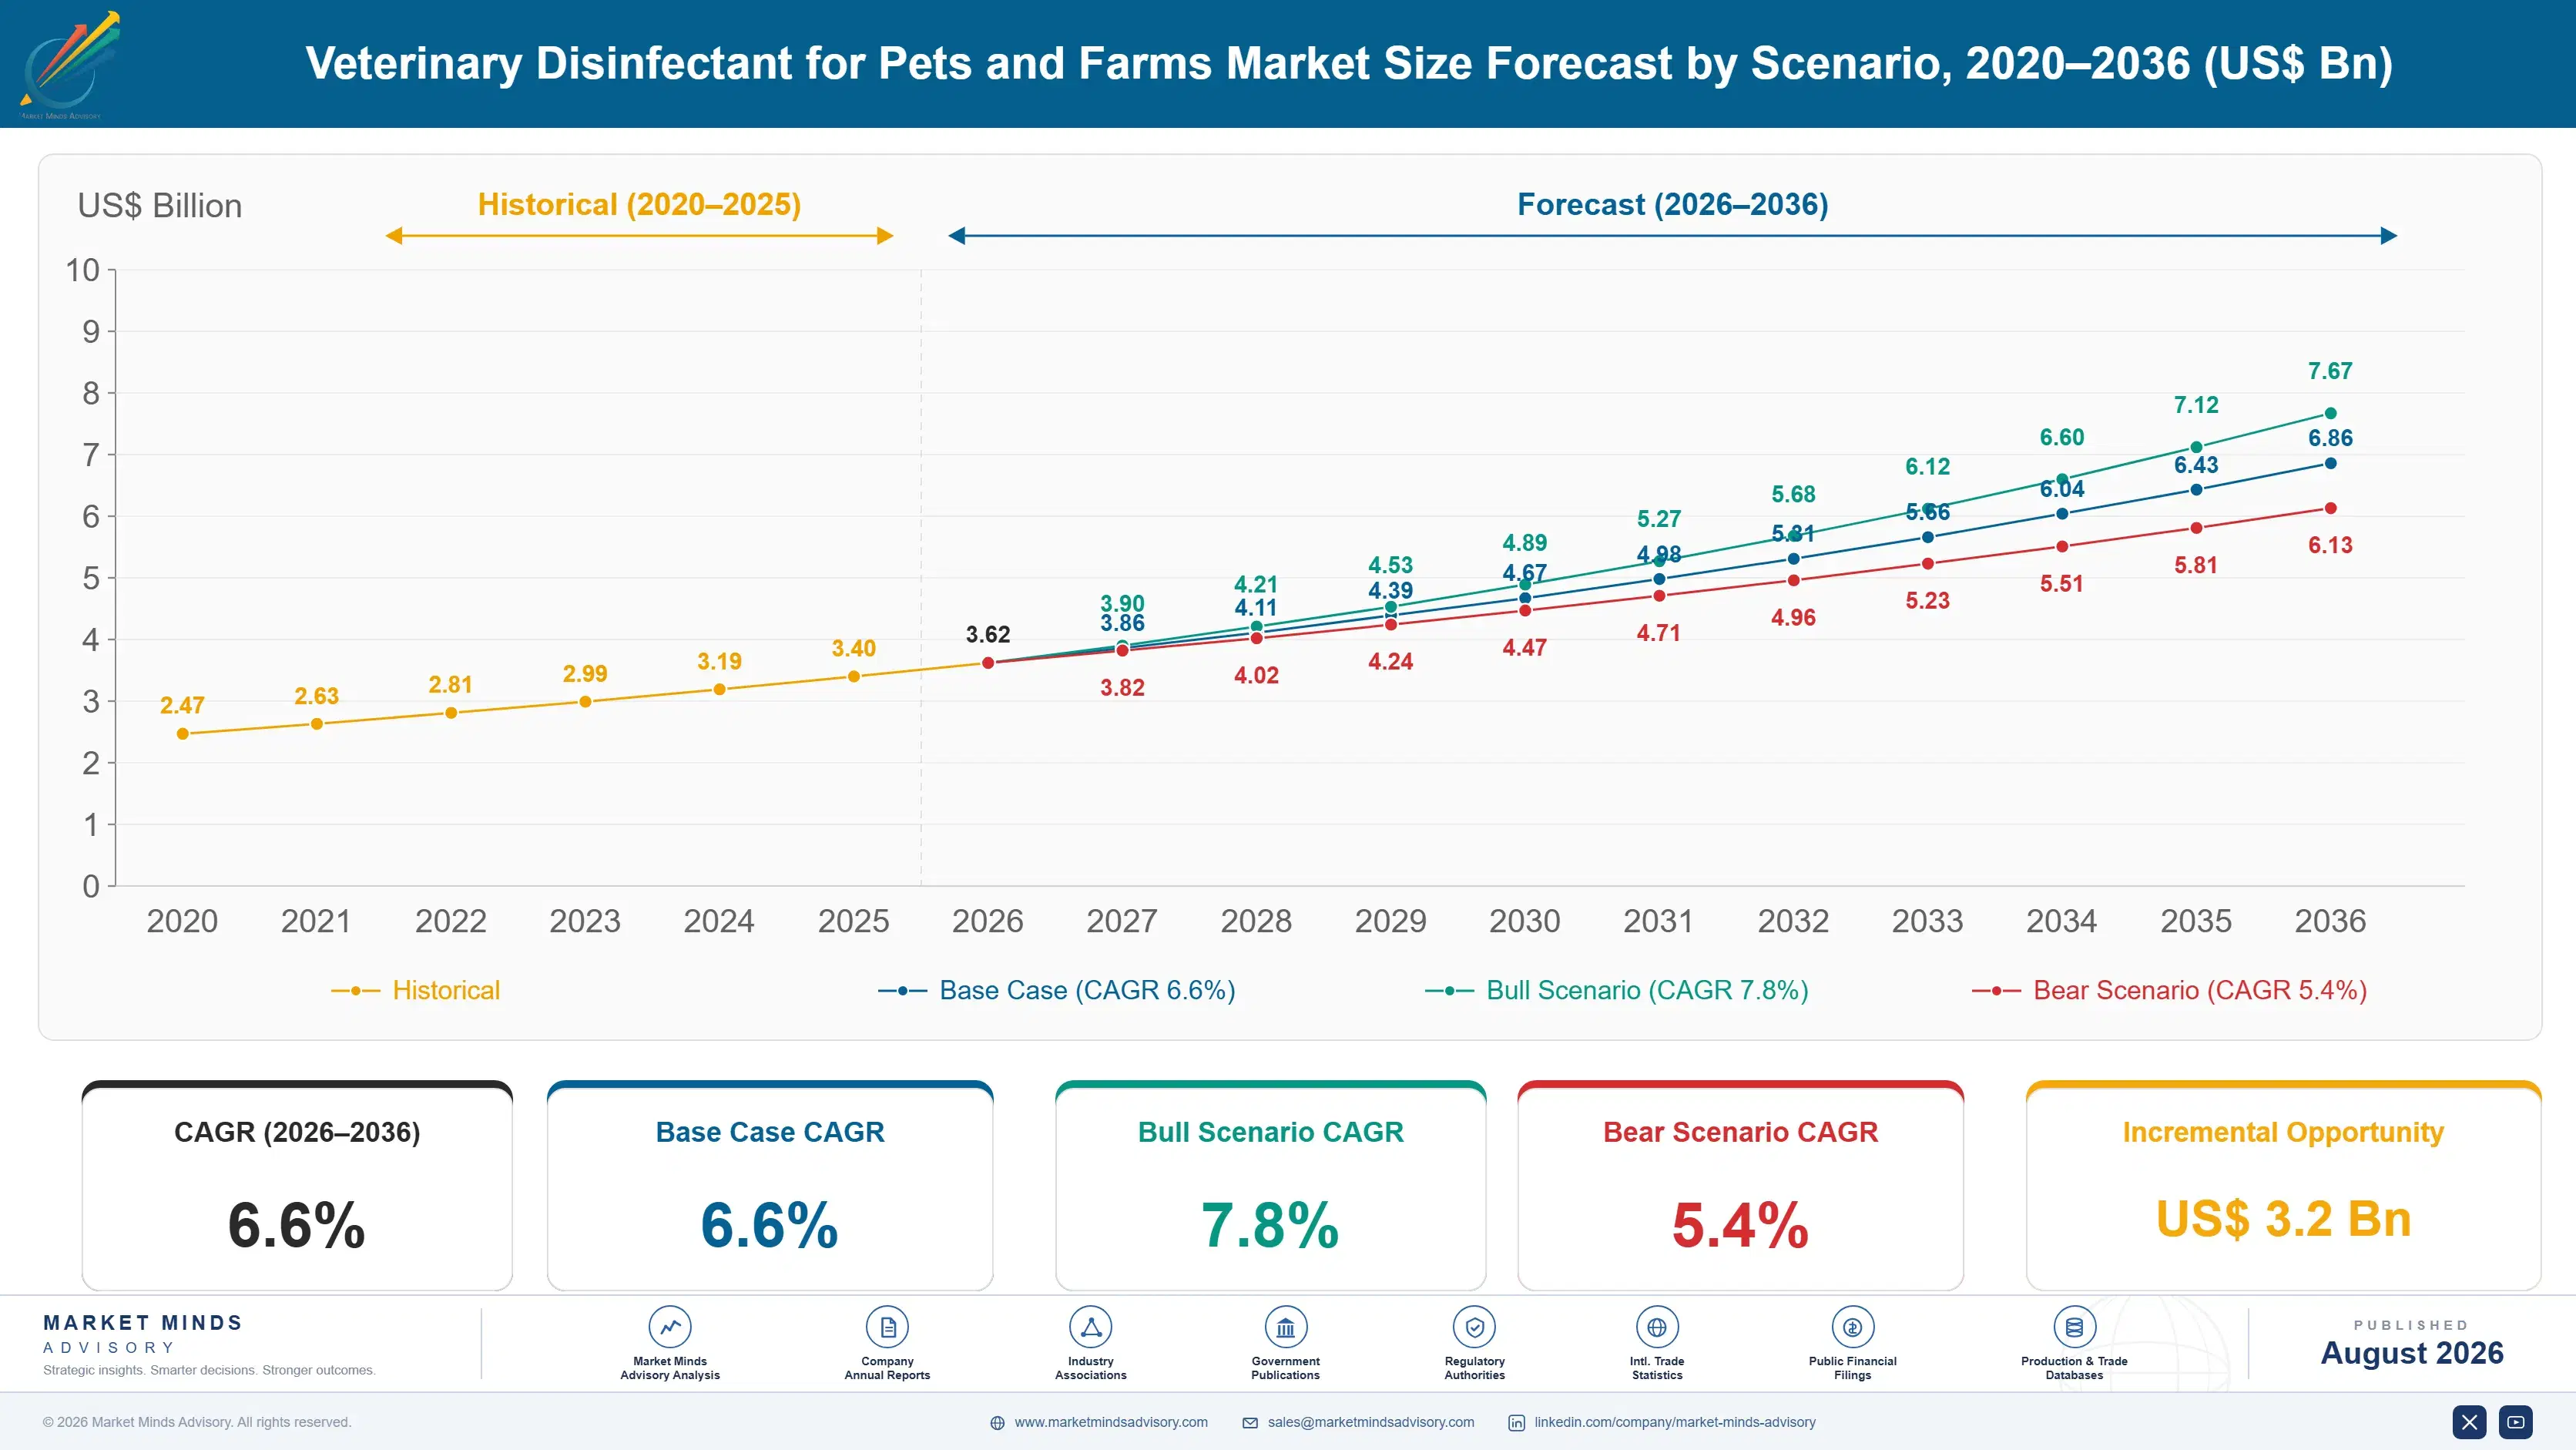
The five years to 2025 were defined by one disease and one regulation. African swine fever removed enormous numbers of pigs across Asia and Europe and forced a rebuild around facilities designed for disinfection, lifting spend per animal permanently. European biocidal review simultaneously restricted several established actives. The 5.6% historical rate averages a biosecurity shock against a commodity market that was flat before it.
The 6.6% base case rests on three mechanisms. Disease driven biosecurity spending has not returned to pre-outbreak levels, because producers who lost herds now treat disinfection as capital protection rather than as a cost line to minimise. Regulatory removal of cheaper chemistries keeps pushing volume toward peroxygen systems at higher price points. And Southeast Asian and Latin American production expansion keeps adding housing built to modern biosecurity specification from the start.
The 7.8% bull case turns on another transboundary disease event, which nobody wants and everybody prices into a contingency. The 5.4% bear case is producer margin: disinfection is one of very few input costs a farm can defer without immediate consequence, and a bad year for pig or poultry prices shows up in disinfectant volumes within a quarter.

Insurance Sold Against a Commodity Price

This category sells insurance and gets paid commodity prices for it. A producer spends around 34 dollars a year per sow place on disinfection, against a herd whose value can be destroyed entirely by one disease incursion, and in a good year that spending looks like a cost to be minimised. African swine fever taught a generation of producers otherwise, and spend per animal has not returned to where it was.
TOP FIVE CONCENTRATION36%Combined formulated volume supplied by the largest manufacturers
ORGANIC MATTER EFFICACY LOSS62%Reduction in kill performance under heavy soiling conditions
BIOSECURITY SPEND PER SOWUSD 34Annual disinfection cost across a breeding herd place
CLEANING PROTOCOL COMPLIANCE48%Farms completing the full wash before applying any disinfectant
ALDEHYDE VOLUME DECLINE9%Annual reduction in older chemistry use across Europe
REGISTRATION COST PER CLAIMUSD 420,000Typical cost of establishing one new efficacy claim
Efficacy in the field bears little relation to efficacy on a test coupon. Every disinfectant is inactivated to some degree by faeces, feed residue and biofilm, with kill performance falling roughly 62% under heavy soiling, and only around 48% of farms complete the full wash step before applying anything. That makes the detergent, the pressure washer and the protocol worth more to an outcome than the biocide poured on afterwards.
Regulation is quietly reshaping the chemistry available. European biocidal product review has restricted formaldehyde and several older actives, and aldehyde volumes fall around 9% annually across the region. Each removal moves demand toward peroxygen systems that cost more and store less stably. Establishing one new efficacy claim costs roughly 420,000 dollars, which concentrates the market further each cycle.
"Suppliers arrive with log reduction data generated on a clean stainless steel coupon. Show me a clean stainless steel surface in a finishing barn and I will take the number seriously, and until then the protocol matters more than the product does."
Director, Animal Health Chemicals and Biosecurity Practice · MMA Chemicals and Materials Practice · August 2026

Market Trends

Regulatory Review Removes the Cheap Chemistries

European biocidal product regulation has restricted formaldehyde and several established actives, and aldehyde volumes across the region fall around 9% a year as a result. Each removal moves demand toward peroxygen and peracetic acid systems, which grow at 9.9% against a market rate of 6.6% and cost considerably more per treated square metre while storing far less stably. This is premiumisation imposed by regulation on a customer base with no appetite for it. Suppliers holding registered peroxygen portfolios gain volume they did not have to win commercially, which is an unusual position in a commodity chemical market.
Market Impact: Spend reaches 34 dollars per sow
Protocol and Service Displace Product as the Value Offer

Only around 48% of farms complete the full wash step before applying disinfectant, and performance falls roughly 62% under heavy soiling, which means most of the variation in outcome comes from the cleaning rather than from the chemistry. Suppliers offering audited protocols, application training and verification swabbing achieve results their products alone never would, and they charge for it. Biocide free and enzymatic systems grow at 8.4%, second fastest in the market, partly because they arrive attached to a service model rather than being poured from a drum by whoever is available.
Market Impact: New housing consumes 40% more

Market Opportunities and Growth Drivers

Transboundary Disease Repriced Biosecurity Spending Permanently

African swine fever removed enormous numbers of pigs across Asia and Europe and destroyed businesses that had treated disinfection as a cost line to trim. Producers rebuilding afterwards designed facilities around disinfection from the start rather than retrofitting it, and spend per animal has not returned to pre-outbreak levels anywhere the disease reached. Vietnam grows at 12.6%, faster than any country covered, on exactly that rebuild. The lesson is durable because the loss was total for those affected, which is a different kind of memory from an ordinary cost pressure.
Market Impact: Performance falls 62% when soiled

Production Expansion Builds Biosecurity In From the Start

New pig and poultry housing across Southeast Asia, Latin America and parts of Africa is being built to modern biosecurity specification, with wash bays, dedicated boot dips, transport disinfection and all in all out capability designed in rather than added later. Retrofitting those features into existing housing is expensive and frequently impossible, so purpose built capacity consumes considerably more disinfectant per animal place than older housing does. Southeast Asian expansion is the largest contributor, and integrators specifying protocols centrally make the supplier decision once for many sites. Retrofitting is rarely possible at all.
Market Impact: Each claim costs 420,000 dollars

Market Restraints and Challenges

Organic Matter Defeats Chemistry Before It Reaches Anything

Kill performance falls roughly 62% under heavy soiling because faeces, feed residue and biofilm inactivate every active chemistry to some degree, and only around 48% of farms complete a proper wash first. The root cause is labour: washing a shed properly takes hours that nobody wants to pay for, and the disinfectant is visible while the cleaning is not. Commercially this caps what any product improvement can deliver in the field. Suppliers respond with combined detergent and disinfectant systems, application training and verification swabbing, which sells a service where a product alone would fail.
Market Impact: Aldehyde volumes fall 9% yearly

Registration Costs Concentrate the Market Every Review Cycle

Establishing a single new efficacy claim costs roughly 420,000 dollars in testing and dossier work, and European review cycles require existing claims to be resubstantiated periodically rather than granted permanently. The root cause is that biocide regulation was tightened for good public health reasons without regard for the size of the animal health market carrying the cost. Commercially each cycle removes smaller suppliers who cannot fund the work. Responses include consortium dossiers shared across companies, portfolio rationalisation onto fewer registered claims, and acquisition of registrations rather than businesses. Consolidation follows every single cycle.
Market Impact: Compliance sits at only 48%
3 additional market trends, 4 additional growth drivers, and 2 additional restraints and challenges are covered in the full report. Contact sales@marketmindsadvisory.com to access the complete intelligence.

Segment CAGR and Growth Architecture

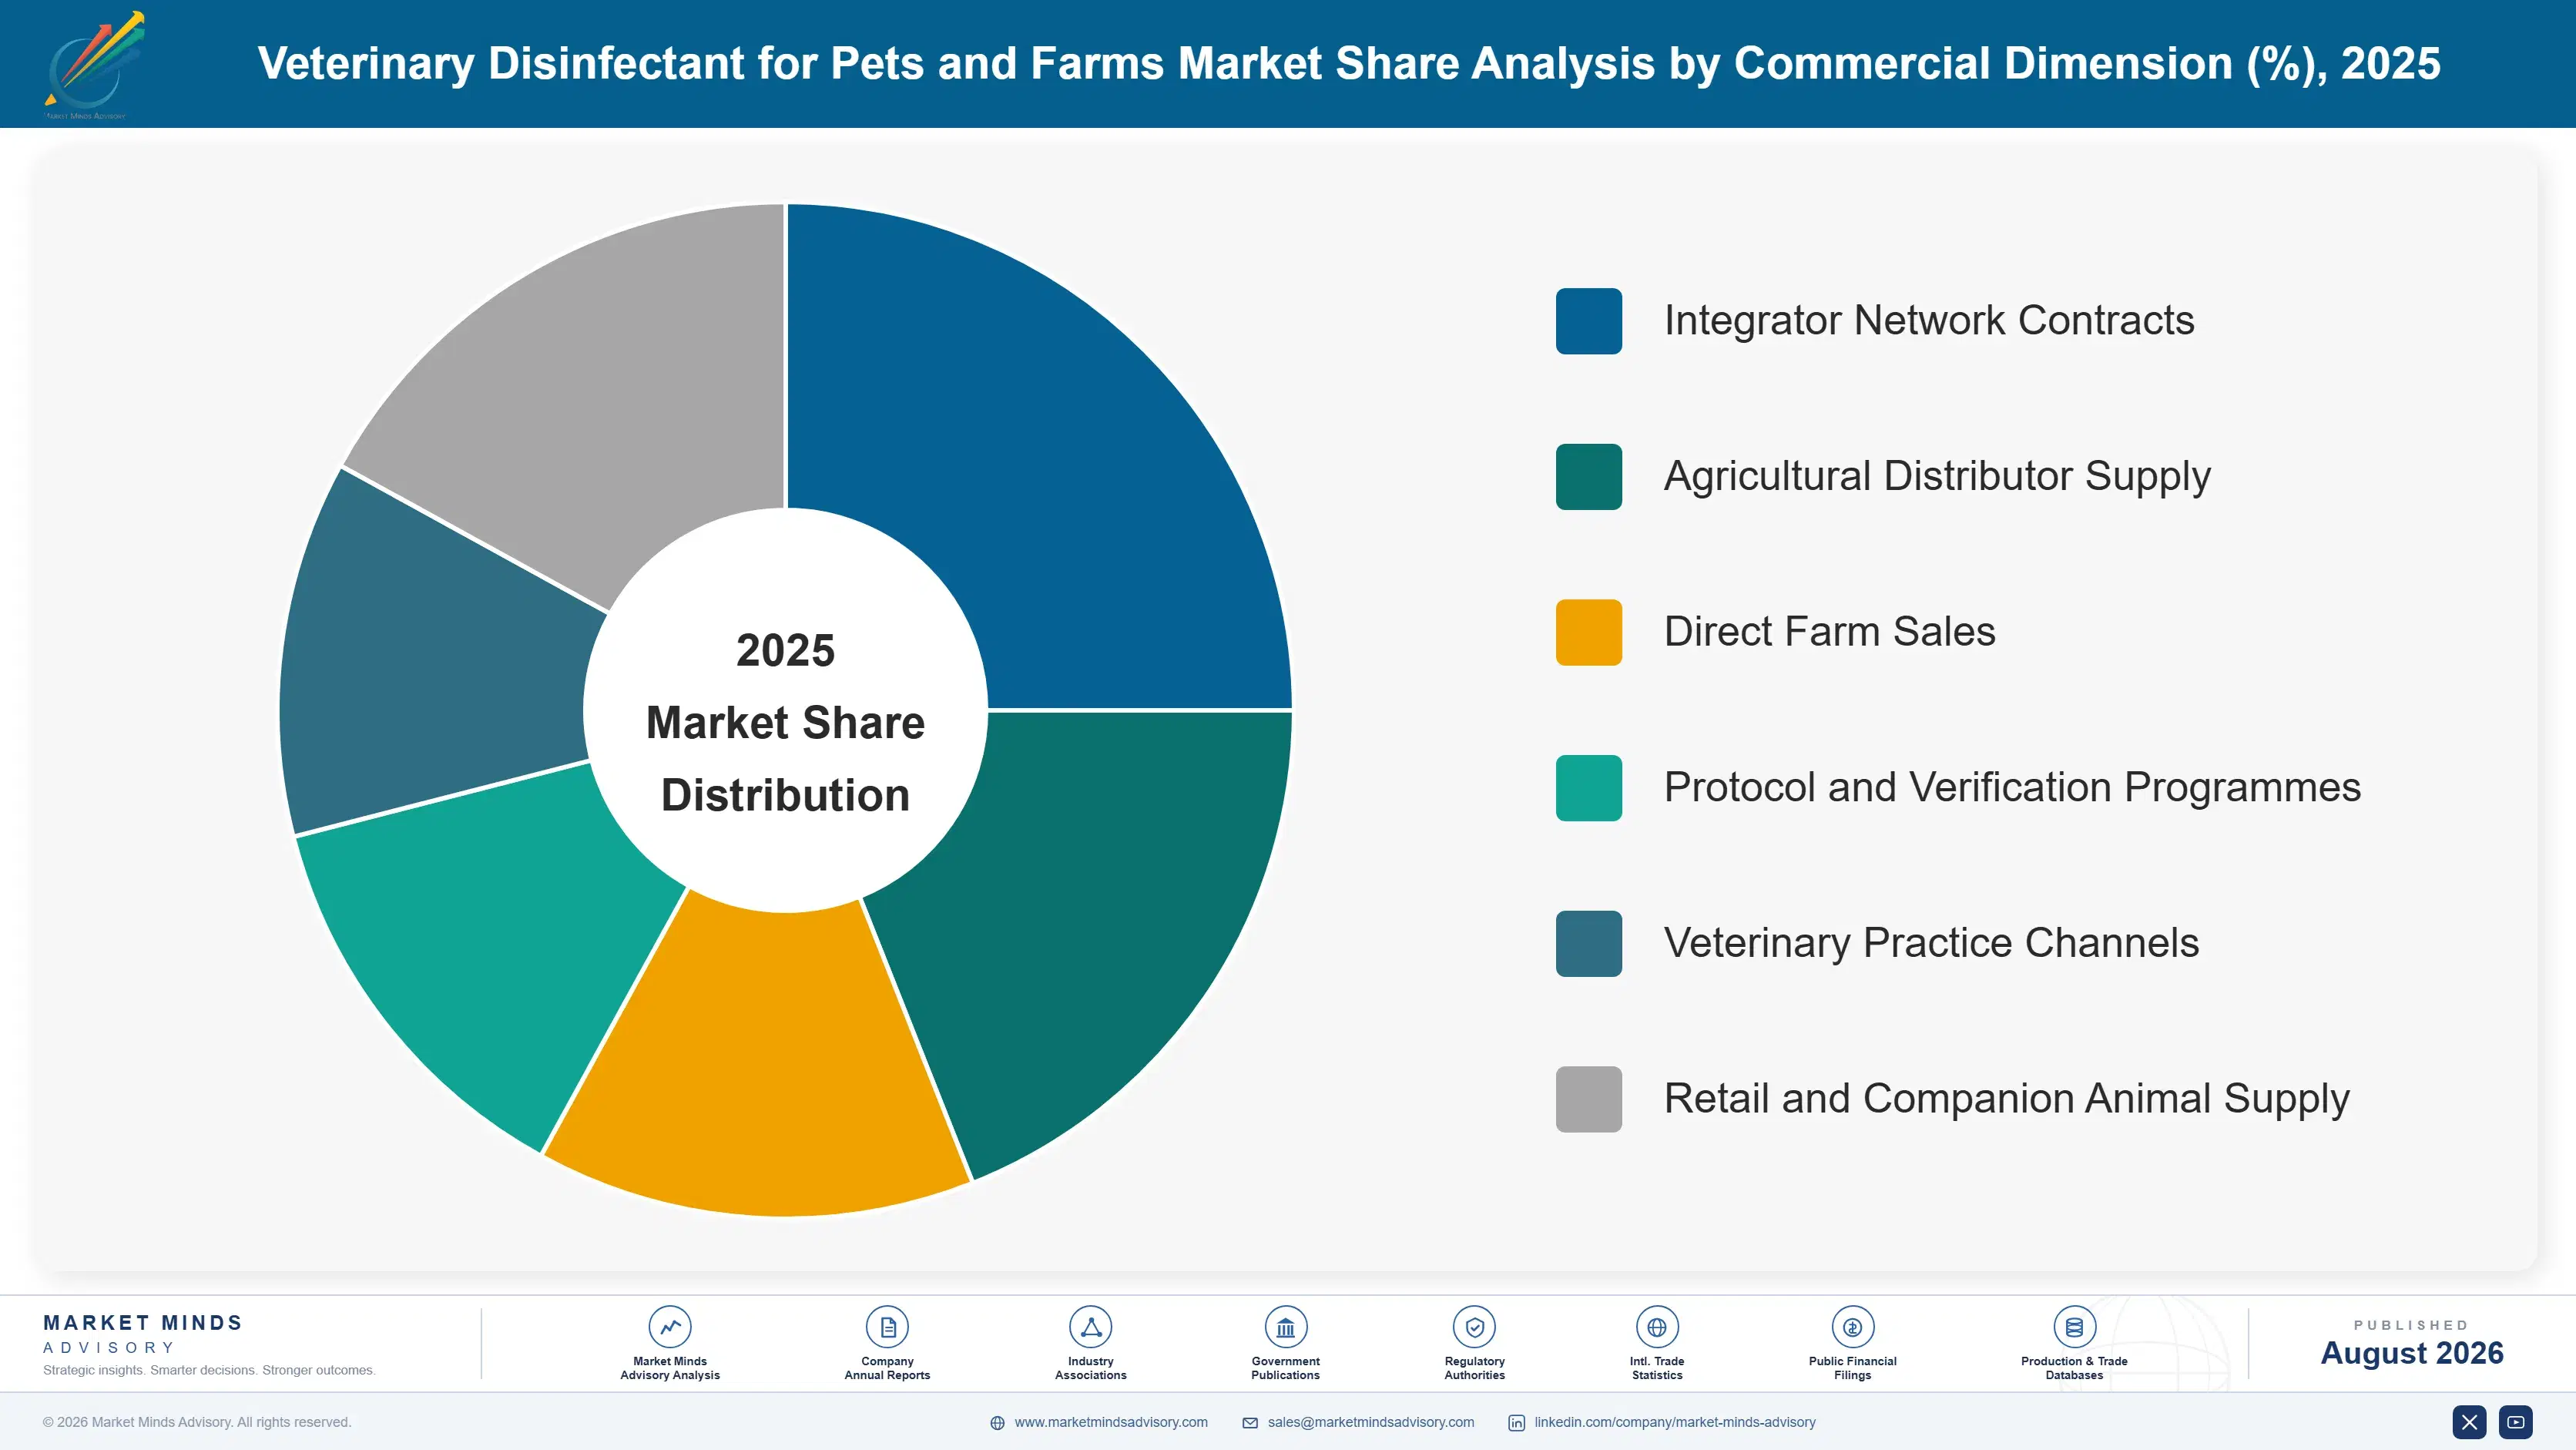
Segmentation follows active chemistry, since chemistry determines efficacy under soiling, regulatory standing, handling requirements and cost per treated area. Six chemistries cover the field, from quaternary ammonium compounds still carrying most volume to enzymatic systems arriving with a service model attached. Growth follows regulatory standing considerably more than it follows performance. Preference barely enters it now.
veterinary-disinfectant-for-pets-and-farms-market-market-share-analysis-1787641485708

Peroxygen and Peracetic Acid Systems

Hydrogen peroxide, peracetic acid and stabilised peroxygen blends offering broad spectrum activity including against resistant viral envelopes, with decomposition products that raise no residue concerns. At 9.9% this is the fastest growing chemistry in the market, half again the market rate of 6.6%, and regulation rather than preference explains most of it. European restriction of formaldehyde and older actives moves volume here by removing alternatives. Cost per treated square metre runs well above quaternary ammonium, storage stability is poorer and handling requires more care from farm staff, none of which producers welcome. Efficacy under organic soiling remains better than most alternatives, which is the genuine technical argument in its favour.
CAGR 9.9%

Biocide Free and Enzymatic Systems

Enzymatic and physical action products that degrade biofilm and organic matter rather than killing through chemical toxicity, frequently supplied as part of an audited cleaning and verification programme. Growth of 8.4% is second fastest in the market, and the service wrapper matters as much as the chemistry does. These products address the cleaning step where roughly 62% of efficacy is actually lost, rather than competing for the disinfection step everybody focuses on. Regulatory positioning is simpler since they make no biocidal claim, which avoids the roughly 420,000 dollar cost of establishing one. Adoption concentrates with integrators running standardised protocols across many sites. Standardised protocols across many sites are where these products establish position first.
CAGR 8.4%
Full segment breakdown across 6 segments available in the complete report.

Regional Architecture and Country Demand Map

East Asia holds the largest share at 30%, on production scale and on biosecurity spending that rose permanently after African swine fever. Western Europe follows at 22% on regulatory driven premium chemistry. Vietnam grows fastest of any country covered at 12.6%. Disease memory shapes spending everywhere.

East Asia

Production scale and a disease memory together give this region its 30% share. China holds the largest pig and poultry populations anywhere and lost an extraordinary number of animals to African swine fever, which converted biosecurity from a cost line into a capital protection argument across the entire industry. The rebuild produced large scale facilities designed around disinfection rather than retrofitted for it, consuming considerably more product per animal place than the housing they replaced. Domestic chemical manufacturers supply most of that volume at prices imported product cannot approach. Japanese and Korean production is smaller, highly regulated and technically sophisticated. Regional growth of 7.6% reflects sustained post outbreak spending rather than any recovery in animal numbers.
Share: 30% | CAGR: 7.6% (2026 to 2036)

Western Europe

Regulation rather than production volume explains this 22% share. European biocidal product review has restricted formaldehyde and several established actives, pushing volume toward peroxygen chemistries that cost considerably more per treated area, so regional value holds even as animal numbers decline under environmental pressure. Danish, Dutch and Spanish pig production operates to biosecurity standards among the highest anywhere, with audited protocols and verification swabbing routine rather than exceptional. Registration cost concentrates supply, since resubstantiating claims periodically removes smaller manufacturers each cycle. Growth of 5.0% is the lowest of the seven regions, reflecting shrinking herds offset by rising cost per treated area. Herd numbers decline while cost per area rises. Value holds regardless.
Share: 22% | CAGR: 5.0% (2026 to 2036)
Regional intelligence for 5 additional markets available in the complete report: North America, South Asia and Pacific, Latin America, Middle East and Africa, Eastern Europe. Contact sales@marketmindsadvisory.com.
veterinary-disinfectant-for-pets-and-farms-market-country-cagr-analysis-1787641486240

Where This Category Actually Earns

Nothing here is won on a laboratory kill figure, because the field loses most of it to organic matter before the chemistry acts. Value accrues to whoever sells the protocol rather than the drum, whoever holds registered claims others cannot fund, and whoever is specified by an integrator running many sites. Four routes carry weight, and only one is chemistry.

Sell the Wash Step, Not the Kill Claim

Performance falls roughly 62% under heavy soiling and only around 48% of farms complete a full wash before applying anything, which means most outcome variation happens before the disinfectant is used at all. Suppliers offering audited protocols, application training and verification swabbing deliver results their chemistry alone never would, and charge for the service rather than discounting the drum. Biocide free and enzymatic systems grow at 8.4% largely on this model. Competitors arriving with log reduction data from a stainless steel coupon are quoting a number no farm will ever reproduce.
Market Impact: Recovers the 62% of efficacy lost to soiling

Hold Registered Claims Competitors Cannot Fund

Establishing a single efficacy claim costs roughly 420,000 dollars in testing and dossier work, and European review requires periodic resubstantiation rather than granting permanence. Each cycle removes smaller manufacturers who cannot fund it, concentrating the market without any commercial action from those who remain. Suppliers treating registration as a strategic asset rather than a compliance cost acquire claims, share consortium dossiers and rationalise portfolios onto defensible positions. Those treating it as overhead discover at the next review that a product they still sell can no longer be sold at all.
Market Impact: Defends claims worth 420,000 dollars each to establish

Win the Integrator, Not the Individual Farm

Large integrated pig and poultry producers set biosecurity protocols centrally and buy chemistry on multi site contracts, so one specification decision can cover 40% more volume and lasts for years. That is a completely different sale from calling on individual farms, requiring technical service capability, audit support and supply reliability across a network rather than a competitive price on a drum. Southeast Asian and Latin American integrators building new capacity specify at design stage. Suppliers organised around farm level distribution are visiting the customer after the decision has already been made elsewhere.
Market Impact: Covers 40% more volume in a single decision

Position Peroxygen Ahead of the Next Restriction

European biocidal review keeps removing established actives, and aldehyde volumes fall around 9% a year across the region as a direct result. Peroxygen and peracetic acid systems grow at 9.9% against a market rate of 6.6% because alternatives are being withdrawn rather than because producers prefer them. Suppliers with registered peroxygen portfolios inherit volume without winning it commercially. Building formulation, stabilisation and handling capability ahead of the next review cycle costs far less than responding to one, and the review calendar is entirely public. Nobody should be surprised by a scheduled review.
Market Impact: Grows 9.9% as the competing actives are withdrawn

Who Controls the Margin Pool

This market is fragmented for a chemical category. The top five supply 36% of formulated volume and associated service revenue, the basis applied consistently here, with the remainder spread across regional formulators holding strong positions in individual countries where registration and relationships are local. Ecolab leads on service capability and multi site contracting rather than on any chemistry advantage. Regional formulators hold most of the remainder.
Competition runs on three fronts. Multinational suppliers compete for integrator contracts on technical service, audit support and supply reliability across a network. Regional formulators compete on price for farms buying a drum rather than a programme, which is most farms by number. Specialty chemistry manufacturers compete upstream, supplying actives to formulators rather than selling to producers at all.

Rankings will move with each regulatory review cycle, since resubstantiation costs remove smaller suppliers and reallocate their volume without any competitive contest. Consolidation among regional formulators has been steady for exactly that reason. The other pressure point is domestic Asian manufacture, which supplies the largest production base in the world at prices multinational suppliers have not attempted to match. Neither pressure responds to commercial effort.
veterinary-disinfectant-for-pets-and-farms-market-company-positioning-matrix-1787641486765

Competitive Moat and Risk Dimensions

ECOLAB

Moat: Service and Audit Capability

Technical service teams, audited protocol delivery and verification capability turn a chemical sale into a programme that an integrator can present to its own customers as evidence of biosecurity compliance. That capability took decades to build across food and animal production, and it is what wins multi site contracts where a drum price alone would not.
ECOLAB

Risk: Commodity Price Exposure

Most farms by number buy a drum rather than a programme, and in that contest a regional formulator with local registration and lower overhead wins on price consistently. Service capability commands a premium only where a customer is audited by somebody else, which describes export oriented and integrated production rather than the majority of farms.
NEOGEN CORPORATION

Moat: Registered Claim Portfolio

A broad portfolio of established efficacy claims against specific pathogens carries considerable value in a regulatory environment where a single new claim costs roughly 420,000 dollars to establish. Each review cycle removes competitors unable to fund resubstantiation, transferring their volume to suppliers holding defensible registrations without any commercial contest at all.
NEOGEN CORPORATION

Risk: Episodic Outbreak Dependence

Demand spikes sharply during disease events and falls back afterwards, which makes revenue difficult to forecast and capacity planning genuinely awkward. Avian influenza depopulation events produce concentrated buying followed by extended quiet periods, and building a business around a pattern nobody can predict creates working capital problems in both directions.

Players Tracked

Prominent Players

Ecolab
Neogen Corporation
Kersia Group
Lanxess
Diversey

Other Key Players

Evans Vanodine International
Hydrachem
Biolink
GEA Group
DeLaval
Sanosil
Fink Tec
Kemin Industries
MS Schippers
Anitox
Intracare
Solvay
Stepan Company
Chemours
Nouryon

Recent Developments

MARCH 2025

European review restricts further established disinfectant actives

European biocidal product review concluded with further restrictions on established disinfectant actives used in animal housing, continuing a pattern that has removed several cheaper chemistries over successive cycles. Volume moves toward peroxygen systems that cost considerably more per treated area and require different handling on farm.
Signal: Each review cycle transfers volume to peroxygen suppliers without any competitive contest taking place at all
JUNE 2025

Vietnamese producer commissions biosecurity designed pig facility

A Vietnamese pig production company commissioned a large facility designed around disinfection from the outset, with wash bays, transport disinfection and all in all out capability built in rather than retrofitted. Purpose built capacity of this kind consumes substantially more disinfectant per animal place than the smallholder housing it replaces.
Signal: Rebuilding after a major disease event produces facilities that consume far more product than they replaced
SEPTEMBER 2025

Integrator standardises protocol and supplier across regional network

A poultry integrator standardised its cleaning and disinfection protocol across its regional production network, selecting a single supplier for chemistry and verification services. One specification decision now covers volume that would previously have been contested farm by farm across dozens of separate sites. Competition disappeared overnight.
Signal: Integrator standardisation turns dozens of separate competitive contests into just one single specification decision made centrally

What a Formulated Drum Costs

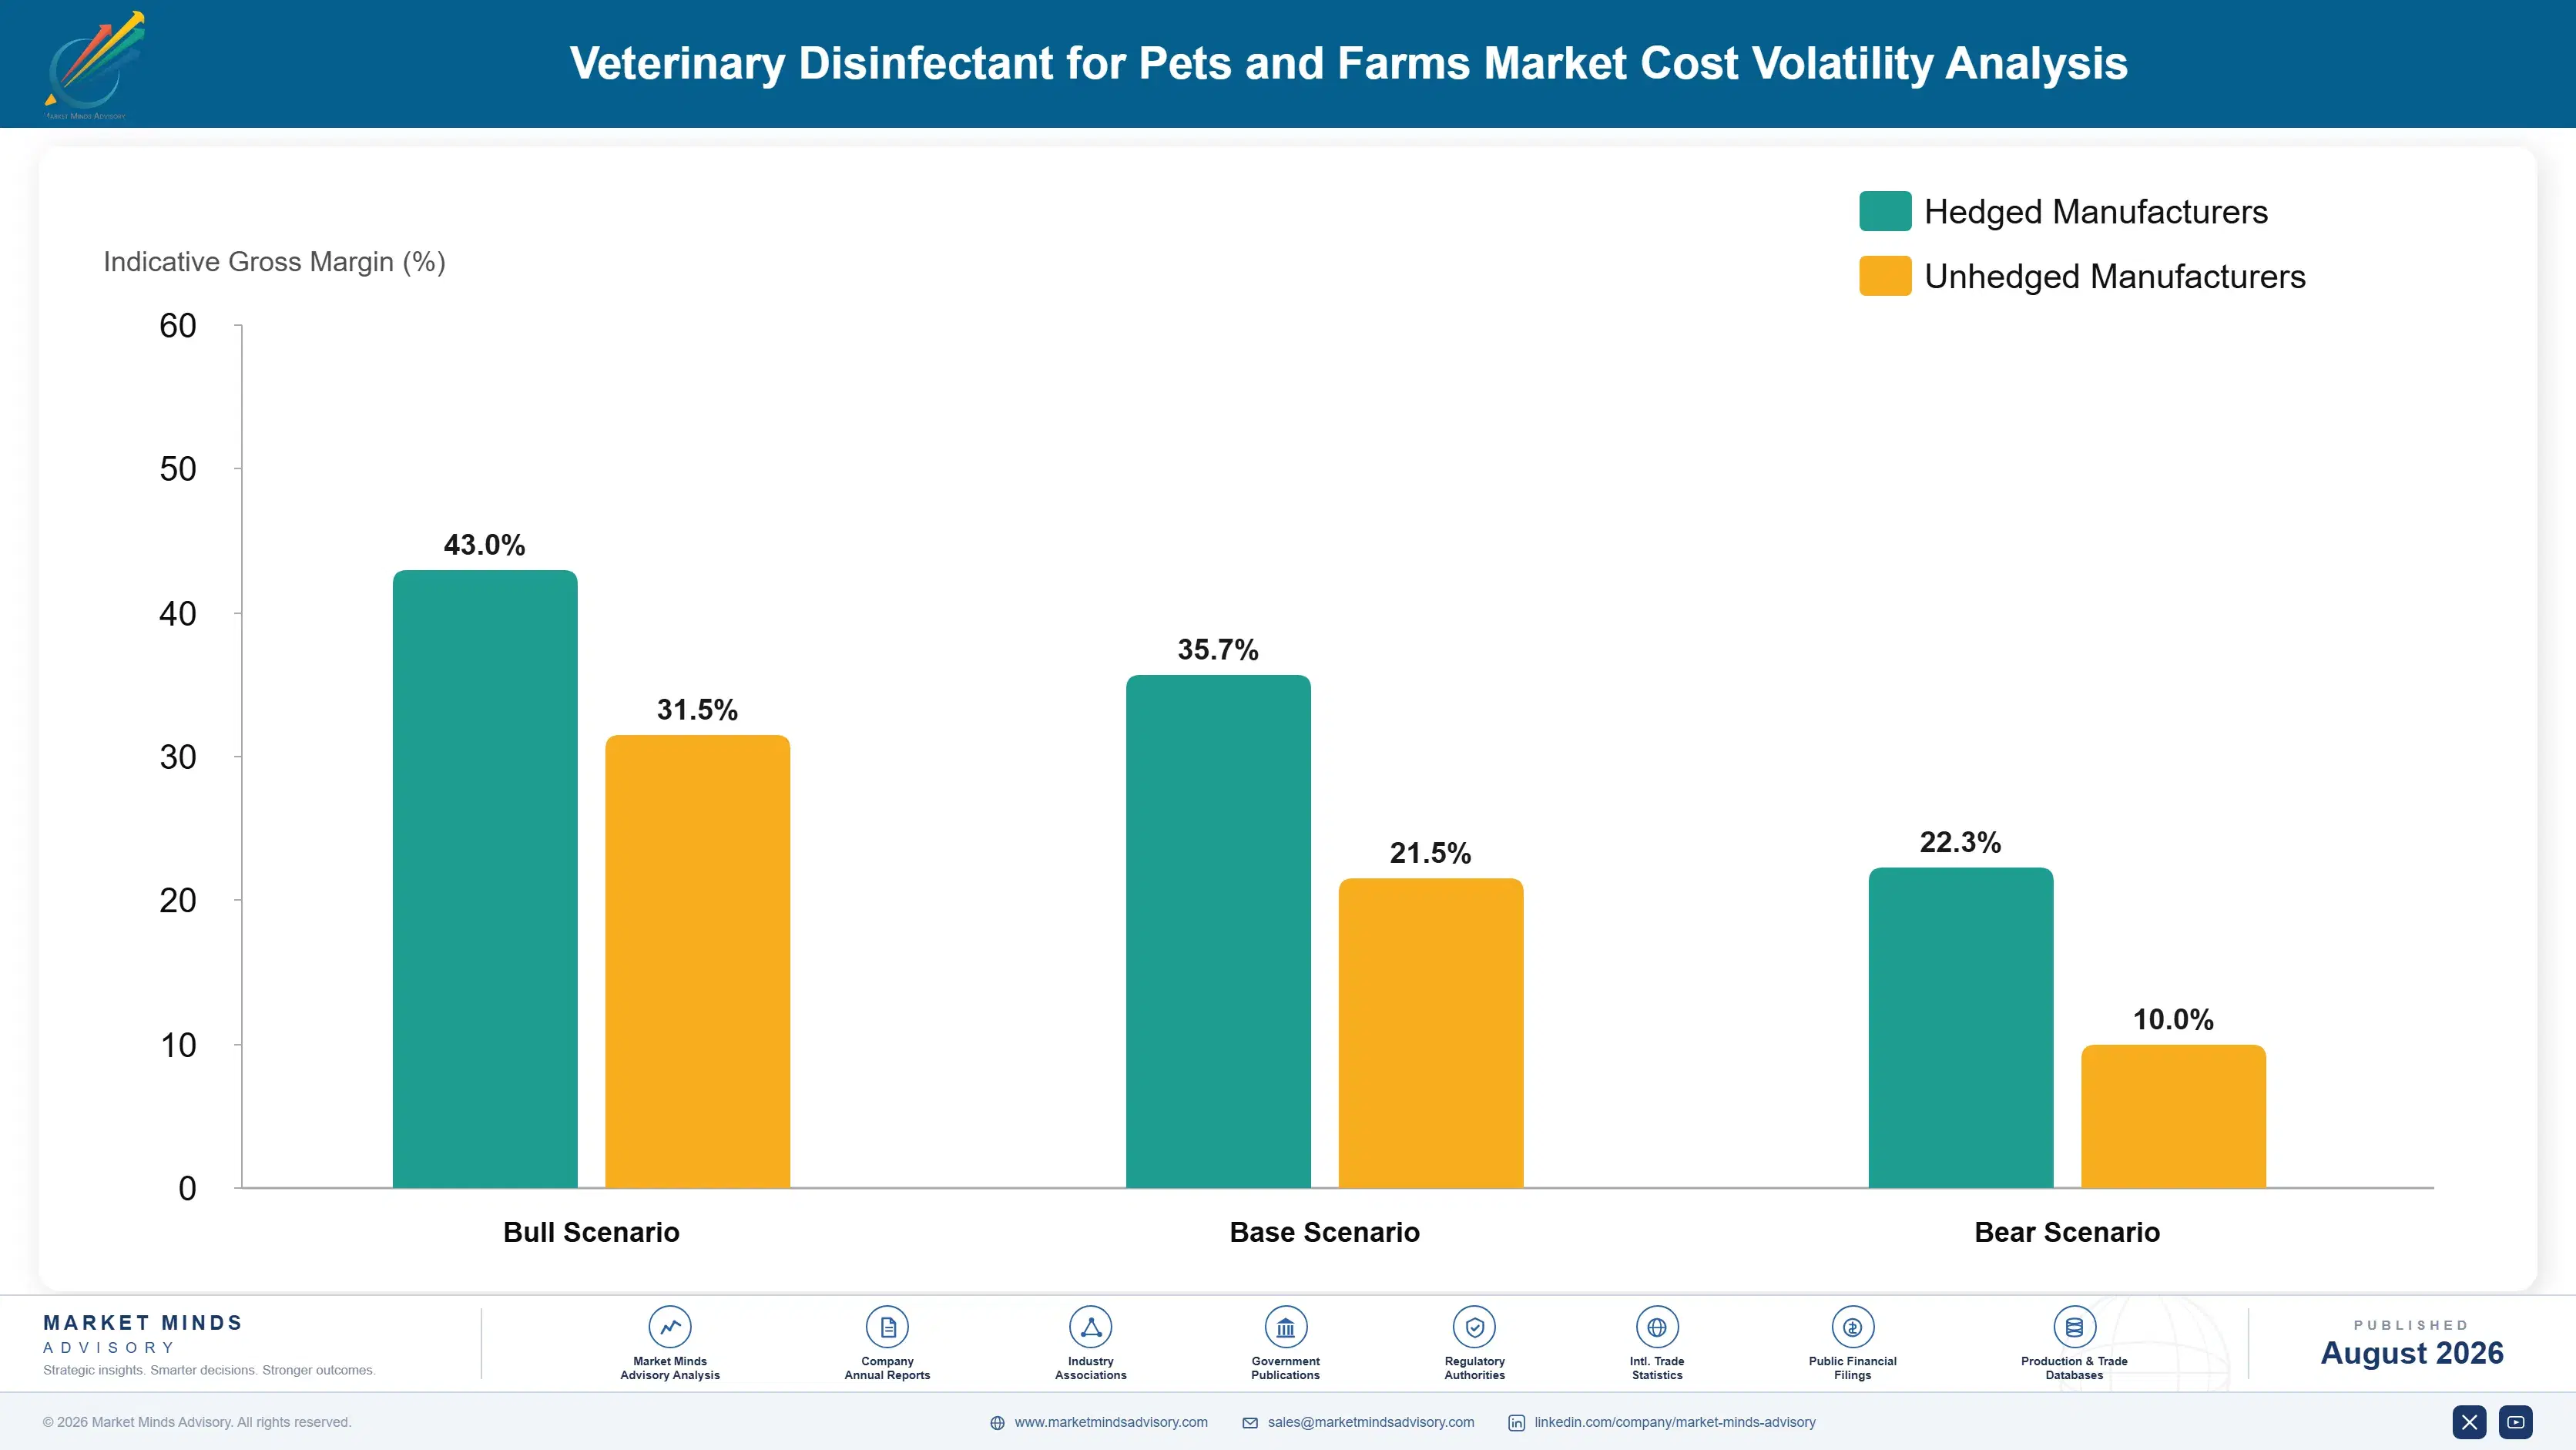
Active chemistry and packaging together dominate the cost structure. Quaternary ammonium compounds, hydrogen peroxide, peracetic acid and glutaraldehyde account for roughly 44% of formulated cost of goods, with high density polyethylene drums and closures adding a further 19% and freight taking a meaningful share of a low value dense liquid. Actives come principally from European, Chinese and North American specialty chemical producers with concentrated capacity in several cases.
Hydrogen peroxide and peracetic acid pricing moved sharply through the period as European energy costs raised production economics for an electricity intensive process. EIA and Eurostat energy series document the underlying movement, and company annual reports across the specialty chemical sector recorded the resulting margin pressure. Quaternary ammonium pricing tracked fatty amine feedstock and therefore palm and coconut derivatives, moving for entirely separate agricultural reasons.

Exposure divides by chemistry weighting rather than by company size. A formulator weighted toward peroxygen carries European energy exposure directly, precisely in the chemistry regulation keeps pushing volume toward. A quaternary ammonium portfolio carries oleochemical feedstock exposure instead, which moves on entirely different drivers. Freight matters more than either for regional formulators shipping dilute product, which is why local blending near demand remains standard practice.
veterinary-disinfectant-for-pets-and-farms-market-cost-volatility-analysis-1787641486963

Blend regionally to remove freight from dilute product

Disinfectant concentrate is dense, low value liquid and freight consumes a meaningful share of delivered cost when shipped any distance. Regional blending from concentrated actives removes most of that, which is why the practice is standard rather than exceptional. The trade is capital across multiple sites and the quality burden of consistency, which is manageable.

Share consortium dossiers across registration holders

Establishing an efficacy claim costs roughly 420,000 dollars and several companies frequently need the same claim on the same active, which makes duplicated testing pure waste. Consortium arrangements sharing dossier costs across registration holders are increasingly common and reduce the burden materially. Coordination is slow and requires commercial competitors to cooperate on regulatory work.

Contract peroxide supply on multi year energy indexed terms

Hydrogen peroxide production is electricity intensive and European energy costs moved sharply enough to reprice it entirely within a single year. Multi year supply agreements indexed to published energy benchmarks transfer that volatility to a formula rather than to an annual renegotiation. Producers accept indexation more readily than fixed pricing, which removes the worst outcome entirely.

Portfolio Architecture for Margin Defence

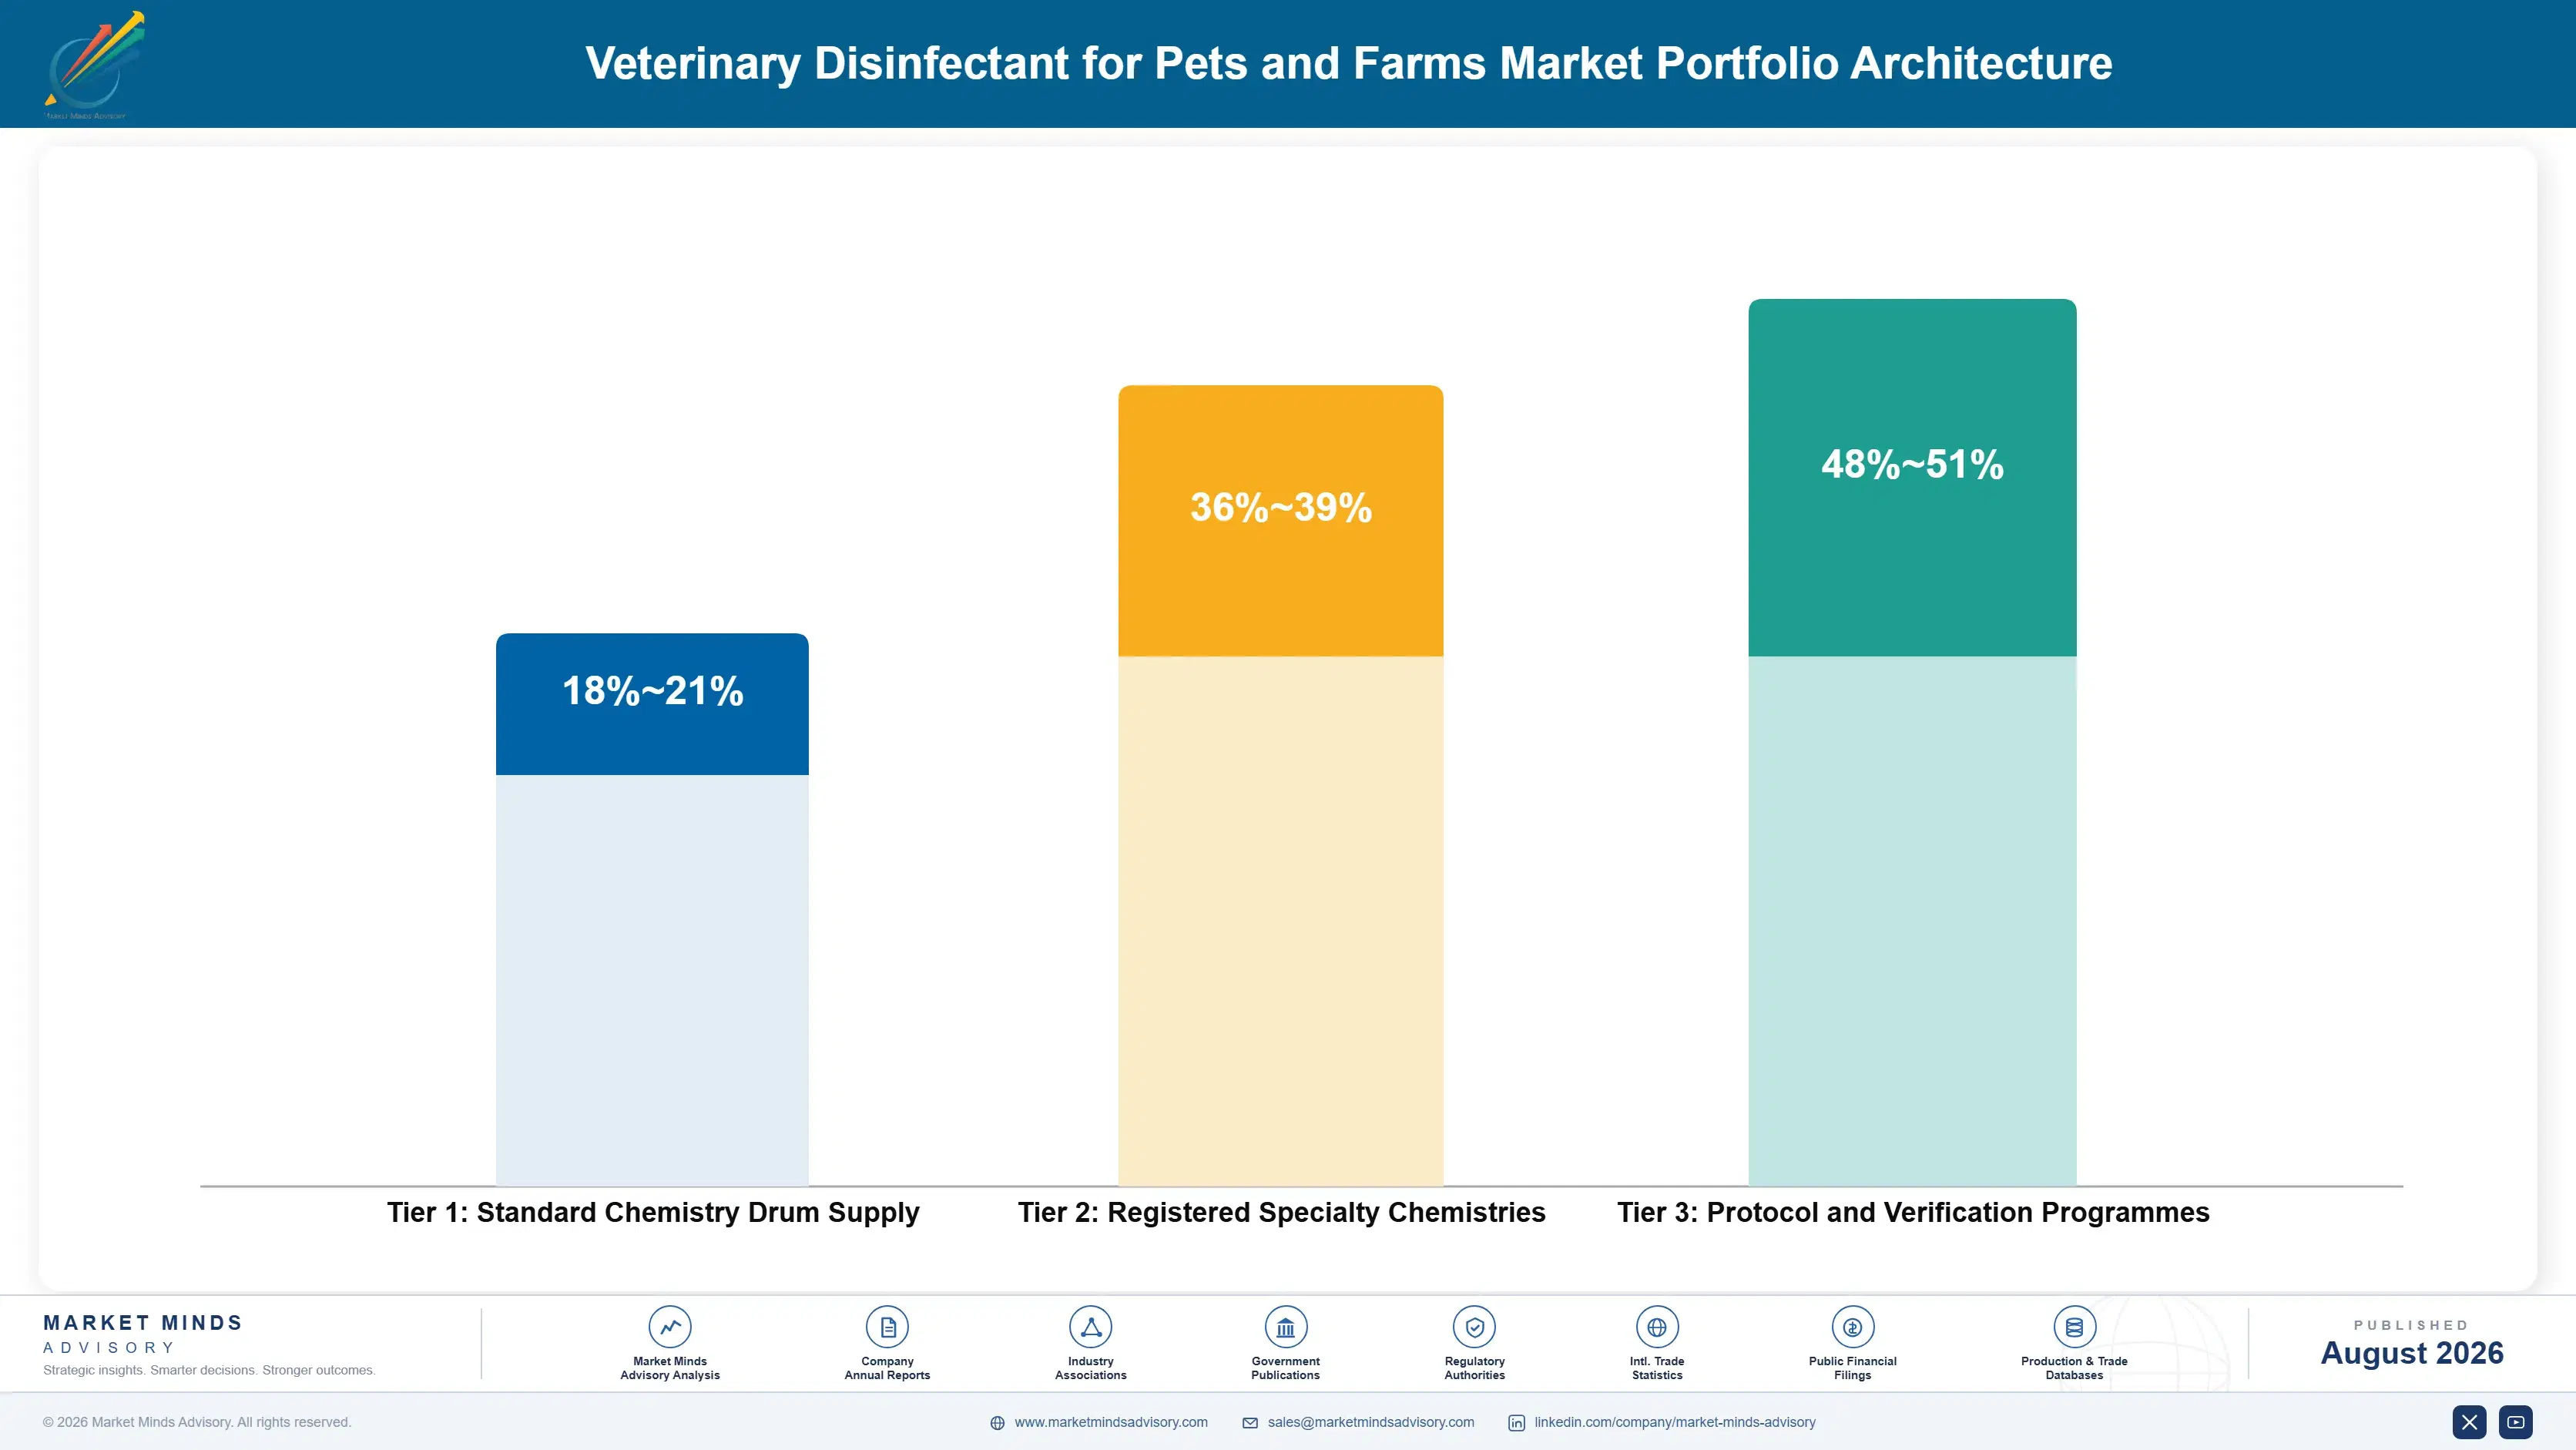
Margin architecture follows whether a product arrives with a service attached. Commodity chemistries sold by the drum to individual farms earn commodity margins, since a regional formulator with local registration competes on price and generally wins. Registered specialty chemistries earn better where claims are defensible and competitors have exited. Protocol and verification programmes earn best of all, because the customer is buying an audit outcome rather than a litre of liquid.
The tension is that most farms buy a drum. Programme selling works with integrators, export oriented producers and anybody audited by a customer, which is a minority of farms by number and a large share of animals by volume. Building service capability for a customer base that mostly does not want it is expensive, and the suppliers who did it are the ones holding multi site contracts now.

High value pools concentrate in integrator programmes and in registered chemistries whose claims competitors cannot afford to maintain. Everything sold as an undifferentiated drum faces a regional formulator with lower overhead and local registration. Regulatory review is steadily removing those competitors anyway, which is doing more for concentration in this market than any commercial strategy has achieved.

Standard Chemistry Drum Supply

Quaternary ammonium, halogen and phenolic products sold by the drum to individual farms on price against regional formulators with local registration. Volume is substantial and differentiation is close to absent throughout.
Gross Margin: 18-21%

Registered Specialty Chemistries

Peroxygen and specialty formulations carrying defensible efficacy claims against named pathogens in a regulatory environment where establishing one costs hundreds of thousands. Margin holds because competitors keep exiting rather than funding resubstantiation.
Gross Margin: 36-39%

Protocol and Verification Programmes

Audited cleaning and disinfection programmes with training, application support and verification swabbing sold to integrators and export oriented producers. Margin is the best available because the customer is buying an audit outcome rather than a chemical.
Gross Margin: 48-51%
veterinary-disinfectant-for-pets-and-farms-market-portfolio-architecture-1787641487475

High-value Sub-segments and Strategic Watch-out

Peroxygen and Peracetic Acid Systems

The fastest growing chemistry at 9.9%, gaining volume because regulation removes alternatives rather than because producers prefer it. European energy exposure sits directly in this chemistry, which puts the growth and the input volatility in exactly the same place. Handling requirements are worse too, which farm staff notice immediately.
Gross Margin: 36-39%

Biocide Free and Enzymatic Systems

Second fastest at 8.4% and the best margin in the category, because these arrive attached to a service model addressing the cleaning step where most efficacy is lost. Regulatory positioning is simpler since no biocidal claim needs establishing at all. Integrators running standardised protocols across many sites adopt these first.
Gross Margin: 48-51%

Quaternary Ammonium Compounds

Growing at 5.8% and still carrying most volume by weight, sold largely as undifferentiated drums against regional formulators competing purely on price. Oleochemical feedstock exposure moves on agricultural drivers unrelated to anything else in this category. Regional formulators with local registration win most of these contests on price alone.
Gross Margin: 18-21%

Aldehyde Based Disinfectants

Declining at 1.4% globally and falling around 9% a year in Europe as regulatory restriction removes it from use. It remains effective and inexpensive, which is why volume persists in markets where regulation has not yet reached the same conclusion. Regulation rather than performance is retiring this chemistry entirely.
Gross Margin: 16-19%

How Farm Demand Actually Repeats

Demand recurs on a production cycle rather than on a purchase decision. Every batch of pigs or poultry leaving a house triggers a full clean and disinfect before the next arrives, so consumption follows throughput with considerable predictability once a protocol is established. That makes an approved supplier position an annuity tied to animal places rather than to commercial effort.
Stickiness depends entirely on who set the protocol. An integrator that standardised chemistry and verification across a network almost never changes, since revalidating a protocol across many sites is a project nobody starts without a reason. Individual farms buying a drum switch on price whenever a regional formulator calls. Export producers audited by customers sit closer to the integrator pattern.

The buyer moved from the farm to the head office. Disinfectant was once bought by whoever ran the shed, from whoever supplied the feed, and price was the only variable in the conversation. Integrated production and customer auditing moved that decision to technical functions specifying centrally, and those people ask about verification data. Suppliers organised around farm level distribution are calling on somebody who no longer decides.
veterinary-disinfectant-for-pets-and-farms-market-end-use-penetration-index-1787641487980

Where This Category Rewards Effort

These are among the four positions where our research anticipates prominent divergence between winners and laggards over the coming forecast period. Each is grounded in the demand model, the regulatory perimeter, and the announced capacity pipeline.
01 / PROTOCOL VALUE POSITIONING

The wash decides the result, not the chemistry

Kill performance falls roughly 62% under heavy soiling and only around 48% of farms complete a full wash before applying anything, which means most of the variation in field outcome happens before the disinfectant touches a surface. Suppliers selling audited protocols, application training and verification swabbing deliver results their chemistry alone never could, and they charge for the service rather than discounting the drum. Competitors arriving with log reduction data generated on a clean stainless coupon are quoting a number no working farm will ever reproduce.
02 / REGISTRATION ASSET MANAGEMENT

Claims are consolidating this market, not competition

Establishing a single efficacy claim costs roughly 420,000 dollars and European review requires periodic resubstantiation rather than granting permanence, so each cycle removes suppliers who cannot fund the work. Their volume transfers to remaining registration holders without any commercial contest taking place at all, which is a more reliable share gain than anything a sales organisation produces. Companies treating registration as compliance overhead rather than as a strategic asset discover at the next review that a product they still sell can no longer be sold.
03 / INTEGRATOR SPECIFICATION ACCESS

One head office decision covers hundreds of sheds

Large integrated pig and poultry producers now set biosecurity protocols centrally and contract chemistry across whole networks, so a single specification decision covers volume that would previously have been contested farm by farm for years. That is a fundamentally different sale requiring technical service, audit support and network wide supply reliability rather than a competitive drum price. Southeast Asian and Latin American integrators specify at facility design stage, which means arriving after commissioning is arriving several years too late to matter.
04 / REGULATORY CYCLE POSITIONING

Volume arrives when a competitor's active is withdrawn

European biocidal review keeps restricting established actives and aldehyde volumes fall around 9% a year across the region as a direct consequence of it. Peroxygen and peracetic acid systems grow at 9.9% against a market rate of 6.6% because alternatives are being withdrawn rather than because any producer prefers handling them. Building formulation, stabilisation and handling capability ahead of the next review cycle costs far less than scrambling afterwards, and the review calendar is entirely public information available to everybody.

Engagement Snapshot From the Field

A live engagement with an industry participant carrying material or product regulatory and market exposure ahead of a defining policy shift, showing how our research translates into a defensible multi-year portfolio strategy.
MARKET MINDS ADVISORY · CLIENT ENGAGEMENT SUMMARY
Veterinary Disinfectant for Pets and Farms Producer Strategic Portfolio Review and Transition Roadmap 2026·Investment Scenario on Veterinary Disinfectant for Pets and Farms Exposure Evaluation 2025-26
CLIENT PROFILE
An animal health chemical formulator supplying quaternary ammonium and halogen based disinfectants to farms across five European markets through agricultural distributors. Annual revenue was approximately 118 million dollars (client-reported, unverified by MMA), almost entirely from drum sales. No peroxygen portfolio existed, no service capability had been built, and two products faced claim resubstitution deadlines. Margin eroded at every negotiation.
STRATEGIC CHALLENGE
Volume had been flat for four years while margin eroded at every distributor negotiation, and the approaching resubstantiation deadlines threatened two products representing meaningful revenue. Management wanted to know whether to fund the registrations, acquire a peroxygen portfolio, or build service capability. The finance function regarded registration spending as unavoidable overhead rather than as investment.
MMA APPROACH
MMA modelled volume transfer following previous regulatory review cycles, establishing how much of an exiting competitor's business actually reaches remaining registration holders. Peroxygen portfolio acquisition and organic build routes were costed against review timing. Forty-seven expert interviews with integrator technical managers, farm operators and distributors established what actually drives supplier selection at each level.
KEY FINDINGS
  1. Roughly 71% of volume from suppliers exiting previous review cycles transferred to remaining registration holders within eighteen months, at unchanged pricing rather than through competitive bidding.
  2. Integrator technical managers in 32 of the 47 interviews named verification support rather than chemistry or price as the decisive criterion in supplier selection.
  3. Peroxygen portfolio acquisition delivered registered claims within 6 months against roughly 3 years for organic development plus registration from a standing start.
  4. Farms buying through distributors switched supplier on price in 63% of cases, confirming that drum sales carried no defensible position at all.
CLIENT PROFILE
An animal health chemical formulator supplying quaternary ammonium and halogen based disinfectants to farms across five European markets through agricultural distributors. Annual revenue was approximately 118 million dollars (client-reported, unverified by MMA), almost entirely from drum sales. No peroxygen portfolio existed, no service capability had been built, and two products faced claim resubstitution deadlines. Margin eroded at every negotiation.
STRATEGIC CHALLENGE
Volume had been flat for four years while margin eroded at every distributor negotiation, and the approaching resubstantiation deadlines threatened two products representing meaningful revenue. Management wanted to know whether to fund the registrations, acquire a peroxygen portfolio, or build service capability. The finance function regarded registration spending as unavoidable overhead rather than as investment.
MMA APPROACH
MMA modelled volume transfer following previous regulatory review cycles, establishing how much of an exiting competitor's business actually reaches remaining registration holders. Peroxygen portfolio acquisition and organic build routes were costed against review timing. Forty-seven expert interviews with integrator technical managers, farm operators and distributors established what actually drives supplier selection at each level.
KEY FINDINGS
  1. Roughly 71% of volume from suppliers exiting previous review cycles transferred to remaining registration holders within eighteen months, at unchanged pricing rather than through competitive bidding.
  2. Integrator technical managers in 32 of the 47 interviews named verification support rather than chemistry or price as the decisive criterion in supplier selection.
  3. Peroxygen portfolio acquisition delivered registered claims within 6 months against roughly 3 years for organic development plus registration from a standing start.
  4. Farms buying through distributors switched supplier on price in 63% of cases, confirming that drum sales carried no defensible position at all.
RECOMMENDED STRATEGY
Phase 1: Phase one: fund both claim resubstantiations immediately, since 71% of exiting competitor volume transfers to remaining holders at unchanged pricing. Phase 2: Phase two: acquire a peroxygen portfolio rather than develop one, since 6 months to registered claims against 3 years decides the review cycle. Phase 3: Phase three: build verification and audit service capability, since 32 of 47 integrator managers named it as the decisive selection criterion.
OUTCOME
The client funded both resubstantiations and acquired a small peroxygen formulator within a year, absorbing volume from two competitors that exited the following review cycle. Verification service capability launched with two integrator customers, and margin recovered as the mix shifted away from undifferentiated drum sales (client-reported, unverified by MMA).

Frequently Asked Questions

Foundational context covering the market sizes, CAGR, scope, country, region and competition that inform every finding below. This section is provided to cover basics and most often pre-purchase conversations, answered from the MMA Primary Research Dataset.

What is the current size of the Veterinary Disinfectant for Pets and Farms Market?

The market was valued at 3.4 billion dollars in 2025, covering disinfectant chemistries and biosecurity programmes for animal housing and veterinary premises. It reaches an estimated 3.62 billion dollars during 2026.

How large will the Veterinary Disinfectant for Pets and Farms Market be by 2036?

MMA forecasts 6.86 billion dollars by 2036, an increase of 3.24 billion dollars over the 2026 base. That represents an expansion multiple of 1.90 times across the forecast period.

What is the CAGR for the Veterinary Disinfectant for Pets and Farms Market 2026 to 2036?

The base case compound annual growth rate is 6.6%, with a bull case of 7.8% and a bear case of 5.4%. Disease events and producer margin pressure separate those scenarios.

Which segment is growing fastest?

Peroxygen and peracetic acid systems grow at 9.9%, half again the market rate of 6.6%, because regulation removes cheaper alternatives. Biocide free and enzymatic systems follow at 8.4%.

Who are the major companies in the Veterinary Disinfectant for Pets and Farms Market?

Ecolab, Neogen Corporation, Kersia Group, Lanxess and Diversey lead on formulated volume supplied and associated service revenue. Together they account for 36% of the market.

Which country is growing fastest?

Vietnam grows fastest at 12.6%, as pig production rebuilds after African swine fever into larger commercial facilities designed around disinfection from the outset rather than retrofitted.

Report Segmentation Architecture

The full report scope spans multiple orthogonal segmentation dimensions, with cross-tabulated demand data provided for each dimension pair. Coverage extends further to regional breakdowns, trend trajectories, and the competitive detail needed to support segment-level decision-making.

By Active Chemistry

  • Quaternary Ammonium Compounds
  • Peroxygen and Peracetic Acid Systems
  • Aldehyde Based Disinfectants
  • Halogen Based Disinfectants
  • Phenolic Disinfectants
  • Biocide Free and Enzymatic Systems

By End-Use Industry

  • Commercial Pig Production
  • Poultry Production and Hatcheries
  • Dairy and Cattle Housing
  • Veterinary Clinics and Hospitals
  • Kennels and Companion Animal Facilities
  • Livestock Transport and Markets

By Commercial Dimension

  • Integrator Network Contracts
  • Agricultural Distributor Supply
  • Direct Farm Sales
  • Protocol and Verification Programmes
  • Veterinary Practice Channels
  • Retail and Companion Animal Supply

By Region

  • North America
  • Western Europe
  • East Asia
  • South Asia and Pacific
  • Latin America
  • Middle East and Africa
  • Eastern Europe

Scope, Methodology, and Coverage

Every figure in this report is reproducible from documented input assumptions. The scope below maps the historical period, the forecast horizon, the segmentation dimensions, and the countries covered, alongside the underlying primary and qualitative methodology.
Historical Period
2020 to 2025
Forecast Period
2026 to 2036
Base Year
2025 (USD billions; MMA Primary Research Dataset, August 2026)
Market Definition
Chemical disinfectants and biosecurity products used in animal housing, veterinary premises, transport and companion animal environments worldwide, covering quaternary ammonium compounds, peroxygen and peracetic acid systems, aldehyde based disinfectants, halogen based disinfectants, phenolic disinfectants, and biocide free and enzymatic systems. Measured at manufacturer selling value including associated protocol and verification services. Teat dips and dairy hygiene chemicals, human and hospital disinfectants, antibiotics and antimicrobials, feed additives, water treatment chemicals and pest control products are excluded from scope.
Quantitative Units
USD billions (current prices); tonnes of formulated product; USD per animal place by chemistry
Segmentation Dimensions
Active chemistry; end-use industry; commercial dimension; region
Regions Covered
North America, Western Europe, East Asia, South Asia and Pacific, Latin America, Middle East and Africa, Eastern Europe
Countries Covered
China, Vietnam, Thailand, Japan, South Korea, India, Indonesia, Australia, Germany, Netherlands, Denmark, Spain, France, United States, Canada, Mexico, Brazil, Poland, Saudi Arabia, South Africa
Key Companies Profiled
Ecolab, Neogen Corporation, Kersia Group, Lanxess, Diversey, Evans Vanodine International, Hydrachem, Biolink, GEA Group, DeLaval, Sanosil, Fink Tec, Kemin Industries, MS Schippers, Anitox, Intracare, Solvay, Stepan Company, Chemours, Nouryon
Quantitative Methodology
Primary survey, n=3,800 respondents, Q4 2025, six countries; demand-side model with trade association cross-validation
Qualitative Methodology
47 expert interviews, Q4 2025; applied to validate demand model assumptions, identify emerging dynamics, and assess competitive positioning
Report Format
PDF and XLSX data workbook (Word format preview document)
Publisher
Market Minds Advisory
Report Code
MMA-2026-CHM-150
Published
August 2026
Contact
sales@marketmindsadvisory.com | www.marketmindsadvisory.com

Purchase the full Veterinary Disinfectant for Pets and Farms Market Report (2026 to 2036).

The full report treats veterinary disinfection as a category where chemistry is defeated by organic matter before it acts, since kill performance falls sharply under soiling and most farms never complete the wash step properly. It sizes all six active chemistries independently through 2036, models volume transfer following regulatory review cycles, and quantifies the value of registered claims against the cost of establishing them. Regional chapters cover all seven regions, with integrator specification assessed separately from farm level purchasing. Competitive profiling covers 20 participants on one consistent formulated volume basis.
Six active chemistries sized independently through 2036
Volume transfer modelled across regulatory review cycles
Registered claim value quantified against establishment cost
Integrator specification assessed separately from farm purchasing
Disease event demand spikes measured against baseline consumption
Twenty participants profiled on one consistent volume basis

Built For The People Who Decide

From boardroom strategy to bench-side execution, this report is read cover-to-cover by leaders shaping the next decade of their industry, turning demand scenarios, market dynamics and valuation benchmarks into decisions.
CXOs/ Presidents/ VPs/ Managers
M&A and Corporate Development
Strategy Teams and R&D Heads
Procurement and Product Directors
Regulatory and Compliance Leaders
Investor Relations and Equity Analysts