Market Minds Advisory
Vertical Market Software Market

Vertical Market Software Market: Vertical Market Software Market: Switching Inertia, Payments Attach and Buying Businesses Nobody Wants 2026 to 2036

These businesses grow by acquiring software nobody else wants in industries nobody else studies. The unglamorous part is the whole strategy, and the returns have been better than almost anything in technology.

Lead Analyst

Published

September 2026

Make Smarter Decisions with Customized Research Insights

Request a free sample report and evaluate market opportunities, growth trends, and competitive dynamics relevant to your business needs.

2025 MARKET VALUE$178.0BMarket Size 2025
2036 FORECAST VALUE$427.7BBase Case , 2026 to 2036
CAGR 2026 TO 20368.3 %Bull 9.5% / Bear 7.1%
INCREMENTAL OPPORTUNITY$235.0BNet 10- year value creation
EXPANSION MULTIPLE2.22x2036 value over 2026 base
Strategic Levers
M&A Pipeline
Regional Outlook
Country Rankings
Competitive Intelligence
Segmental Deep-dive
Call-Us : 91 93563 13602

Executive Snapshot and Market Trajectory.

These businesses grow by acquiring software nobody else wants, serving industries nobody else studies. The unglamorous part is the entire strategy rather than an unfortunate detail of it, and the returns have been better than almost anything else in technology. Concentration sits at only 16%.
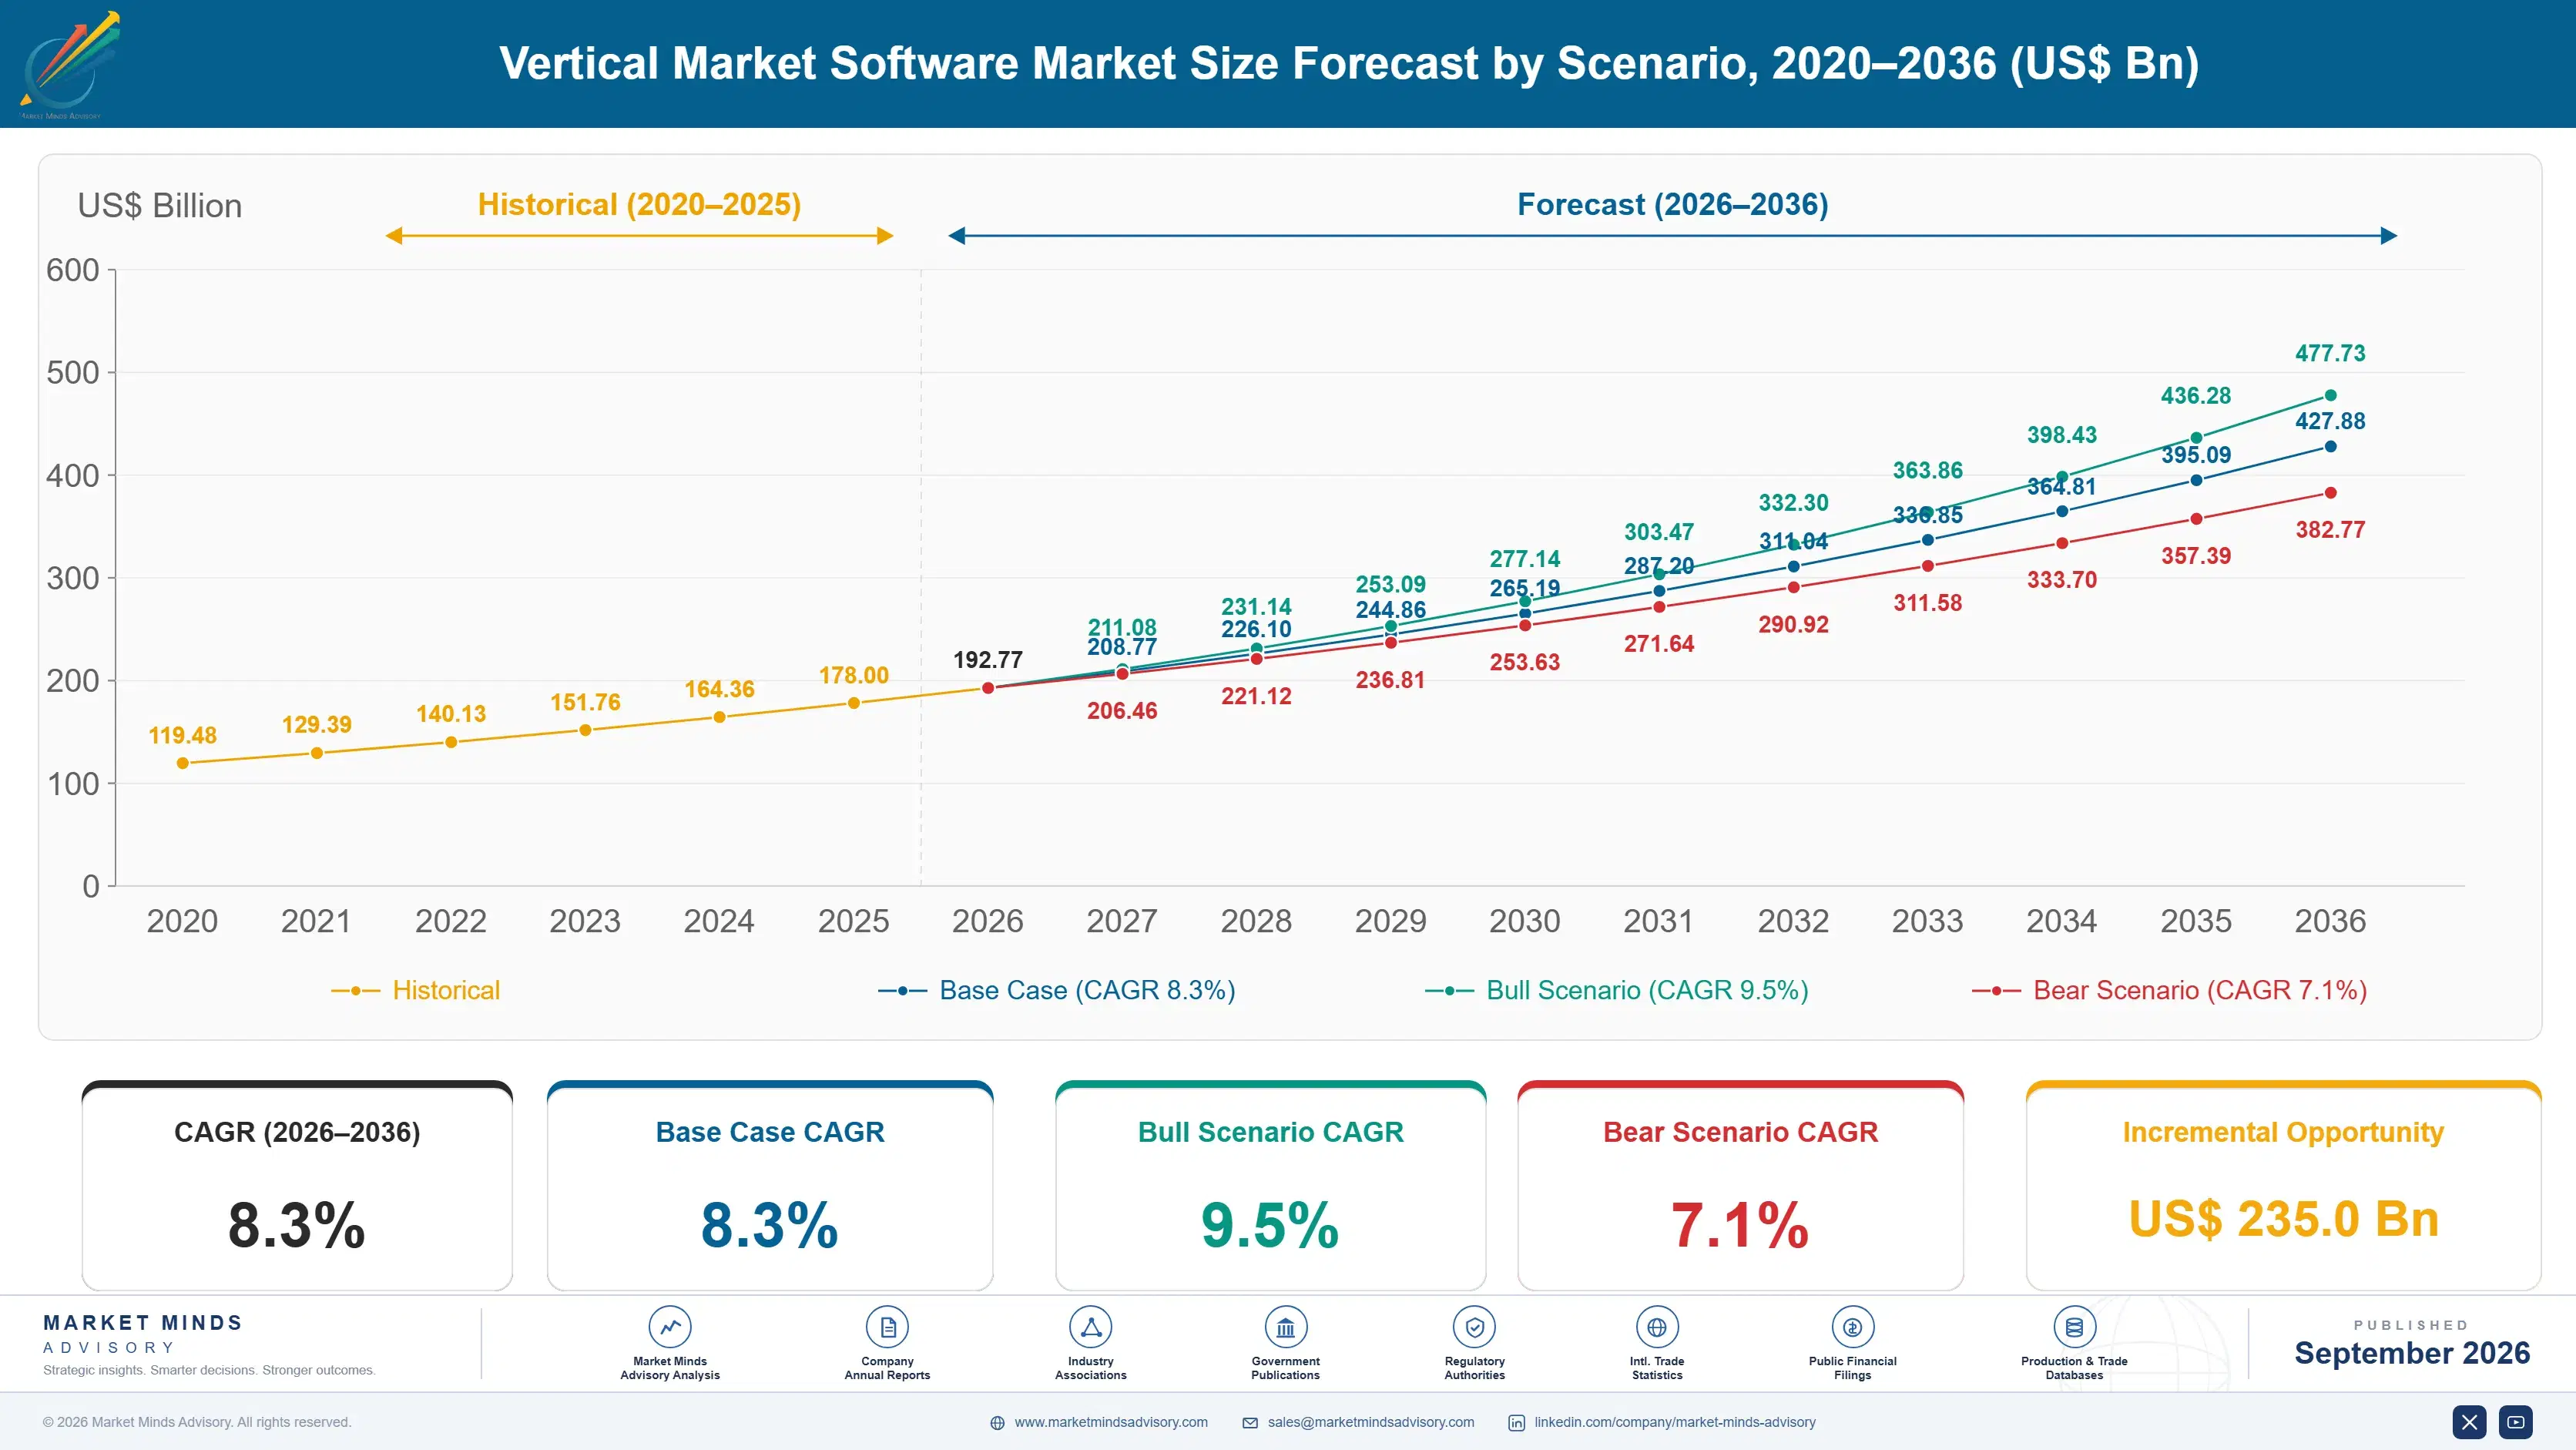
The market reaches USD 192.7 billion in 2026 and USD 427.7 billion by 2036, a 2.22 times expansion at 8.3% annually. Embedded payments and financial services attach grows at 12.5%, half again the market rate of 8.3%, because processing a customer's money earns more than licensing them software ever did. East Asia holds 24% of spending and India compounds fastest at 14.1% on business formalisation. Retention carries these valuations.
Five participants hold 16% of spending, which is extraordinarily low and reflects thousands of products serving industries too small for anybody large to bother with. Constellation Software, Roper Technologies, Tyler Technologies, Vista Equity portfolio companies and Bentley Systems lead. Customer switching inertia decides valuations more than growth rate does. Annual churn sits near 6% and median customer tenure runs around 12 years. Payments attach sits well below what the best operators already demonstrate today.
Market Definition
This report covers vertical market software: applications built for the operating workflow of a specific industry rather than a general business function. It spans core operational systems for defined verticals, embedded payments and financial services attached to those systems, regulatory and compliance modules specific to an industry, field service and scheduling for vertical operators, industry data and benchmarking services, and the implementation services sold with them. It excludes horizontal enterprise resource planning, general customer relationship management, generic accounting software, infrastructure software, and consumer applications.
Base Year Value
$178.0B in 2025 (MMA Primary Research Dataset, September 2026)
Forecast Period
2026 to 2036, eleven discrete annual values
CAGR
8.3% base case. Bull 9.5%. Bear 7.1%.
Fastest Growth Segment
Embedded Payments And Financial Services Attach: 12.5% CAGR
Fastest Growth Country
India: 14.1% CAGR
Fastest Growth Region
South Asia and Pacific: 10.4% CAGR
Largest Region
East Asia: 24% of 2025 global value
Market Leaders
Constellation Software, Roper Technologies, Tyler Technologies, Vista Equity portfolio companies and Bentley Systems lead on vertical market software revenue. Source: MMA Analysis.
Primary Survey
n=3,800 procurement and R&D decision-makers, Q4 2025, six countries
Methodology
Demand-side build-up, cross-validated against public data, 47 expert interviews

Vertical Market Forecast Scenarios

vertical-market-software-market-size-forecast-scenario-1790000838414
Between 2020 and 2025 the category compounded at 7.2%, which understates what happened commercially. Organic growth was modest while acquisition multiples for small vertical software businesses stayed low enough that consolidators compounded capital at rates the underlying market never produced. The industry's growth rate and its investors' returns have been two different numbers for a decade, and conflating them misreads the whole category.
The base case holds 8.3% on three mechanisms. Embedded payments keep converting software relationships into transaction revenue that scales with the customer's business rather than their seat count. Regulatory complexity keeps rising in the licensed and inspected industries these products serve, which makes compliance modules non-discretionary. And business formalisation keeps expanding the addressable base in markets where small operators are moving onto systems for the first time. Those three mechanisms run largely independently of one another.
The bull case at 9.5% assumes payments attach rates rise toward what the best operators already achieve, since most portfolios sit far below their own demonstrated ceiling. The bear case at 7.1% is acquisition multiple expansion, where competition for small vertical software assets raises entry prices enough that the consolidation model stops producing the returns that funded it.

Boring Is The Business Model

Nothing about this category is exciting and that is precisely why it works. A dental practice, a marina, a funeral home or a municipal water authority runs software that touches every part of its operation, and annual churn sits near 6% because replacing it means rebuilding how the business works. Median customer tenure runs around 12 years. Retention that good would command extraordinary multiples in any market anybody was watching.
TOP FIVE CONCENTRATION16%Extraordinarily low, reflecting thousands of products across small industries
ANNUAL CUSTOMER CHURN6%Customers leaving a vertical system in any given year
PAYMENTS ATTACH RATE31%Customers processing payments through their software provider directly
MEDIAN CUSTOMER TENURE12 yearsTypical time a business runs the same vertical operating system
ACQUISITION ENTRY MULTIPLE4.8 timesTypical earnings multiple paid for small vertical software businesses
REVENUE PER EMPLOYEEUSD 310,000Typical productivity across mature vertical software operating companies
The money increasingly comes from payments rather than licences. Around 31% of customers now process payments through their software provider, and that revenue scales with the customer's business rather than their headcount. Embedded payments and financial services attach grows at 12.5% against 8.3% for the market. A provider charging per seat is billing against a number that barely moves; one taking a share of transactions grows whenever its customer does.
Concentration at 16% is the lowest of any software category we cover. Thousands of products serve industries too small for large software companies to bother with, which is exactly the condition consolidators exploit. Entry multiples near 4.8 times earnings let capital compound well above the underlying 8.3% growth rate.
"The best vertical software business I have ever looked at sold scheduling to septic tank pumping companies. Ninety-four percent retention, thirty years old, and the founder had never met a competitor. That is the whole category in one sentence and it is why the consolidators keep winning."
Director, Application Software and Consolidation Strategy Practice · MMA Technology Practice · September 2026

Market Trends

Payments Attach Outgrows Every Licence Model

Around 31% of customers now process payments through their software provider, and that revenue scales with the customer's transaction volume rather than their seat count or headcount. Embedded payments and financial services attach grows at 12.5% against 8.3% for the market as a direct result. A provider billing per seat is charging against a number that barely moves for most small businesses, while one taking transaction share grows automatically whenever its customer has a good year. Attach across most portfolios sits far below what the best operating companies already demonstrate under identical conditions.
Market Impact: India compounds at 14.1% yearly

Switching Inertia Rather Than Features Holds Customers

Annual churn sits near 6% and median customer tenure runs around 12 years, because the software touches every part of how the business operates and replacing it means rebuilding the operation itself. That retention has nothing to do with product quality in most cases, and buyers know it. Competitors offering better systems lose to inertia repeatedly, which is why the practical route into these industries is acquisition rather than displacement of an incumbent. Entry multiples around 4.8 times earnings make buying the incumbent cheaper than winning its customers individually. Displacement almost never works.
Market Impact: Tenure runs around 12 years

Market Opportunities and Growth Drivers

Business Formalisation Expands The Addressable Base

India compounds at 14.1%, ahead of every other market, as small operators in licensed and inspected trades move onto systems for the first time under tax and regulatory formalisation. That expands the addressable base rather than redistributing it among existing providers. Those customers also adopt payments alongside software from the outset rather than adding it later, which lifts attach rates well above the 31% typical in mature markets. Formalisation adds customers who were previously outside any software market at all, which is a genuinely different growth mechanism from competing for existing accounts.
Market Impact: Entry multiples near 4.8 times

Regulatory Complexity Makes Compliance Modules Mandatory

The industries these products serve are licensed, inspected or reimbursed, and the reporting attached to that keeps expanding in scope and frequency. Compliance modules therefore become non-discretionary purchases in categories where nearly everything else can be deferred indefinitely. Providers holding the compliance module hold the account, because the operator cannot run without filing and will not maintain two systems. Regulatory depth is expensive to build and considerably harder to displace than any feature. Statutory logic has to be reproduced across every jurisdiction served before a competitor can credibly bid at all.
Market Impact: Attach sits at only 31%

Market Restraints and Challenges

Acquisition Multiples Are Rising Toward The Model's Limit

Entry multiples around 4.8 times earnings for small vertical software businesses are what made consolidation work, and competition for those assets keeps pushing them upward. The root cause is that the returns became visible and attracted capital that previously ignored the category entirely. Commercially this compresses the arbitrage. Mitigation runs through proprietary deal sourcing in industries nobody else covers, through operational improvement after purchase, and through payments attach that raises earnings post-acquisition. None of those restores the original arbitrage; they slow its compression while the capital base keeps growing and needing assets to buy.
Market Impact: Payments attach reaches 31% today

Payments Attach Depends On Regulatory Permission

Embedding payments requires money transmission licensing, sponsor bank relationships and compliance capability that most vertical software businesses have never held. The root cause is that becoming a payments participant is a regulated activity rather than a product decision. Commercially this caps attach rates below what the economics justify. Mitigation runs through payment facilitator platforms that carry the licensing, through referral arrangements at lower economics, and through group-level compliance shared across portfolio companies. Carrying that compliance burden once at group level rather than separately in every operating company is what makes attach economic at portfolio scale.
Market Impact: Annual churn sits near 6%
4 additional market trends, 3 additional growth drivers, and 2 additional restraints and challenges are covered in the full report. Contact sales@marketmindsadvisory.com to access the complete intelligence.

Segment CAGR and Growth Architecture

Segmentation follows product function within a vertical, since each carries quite different retention, regulatory exposure and revenue scaling behaviour. Six functions cover the market: embedded payments and financial services, regulatory and compliance modules, core operational systems, field service and scheduling, industry data and benchmarking, and implementation and support services. Vertical industry and ownership model are separate dimensions handled elsewhere.
vertical-market-software-market-market-share-analysis-1790000839000

Embedded Payments And Financial Services Attach

Embedded payments and financial services attach grows at 12.5%, half again the market rate of 8.3%, because processing a customer's money earns more than licensing them software ever did and scales with their transaction volume rather than their headcount. Around 31% of customers now pay through their software provider. The constraint is regulatory rather than commercial: money transmission licensing, sponsor bank relationships and compliance capability are things most vertical software businesses have never held, which is why attach rates sit well below what the economics plainly justify. Closing that gap requires licensing capability rather than any product development at all. Sponsor bank relationships take considerably longer to establish than any software feature does.
CAGR 12.5%

Regulatory And Compliance Modules

Regulatory and compliance modules compound at 10.4% because the industries these products serve are licensed, inspected or reimbursed, and the reporting attached to that keeps expanding in both scope and frequency. Compliance becomes non-discretionary in categories where almost everything else can be deferred indefinitely by an operator under cost pressure. The provider holding the compliance module holds the account, since the business cannot operate without filing and will not run two systems to do it. Regulatory depth is expensive to build and slow to displace. Filing requirements are legislated rather than negotiable, which makes the module the single hardest thing in a vertical for a competitor to reproduce credibly. Operators will not run two systems.
CAGR 10.4%
Full segment breakdown across 6 segments available in the complete report.

Regional Architecture and Country Demand Map

East Asia holds 24% of spending, the largest regional share, because small business density and formalisation are both high and payments attach is culturally established. North America follows at 23% on consolidation depth and mature payments attach. India compounds fastest at 14.1% on business formalisation.

East Asia

East Asia takes 24% of spending, the largest regional share, because small business density is high, formalisation is largely complete and payments attach is culturally established rather than something providers must persuade customers to adopt. Chinese and Southeast Asian operators expect to transact through their software rather than alongside it, which lifts attach well above the 31% typical elsewhere. Japanese vertical software retention is the highest anywhere. Growth at 9.2% runs above the global rate on payments attach rather than new customer acquisition. Regional consolidators are beginning to apply the North American acquisition model to fragmented local products, which was not happening five years ago. Multiples there remain low. Sourcing discipline is still developing.
Share: 24% | CAGR: 9.2% (2026 to 2036)

North America

North America accounts for 23% of spending, where the consolidation model was developed and where Constellation Software, Roper Technologies and Tyler Technologies all built their positions. Acquisition multiples here have risen furthest as the returns became visible and attracted capital that previously ignored the category. Payments attach is mature and the regulatory infrastructure supporting it is well established. Growth at 8.7% sits above the global rate on payments attach and municipal software demand rather than on any base expansion. Proprietary sourcing rather than capital availability is now what separates operators here, since visible processes price assets above what the model can support. Relationships beat capital here. Municipal software demand adds steady volume.
Share: 23% | CAGR: 8.7% (2026 to 2036)
Regional intelligence for 5 additional markets available in the complete report: Western Europe, South Asia and Pacific, Latin America, Middle East and Africa, Eastern Europe. Contact sales@marketmindsadvisory.com.
vertical-market-software-market-country-cagr-analysis-1790000839530

Where Vertical Software Compounds Fastest

Switching inertia rather than product quality holds customers, payments revenue scales where licence revenue does not, and entry multiples are what made the consolidation model work. The four levers below follow those conditions rather than any argument about feature development, which matters remarkably little here. Each addresses a commercial condition instead. Features barely matter here.

Convert Licence Relationships Into Payment Flows

Around 31% of customers process payments through their software provider, and that revenue scales with transaction volume rather than seat count. Providers billing per seat are charging against a number that barely moves for a small business, while transaction share grows whenever the customer has a good year. Attach rates across most portfolios sit far below what the best operators already demonstrate, which makes this the largest unclaimed revenue in the category. Licensing capability rather than product work is what closes it. A business that never adds headcount still processes more money every year.
Market Impact: Payments attach now reaches only 31% of customers

Buy Rather Than Displace The Incumbent

Annual churn near 6% and median tenure around 12 years mean a better product loses to inertia repeatedly, whatever its merits in a comparison. Entry multiples around 4.8 times earnings make acquisition the cheaper route into a vertical than competing for its customers one at a time. Providers building superior systems to attack entrenched positions are funding a customer acquisition cost that the retention numbers say they will never recover. Median tenure around 12 years is what those numbers actually mean in practice. Feature superiority is not the variable that decides these outcomes.
Market Impact: Entry multiples now sit near just 4.8 times

Own The Compliance Module In Every Vertical

The industries these products serve are licensed, inspected or reimbursed, and the reporting attached keeps expanding while everything else gets deferred under cost pressure. The provider holding compliance holds the account, since an operator cannot run without filing and will not maintain 2 separate systems to do it. Regulatory depth costs money to build and is considerably harder for a competitor to displace than any operational feature set. Filing is legislated rather than negotiable. An operator cannot trade without filing, and reproducing statutory logic across jurisdictions is expensive enough to deter most competitors before they start.
Market Impact: Median tenure now runs a full 12 years

Source Deals Where Nobody Else Is Looking

Entry multiples around 4.8 times earnings are what made consolidation compound, and competition for visible assets keeps pushing them upward as the returns attract capital. Proprietary sourcing in industries nobody else studies preserves the arbitrage that public processes destroy. The work is unglamorous relationship building across trades most investors could not name, and it is the entire reason the best operators still buy at prices others cannot reach. Multiples near 4.8 times are only available to buyers nobody is bidding against. Patience is the whole advantage. Trades most investors could not name are where the assets sit.
Market Impact: Churn now runs near just 6% each year

Who Controls the Margin Pool

Five participants hold 16% of vertical market software spending, extraordinarily low even for application software, because thousands of products serve industries too small for large software companies to bother covering. Constellation Software, Roper Technologies, Tyler Technologies, Vista Equity portfolio companies and Bentley Systems lead. All participants are assessed on vertical market software revenue rather than on broader industrial, infrastructure or investment businesses they also operate. Concentration this low has persisted for decades and shows no sign of changing, because the industries served are too small to interest anybody large.
Competition runs on deal sourcing and post-acquisition operating capability far more than on product comparison, since customers rarely switch and acquisition is the practical route into a vertical. The second dimension is payments attach capability, because that revenue scales where licence revenue does not and most portfolios sit well below their own demonstrated ceiling.

Pressure is emerging from rising acquisition multiples as capital that ignored this category discovers the returns. Rankings shift where formalisation expands the base and where payments attach is culturally established, particularly across India, Southeast Asia and Latin America at present. Operators without proprietary sourcing carry the most exposure to that multiple expansion.
vertical-market-software-market-company-positioning-matrix-1790000840056

Competitive Moat and Risk Dimensions

CONSTELLATION SOFTWARE

Moat: Proprietary Deal Sourcing

Constellation holds relationship networks across thousands of small vertical industries that no competitor has replicated, letting it buy nearer 4.8 times earnings than the prices auctions produce. That sourcing capability was built person by person across decades and cannot be purchased. Competitors bidding in visible processes pay materially more for comparable assets.
CONSTELLATION SOFTWARE

Risk: Multiple Expansion Pressure

Rising acquisition multiples compress the arbitrage that made the model compound, as capital that previously ignored the category discovers the returns and bids for the same assets. Sourcing advantage slows that compression without stopping it. A model dependent on buying cheaply faces a genuine problem when cheap stops being available at the scale the capital base requires.
TYLER TECHNOLOGIES

Moat: Municipal Regulatory Depth

Tyler holds regulatory and reporting depth across municipal government functions where the filing requirements are legislated rather than negotiable, and an authority cannot operate without meeting them. That makes the module non-discretionary in a customer base with median tenure well above the 12 year category average. Competitors must reproduce statutory logic across many jurisdictions before they can bid at all.
TYLER TECHNOLOGIES

Risk: Procurement Cycle Exposure

Municipal customers buy through public procurement on multi-year cycles tied to budget approval, which makes revenue timing lumpy and politically exposed in ways commercial verticals are not. Regulatory depth protects the position and does not accelerate the purchase. Payments attach is also harder in government contexts where fee structures are set by statute rather than commercially.

Players Tracked

Prominent Players

Constellation Software
Roper Technologies
Tyler Technologies
Vista Equity portfolio companies
Bentley Systems

Other Key Players

Autodesk
Veeva Systems
ServiceTitan
Toast
Shopify
Lightspeed Commerce
Jonas Software
Volaris Group
Banyan Software
Valsoft Corporation
PDI Technologies
Clearwater Analytics
Procore Technologies
AppFolio
Guidewire Software

Recent Developments

MARCH 2025

Consolidators Expand Payments Attach Across Acquired Portfolios

Vertical software consolidators expanded embedded payments attach programmes across acquired operating companies, a commercial development rather than any single transaction. Around 31% of customers now process payments through their software provider, and most portfolios sit far below the attach rates their own best operating companies already demonstrate.
Signal: Payments attach raises earnings after purchase without ever requiring any organic customer growth at all whatsoever.
SEPTEMBER 2024

Acquisition Multiples Rise As Capital Discovers The Category

Entry multiples for small vertical software businesses rose as capital that previously ignored the category competed for the same assets, a market development rather than any corporate event. Multiples near 4.8 times earnings are what made consolidation compound, and competition for visible assets keeps pushing that entry price upward.
Signal: Proprietary sourcing preserves the arbitrage that visible auction processes now reliably destroy for everybody else involved.
JUNE 2025

Indian Formalisation Moves Small Operators Onto Systems

Tax and regulatory formalisation moved large numbers of Indian small operators in licensed trades onto vertical software for the first time, a policy-driven development rather than any acquisition. That expands the addressable base rather than redistributing it, and those customers adopt payments alongside software from the outset.
Signal: First-time adopters attach payments immediately rather than adding them several years afterwards as incumbents once did.

What These Businesses Cost

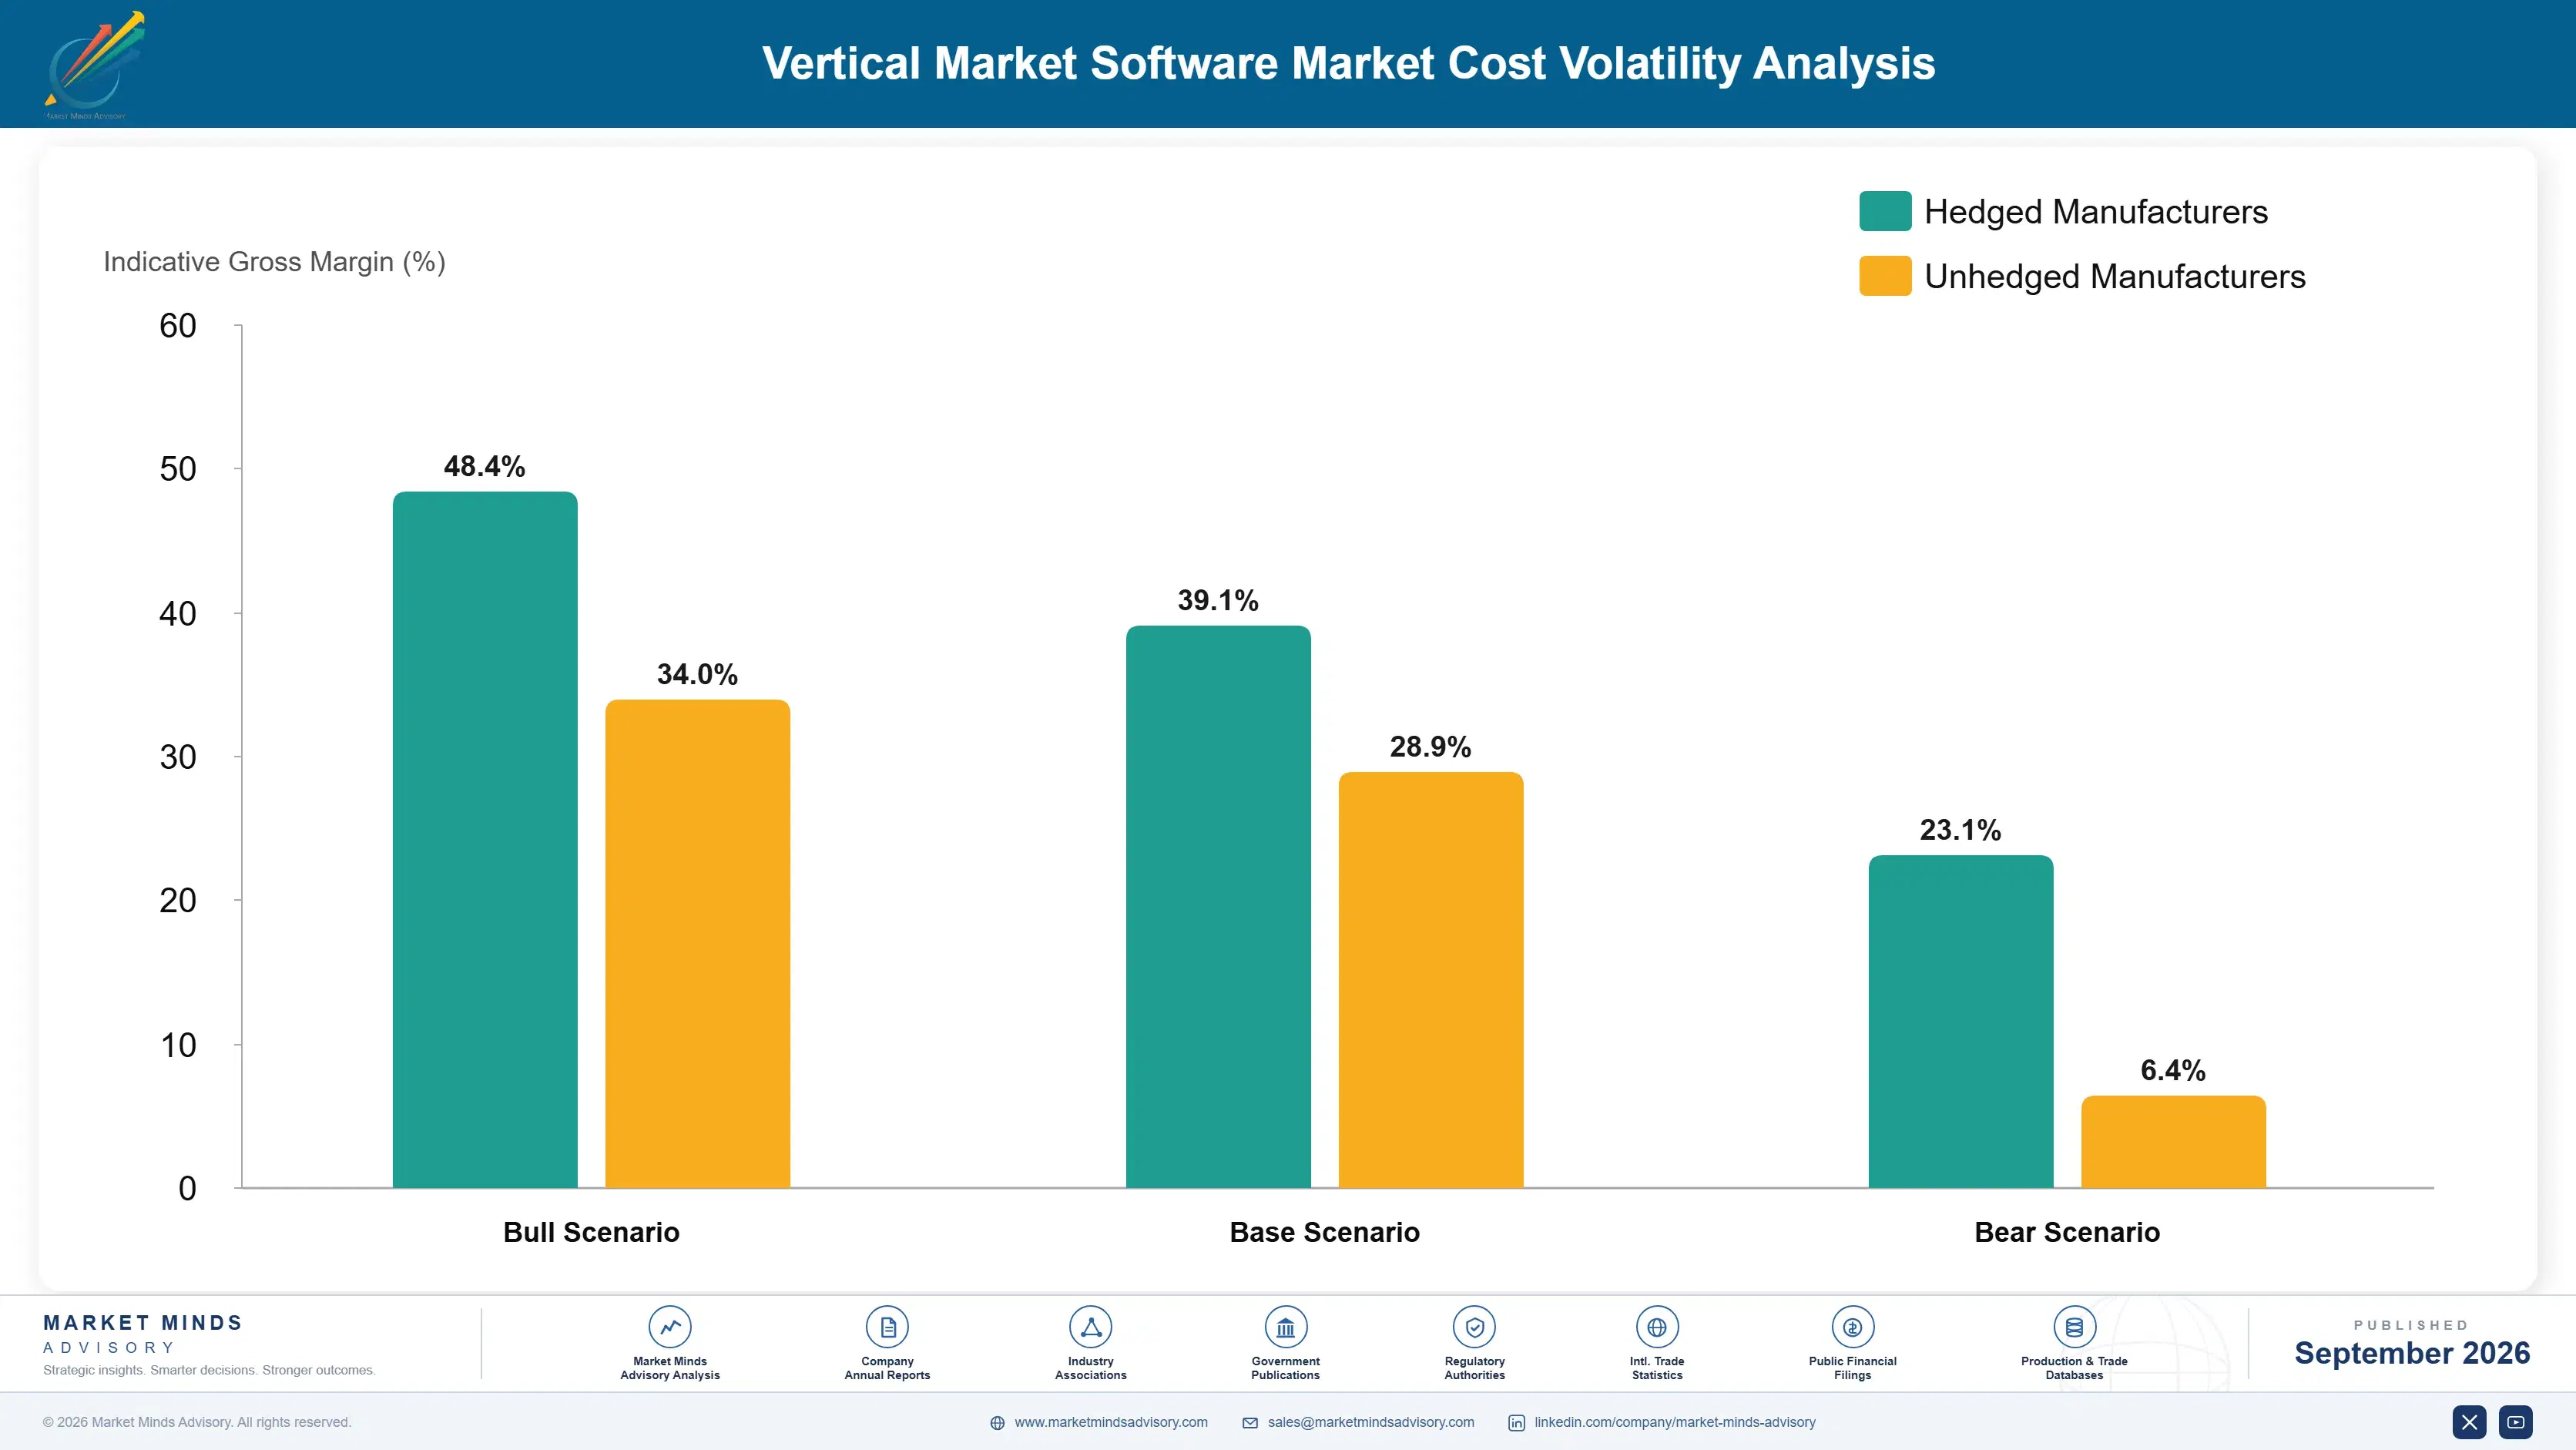
Product engineering absorbs roughly 22% of operating company cost, which is low for software and reflects mature products serving stable workflows that change slowly. Customer support and success take around 26%, since these customers are small and call rather than search. Payments processing costs absorb about 19% where attach exists, and sales and marketing take most of the remaining balance.
Payment processing economics shifted through 2023 and 2024 as interchange and scheme fees moved and sponsor bank requirements tightened for platforms carrying merchant risk. Constellation Software Annual Report 2024 and Tyler Technologies Annual Report 2024 both record payments economics and acquisition pricing among principal operating variables. Operators holding direct sponsor relationships retained materially more of the processing spread than those working through intermediaries. Intermediated arrangements surrender much of the spread.

The competitive disadvantage mechanism is acquisition price rather than operating cost. An operator buying at 4.8 times earnings compounds at rates one paying seven times cannot approach, regardless of how well either runs the business afterwards. Exposure concentrates among newer entrants without proprietary sourcing, since they buy through visible processes where price is set by the most optimistic bidder rather than by the asset.
vertical-market-software-market-cost-volatility-analysis-1790000840251

Hold Direct Sponsor Bank Relationships For Payments

Payments processing absorbs about 19% of cost where attach exists, and intermediated arrangements surrender much of the spread that makes attach worth pursuing at all. Direct sponsor relationships retain materially more of it. The compliance burden is real and it is carried once at group level rather than separately by every operating company in a portfolio.

Build Sourcing Relationships Before Assets Come To Market

Entry multiples near 4.8 times earnings are what make this model compound, and visible processes set prices by the most optimistic bidder rather than by the asset. Relationships built across years with owners who are not yet selling preserve that arbitrage. The work is slow and unglamorous, which is exactly why competitors with more capital have not replicated it.

Centralise Support Tooling Across Operating Companies

Customer support absorbs around 26% of operating company cost because these customers are small and telephone rather than search for answers themselves. Shared tooling and knowledge systems across a portfolio reduce that without touching the local relationships customers value. The discipline is holding autonomy where it matters commercially while removing duplication where customers never see it.

Portfolio Architecture for Margin Defence

Margin architecture separates on revenue scaling behaviour rather than on product difficulty. Implementation and support services earn least, since both consume labour that scales directly with customer count. Core operational systems and field service sit above on licence economics. Embedded payments, compliance modules and industry data services earn most, because each scales with customer activity rather than with headcount employed to deliver it.
The volume versus premium tension runs between licence renewal and payments attach, which reward opposite commercial behaviour entirely. Licence revenue rewards seat expansion in businesses whose headcount barely grows. Payments revenue rewards customer transaction growth, which happens whether or not the customer adds staff. Providers optimising seat pricing in businesses that will never add seats are managing the wrong variable carefully.

High-value pools concentrate in embedded payments and in compliance modules, and neither is reached through product development. Payments requires money transmission licensing and sponsor relationships most software businesses have never held. Compliance requires statutory logic across jurisdictions that takes years to build. Both explain why concentration sits at 16% while the participants holding those capabilities compound far faster than the category grows.

Volume / Commodity-Adjacent

Implementation and support services, both consuming labour that scales directly with customer count in a customer base of small businesses that telephone rather than self-serve. The thirteen point spread separates operators with centralised support tooling from those duplicating it across every operating company.
Gross Margin: 31% to 44%

Premium / Certified

Core operational systems and field service and scheduling, where switching inertia rather than feature comparison holds customers across median tenures around twelve years. The thirteen point spread tracks how much product engineering each operator carries against products that have stabilised.
Gross Margin: 58% to 71%

Sustainability / Regulatory / Next-Generation

Embedded payments and financial services, regulatory and compliance modules and industry data services, each scaling with customer activity rather than delivery headcount. The twelve point spread reflects payments licensing position and statutory depth across jurisdictions served.
Gross Margin: 76% to 88%
vertical-market-software-market-portfolio-architecture-1790000840755

High-value Sub-segments and Strategic Watch-out

Embedded Payments And Financial Services Attach

Grows at 12.5% because processing a customer's money scales with their transaction volume rather than their headcount. The twelve point spread reflects licensing position. Attach at 31% sits far below what the best operators already demonstrate consistently. Licensing is the barrier, not product. Sponsor relationships gate entry.
Gross Margin: 76% to 88%

Regulatory And Compliance Modules

Grows at 10.4% because filing requirements are legislated rather than negotiable in licensed and inspected industries. The twelve point spread reflects statutory depth. The provider holding compliance holds the account, since operators will not run two systems. Statutory depth takes years to build. Jurisdictions multiply the work.
Gross Margin: 76% to 88%

Core Operational Systems

Grows at 7.6% on switching inertia that keeps median tenure near twelve years regardless of product quality. The thirteen point spread reflects engineering load. Acquisition rather than displacement is how anybody actually enters these verticals. Product quality barely affects retention. Inertia does all of the work.
Gross Margin: 58% to 71%

Implementation And Support Services

Grows at 5.2%, slowest of the six functions, because delivery labour scales directly with customer count and cannot be automated far. The thirteen point spread reflects support centralisation. Small customers telephone rather than search for their own answers. Shared tooling is the only lever. Labour scales with customers.
Gross Margin: 31% to 44%

Why Nobody Ever Leaves

The annuity here is operational entanglement rather than contract or preference. A vertical system touches scheduling, billing, compliance filing and customer records in a business with no technical staff, and replacing it means rebuilding how the business runs. Annual churn near 6% and median tenure around 12 years follow from that directly. The retention has very little to do with product quality, and the owners of these systems generally know it.
Depth varies by whether the provider holds compliance and payments as well as operations. A customer filing statutory returns through the system and processing card payments through it too has three separate reasons not to move and no realistic path to doing so incrementally. A customer using only the operational system could in principle switch. Providers who attached the other two hold accounts that competitors do not seriously attempt.

The buyer has barely changed, which is unusual. A practice owner or operations manager evaluated whether the system handled the specific workflow of their trade, and still does. What changed is who sells to them: a consolidator that acquired the product they already run, rather than a founder they knew personally. That transition carries most of the retention risk.
vertical-market-software-market-end-use-penetration-index-1790000841246

What Compounds In Vertical Software

These are among the four positions where our research anticipates prominent divergence between winners and laggards over the coming forecast period. Each is grounded in the demand model, the regulatory perimeter, and the announced capacity pipeline.
01 / PAYMENTS ATTACH PRIORITY

Process The Money, Not Just The Workflow

Around 31% of customers process payments through their software provider, and that revenue scales with transaction volume rather than the seat count of a business whose headcount barely moves. Attach rates across most portfolios sit far below what the best operating companies already demonstrate under the same conditions. That gap is the largest unclaimed revenue in this category, and closing it requires licensing capability rather than any product development at all from the operating companies that already hold the customers.
02 / ENTRY ROUTE SELECTION

Acquire The Incumbent, Do Not Fight It

Annual churn near 6% and median tenure around 12 years mean a materially better product still loses to switching inertia repeatedly, whatever any feature comparison shows. Entry multiples around 4.8 times earnings make acquisition a cheaper route into a vertical than winning its customers one at a time ever will be. Providers building superior systems to attack entrenched positions fund an acquisition cost the retention numbers say they cannot recover over any realistic horizon whatever the product comparison shows on any dimension at all.
03 / COMPLIANCE MODULE OWNERSHIP

Hold The Filing, Hold The Account

The industries these products serve are licensed, inspected or reimbursed, and reporting requirements keep expanding while everything else gets deferred whenever an operator comes under cost pressure. The provider holding the compliance module holds the account, because a business cannot operate without filing and will not maintain two systems to do it. Statutory depth across jurisdictions costs real money to build and is correspondingly hard to displace, which is exactly why it protects an account against any competitor attempting entry.
04 / SOURCING ADVANTAGE BUILDING

Find Assets Before They Reach Market

Entry multiples near 4.8 times earnings are what made this model compound, and competition for visible assets keeps pushing that entry price upward as returns attract capital. Proprietary sourcing across industries nobody else studies preserves the arbitrage that public processes reliably destroy for everybody involved. The work is slow relationship building across trades most investors could not name, which is precisely why it has not been replicated by anybody with more capital and less patience and considerably less patience for slow work.

Engagement Snapshot From the Field

A live engagement with an industry participant carrying material or product regulatory and market exposure ahead of a defining policy shift, showing how our research translates into a defensible multi-year portfolio strategy.
MARKET MINDS ADVISORY · CLIENT ENGAGEMENT SUMMARY
Vertical Software Producer Strategic Portfolio Review and Transition Roadmap 2026·Investment Scenario on Vertical Software Exposure Evaluation 2025-26
CLIENT PROFILE
A vertical software consolidator holding eleven operating companies across licensed trades, seeing organic growth below its acquisition assumptions while paying rising multiples for new assets. Management had approved an increase in acquisition pace to maintain compounding, without establishing whether the existing portfolio was earning what it could. Nobody had examined payments attach across the operating companies at all.
STRATEGIC CHALLENGE
Corporate development wanted faster acquisition to offset weak organic growth. Operating company leaders wanted engineering investment to improve products they believed were dated. Nobody had examined payments attach across the portfolio, and multiples on the next two targets had already moved above what the model had historically assumed. Both arguments assumed the answer lay outside the existing portfolio.
MMA APPROACH
MMA measured payments attach and processing economics across all eleven operating companies, comparing them against the best performer in the portfolio. We assessed compliance module coverage by vertical and modelled earnings uplift from closing both gaps. Work drew on 47 expert interviews conducted in Q4 2025 with operators, payment facilitators and vertical software owners.
KEY FINDINGS
  1. Payments attach ranged from 8% to 47% across the 11 operating companies, and nobody had examined why the strongest performer differed so much.
  2. Closing attach to the internal best performer produced more earnings uplift than the next 2 planned acquisitions combined would have delivered at current multiples.
  3. Product engineering investment showed no measurable relationship to retention at all, which already sat near 94% across every operating company in the portfolio.
  4. Three operating companies had no compliance module in verticals where filing was mandatory, leaving accounts more exposed than management believed (client-reported, unverified by MMA).
CLIENT PROFILE
A vertical software consolidator holding eleven operating companies across licensed trades, seeing organic growth below its acquisition assumptions while paying rising multiples for new assets. Management had approved an increase in acquisition pace to maintain compounding, without establishing whether the existing portfolio was earning what it could. Nobody had examined payments attach across the operating companies at all.
STRATEGIC CHALLENGE
Corporate development wanted faster acquisition to offset weak organic growth. Operating company leaders wanted engineering investment to improve products they believed were dated. Nobody had examined payments attach across the portfolio, and multiples on the next two targets had already moved above what the model had historically assumed. Both arguments assumed the answer lay outside the existing portfolio.
MMA APPROACH
MMA measured payments attach and processing economics across all eleven operating companies, comparing them against the best performer in the portfolio. We assessed compliance module coverage by vertical and modelled earnings uplift from closing both gaps. Work drew on 47 expert interviews conducted in Q4 2025 with operators, payment facilitators and vertical software owners.
KEY FINDINGS
  1. Payments attach ranged from 8% to 47% across the 11 operating companies, and nobody had examined why the strongest performer differed so much.
  2. Closing attach to the internal best performer produced more earnings uplift than the next 2 planned acquisitions combined would have delivered at current multiples.
  3. Product engineering investment showed no measurable relationship to retention at all, which already sat near 94% across every operating company in the portfolio.
  4. Three operating companies had no compliance module in verticals where filing was mandatory, leaving accounts more exposed than management believed (client-reported, unverified by MMA).
RECOMMENDED STRATEGY
Phase 1: Phase one: pause the acquisition pace increase and close payments attach toward the internal best performer across all eleven operating companies first. Phase 2: Phase two: build compliance modules in the three verticals where filing is mandatory and the portfolio currently holds no coverage at all. Phase 3: Phase three: hold product engineering flat, since the investment showed no measurable relationship to retention already sitting near ninety-four percent.
OUTCOME
The consolidator paused its acquisition increase and closed payments attach toward the internal benchmark instead (client-reported, unverified by MMA). Portfolio earnings rose materially without any new purchases, and the compliance gaps were closed across the three exposed verticals. Attach rate is now reviewed before any acquisition approval, which is the change that outlasted the engagement.

Frequently Asked Questions

Foundational context covering the market sizes, CAGR, scope, country, region and competition that inform every finding below. This section is provided to cover basics and most often pre-purchase conversations, answered from the MMA Primary Research Dataset.

What is the current size of the Vertical Market Software Market?

Global value reaches USD 192.7 billion in 2026, measured as vertical market software revenue across six product functions. The 2025 base was USD 178.0 billion.

How large will the Vertical Market Software Market be by 2036?

The market reaches USD 427.7 billion by 2036, an increase of USD 235.0 billion across the forecast period. That represents 2.22 times expansion from the 2026 base.

What is the CAGR for the Vertical Market Software Market 2026 to 2036?

The base case runs at 8.3% annually, with a bull case at 9.5% if payments attach rises toward demonstrated ceilings and a bear case at 7.1% if acquisition multiples expand further.

Which segment is growing fastest?

Embedded payments and financial services attach grows at 12.5%, half again the market rate of 8.3%. Processing a customer's money earns more than licensing them software ever did.

Who are the major companies in the Vertical Market Software Market?

Constellation Software, Roper Technologies, Tyler Technologies, Vista Equity portfolio companies and Bentley Systems lead, holding 16% between them. Jonas Software and Valsoft hold smaller positions.

Which country is growing fastest?

India leads at 14.1%, as small operators in licensed trades move onto systems for the first time under tax and regulatory formalisation. Indonesia and Brazil follow.

Report Segmentation Architecture

The full report scope spans multiple orthogonal segmentation dimensions, with cross-tabulated demand data provided for each dimension pair. Coverage extends further to regional breakdowns, trend trajectories, and the competitive detail needed to support segment-level decision-making.

By Product Function

  • Embedded Payments And Financial Services
  • Regulatory And Compliance Modules
  • Industry Data And Benchmarking Services
  • Core Operational Systems
  • Field Service And Scheduling
  • Implementation And Support Services

By End-Use Industry

  • Healthcare Practices And Clinics
  • Municipal And Public Sector Operations
  • Construction And Trades Contracting
  • Hospitality And Food Service Operators
  • Professional And Financial Services Firms
  • Transport, Marine And Fleet Operations

By Commercial Dimension

  • Direct Subscription Licensing
  • Payment Processing Revenue Share
  • Perpetual Licence With Maintenance
  • Reseller And Partner Distribution
  • Public Sector Procurement Contracts
  • Usage Based Transaction Pricing

By Region

  • North America
  • Western Europe
  • East Asia
  • South Asia and Pacific
  • Latin America
  • Middle East and Africa
  • Eastern Europe

Scope, Methodology, and Coverage

Every figure in this report is reproducible from documented input assumptions. The scope below maps the historical period, the forecast horizon, the segmentation dimensions, and the countries covered, alongside the underlying primary and qualitative methodology.
Historical Period
2020 to 2025
Forecast Period
2026 to 2036
Base Year
2025 (USD billions; MMA Primary Research Dataset, September 2026)
Market Definition
This report covers vertical market software: applications built for the operating workflow of a specific industry rather than a general business function, spanning core operational systems, embedded payments and financial services attach, regulatory and compliance modules, field service and scheduling, industry data and benchmarking services, and implementation services. It excludes horizontal enterprise resource planning, general customer relationship management, generic accounting software, infrastructure software, and consumer applications.
Quantitative Units
USD millions, vertical market software revenue basis; customer accounts served; annual churn rates; payments attach rates as a percentage of customers; median customer tenure in years; acquisition entry multiples on earnings; revenue per employee.
Segmentation Dimensions
Product function; end-use vertical industry; commercial revenue route; geography across seven regions.
Regions Covered
North America, Western Europe, East Asia, South Asia and Pacific, Latin America, Middle East and Africa, Eastern Europe
Countries Covered
United States, Canada, United Kingdom, Germany, France, Netherlands, Sweden, Spain, Italy, Poland, China, Japan, South Korea, India, Australia, Indonesia, Brazil, Mexico, Saudi Arabia, South Africa.
Key Companies Profiled
Constellation Software, Roper Technologies, Tyler Technologies, Vista Equity portfolio companies, Bentley Systems, Autodesk, Veeva Systems, ServiceTitan, Toast, Lightspeed Commerce, Jonas Software, Volaris Group, Banyan Software, Valsoft Corporation, Procore Technologies.
Quantitative Methodology
Primary survey, n=3,800 respondents, Q4 2025, six countries; demand-side model with trade association cross-validation
Qualitative Methodology
47 expert interviews, Q4 2025; applied to validate demand model assumptions, identify emerging dynamics, and assess competitive positioning
Report Format
PDF and XLSX data workbook (Word format preview document)
Publisher
Market Minds Advisory
Report Code
MMA-2026-TEC-141
Published
September 2026
Contact
sales@marketmindsadvisory.com | www.marketmindsadvisory.com

Purchase the full Vertical Market Software Market Report (2026 to 2036).

This report sizes the global vertical market software market from 2026 to 2036 across six product functions, six vertical industries and seven regions. It explains why annual churn near 6% and median tenure around 12 years make acquisition rather than displacement the practical route into any vertical. Payments attach at around 31% of customers is analysed as the largest unclaimed revenue in the category. Acquisition entry multiples near 4.8 times earnings are examined as the arbitrage that made consolidation compound faster than the market grew. Regional analysis explains why East Asia holds 24% of spending.
Six product functions sized through to 2036
Payments attach economics quantified across operating portfolios
Switching inertia analysed against acquisition entry multiples
Twenty named participants assessed on vertical software revenue
Four revenue levers with quantified commercial impact
Anonymised consolidator value creation engagement documented in full

Built For The People Who Decide

From boardroom strategy to bench-side execution, this report is read cover-to-cover by leaders shaping the next decade of their industry, turning demand scenarios, market dynamics and valuation benchmarks into decisions.
CXOs/ Presidents/ VPs/ Managers
M&A and Corporate Development
Strategy Teams and R&D Heads
Procurement and Product Directors
Regulatory and Compliance Leaders
Investor Relations and Equity Analysts