Market Minds Advisory
Vegan Drink Mixes Market

Vegan Drink Mixes Market: Vegan Drink Mixes Market. Electrolyte, Greens and Instant Powders Without Animal Ingredients

Vegan drink mixes turn hydration, greens, energy and instant milk powders into single-serve sachets free of animal ingredients, but taste, sweetener choices and solubility now decide which brands hold subscription and retail loyalty.

Lead Analyst

Published

September 2026

Make Smarter Decisions with Customized Research Insights

Request a free sample report and evaluate market opportunities, growth trends, and competitive dynamics relevant to your business needs.

2025 MARKET VALUE$3.4BMarket Size 2025
2036 FORECAST VALUE$8.3BBase Case , 2026 to 2036
CAGR 2026 TO 20368.5 %Bull 9.8% / Bear 7.2%
INCREMENTAL OPPORTUNITY$4.7BNet 10- year value creation
EXPANSION MULTIPLE2.26x2036 value over 2026 base
Strategic Levers
M&A Pipeline
Regional Outlook
Country Rankings
Competitive Intelligence
Segmental Deep-dive
Call-Us : 91 93563 13602

Executive Snapshot and Market Trajectory.

Vegan drink mixes are powders and tablets stirred into water or plant milk to make hydration, greens, energy and hot drinks without animal ingredients. Convenience drives the category, and shoppers judge taste, sweetener choice and mixing quality before any wellness claim. Private-label sticks add price pressure at retail.
Electrolyte and Hydration Mixes grow fastest as sports, travel and everyday wellness buyers replace sugary bottled drinks, while instant plant-milk and flavoured powders still carry steady volume in Asia. East Asia holds the largest share because Chinese, Japanese and Korean instant beverage habits and dense convenience retail concentrate demand there, with North America second on hydration and greens brands. Gross margins run 30% to 52%, depending on channel and format.
Five groups hold about 36% of value, led by Unilever, Nestle, Athletic Greens, Danone and Kraft Heinz, so private labels and direct-to-consumer brands take a large share. Vegan certification, sweetener approvals, sodium and sugar labelling, and supplement claim rules govern positioning, and retailers audit allergen controls, heavy metal testing and ingredient sourcing before granting listings in sports, wellness and grocery aisles. Taste failures cost shelf space quickly. Heavy metal tests favour careful sourcing. Audits follow.
Market Definition
The market covers global sales of powdered, tablet and stick-pack drink mixes made without animal-derived ingredients, including electrolyte and hydration mixes, greens and superfood mixes, energy and focus mixes, instant plant-milk and latte powders and flavoured fruit powders, sold through retail, online and foodservice channels. It excludes vegan protein powders sold mainly as protein supplements, ready-to-drink beverages, liquid concentrates and squashes, and dairy-based drink mixes.
Base Year Value
$3.4B in 2025 (MMA Primary Research Dataset, September 2026)
Forecast Period
2026 to 2036, eleven discrete annual values
CAGR
8.5% base case. Bull 9.8%. Bear 7.2%.
Fastest Growth Segment
Electrolyte and Hydration Mixes: 11.9% CAGR
Fastest Growth Country
China: 10.8% CAGR
Fastest Growth Region
South Asia and Pacific: 10.5% CAGR
Largest Region
East Asia: 30% of 2025 global value
Market Leaders
Unilever, Nestle, Athletic Greens, Danone, Kraft Heinz. Source: MMA Analysis, company annual reports.
Primary Survey
n=3,800 procurement and R&D decision-makers, Q4 2025, six countries
Methodology
Demand-side build-up, cross-validated against public data, 47 expert interviews

Vegan Drink Mixes Market Forecast Scenarios

vegan-drink-mixes-market-size-forecast-scenario-1789973611072
From 2020 to 2025 vegan drink mixes grew at about 7.5% a year. Home fitness and wellness trends lifted hydration and greens mixes in 2020 and 2021, and online brands built subscription bases through social media. Growth slowed in 2023 when inflation pushed shoppers toward cheaper mixes, some brands cut prices to defend volume, and criticism of sweeteners and unproven wellness claims grew.
The base case of 8.5% rests on three named mechanisms. Hydration mixes replace sugary sports and soft drinks as shoppers cut sugar, which lifts electrolyte sachet sales in retail and online. Subscription models raise repeat purchase and lower marketing cost per customer for direct brands. Better sweeteners and flavour systems improve taste without animal-derived ingredients such as honey or dairy solids. Each mechanism is visible in retail ranges, subscription data and recent launches.
The bull case reaches 9.8% if hydration mixes win space in mass retail and vending, and sweetener costs fall. The bear case falls to 7.2% if inflation persists, shoppers return to ready-to-drink formats and regulators tighten supplement claims. Both cases assume stable supply of electrolytes, plant extracts and sweeteners. Neither case assumes new tariffs on ingredients.

Solubility, Sweetener Taste and Subscription Loyalty Set Vegan Drink Mix Returns

A drink mix is a dry blend of electrolytes, sweeteners, flavours, plant extracts or beverage powders that dissolves in water or plant milk. Vegan versions avoid honey, dairy solids, gelatine, carmine and other animal-derived inputs, and use citrus, fruit powders and plant sweeteners such as stevia and monk fruit. Solubility, clumping and flavour stability during storage are the main technical challenges.
MARKET CONCENTRATION36% CR5Top five groups hold about one third of category sales
ONLINE CHANNEL SHARE39%Portion of category sales made through direct and marketplace channels
STICK PACK SHARE48%Portion of category volume sold in single-serve sachets and sticks
OWN-LABEL SHARE14%Portion of category sales sold under retailer private brands
INGREDIENT AND PACK COST41% of COGSPowders, sweeteners and stick packaging within total production cost
REPEAT PURCHASE CYCLE4-6 weeksTypical interval between refills for loyal subscription customers
Value concentrates in three places. Electrolyte and hydration mixes grow fastest, sold in sticks through sports, travel and grocery channels. Greens and superfood mixes carry high prices and loyal subscribers, though taste and claims draw scrutiny. Instant plant-milk and hot drink powders add a large volume pool in Asia and mass retail, where price per serve matters more than wellness claims, and where flavoured powders compete on cost.
Supply runs through powder blenders and packers in the United States, Europe and Asia. Electrolyte salts come from chemical producers, sweeteners from Chinese and American suppliers, plant extracts from Asia and Europe, and packaging from converters. Blenders hold four weeks of ingredient stock, shelf life runs 18 to 24 months, and qualifying a new supplier takes six to nine months of audits, heavy metal tests and taste panels.
"Drink mixes look like a wellness category but behave like a habit category. The shopper who buys a hydration stick once and likes the taste will reorder for years. The brand that wins the first sip and the subscription wins the decade."
Senior Analyst, Beverages and Nutrition Practice · MMA Vegan Drink Mixes Practice · September 2026

Market Trends

Electrolyte Sticks Replace Sugary Sports Drinks in Everyday Hydration

Sports drinks and soft drinks face sugar taxes and health criticism, while electrolyte sticks offer sodium, potassium and magnesium with little or no sugar and low pack weight. Electrolyte and Hydration Mixes grow about 11.9% a year, and gross margins run 34% to 52%. The trend needs good solubility, low aftertaste and clear sodium labelling, and it rewards brands with flavour houses, subscription bases and retail distribution, while price per serve of $1 to $2 exceeds bottled drinks, and shoppers who buy at gyms and airports compare cost carefully. Brands launch flavour ranges every season.
Market Impact: electrolyte sticks carry 0-2 grams sugar

Subscriptions Lift Repeat Purchase and Cut Acquisition Cost for Brands

Direct brands such as Athletic Greens sell greens and hydration mixes by subscription, which lifts lifetime value and provides predictable revenue. Online channels already carry about 39% of category sales, and subscribers reorder every four to six weeks. The trend rewards brands with strong taste, clear ingredient lists and reliable delivery, while rising advertising costs and marketplace imitators squeeze margins, and regulators scrutinise health claims and subscription cancellation rules. Retail listings widen reach but bring price pressure from private labels and multipack discounts. Brands watch cancellation rates monthly to protect margin.
Market Impact: vegan labels earn 10-20% premiums

Market Opportunities and Growth Drivers

Sugar Reduction and Hydration Awareness Push Shoppers Toward Powdered Mixes

Sugar taxes and health guidance push shoppers away from sugary drinks, and awareness of electrolytes for exercise, illness recovery and hot climates has grown sharply. Powder mixes deliver hydration at low sugar and low freight cost compared with bottled drinks. The driver rewards brands with clean labels, simple flavours and clear sodium content, while retailers list electrolyte mixes beside sports drinks and vitamins, which lifts trial among people who never used sports nutrition before and who shop in grocery and pharmacy channels. Pharmacies also position electrolyte sticks as recovery products, which adds year-round demand.
Market Impact: reformulation takes 6-12 months

Vegan and Plant-Forward Lifestyles Expand Demand for Animal-Free Nutrition Powders

Consumers who avoid animal products, and those who follow plant-forward diets, look for greens, energy and hot drink mixes free of dairy, honey and gelatine. Vegan certification has become a purchasing signal in many markets. The driver rewards brands with clear vegan labelling and traceable ingredient lists, and it supports premium pricing of 10% to 20%, while mainstream brands reformulate ranges to remove animal ingredients so that a single product can serve vegan and non-vegan households alike. Retailers also add vegan filters to online stores, which makes certified products easier to find and lifts conversion.
Market Impact: testing adds 2-4% to cost

Market Restraints and Challenges

Taste, Solubility and Sweetener Aftertaste Limit Repeat Purchase Among Shoppers

Drink mixes must dissolve quickly, taste clean and stay stable in storage, yet stevia and other plant sweeteners can leave bitter aftertastes, and greens powders often taste earthy. The root cause is the chemistry of plant extracts and salts. Shoppers stop repeat purchase when taste disappoints, and reviews spread quickly online. Makers respond with sweetener blends, flavour masking, agglomeration and better milling, though reformulation costs $0.3 million to $1 million per range and takes six to 12 months, and buyers judge results quickly. Online reviews often cite taste and clumping first.
Market Impact: hydration mixes grow 11.9% yearly

Unproven Claims and Heavy Metal Scrutiny Threaten Trust and Margins

Greens and superfood mixes carry high prices on health claims that regulators, consumer groups and courts increasingly challenge, and plant powders can contain lead, cadmium or arsenic from soil. The root cause is weak evidence for some claims and natural contamination in botanicals. Retailers demand third-party test reports, and one failed lot can trigger recalls and lost listings. Makers respond with tested suppliers, lot-level certificates and modest claims, though testing adds cost and legal exposure remains for brands using loose language. Retailers now request lot certificates before every reorder in some categories, which slows launches.
Market Impact: online channels carry 39% of sales
3 additional market trends, 2 additional growth drivers, and 4 additional restraints and challenges are covered in the full report. Contact sales@marketmindsadvisory.com to access the complete intelligence.

Segment CAGR and Growth Architecture

The global vegan drink mix market is segmented by product type, which shows where taste and price per serve differ. Five segments cover electrolyte and hydration mixes, greens and superfood mixes, energy and focus mixes, instant plant-milk and latte powders and flavoured fruit powders. Hydration and greens mixes grow fastest, while instant plant-milk powders carry steady volume in Asia.
vegan-drink-mixes-market-market-share-analysis-1789973611338

Electrolyte and Hydration Mixes

Electrolyte and Hydration Mixes is the fastest-growing segment at 11.9% a year, about 1.40 times the overall market rate. Sticks and sachets supply sodium, potassium and magnesium with little or no sugar, and shoppers use them for exercise, travel, illness recovery and daily hydration. Gross margins of 34% to 52% reward brands with flavour houses, subscription bases and retail distribution. Growth depends on solubility, aftertaste and clear sodium labelling, while price per serve of $1 to $2 limits mass adoption. Suppliers with reliable taste, tested ingredients and packaging that avoids clumping hold the strongest positions with sports, grocery and travel retail buyers and online customers. Flavour ranges rotate every season to hold interest.
CAGR 11.9%

Greens and Superfood Drink Mixes

Greens and Superfood Drink Mixes grows at 10.2% a year, about 1.20 times the overall market rate, because shoppers pay premium prices for convenience and perceived nutrition from vegetables, algae, adaptogens and fruit powders. Gross margins of 36% to 54% support heavy marketing by direct brands such as Athletic Greens. Growth depends on taste, evidence for claims and heavy metal testing, since regulators and media challenge unproven benefits. Subscription programmes drive loyalty, and suppliers with tested sourcing, lot-level certificates and modest claims hold the strongest positions with retailers and health-conscious buyers who read ingredient lists closely. Retailers give greens mixes health aisle placement, though returns and complaints about taste require careful monitoring of each batch.
CAGR 10.2%
Full segment breakdown across 5 segments available in the complete report.

Regional Architecture and Country Demand Map

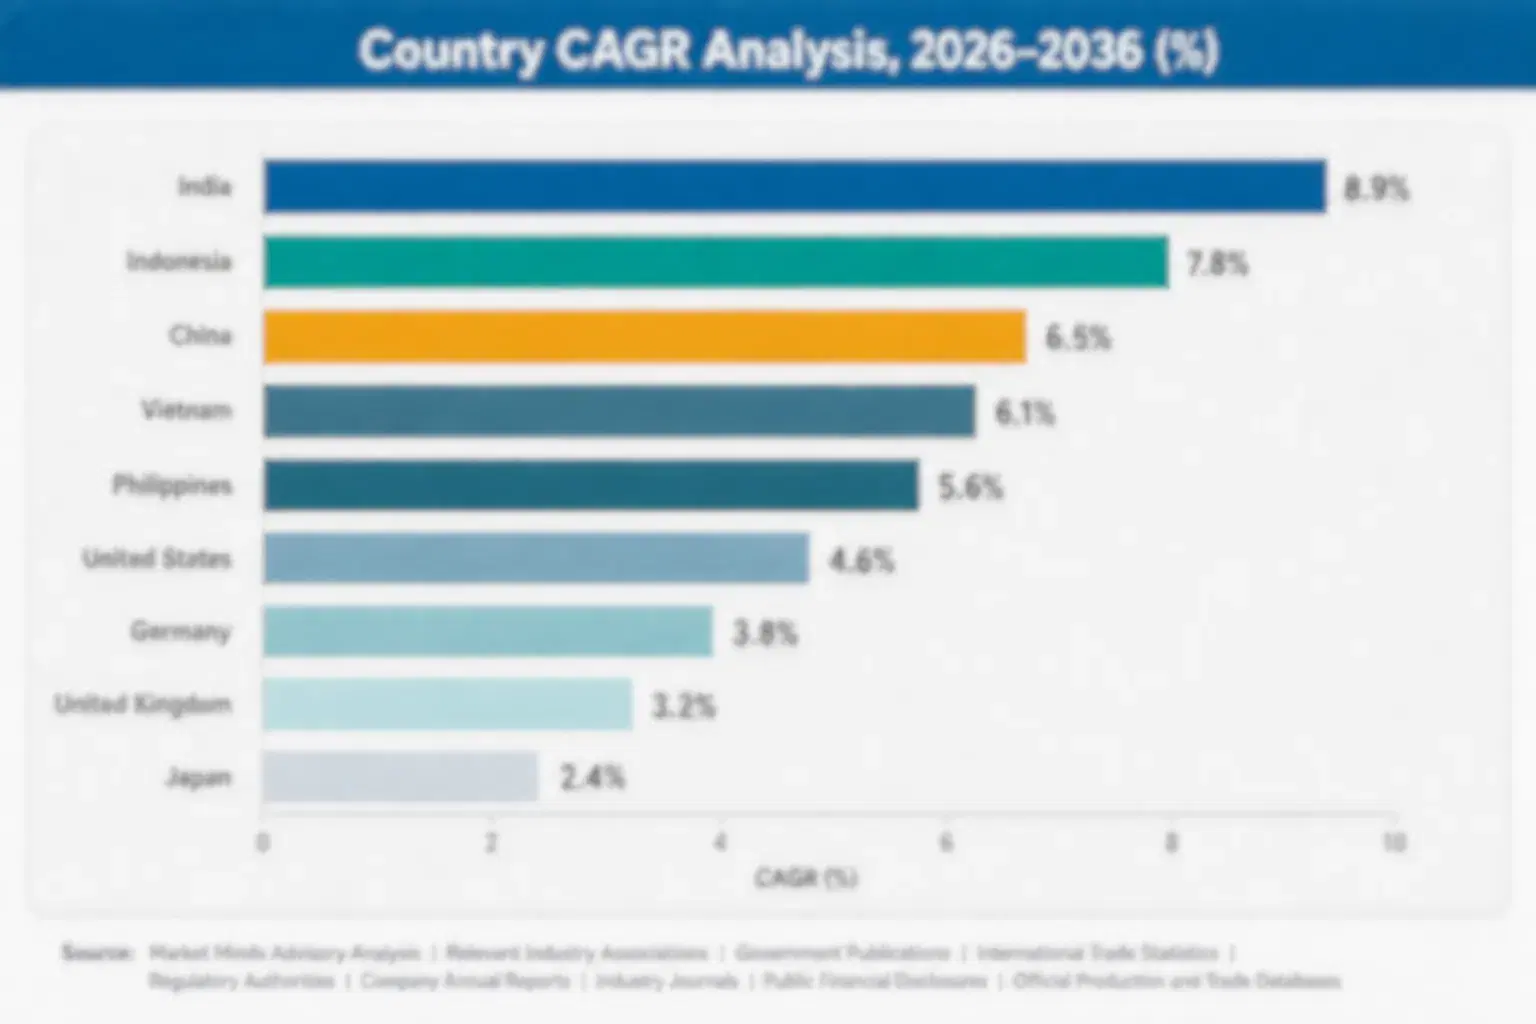
East Asia leads at 30% because Chinese, Japanese and Korean instant beverage habits and dense convenience retail concentrate demand, while North America holds 26% on hydration and greens brands. South Asia and Pacific grows fastest as modern retail expands. Western Europe holds the band floor.

North America

North America holds 26% share, inside its band, with growth at the global rate of 8.5%. Liquid I.V. under Unilever, Nuun under Nestle, Athletic Greens, LMNT and Ultima Replenisher lead hydration and greens, while Kraft Heinz's Crystal Light and Kool-Aid dominate mass flavoured powders. Direct-to-consumer subscriptions carry a large share of sales, and pharmacies, grocery chains and gyms stock sticks and tubs. FDA supplement rules and California heavy metal law shape testing and labelling, and Canada adds smaller volumes. Mexico is counted in Latin America. Retailers review ranges every year, and buyers audit suppliers for allergen controls and lot certificates. Retailers review ranges each year against sell-through and return data.
Share: 26% | CAGR: 8.5% (2026 to 2036)

Western Europe

Western Europe holds 18% share, at the floor of its band, with growth of 7.0%. Because East Asia and North America take the top two slots, no further case is needed for Western Europe. The United Kingdom, Germany, France and the Netherlands lead demand, with Nestle, Unilever, Vega under Danone and direct brands selling sticks through pharmacies and online. EU rules on health claims are strict, and the term electrolyte drink faces limits, so brands rely on ingredient descriptions. Retailers such as Boots, dm and Holland and Barrett expand vegan ranges. Sugar levies and nutrition scores encourage low-sugar mixes, and growth trails the global rate as the base matures. Reviews occur yearly.
Share: 18% | CAGR: 7.0% (2026 to 2036)
Regional intelligence for 5 additional markets available in the complete report: East Asia, South Asia and Pacific, Latin America, Middle East and Africa, Eastern Europe. Contact sales@marketmindsadvisory.com.
vegan-drink-mixes-market-country-cagr-analysis-1789973611606

Four Margin Routes for Vegan Drink Mix Brands

Margin in vegan drink mixes comes from taste quality, subscription loyalty, tested sourcing and format innovation rather than volume alone. The routes below apply to branded makers, private-label suppliers and direct-to-consumer companies, and each can start inside one planning cycle, with clear measures in gross margin points and cost per serve. Payback usually runs two to three years.

Perfecting Sweetener Blends and Solubility for Clean-Tasting Vegan Mixes

Aftertaste and clumping are the main reasons shoppers stop reorders, so brands that blend stevia, monk fruit, erythritol and citrus flavours, and improve milling and agglomeration, lift repeat purchase by 15% to 25% and gross margin by three to five points. Reformulation costs $0.3 million to $1 million per range. Brands should run blind panels against leading mixes, test dissolution in cold water and hard water and share results with retail buyers, since online reviews spread taste complaints quickly and weak flavours lose listings within two ranging reviews. Results guide which flavours to scale first.
Market Impact: better taste lifts repeat purchase by 15-25% overall

Building Subscription Programmes With Flexible Delivery and Bundled Flavours

Repeat purchase drives profit, so brands that offer subscriptions, flavour bundles and easy skip or pause options lift lifetime value by 25% to 40% and cut acquisition cost per customer. Programmes cost $0.3 million to $1.5 million to launch. Brands should start with best-selling flavours, track refill timing at four to six weeks and offer discounts on multipacks, since many subscribers leave within months when taste or price disappoints, and marketplaces punish poor delivery service, which harms rankings and future conversion. Bundled flavour packs help new subscribers find a favourite quickly, which reduces early cancellations noticeably.
Market Impact: subscriptions lift average customer lifetime value by 25-40%

Securing Tested Ingredient Sourcing and Lot-Level Heavy Metal Certificates

Retailers and regulators increasingly demand proof of purity, so brands that source botanicals from audited farms, test each lot for lead, cadmium and arsenic and publish certificates protect listings and avoid recalls that cost $0.5 million to $3 million each. Testing adds 2% to 4% to cost. Brands should qualify two suppliers per key ingredient, pay for third-party laboratory tests and keep claims modest, since a single failed lot can damage trust across the whole range for a year or more and harm subscription retention. Certificates also speed retailer onboarding for new products.
Market Impact: tested sourcing avoids recalls costing $0.5-3 million each

Expanding Retail and Vending Formats for Hydration Sticks

Sticks and travel packs suit gyms, airports and convenience stores, so brands that add shelf-ready displays, multipacks and vending formats win volume worth 10% to 18% of category sales. Programmes cost $1 million to $4 million. Brands should test packs in three retail chains, hold price per serve near $1, and keep supply consistent through summer peaks, since retailers drop products that stock out, and impulse buyers compare price per serve closely against bottled drinks and competing brands at the counter. Shelf-ready displays also reduce store labour and improve visibility at checkout counters.
Market Impact: retail and vending formats win 10-18% of volume

Who Controls the Margin Pool

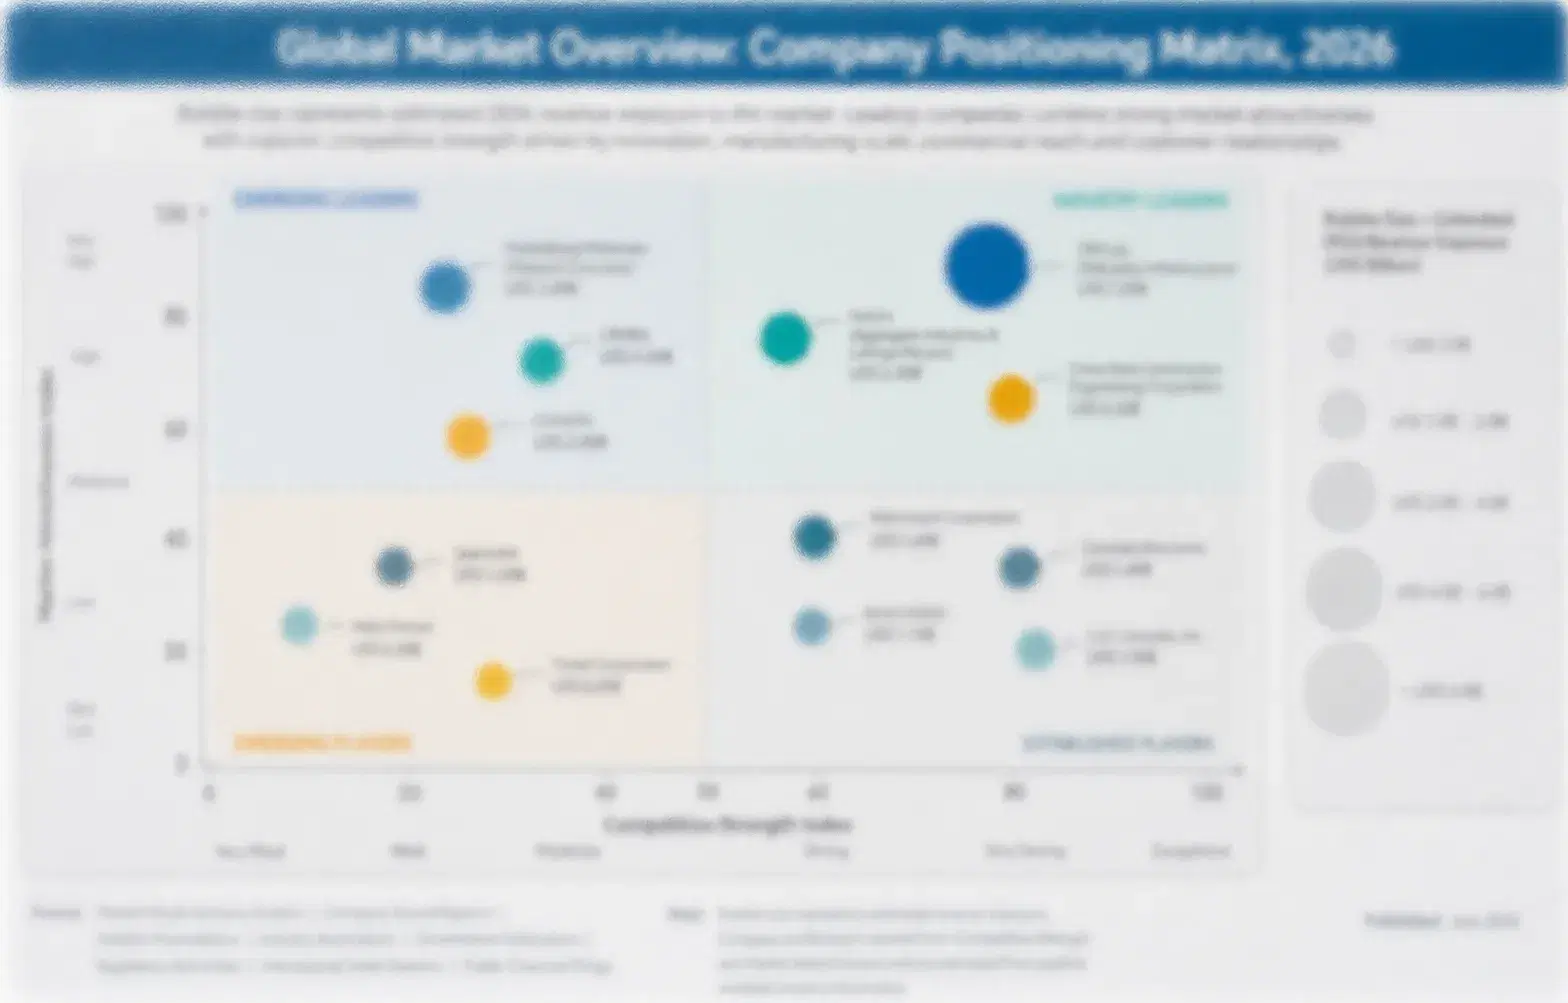
The global vegan drink mix market is moderately fragmented, with a CR5 of 36%, because global food groups, direct-to-consumer brands and private labels all compete in different formats. This assessment measures participants on estimated vegan drink mix sales value, held constant across all players. Unilever and Nestle lead on distribution and brand reach, Athletic Greens, Danone and Kraft Heinz follow, and the gap between the leader and the fifth player is moderate, as private label holds a small but growing share.
Competition runs on four dimensions today: taste and solubility, subscription loyalty, retail distribution and ingredient testing credentials. Large groups win on scale and shelf access, direct brands win on subscriptions and storytelling, and private-label makers win on price. Retailers compare sell-through per shelf metre and return rates, and a failed lot test or misleading claim can remove a brand from shelves within one range review.

Emerging pressure comes from retailer own-label sticks, from sports drink groups launching powders and from social media brands that scale quickly on subscription models. Rankings shift where a brand wins a national chain, fails a heavy metal test or exits a weak flavour line, and consolidation continues as large groups buy direct brands.
vegan-drink-mixes-market-company-positioning-matrix-1789973611871

Competitive Moat and Risk Dimensions

UNILEVER

Moat: Liquid I.V. Brand and Reach

Unilever, the British-Dutch consumer goods group, owns Liquid I.V., a leading hydration mix brand, and combines it with global distribution, marketing and sourcing scale. Liquid I.V. has strong retail presence across pharmacies, grocery and online channels, and Unilever's resources support flavour development, sweetener sourcing and geographic expansion into Europe and Asia.
UNILEVER

Risk: Portfolio Fit and Integration

Unilever manages a broad portfolio and is reshaping its business, so a fast-growing niche brand must compete for investment and management attention. Founder-led brands can lose momentum after acquisition, and private-label sticks and new direct brands target the same shoppers with lower prices. Investors expect steady growth.
NESTLE

Moat: Nuun Brand and Beverage Expertise

Nestle sells Nuun hydration tablets and other drink mix brands, and brings decades of expertise in powdered beverages, sweetener technology and global distribution through Nesquik, Milo and instant coffee. Its research base, supply chain scale and retail relationships support rollout of vegan variants and entry into new regions such as Asia.
NESTLE

Risk: Brand Focus and Claim Scrutiny

Nestle reviews underperforming brands and shifts capital toward higher-margin categories, so a niche tablet brand may lose priority. Sweetener and sugar debates affect its powdered drinks, and direct brands with stronger community followings can win subscription loyalty faster. Investors expect steady progress on new category launches.

Players Tracked

Prominent Players

Unilever
Nestle
Athletic Greens
Danone
Kraft Heinz

Other Key Players

PepsiCo
The Coca-Cola Company
Herbalife
Orgain
Garden of Life
Bloom Nutrition
LMNT
Ultima Replenisher
Hydrant
Ovaltine
Ito En
Meiji
Amway
Zipfizz
Nutrilite

Recent Developments

JANUARY 2026

Liquid I.V. Expands Hydration Stick Distribution Across European Pharmacy and Grocery Channels

Liquid I.V. expanded hydration stick distribution across European pharmacy and grocery channels, according to company communications. It is a distribution expansion, not an acquisition, and it tests demand outside North America. The expansion covers selected flavours. Sales terms were not disclosed. Rollout timing remains open.
Signal: Confirms leading hydration brands are scaling internationally because electrolyte demand is spreading beyond sports users into everyday shoppers.
FEBRUARY 2026

Athletic Greens Reformulates Greens Powder With Third-Party Tested Ingredients and Updated Claims Language

Athletic Greens reformulated its greens powder with third-party tested ingredients and updated claims language, according to company communications. It is a product update, not an acquisition, and it tests shopper response to stricter claims. The update covers sourcing and labels. Sales terms were not disclosed.
Signal: Shows greens leaders are responding to claim scrutiny because retailers and regulators now demand testing evidence and modest wording.
MARCH 2026

Kraft Heinz Launches Low-Sugar Powdered Drink Mix Range With Plant-Based Colours for Mass Retail

Kraft Heinz launched a low-sugar powdered drink mix range with plant-based colours for mass retail, according to company communications. It is a product launch, not an acquisition, and it tests mass market demand. The range covers fruit flavours. Sales terms were not disclosed. Timing remains open.
Signal: Indicates mass powder brands are removing animal-derived colours because vegan and clean-label positioning now reaches mainstream shoppers.

Electrolytes, Extracts and Packaging Costs

Powders, electrolyte salts, sweeteners and plant extracts account for roughly 41% of production cost with stick and sachet packaging included, flavours and colours about 8%, filling and blending labour about 14%, freight and warehousing about 12%, and marketing and overheads about 25%. Salts come from chemical producers in Europe and Asia, sweeteners from China and the United States, botanicals from India and China, and packaging films from Asian converters.
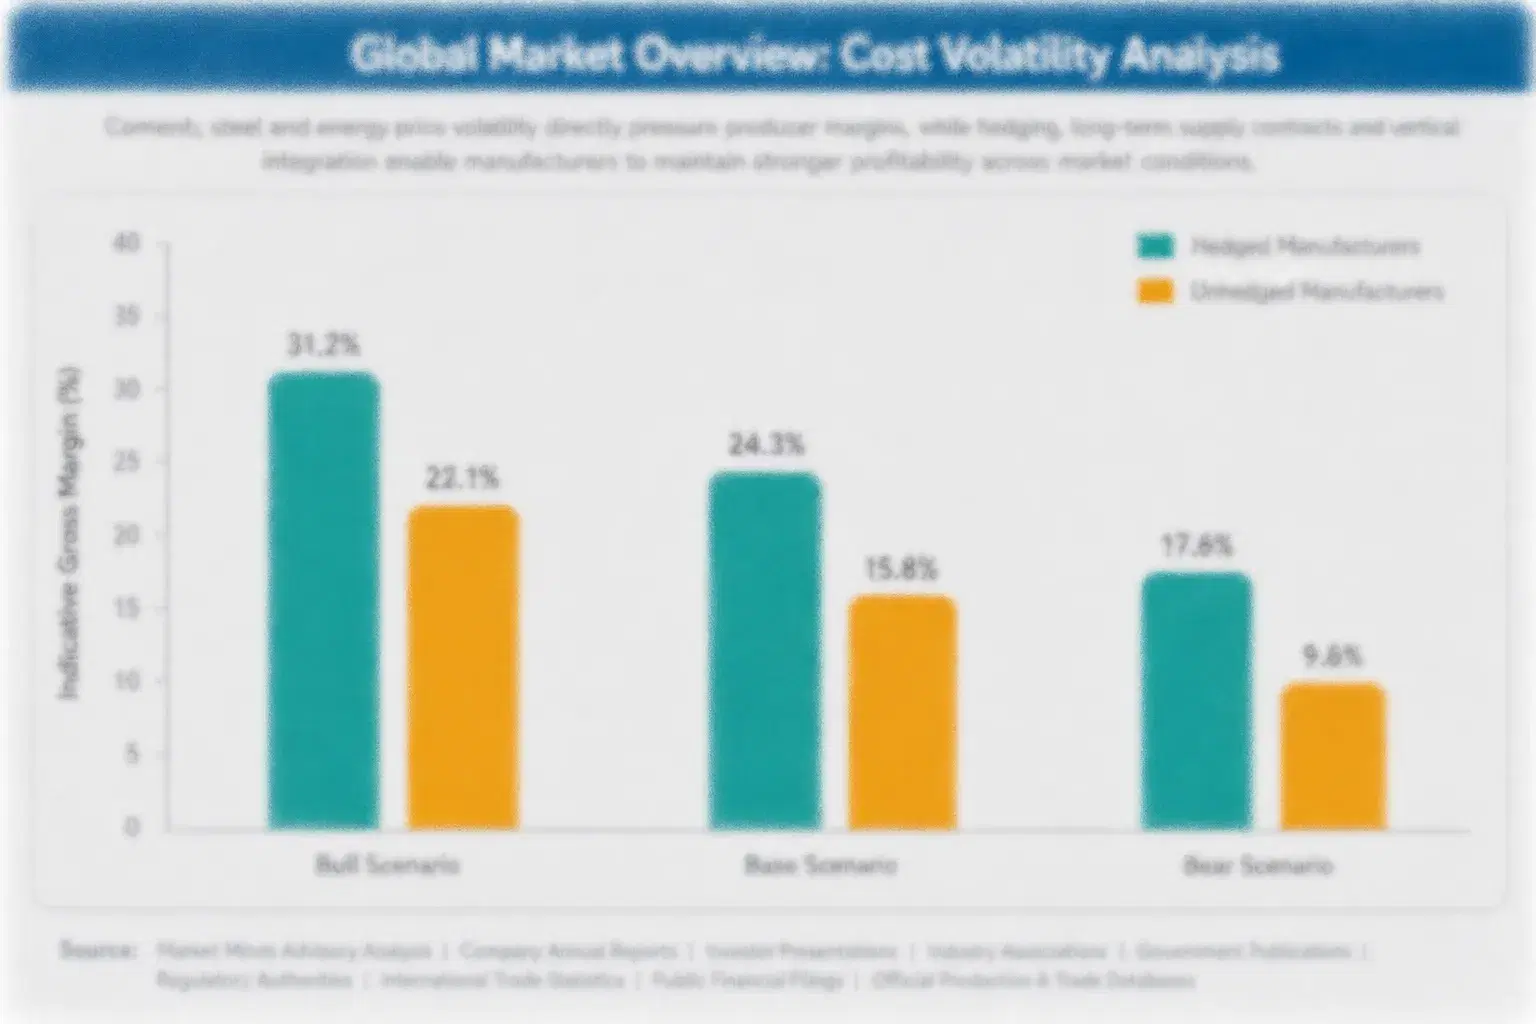
The clearest recent shock came in 2022. FAO Food Price Index data show sugar and vegetable oil prices at multi-year highs, while EIA data show industrial power costs surging in Europe and Asia, and container freight rates rose several times. Drink mix makers absorbed part of the increase because retailer contracts repriced only at annual resets, and film and aluminium laminate costs added further pressure, which compressed margins in stick formats.

The disadvantage falls on small brands without supplier contracts or scale, because they cannot pass through swings on annual retail terms and buy in small lots. Exposure varies by player type: large groups hedge and hold multi-origin supply, direct brands can adjust prices on subscriptions with a lag, and private-label makers face tight tender prices with little pricing power.
vegan-drink-mixes-market-cost-volatility-analysis-1789973612155

Multi-Year Ingredient and Packaging Contracts

Brands sign multi-year contracts for electrolyte salts, sweeteners and stick film, often with price collars linked to indices, to cut exposure to spikes of 15% to 30%. The main challenge is volume commitment when demand shifts, so brands negotiate flexible ranges and review terms each year. Supplier audits repeat every year. Contract reviews occur yearly.

Dual Sourcing of Botanicals and Sweeteners

Brands qualify two suppliers for each botanical and sweetener, including different origins, to cut exposure to shortages and price spikes of 20% to 40%. The main challenge is duplicate testing and audits, so brands stage qualification across products and share results with certifiers. Reviews occur every year and lot tests confirm purity. Audits repeat each year.

Subscription Pricing and Retailer Pass-Through

Brands use subscription pricing and periodic price reviews to recover 50% to 70% of cost increases from loyal customers, and retailer contracts add formulas linked to ingredient and freight indices. The main challenge is price sensitivity in mass channels, so brands protect entry lines and adjust premium ranges. Reviews occur every half year. Pricing updates follow.

Portfolio Architecture for Margin Defence

Margins run from moderate returns on mass flavoured powders sold at retailer prices to strong returns on hydration sticks and greens sold with subscription support. Three tiers separate volume products, premium certified lines and next-generation solutions, and each draws on different flavour technology, sourcing quality and channel relationships in a market where direct brands hold pricing power. Margin gaps between tiers run to 14 points.
The tension between volume and premium is sharp. Mass flavoured powders and private-label sticks fill supermarket orders at low prices and face constant promotional pressure, while premium hydration and greens mixes earn higher margins on smaller volumes and depend on taste, brand trust and tested sourcing. Brands that run only volume suffer when private label undercuts them, while premium-only brands struggle to build scale outside subscriptions.

High-value pools concentrate in electrolyte sticks for daily hydration and in greens mixes for health-focused subscribers. They gather where buyers pay for taste, convenience and trust, not for vegan labels alone. Travel packs and vending formats add a growing pool, and strong brands hold more than one, though each needs different flavours, packaging and channel skills.

Volume / Commodity-Adjacent

Mass flavoured powders and private-label sticks sold on price per serve to supermarkets, discount chains and wholesalers. Buyers focus on cost and promotions, contracts follow annual retailer tenders, and technical differentiation is limited by shared flavour and packaging suppliers.
Gross Margin: 30%-40%

Premium / Certified

Branded hydration and energy sticks with vegan certification, clean labels and clear sodium information, sold through pharmacies, grocery and online channels. Buyers value taste, convenience and brand trust, and listings run for one to two years with regular range reviews.
Gross Margin: 38%-50%

Sustainability / Regulatory / Next-Generation

Greens, functional and subscription mixes with lot-level testing, verified sourcing and recyclable packaging, sold to health-focused shoppers and leading retailers. Contracts depend on taste, testing evidence and consistent delivery performance.
Gross Margin: 42%-54%
vegan-drink-mixes-market-portfolio-architecture-1789973612435

High-value Sub-segments and Strategic Watch-out

Electrolyte and Hydration Mixes

Electrolyte and hydration mixes combine the fastest growth with strong pricing, since shoppers accept gross margins of 34% to 52% for convenience and low sugar. Flavour houses, subscription bases and retail distribution form the entry barrier, and brands with reliable taste hold the strongest positions.
Gross Margin: 34%-52%

Greens and Superfood Drink Mixes

Greens and superfood mixes deliver strong growth with premium pricing, since shoppers accept gross margins of 36% to 54% for perceived nutrition and convenience. Tested sourcing, modest claims and subscription loyalty limit competition, though regulators challenge unproven benefits. Reviews occur each year. Prices stay firm.
Gross Margin: 36%-54%

Energy and Focus Drink Mixes

Energy and focus mixes are a large volume pool, with value growing about 9.0% a year. Caffeine sources, sweetener taste and flavour range decide profit, and large groups and direct brands hold most volume. Customers renew listings yearly at prices linked to competing energy drinks and coffee products.
Gross Margin: 32%-46%

Flavoured Fruit and Squash-Style Powders

Flavoured fruit powders are the strategic watch-out, since growth of about 6.0% a year trails the market, price competition from private label is intense and sugar criticism limits premium positioning. Brands should manage the line selectively and steer investment toward hydration and greens mixes with clearer buyers.
Gross Margin: 26%-38%

Why Shoppers Reorder Drink Mixes

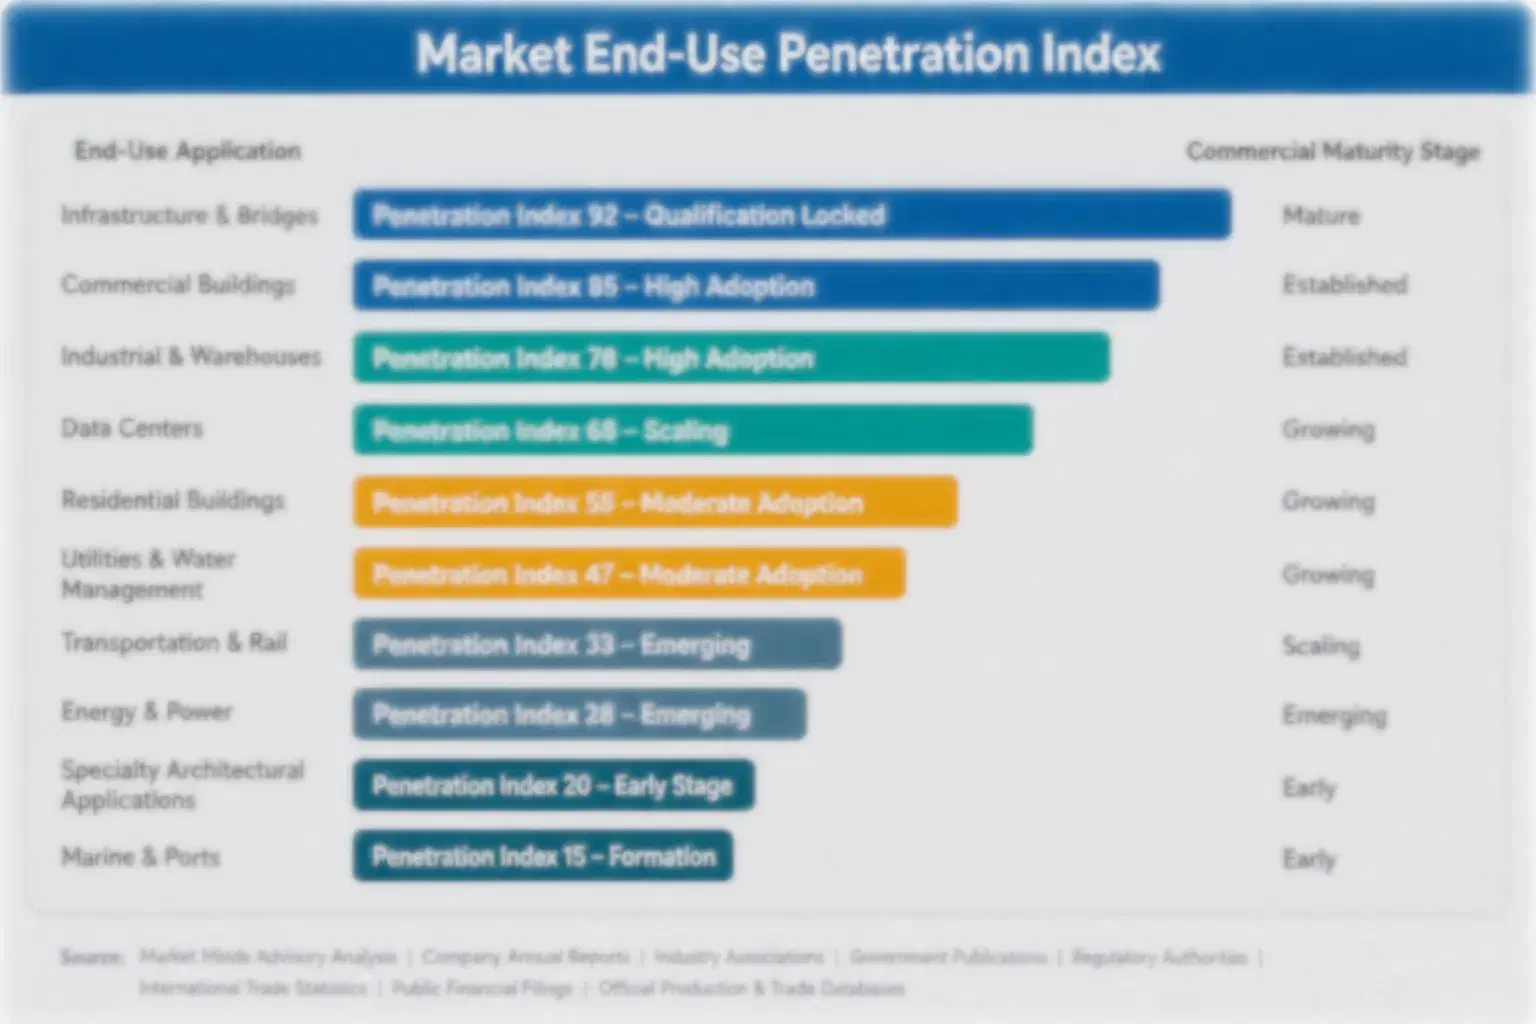
Vegan drink mix demand behaves like an annuity attached to daily routines, gym bags and subscription boxes. Once a shopper finds a flavour that dissolves cleanly and tastes good, refills follow every four to six weeks, and switching means testing another flavour and risking disappointment. Retailers set annual range plans around sell-through per shelf metre, so brands with steady velocity earn priority space. Trust, once earned, takes years to lose.
Adoption stickiness differs by end-use vertical. Subscription customers and athletes are the deepest, since they build the product into daily hydration or nutrition routines and value consistency. Grocery and convenience buyers are moderately sticky, driven by price, promotion and flavour. Impulse and travel buyers are more fluid, changing brands when a new flavour or discount appears, though products with reliable taste hold repeat purchase for several years.

Buyer profiles are shifting between generations. Older buyers bought powdered drinks on brand and price, while younger buyers ask about sweeteners, sodium, ingredient lists, heavy metal tests and carbon footprint. Retailers and regulators add a third group that sets claim and labelling expectations. Brands that publish tests and clean labels win newer buyers.
vegan-drink-mixes-market-end-use-penetration-index-1789973612705

MMA Verdict on Drink Mix Strategy

These are among the four positions where our research anticipates prominent divergence between winners and laggards over the coming forecast period. Each is grounded in the demand model, the regulatory perimeter, and the announced capacity pipeline.
01 / TASTE AND SOLUBILITY MASTERY

Perfect Sweetener Blends and Solubility Before Aftertaste Complaints Erode Repeat Purchase

Electrolyte and Hydration Mixes grow at 11.9% a year, about 1.40 times the overall market rate, but taste decides reorders. Brands should invest $0.3 million to $1 million per range, blend sweeteners with flavour masking and improve milling and agglomeration, lifting repeat purchase by 15% to 25%. Those that delay will lose listings and subscribers over the next two years, while early movers hold repeat purchase, stronger margins and lasting shelf space across every range review and annual retailer tender.
02 / SUBSCRIPTION LOYALTY STRATEGY

Build Flexible Subscription Programmes Before Acquisition Costs Consume Direct Brand Profit

Repeat purchase drives profit, and subscriptions with skip and pause options lift lifetime value by 25% to 40% while cutting acquisition cost per customer. Brands should invest $0.3 million to $1.5 million per programme, start with best-selling flavours and track refill timing weekly. Those that delay will pay rising advertising costs over the next two years, while early movers hold loyal long-term subscribers, stable revenue and stronger and lasting unit economics across every marketing cycle, delivery review, audit and annual planning round.
03 / INGREDIENT TESTING STRATEGY

Secure Tested Sourcing and Lot Certificates Before Heavy Metal Failures Trigger Recalls

Regulators and retailers demand clear purity proof, and lot-level tests avoid recalls costing $0.5 million to $3 million each. Brands should qualify two suppliers per botanical and origin, fund third-party laboratory tests, which add 2% to 4% to cost, and keep claims modest and evidence-based. Those that delay will risk recalls and delistings over the next two years, while early movers hold lasting credibility, retailer trust and stable subscriptions across every audit, claim review, lot release and annual supplier assessment cycle.
04 / RETAIL FORMAT EXPANSION

Expand Sticks and Travel Packs in Retail Before Rivals Take Impulse Space

Sticks and travel packs suit gyms, airports and convenience stores, and shelf-ready formats win volume worth 10% to 18% of category sales. Brands should invest $1 million to $4 million per programme, test packs in three chains and hold price per serve near $1. Those that delay will lose impulse space over the next two years, while early movers hold retailer relationships, steady repeat volume and stronger and lasting brand recognition across every shelf reset, summer peak, audit and annual contract review.

Engagement Snapshot From the Field

A live engagement with an industry participant carrying material or product regulatory and market exposure ahead of a defining policy shift, showing how our research translates into a defensible multi-year portfolio strategy.
MARKET MINDS ADVISORY · CLIENT ENGAGEMENT SUMMARY
Vegan Drink Mixes Producer Strategic Portfolio Review and Transition Roadmap 2026·Investment Scenario on Vegan Drink Mixes Exposure Evaluation 2025-26
CLIENT PROFILE
The client is a mid-sized European beverage powder manufacturer with annual sales near $260 million (client-reported, unverified by MMA), producing instant tea, cocoa and fruit drink powders for supermarket private label and branded ranges. About 4% of sales came from electrolyte sticks, retailers had asked for vegan-certified sticks with lot testing, and management wanted a plan to grow hydration without harming core powder margins.
STRATEGIC CHALLENGE
Electrolyte stick margins sat near 26% (client-reported, unverified by MMA), a first stevia formula drew complaints about aftertaste and a heavy metal test had failed one botanical lot. Management had to decide whether to reformulate, build a subscription channel or partner with a direct brand, with limited capital and two plants. Key retailers wanted certified samples within nine months.
MMA APPROACH
MMA analysed sales, cost and complaint data across 32 products, interviewed 12 retail buyers, flavour scientists and direct brand managers, and ran a shopper survey on taste, sweeteners and price across three countries. It modelled margin by format and channel, compared reformulation, subscription and partnership options by payback and execution risk, and tested each against ingredient and freight price scenarios.
KEY FINDINGS
  1. A blended stevia and monk fruit formula with better milling would lift taste scores by about 22% and reduce complaints by about half (client-reported, unverified by MMA).
  2. Lot-level testing and two-supplier sourcing would cost about $0.8 million a year and avoid recall risk worth about $2 million (client-reported, unverified by MMA).
  3. A subscription channel would cost about $1.1 million to launch and reach lifetime value about 30% above retail customers (client-reported, unverified by MMA).
  4. A partnership with a direct brand would cost about $1.5 million and open online sales worth about 10% of stick revenue (client-reported, unverified by MMA).
CLIENT PROFILE
The client is a mid-sized European beverage powder manufacturer with annual sales near $260 million (client-reported, unverified by MMA), producing instant tea, cocoa and fruit drink powders for supermarket private label and branded ranges. About 4% of sales came from electrolyte sticks, retailers had asked for vegan-certified sticks with lot testing, and management wanted a plan to grow hydration without harming core powder margins.
STRATEGIC CHALLENGE
Electrolyte stick margins sat near 26% (client-reported, unverified by MMA), a first stevia formula drew complaints about aftertaste and a heavy metal test had failed one botanical lot. Management had to decide whether to reformulate, build a subscription channel or partner with a direct brand, with limited capital and two plants. Key retailers wanted certified samples within nine months.
MMA APPROACH
MMA analysed sales, cost and complaint data across 32 products, interviewed 12 retail buyers, flavour scientists and direct brand managers, and ran a shopper survey on taste, sweeteners and price across three countries. It modelled margin by format and channel, compared reformulation, subscription and partnership options by payback and execution risk, and tested each against ingredient and freight price scenarios.
KEY FINDINGS
  1. A blended stevia and monk fruit formula with better milling would lift taste scores by about 22% and reduce complaints by about half (client-reported, unverified by MMA).
  2. Lot-level testing and two-supplier sourcing would cost about $0.8 million a year and avoid recall risk worth about $2 million (client-reported, unverified by MMA).
  3. A subscription channel would cost about $1.1 million to launch and reach lifetime value about 30% above retail customers (client-reported, unverified by MMA).
  4. A partnership with a direct brand would cost about $1.5 million and open online sales worth about 10% of stick revenue (client-reported, unverified by MMA).
RECOMMENDED STRATEGY
Phase 1: Phase 1 (Months 1-9): Reformulate the sweetener blend, improve milling and start lot-level testing with two qualified botanical suppliers and retailers. Phase 2: Phase 2 (Months 10-24): Launch the vegan-certified stick range in retail, open a subscription channel and pilot a partnership with one direct brand. Phase 3: Phase 3 (Months 25-42): Extend the range to greens and energy mixes, review ingredient and packaging contracts yearly and add travel packs for vending.
OUTCOME
Within 42 months, electrolyte and greens sticks reached 13% of sales, margins rose by about seven points and two retailers listed the range nationally (client-reported, unverified by MMA). Taste complaints fell by about half, all lots passed heavy metal tests, and subscribers reached about 8% of stick revenue.

Frequently Asked Questions

Foundational context covering the market sizes, CAGR, scope, country, region and competition that inform every finding below. This section is provided to cover basics and most often pre-purchase conversations, answered from the MMA Primary Research Dataset.

What is the current size of the Vegan Drink Mixes Market?

The global vegan drink mix market was valued at $3.40 billion in 2025 on a retail and online sales basis. Growth reflects sugar reduction and hydration awareness, offset by taste challenges and claim scrutiny.

How large will the Vegan Drink Mixes Market be by 2036?

The market is projected to reach $8.34 billion by 2036, up from $3.69 billion in 2026. The increase of $4.65 billion reflects hydration mixes, subscriptions and Asian growth.

What is the CAGR for the Vegan Drink Mixes Market 2026 to 2036?

The market is forecast to grow at an 8.5% CAGR from 2026 to 2036. The bull case reaches 9.8% and the bear case 7.2%, depending on taste progress, sweetener costs and regulatory scrutiny.

Which segment is growing fastest?

Electrolyte and Hydration Mixes is the fastest-growing segment at 11.9% CAGR, roughly 1.40 times the overall market rate. Greens and Superfood Drink Mixes follows at 10.2% CAGR each year.

Who are the major companies in the Vegan Drink Mixes Market?

Major companies include Unilever, Nestle, Athletic Greens, Danone and Kraft Heinz. PepsiCo, The Coca-Cola Company, Herbalife, Orgain and Ito En also hold meaningful positions in specific channels.

Which country is growing fastest?

China is growing fastest at about 10.8% CAGR, because instant beverage habits, convenience retail and e-commerce expand together. India and South Korea follow as hydration awareness spreads.

Report Segmentation Architecture

The full report scope spans multiple orthogonal segmentation dimensions, with cross-tabulated demand data provided for each dimension pair. Coverage extends further to regional breakdowns, trend trajectories, and the competitive detail needed to support segment-level decision-making.

By Primary Market Dimension

  • Electrolyte and Hydration Mixes
  • Greens and Superfood Drink Mixes
  • Energy and Focus Drink Mixes
  • Instant Plant-Milk and Latte Powders
  • Flavoured Fruit and Squash-Style Powders

By End-Use Industry

  • Sports and Fitness
  • Everyday Wellness
  • Travel and Convenience
  • Foodservice and Vending

By Commercial Dimension

  • Direct-to-Consumer Subscriptions
  • Mass Retail and Grocery
  • Pharmacy and Specialty Retail
  • Retailer Own-Label Supply
  • Online Marketplaces

By Region

  • North America
  • Western Europe
  • East Asia
  • South Asia and Pacific
  • Latin America
  • Middle East and Africa
  • Eastern Europe

Scope, Methodology, and Coverage

Every figure in this report is reproducible from documented input assumptions. The scope below maps the historical period, the forecast horizon, the segmentation dimensions, and the countries covered, alongside the underlying primary and qualitative methodology.
Historical Period
2020 to 2025
Forecast Period
2026 to 2036
Base Year
2025 (USD billions; MMA Primary Research Dataset, September 2026)
Market Definition
The market covers global sales of powdered, tablet and stick-pack drink mixes made without animal-derived ingredients, including electrolyte and hydration mixes, greens and superfood mixes, energy and focus mixes, instant plant-milk and latte powders and flavoured fruit powders, sold through retail, online and foodservice channels. It excludes vegan protein powders sold mainly as protein supplements, ready-to-drink beverages, liquid concentrates and squashes, and dairy-based drink mixes.
Quantitative Units
USD billions (retail and online sales revenue); servings and sticks for volume references
Segmentation Dimensions
By Product Type; By End-Use Channel; By Commercial Dimension; By Region
Regions Covered
North America, Western Europe, East Asia, South Asia and Pacific, Latin America, Middle East and Africa, Eastern Europe
Countries Covered
United States, Canada, Mexico, United Kingdom, Germany, France, Netherlands, Poland, Japan, China, South Korea, India, Australia, Singapore, Brazil, Argentina, United Arab Emirates, Turkey, South Africa, Egypt, and additional markets relevant to this sector
Key Companies Profiled
Unilever, Nestle, Athletic Greens, Danone, Kraft Heinz, PepsiCo, The Coca-Cola Company, Herbalife, Orgain, Garden of Life, Bloom Nutrition, LMNT, Ultima Replenisher, Hydrant, Ovaltine, Ito En, Meiji, Amway, Zipfizz, Nutrilite
Quantitative Methodology
Primary survey, n=3,800 respondents, Q4 2025, six countries; demand-side model with trade association cross-validation
Qualitative Methodology
47 expert interviews, Q4 2025; applied to validate demand model assumptions, identify emerging dynamics, and assess competitive positioning
Report Format
PDF and XLSX data workbook (Word format preview document)
Publisher
Market Minds Advisory
Report Code
MMA-2026-AGR-208
Published
September 2026
Contact
sales@marketmindsadvisory.com | www.marketmindsadvisory.com

Purchase the full Vegan Drink Mixes Market Report (2026 to 2036).

The full report delivers a detailed assessment of the vegan drink mix market through 2036, covering product type, channel and regional forecasts, competitive benchmarking of leading beverage groups, direct-to-consumer brands and private-label suppliers, and input cost analysis. It combines MMA primary research, including a six-country survey of 3,800 respondents and 47 expert interviews, with public statistical and company data. Analysts also model sweetener price paths, subscription adoption and claim regulation scenarios. Clients receive product margin ranges, channel maps and a case study on growth strategy. Retailer programme and contract frameworks are also included.
Ten-year product type and channel demand forecasts
Electrolyte, sweetener, and packaging cost tracking
Competitive benchmarking of leading drink mix brands
Vegan certification and claim rule tracker
Regional market comparative analysis and forecasts included
Quarterly primary survey data update access

Built For The People Who Decide

From boardroom strategy to bench-side execution, this report is read cover-to-cover by leaders shaping the next decade of their industry, turning demand scenarios, market dynamics and valuation benchmarks into decisions.
CXOs/ Presidents/ VPs/ Managers
M&A and Corporate Development
Strategy Teams and R&D Heads
Procurement and Product Directors
Regulatory and Compliance Leaders
Investor Relations and Equity Analysts