Market Minds Advisory
Value-Based Healthcare Services Market

Value-Based Healthcare Services Market: Renting Risk Capability to Providers, and the Benchmark That Prices It

Roughly 63% of enablement revenue depends on shared savings a regulator can reprice by rewriting a benchmark formula, which makes this an industry whose economics sit outside its own control entirely.

Lead Analyst

Alice Ballenger

Published

September 2026

Make Smarter Decisions with Customized Research Insights

Request a free sample report and evaluate market opportunities, growth trends, and competitive dynamics relevant to your business needs.

2025 MARKET VALUE$14.6BMarket Size 2025
2036 FORECAST VALUE$46.9BBase Case , 2026 to 2036
CAGR 2026 TO 203611.2 %Bull 12.4% / Bear 10.0%
INCREMENTAL OPPORTUNITY$30.7BNet 10- year value creation
EXPANSION MULTIPLE2.89x2036 value over 2026 base
Strategic Levers
M&A Pipeline
Regional Outlook
Country Rankings
Competitive Intelligence
Segmental Deep-dive
Call-Us : 91 93563 13602

Executive Snapshot and Market Trajectory

Value-based care has been about to happen for fifteen years, and the services industry has been paid throughout regardless. Incentive design was never the hard part. A primary care practice cannot take downside risk without capital, actuarial capability and data it does not have. That gap is the entire business.
So an industry grew up renting those things to practices. Provider enablement and risk bearing management is the fastest growing segment at 16.8%, half again the market rate of 11.2%, and the model is simple: carry the risk, employ the analysts, take a share of the savings. Risk adjustment and quality reporting services follow at 13.4% on the compliance obligations that come with every arrangement. Both segments sell the same thing underneath.
The market is fragmented, with the top five holding 28% of contracted revenue. What binds it together is a single vulnerability: roughly 63% of enablement revenue is contingent on shared savings, and a regulator can reprice all of it by adjusting a benchmark formula. Several enablement companies discovered that when benchmarks tightened, and the sector has not entirely recovered from what it learned then.
Market Definition
Services that enable, administer or deliver value-based healthcare arrangements, covering provider enablement and risk bearing management, population health and care management, risk adjustment and quality reporting, episode and bundled payment administration, value-based contracting advisory and actuarial services, and utilisation and network performance management. Measured at contracted service revenue. Health insurance underwriting, direct clinical care delivery, electronic health record software licensing and pharmacy benefit management are excluded.
Base Year Value
$14.6B in 2025 (MMA Primary Research Dataset, August 2026)
Forecast Period
2026 to 2036, eleven discrete annual values
CAGR
11.2% base case. Bull 12.4%. Bear 10.0%.
Fastest Growth Segment
Provider Enablement and Risk Bearing Management: 16.8% CAGR
Fastest Growth Country
Saudi Arabia: 18.6% CAGR
Fastest Growth Region
South Asia and Pacific: 13.4% CAGR
Largest Region
North America: 44% of 2025 global value
Market Leaders
Optum, Evolent Health, agilon health, Privia Health, Cotiviti. Source: MMA Primary Research Dataset, July 2026.
Primary Survey
n=3,800 procurement and R&D decision-makers, Q4 2025, six countries
Methodology
Demand-side build-up, cross-validated against public data, 47 expert interviews

Value-Based Healthcare Services Market Forecast Scenarios

value-based-healthcare-services-market-size-forecast-scenario-1787641267849
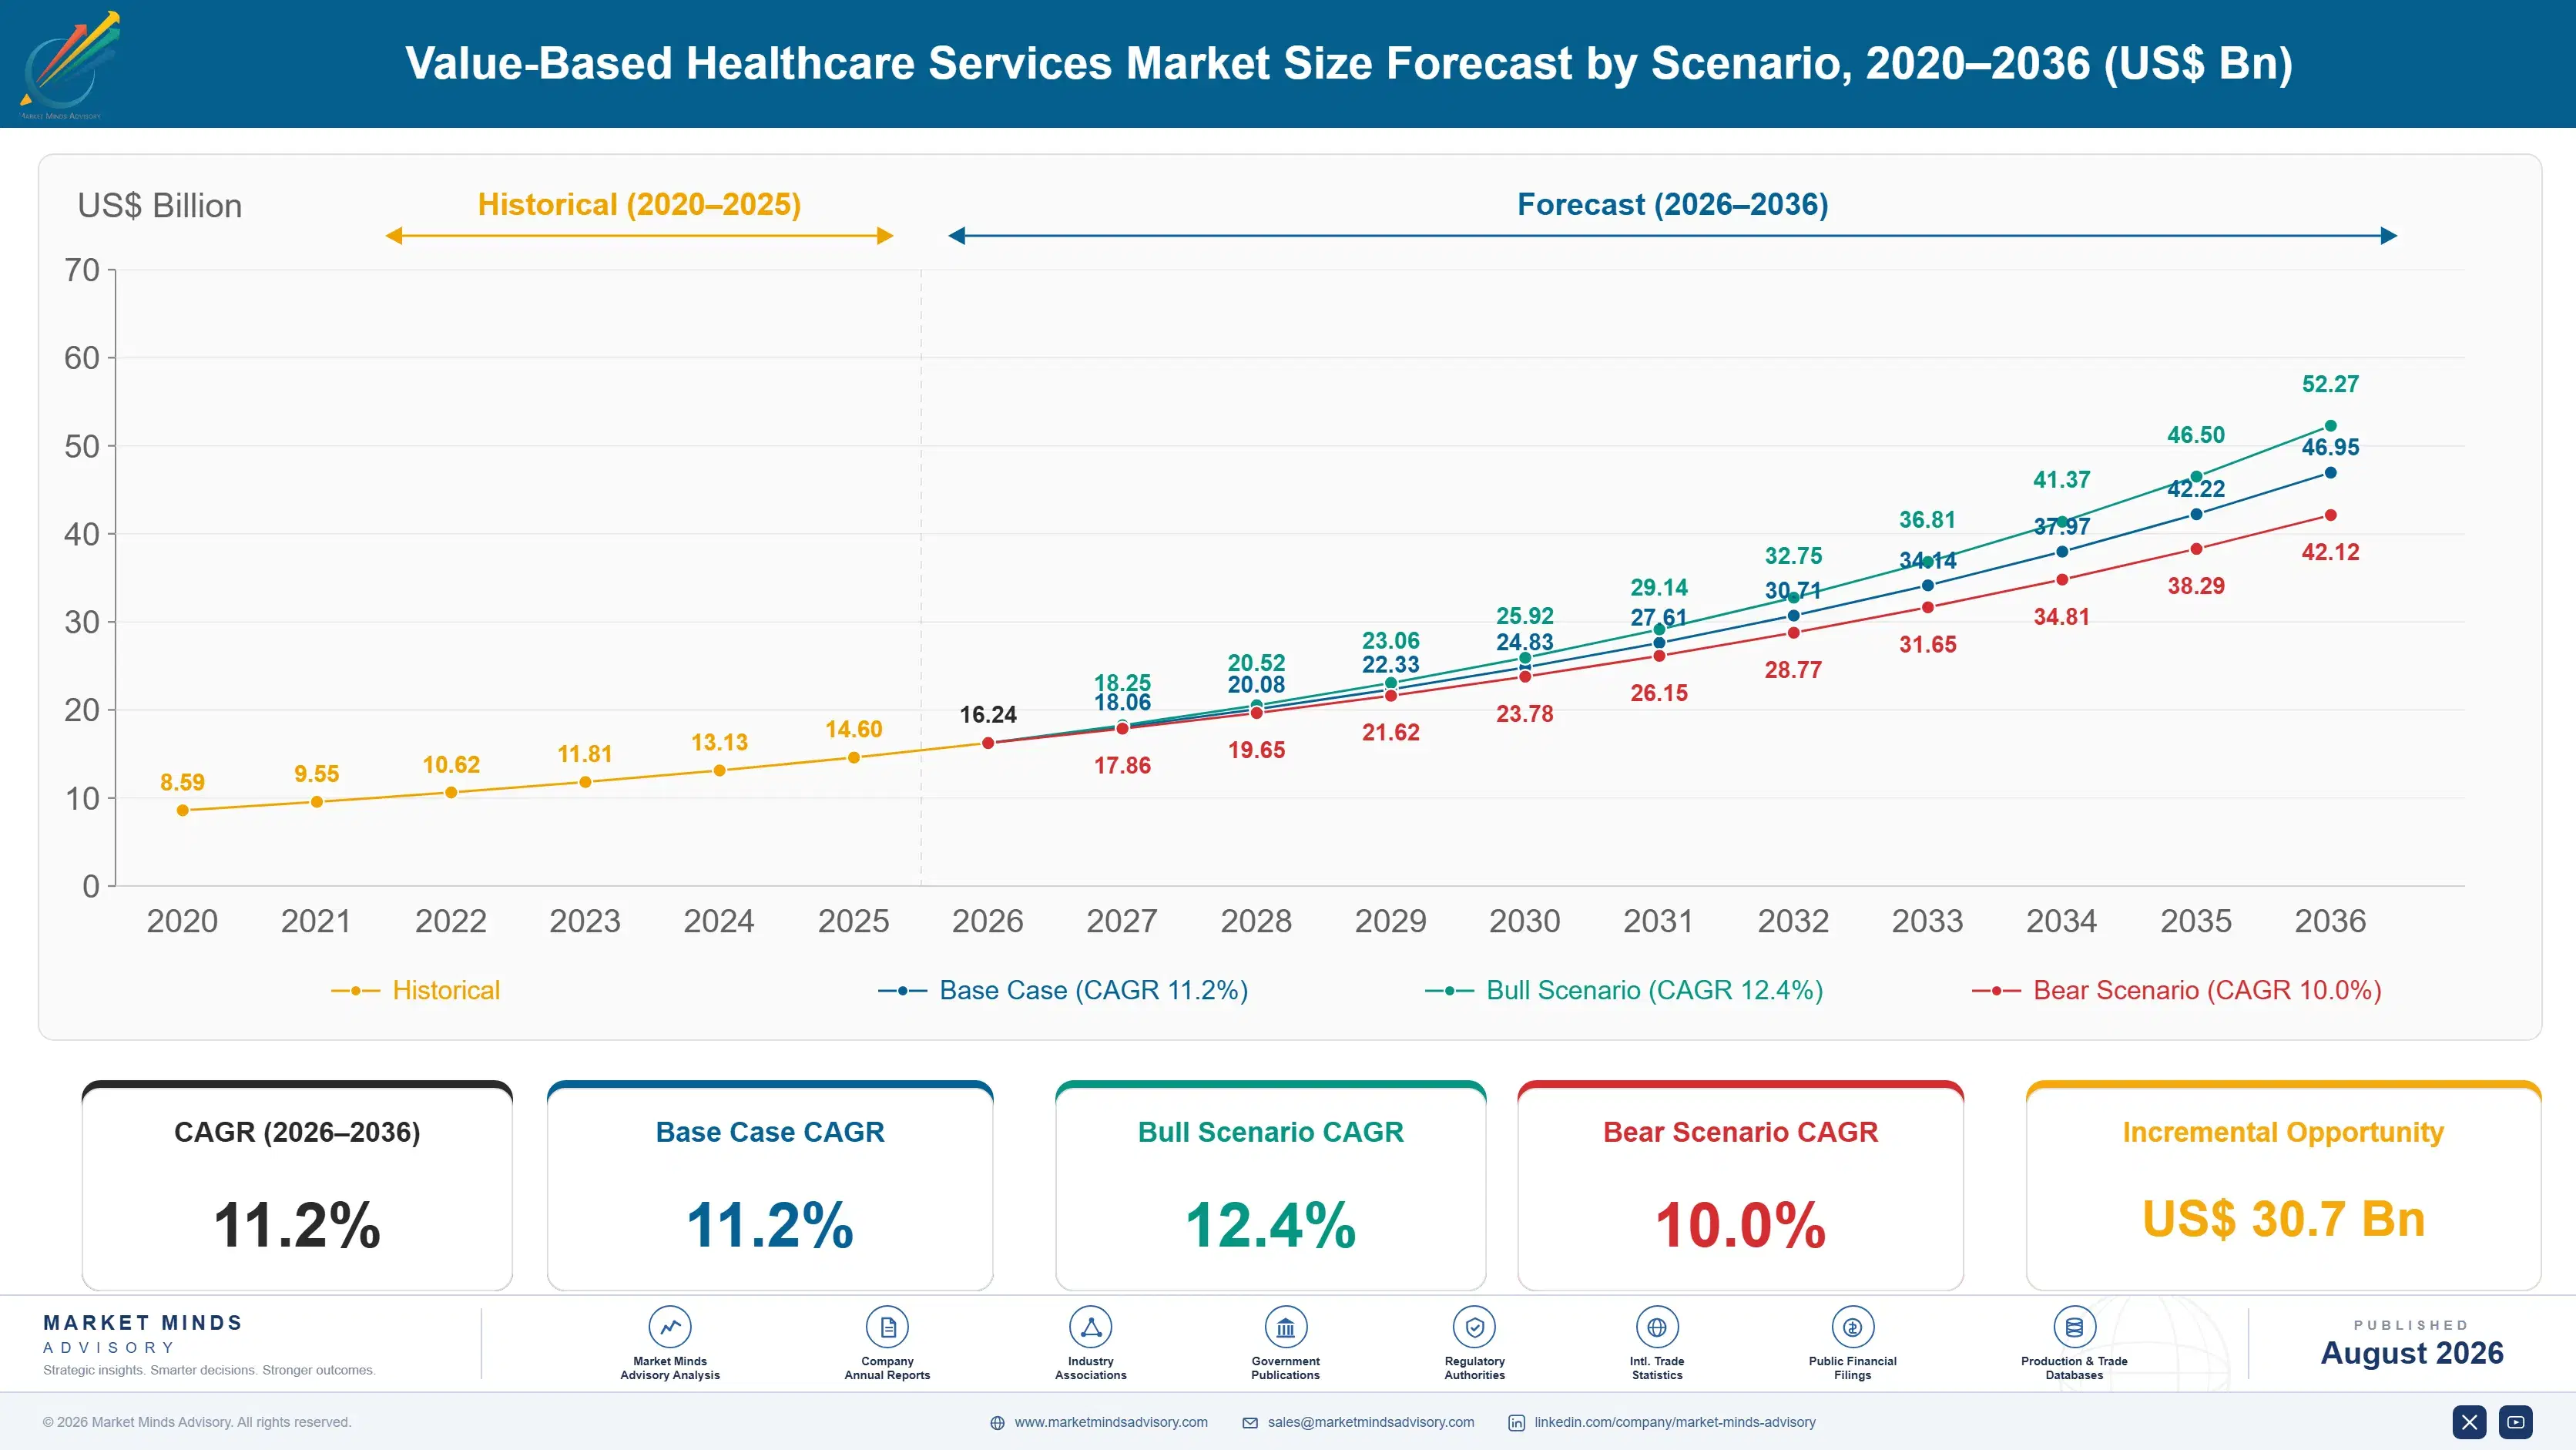
The period from 2020 to 2025 was a correction rather than a slowdown. Capital flooded into provider enablement on the assumption that shared savings would compound, valuations rose accordingly, and then benchmark methodology changes reduced the savings pool available to distribute. Several well funded companies retreated from markets or failed outright. The 9.8% historical rate averages a boom and a reckoning and describes neither properly.
The 11.2% base case rests on three mechanisms. Medicare programme design continues pushing accountable care participation toward mandatory rather than voluntary structures, which removes the option of simply not participating. Risk adjustment and quality reporting obligations attach to every arrangement and get bought as a service by practices that cannot staff them. And international health systems are adopting value-based purchasing models, with Gulf and Nordic systems furthest along and building the same enablement layer from scratch.
The 12.4% bull case turns on mandatory participation models expanding faster than announced, which converts reluctant providers into customers overnight. The 10.0% bear case is benchmark methodology: if regulators tighten the savings pool again, roughly 63% of enablement revenue reprices at once and the capital that funds this sector reprices with it. Nobody in this sector controls that formula.

Renting the Capability Risk Actually Requires

The obstacle was never the incentive. Paying for outcomes rather than volume has been argued convincingly since the 1990s and almost nobody in medicine disputes the logic. What stopped it was that accepting downside risk requires reserve capital, actuarial modelling, population data across every setting a patient touches, and care management staff a fifteen physician practice cannot possibly employ. The idea was fine. The infrastructure did not exist.
TOP FIVE CONCENTRATION28%Combined contracted revenue held by the largest service providers
CONTINGENT REVENUE SHARE63%Portion of enablement revenue depending on shared savings
DOWNSIDE RISK ADOPTION34%Share of arrangements carrying genuine financial downside exposure
ATTRIBUTED LIVES PER CONTRACT42,000Typical population size under a single management agreement
CONTRACT TERM LENGTH5 yearsUsual commitment period before an arrangement is renegotiated
PRIMARY CARE PARTICIPATION48%Proportion of practices holding any value based arrangement
An entire services layer emerged to supply exactly that. Enablement companies bring the capital, the analytics, the care managers and the contracting expertise, and take a share of whatever savings result. Roughly 48% of primary care practices now hold some value based arrangement, though only 34% carry genuine downside exposure, and the rest are participating in something that cannot lose them money.
That structure carries an unusual vulnerability. Around 63% of enablement revenue is contingent on shared savings, and the savings pool is defined by a benchmark formula that regulators periodically rewrite. When benchmarks tightened, revenue that companies had modelled as recurring turned out to be an option written by somebody else. Several failed. The survivors have been quietly shifting toward fixed fee arrangements ever since.
"Everybody describes this as an industry that transforms healthcare economics. It is closer to a rental business: practices rent the balance sheet and the analysts they cannot afford, and the rent is collected in basis points of somebody else's savings."
Director, Healthcare Services and Payment Innovation Practice · MMA Healthcare Services Practice · August 2026

Market Trends

Mandatory Participation Models Remove the Option to Decline

Voluntary accountable care programmes attracted the providers most likely to succeed in them, which is exactly the selection problem regulators worried about. The response has been to design mandatory models where participation is a condition of payment rather than a choice, and each one converts a reluctant provider population into customers for enablement services within a single programme year. Provider enablement grows at 16.8% against a market rate of 11.2% substantially on this mechanism. Providers entering unwillingly buy differently from volunteers: they want compliance and downside protection, not upside optimisation.
Market Impact: Attaches to 100% of contracts
Contracting Shifts From Shared Savings Toward Fixed Fees

Roughly 63% of enablement revenue still depends on shared savings, and the sector learned the hard way what that means when a regulator rewrites a benchmark formula. Companies that survived the last tightening have been converting contracts toward per member per month fees, care management service charges and technology subscriptions that do not depend on a savings calculation. Margins are lower and the revenue is genuinely recurring, which the capital markets now prefer after several years of being told otherwise. Providers accept the shift because fixed fees are easier to budget than a contingent payment arriving eighteen months late.
Market Impact: Serves 48% of primary practices

Market Opportunities and Growth Drivers

Risk Adjustment Obligations Attach to Every Arrangement

Any value based contract requires documented risk adjustment, quality measure reporting and audit ready records, and a practice that cannot staff those functions buys them as a service. Risk adjustment and quality reporting grows at 13.4%, second fastest in the market, and the demand is compulsory rather than discretionary, which makes it the most predictable revenue anywhere in this sector. Regulatory audit intensity has increased noticeably, raising the cost of doing it badly and the value of doing it properly. Practices that once handled coding internally have largely stopped trying.
Market Impact: Reprices 63% of sector revenue

Independent Practices Need Capital They Cannot Raise

Accepting downside risk means holding reserves against a population's medical costs, and a fifteen physician independent practice has no route to that capital on acceptable terms. Enablement companies supply it, which is the actual product underneath the analytics and care management wrapping. Roughly 48% of primary care practices now hold some value based arrangement and 34% carry genuine downside exposure, and almost none of the second group carry it on their own balance sheet. The alternative for those practices is selling to a health system, which many will do anyway.
Market Impact: Shifts 18% of attributed lives

Market Restraints and Challenges

Benchmark Methodology Can Reprice the Sector Overnight

Roughly 63% of enablement revenue depends on shared savings, and the savings pool is defined by a benchmark that regulators recalculate periodically using methodology they control entirely. The root cause is that a programme designed to reward efficiency must eventually ratchet the benchmark downward, or successful participants keep earning against a standard their own success established. Commercially this means revenue modelled as recurring is an option somebody else wrote. The responses are conversion to fixed fee contracting, geographic diversification across programme types, and reserves that most companies in this sector never held.
Market Impact: Converts 100% of eligible providers

Attribution Rules Make Populations Move Without Warning

Patients are attributed to accountable providers by algorithms based on where they received care, and those algorithms change, which means a managed population can shift materially between years without any provider or patient doing anything differently. The root cause is that attribution attempts to assign responsibility for people who are free to seek care anywhere. Commercially it makes forecasting genuinely difficult and undermines multi year investment in care management for a population that may not be there. Companies respond by contracting across multiple programmes and by building care models that survive population turnover.
Market Impact: Shifts 63% of contingent revenue
3 additional market trends, 4 additional growth drivers, and 2 additional restraints and challenges are covered in the full report. Contact sales@marketmindsadvisory.com to access the complete intelligence.

Segment CAGR and Growth Architecture

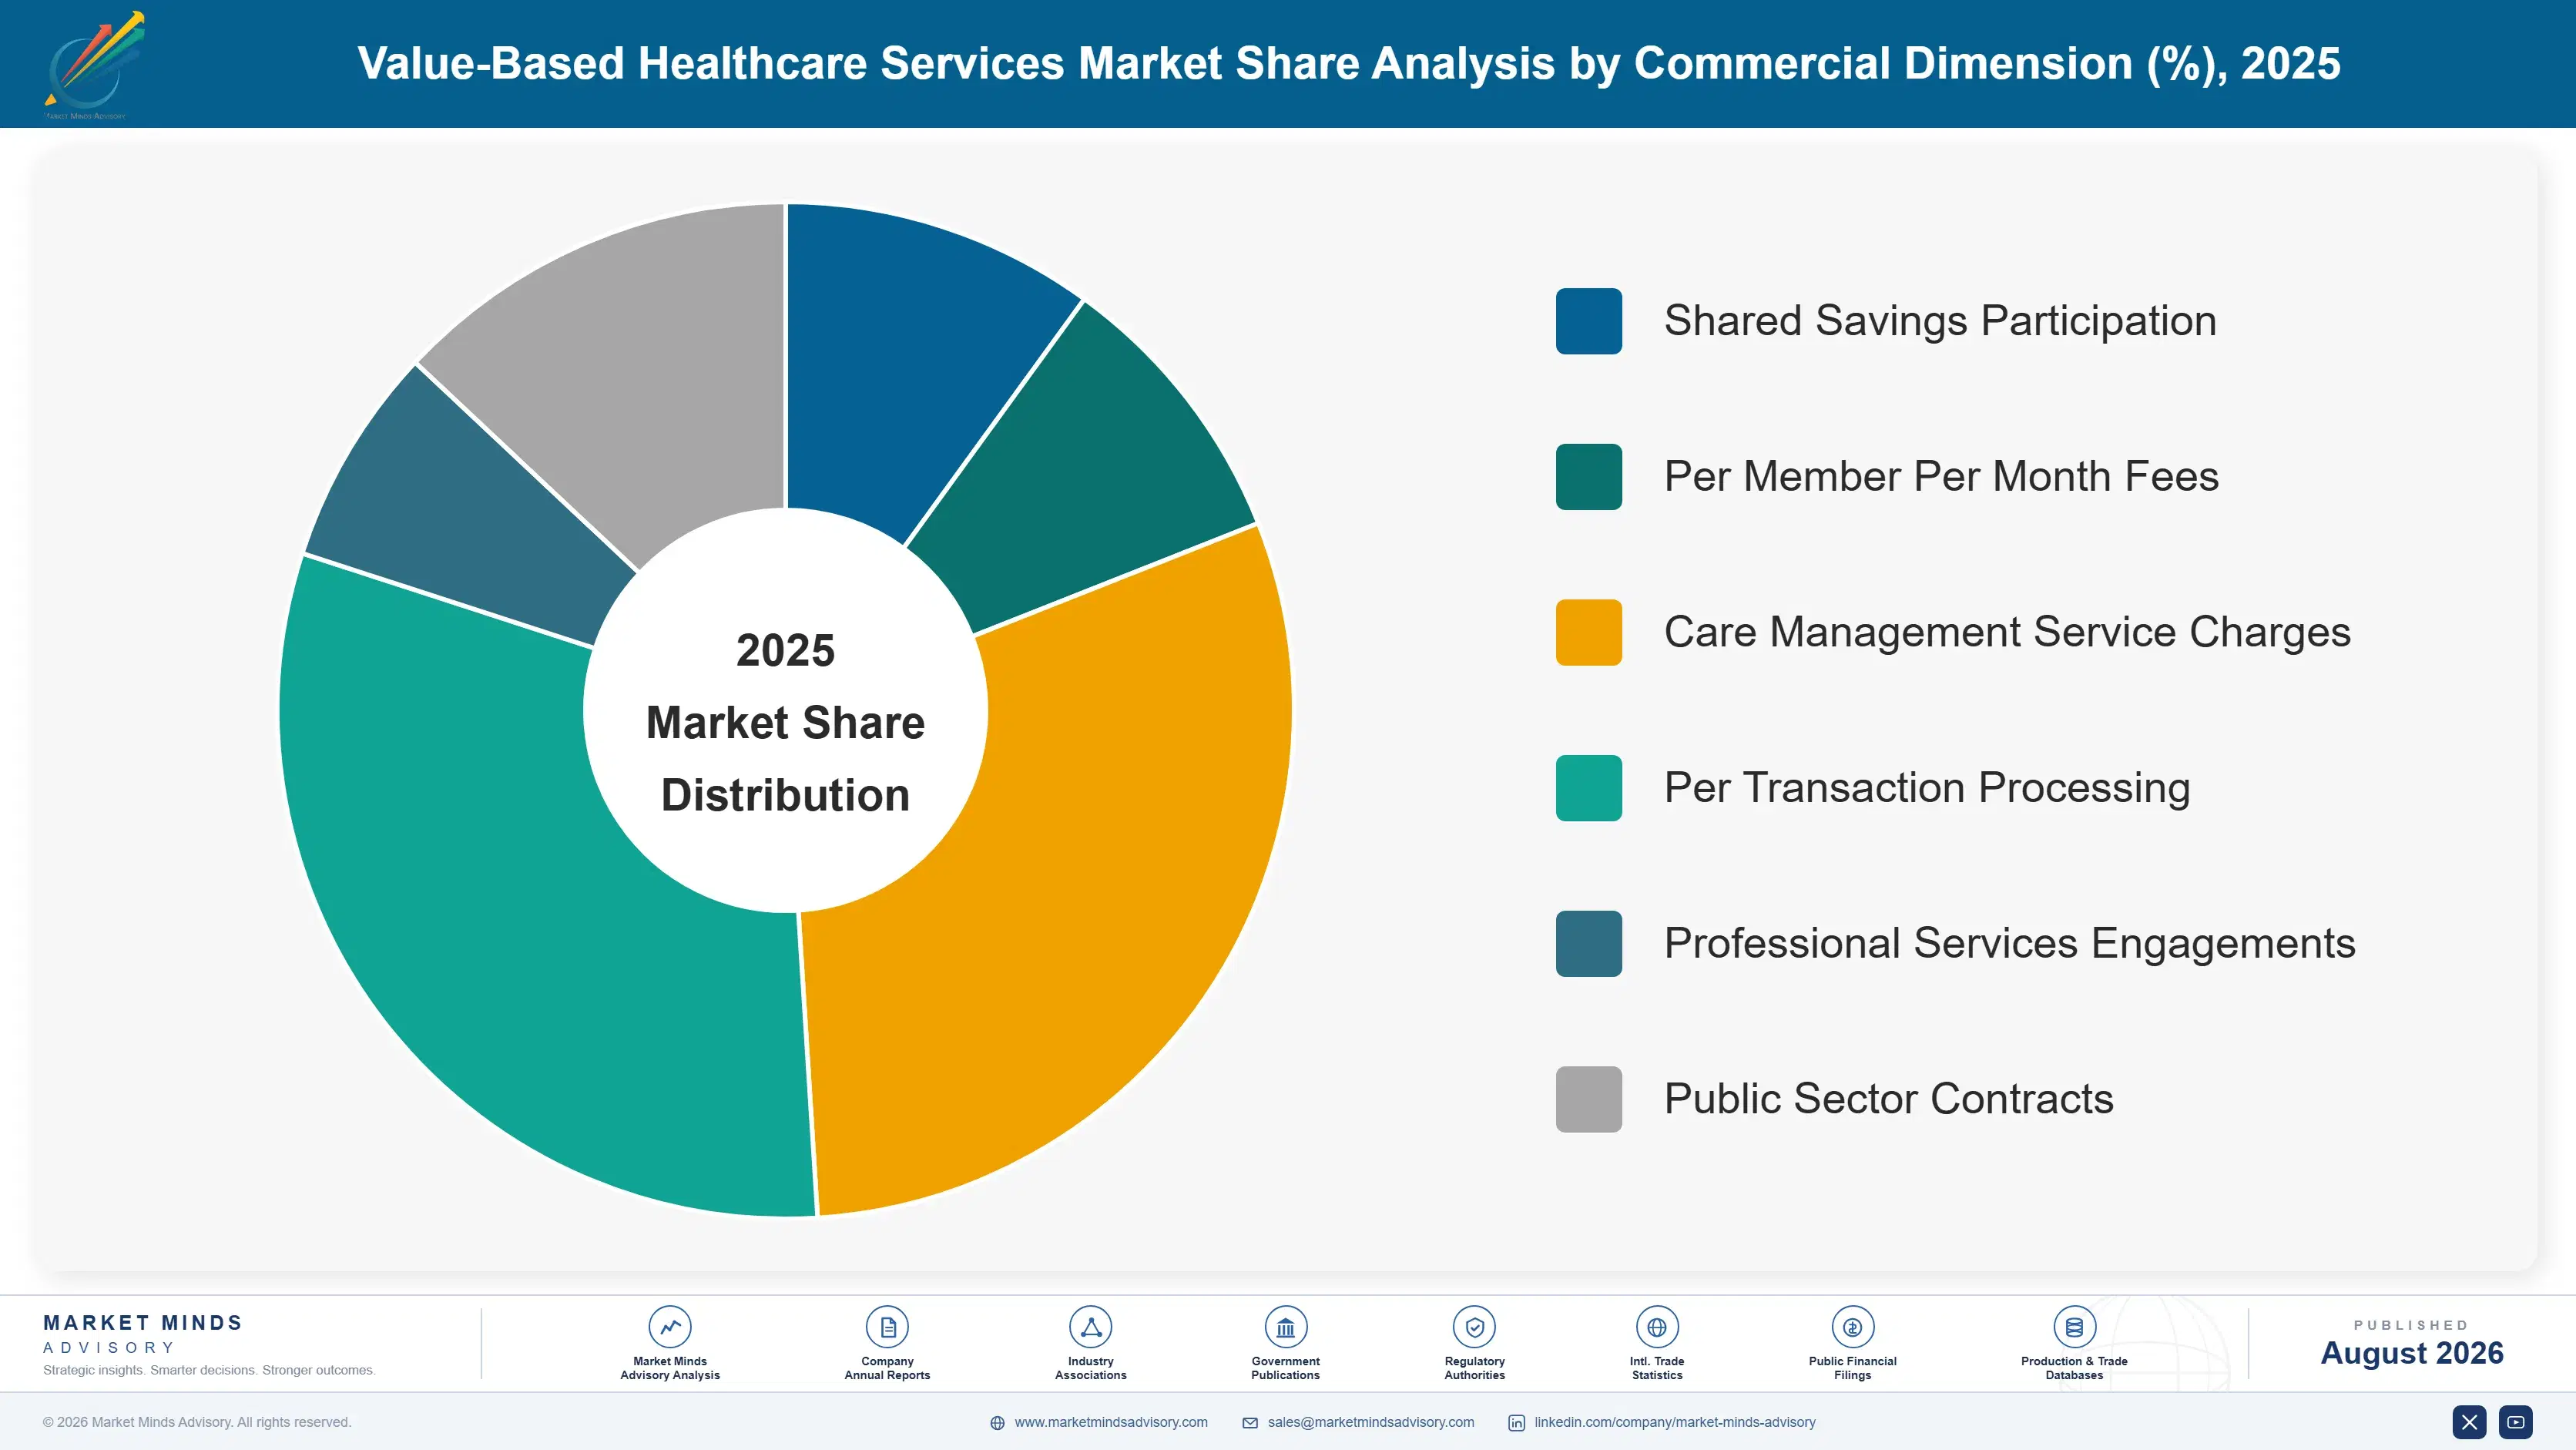
Segmentation follows service type, since each service answers a different question a provider taking risk cannot answer alone. Six service types cover the field, from carrying the financial risk itself through to reporting quality measures. Growth concentrates where the capability gap is widest, which is exactly where capital and actuarial skill are required. Nothing else grows much.
value-based-healthcare-services-market-market-share-analysis-1787641268419

Provider Enablement and Risk Bearing Management

Services where the provider delegates financial risk, care management staffing, analytics and contracting to a partner that takes a share of resulting savings or a management fee. At 16.8% this is the fastest growing service type in the market, half again the market rate of 11.2%, and the product underneath the analytics is capital. A practice cannot hold reserves against a population's medical costs, and enablement companies can. Mandatory participation models are converting reluctant providers into customers who buy for compliance and downside protection rather than upside. The vulnerability is contingent revenue: when benchmarks tighten, this segment reprices before anything else does. Capital, not analytics, is what practices are actually buying here.
CAGR 16.8%

Risk Adjustment and Quality Reporting

Documentation review, clinical coding accuracy, quality measure abstraction and audit preparation, delivered as a service to practices and health systems inside value based arrangements. Growth of 13.4% is second fastest in the market, and the demand is compulsory rather than discretionary, since every arrangement carries reporting obligations regardless of how it performs financially. That makes this the most predictable revenue anywhere in the sector and the least exposed to benchmark methodology. Regulatory audit intensity has risen, which raises both the cost of poor documentation and the value of doing it properly. Practices that once coded internally have largely given up trying. Audit defensibility is what buyers are really paying for now.
CAGR 13.4%
Full segment breakdown across 6 segments available in the complete report.

Regional Architecture and Country Demand Map

North America holds 44% of the market, well above the standard band, because Medicare programme design created value based purchasing at national scale and no other system has anything comparable. East Asia sits below its population weight for the same reason. Saudi Arabia grows fastest.

North America

This 44% share exceeds the standard band, and the justification is programme design rather than market maturity: Medicare accountable care and advanced payment models created value based purchasing at national scale, and no other health system has built anything of comparable size. Roughly 48% of American primary care practices hold some value based arrangement, though only 34% carry real downside exposure. Enablement companies concentrate in markets with high Medicare Advantage penetration, since those arrangements carry more delegated risk than traditional programmes. Canadian provincial systems fund care differently and have adopted almost none of this architecture. Benchmark methodology changes reach every American participant simultaneously, which is why this region carries most of the sector's regulatory risk.
Share: 44% | CAGR: 10.6% (2026 to 2036)

Western Europe

European interest in value based purchasing is genuine and takes a very different shape, which a 22% share reflects. Nordic systems have run outcome based procurement and bundled payment pilots for years, with Sweden and the Netherlands furthest along on measured outcomes for defined conditions. The commercial layer is much thinner, because public systems employ their own analysts and rarely delegate financial risk to a private partner. Consulting, actuarial and outcome measurement services therefore carry proportionally more of the regional revenue than enablement does. German and French systems have moved slowly, constrained by fee schedule structures that make episode based payment awkward. Growth of 9.6% reflects deliberate public sector pace.
Share: 22% | CAGR: 9.6% (2026 to 2036)
Regional intelligence for 5 additional markets available in the complete report: East Asia, South Asia and Pacific, Latin America, Middle East and Africa, Eastern Europe. Contact sales@marketmindsadvisory.com.
value-based-healthcare-services-market-country-cagr-analysis-1787641268981

Where This Sector Actually Makes Money

The customer here is neither the payer nor really the provider; it is the capability gap between them. Value accrues to whoever supplies capital a practice cannot raise, whoever holds the compulsory reporting obligations, and whoever converts contingent revenue into contracted revenue. Four routes carry weight, and only one of them depends on savings materialising at all.

Convert Contingent Revenue Into Contracted Revenue

Roughly 63% of enablement revenue still depends on shared savings, which means a benchmark methodology change reprices most of a company's income statement without anybody doing anything wrong. Companies that survived the last tightening moved toward per member per month fees, care management charges and subscriptions that do not depend on a savings calculation at all. Margins fall and the revenue becomes genuinely recurring, which capital markets now value considerably more highly than upside participation. Providers accept the trade because a fixed fee is easier to budget than a contingent payment arriving eighteen months later.
Market Impact: Protects the 63% of revenue that is contingent

Sell Compulsory Reporting Before Selling Savings

Risk adjustment and quality reporting grows at 13.4% and the demand is compulsory: every value based arrangement carries documentation and audit obligations regardless of whether it produces any savings. That makes it the most predictable revenue in the sector and the least exposed to benchmark methodology, and it opens a relationship with practices not yet ready to take downside risk. Audit intensity has risen, which raises the cost of doing this badly. Selling the obligation first and the risk arrangement later converts considerably better than approaching it the other way around.
Market Impact: Attaches to 100% of all value based contracts

Position Ahead of Mandatory Participation Programmes

Voluntary programmes attract providers likely to succeed, which is precisely why regulators keep moving toward mandatory designs where participation is a condition of payment. Each mandatory model converts an entire reluctant provider population into customers inside one programme year, and those providers buy differently: they want compliance and downside protection rather than upside optimisation. Enablement grows at 16.8% substantially on this mechanism. Companies that read the regulatory pipeline and build capability in the geographies a model will cover arrive with capacity while competitors are still hiring. Regulatory reading beats commercial effort here.
Market Impact: Reaches 100% of providers inside every mandated region

Follow Health System Reform Into New Purchasing Markets

Saudi Arabia grows at 18.6%, faster than any other country covered, because a national transformation programme separated purchasing from provision and adopted value based principles where no such architecture previously existed. That creates demand for actuarial, contracting and population health capability from a standing start, with no incumbent to displace. Similar programmes are progressing across the Gulf and in several South Asian private insurance markets, and the regional growth rate of 13.4% reflects it. Winning requires local entity presence and patience rather than the American playbook applied unchanged. Local presence matters more than method.
Market Impact: Captures the 18.6% Saudi Arabian national growth rate

Who Controls the Margin Pool

This market is unusually fragmented for one with such large participants. The top five account for 28% of contracted service revenue and attributed lives under management, the basis applied consistently here. Optum leads on scale across every service type, and the distance to the next tier is wide, but the long tail is enormous because regional enablement companies compete effectively inside individual markets where relationships matter more than capability.
Competition runs on three fronts. Enablement companies compete for provider contracts on capital strength, downside protection terms and demonstrated savings history, which is a credit conversation as much as a clinical one. Risk adjustment and reporting services compete on audit defensibility and price per chart. Advisory and actuarial firms compete on programme design credibility with payers and regulators rather than with providers at all.

Rankings will move with regulatory design more than with commercial performance. A mandatory model covering new geographies creates demand where none existed, and a benchmark tightening removes revenue from everyone simultaneously. Consolidation among mid sized enablement companies has been steady since the last correction. Payer owned services groups are the other pressure point, since they hold data and capital independent enablement companies must buy or borrow.
value-based-healthcare-services-market-company-positioning-matrix-1787641269567

Competitive Moat and Risk Dimensions

OPTUM

Moat: Integrated Data and Capital

Ownership of claims data, care delivery assets and payer relationships inside one organisation removes the data access problem every independent enablement company spends years solving. Capital strength allows downside risk terms competitors cannot match on their own balance sheets, which matters most to precisely the providers least willing to accept exposure themselves.
OPTUM

Risk: Payer Ownership Perception

Independent physician groups considering delegated risk arrangements weigh whether a partner owned by an insurer shares their interests, and many conclude it does not. That perception costs contracts to smaller enablement companies with no such conflict, and it has proved resistant to commercial argument because the underlying concern is genuinely reasonable.
EVOLENT HEALTH

Moat: Specialty Risk Depth

Capability in oncology, cardiology and musculoskeletal risk arrangements addresses cost concentration that primary care focused enablement cannot reach, since a small proportion of specialty episodes drives a disproportionate share of total medical spend. That expertise took years to build and requires clinical pathway depth competitors cannot assemble quickly.
EVOLENT HEALTH

Risk: Contingent Revenue Exposure

A substantial share of revenue depends on performance against benchmarks set by payers and regulators, and roughly 63% of sector enablement revenue carries that structure. When methodology tightens, income reprices without any operational failure, which makes forecasting difficult and makes the equity story harder to defend than the underlying business deserves.

Players Tracked

Prominent Players

Optum
Evolent Health
agilon health
Privia Health
Cotiviti

Other Key Players

Signify Health
Aledade
Vytalize Health
Astrana Health
P3 Health Partners
Clover Health
Wellvana
Pearl Health
Milliman
Health Catalyst
Innovaccer
Arcadia
Lightbeam Health Solutions
Navvis
Guidehouse

Recent Developments

JANUARY 2025

Regulator announces mandatory participation model for additional regions

A national payment regulator announced expansion of a mandatory accountable care model into additional geographic regions, making participation a condition of payment rather than a voluntary election. Enablement companies with existing presence in those regions reported contracting activity within weeks, while providers sought compliance support rather than upside participation.
Signal: Mandatory programme design converts an unwilling provider population into paying customers inside a single programme year
APRIL 2025

Enablement company shifts contracting toward fixed fee structures

A publicly listed provider enablement company reported a deliberate shift of contract mix toward per member per month fees and care management charges, away from shared savings participation. Management cited forecasting reliability and investor preference, accepting lower headline margins in exchange for revenue not exposed to benchmark methodology.
Signal: The sector is now trading upside for predictability after learning exactly what contingent revenue really costs
AUGUST 2025

Saudi health transformation programme awards population health contracts

Saudi health authorities awarded contracts covering population health management and actuarial capability as part of a programme separating purchasing from provision. The awards created demand for capability that did not previously exist in the market, with no incumbent supplier to displace and international bidders competing on transformation experience.
Signal: Health system reform creates entire service markets faster than any commercial development effort could ever manage

What Delivering These Services Costs

This is a labour business with a balance sheet attached. Clinical staff, care managers, coders and actuaries account for roughly 58% of cost of services, sourced domestically because the work requires local regulatory knowledge. Data acquisition and technology infrastructure add a further 19%. The remainder sits in reserve capital cost, which is not a cost of services in accounting terms but behaves exactly like one commercially.
Clinical and actuarial wage inflation was the defining cost event of the period. Competition for care managers, certified coders and health actuaries pushed compensation sharply upward through 2021 and 2022, and company annual reports across the healthcare services sector documented the margin effect in detail. Data acquisition costs moved separately, as payers repriced claims feeds that enablement companies depend on entirely. Neither input has a substitute available at any price.

Exposure divides by contract structure rather than by size. A company earning fixed per member fees can price wage inflation into renewal terms across a five year term. A company earning shared savings absorbs it directly, because the savings pool does not expand to accommodate a supplier's cost base. That is the same weakness benchmark tightening exposes, arriving through a different door.
value-based-healthcare-services-market-cost-volatility-analysis-1787641269767

Move contract mix toward fixed fees at renewal

A per member per month fee can carry an inflation adjustment clause and a shared savings arrangement cannot, since the savings pool is defined by somebody else entirely. Companies converting mix at renewal protected margin through a wage cycle that hurt competitors. Providers accept it because a fixed fee is easier to budget than a contingent payment arriving late.

Centralise coding and abstraction capability across markets

Clinical coding and quality measure abstraction do not require physical presence, only regulatory knowledge and licensure where applicable, so centralising the function across markets improves utilisation of scarce certified staff considerably. The constraint is that documentation standards vary by programme and payer, limiting standardisation. Most companies have centralised considerably further than they originally expected to.

Contract data feeds on multi year terms with defined pricing

Claims data access is the input with no substitute, and payers have repriced feeds knowing exactly how dependent enablement companies are on them. Multi year agreements with defined pricing remove the annual renegotiation and the leverage that comes with it. The cost is committing volume that may not be needed, which beats discovering a feed has doubled.

Portfolio Architecture for Margin Defence

Margin architecture follows how contingent the revenue is. Advisory and actuarial services earn professional services margins on billed time with no performance exposure at all. Risk adjustment and reporting earns steady service margins against a compulsory obligation. Provider enablement earns the widest range in the sector, excellent when savings materialise and negative when they do not, which is why the reported margins of enablement companies swing so violently between years.
The tension is between the segment with the growth and the segment with the predictability. Enablement grows at 16.8% and carries roughly 63% contingent revenue. Risk adjustment grows at 13.4% and carries almost none. A portfolio weighted toward enablement gets punished every time a benchmark tightens, and one weighted toward reporting misses the growth entirely and gets valued as a business process outsourcer.

High value pools concentrate in specialty risk arrangements, where a small share of episodes drives disproportionate medical spend, and in compulsory reporting obligations that attach regardless of financial performance. Everything else sits exposed to a benchmark formula written by somebody else. Companies that understood the difference early have built portfolios that survive a methodology change, and the ones that did not have mostly been acquired.

Utilisation and Network Management

Prior authorisation processing, network performance reporting and utilisation review delivered at scale against per transaction pricing. Competition is on price and turnaround, and payers move this work regularly between suppliers with little friction.
Gross Margin: 18-21%

Risk Adjustment and Quality Reporting

Compulsory documentation, coding accuracy and quality measure services attached to every value based arrangement regardless of financial outcome. Margin holds because audit defensibility is genuinely difficult and the obligation does not depend on savings materialising.
Gross Margin: 34-37%

Provider Enablement and Specialty Risk

Delegated risk management, care model deployment and specialty episode arrangements carrying capital and performance exposure. Margin is the widest in the sector when savings materialise and disappears entirely when benchmark methodology moves against participants.
Gross Margin: 42-45%
value-based-healthcare-services-market-portfolio-architecture-1787641270271

High-value Sub-segments and Strategic Watch-out

Provider Enablement and Risk Bearing Management

The fastest growing service type at 16.8% and the most exposed in the sector, since roughly 63% of its revenue depends on savings a regulator can reprice. Mandatory participation models keep expanding the customer base, which is the reason growth continues despite the volatility. Volatility is the price.
Gross Margin: 42-45%

Risk Adjustment and Quality Reporting

Second fastest at 13.4% and the most defensible revenue anywhere in this market, because reporting obligations attach to every arrangement whether it saves money or not. Rising audit intensity raises both the cost of doing it badly and the price of doing it well. Nothing else compares here.
Gross Margin: 34-37%

Population Health and Care Management

Growing at 10.6% and structurally caught between the two, since care management delivers the savings enablement depends on but is frequently sold as a standalone service at modest margin. Attribution turnover undermines multi year investment in any given population. Standalone pricing rarely reflects the value delivered downstream.
Gross Margin: 30-33%

Value-Based Contracting Advisory

Growing at only 7.4% because the design questions were largely answered a decade ago and the remaining work is implementation rather than strategy. It retains relevance in new markets such as the Gulf, where no contracting architecture previously existed at all. Implementation work has replaced strategy work entirely.
Gross Margin: 26-29%

How These Contracts Actually Recur

Contracts here run roughly five years and the revenue inside them behaves in two completely different ways. Fixed fees on attributed lives recur monthly and predictably, scaling with a population that averages around 42,000 lives per agreement. Shared savings arrives once a year, eighteen months late, calculated by somebody else, and roughly 63% of enablement revenue still takes that form. The same contract contains an annuity and a lottery ticket.
Stickiness varies sharply by who signed. Independent practices that delegated risk rarely leave, because rebuilding the capability internally is not realistic and switching partners mid arrangement forfeits accumulated performance history. Health systems with internal analytics capability treat these services as replaceable and retender regularly. Payers move utilisation work between suppliers with very little friction, which is why that tier prices as it does.

The buyer has moved up considerably. Value based contracting was once negotiated by a practice manager and a payer contracting representative working from a template. It now involves chief financial officers, actuarial consultants and a population health executive who did not exist as a role a decade ago. Selling capability to a clinician and selling capital to a finance function are different conversations.
value-based-healthcare-services-market-end-use-penetration-index-1787641270767

Where This Sector Rewards Focus

These are among the four positions where our research anticipates prominent divergence between winners and laggards over the coming forecast period. Each is grounded in the demand model, the regulatory perimeter, and the announced capacity pipeline.
01 / CONTINGENT REVENUE CONVERSION

Trade upside for revenue nobody else can reprice

Roughly 63% of enablement revenue depends on shared savings calculated against a benchmark that regulators rewrite periodically, which means most of a company's income statement is an option somebody else wrote and can reprice. Converting contract mix toward per member fees and care management charges lowers headline margin and produces revenue that survives a methodology change intact. Capital markets have already repriced this sector twice on exactly that distinction, and the companies that moved early are the ones still independent.
02 / COMPULSORY OBLIGATION SELLING

Reporting duties attach whether savings arrive or not

Risk adjustment and quality reporting grows at 13.4% and every value based arrangement carries documentation and audit obligations regardless of financial performance, which makes it the most predictable revenue available anywhere in this market. It also opens relationships with practices not yet willing to accept downside risk, which is most of them, since only 34% currently carry genuine exposure. Selling the obligation first and the risk arrangement afterwards converts considerably better than approaching those two conversations the other way around.
03 / REGULATORY PIPELINE READING

Mandatory models create customers commercial effort cannot

Voluntary programmes attract providers already likely to succeed, so regulators keep shifting toward mandatory designs where participation is a condition of payment rather than a choice available to decline. Each such model converts an entire reluctant provider population into enablement customers inside a single programme year, which is why that segment grows at 16.8% against a market rate of 11.2%. Companies that build capability in the geographies a model will cover arrive with capacity while competitors are still recruiting staff.
04 / REFORM MARKET ENTRY

New purchasing architectures have no incumbent to displace

Saudi Arabia grows at 18.6%, faster than any country covered, because a national transformation programme separated purchasing from provision and created demand for actuarial and population health capability that did not previously exist anywhere in the market. There is no incumbent to displace and no legacy contracting practice to unpick at all, which is a rarer commercial position than it sounds. Winning requires local entity presence and genuine patience rather than the American enablement playbook applied without any modification at all.

Engagement Snapshot From the Field

A live engagement with an industry participant carrying material or product regulatory and market exposure ahead of a defining policy shift, showing how our research translates into a defensible multi-year portfolio strategy.
MARKET MINDS ADVISORY · CLIENT ENGAGEMENT SUMMARY
Value-Based Healthcare Services Producer Strategic Portfolio Review and Transition Roadmap 2026·Investment Scenario on Value-Based Healthcare Services Exposure Evaluation 2025-26
CLIENT PROFILE
A provider enablement company managing delegated risk arrangements for independent primary care practices across nine American states, with roughly 610,000 attributed lives under management. Annual revenue was approximately 480 million dollars (client-reported, unverified by MMA), of which 71% depended on shared savings performance. No risk adjustment service line existed and no international presence had been considered.
STRATEGIC CHALLENGE
A benchmark methodology change had reduced realised savings for two consecutive performance years, and the company had withdrawn from two states as a result. The board wanted to know whether the business model itself was sound or whether the contract structure needed rebuilding. Investors had begun questioning whether shared savings revenue should be valued as recurring at all.
MMA APPROACH
MMA modelled revenue durability under three benchmark methodology scenarios, separating contract components that survive a tightening from those that do not. Contract level analysis established what proportion of provider relationships would accept fixed fee conversion at renewal. Forty-seven expert interviews with practice executives, payer contracting leaders and actuarial consultants established what providers actually value in an enablement relationship and what they merely tolerate.
KEY FINDINGS
  1. Under the moderate benchmark scenario, 58% of current revenue disappeared while care management and reporting components remained entirely intact across every contract examined.
  2. Practice executives in 39 of the 47 interviews said they valued downside protection and administrative relief above savings participation, and would accept fixed fee terms readily.
  3. Risk adjustment services carried gross margin of 36% with no benchmark exposure, and 84% of the client's existing practices already bought that capability elsewhere.
  4. Contract renewal windows over the following 3 years covered 74% of attributed lives, providing a practical route to restructure mix without renegotiating anything early.
CLIENT PROFILE
A provider enablement company managing delegated risk arrangements for independent primary care practices across nine American states, with roughly 610,000 attributed lives under management. Annual revenue was approximately 480 million dollars (client-reported, unverified by MMA), of which 71% depended on shared savings performance. No risk adjustment service line existed and no international presence had been considered.
STRATEGIC CHALLENGE
A benchmark methodology change had reduced realised savings for two consecutive performance years, and the company had withdrawn from two states as a result. The board wanted to know whether the business model itself was sound or whether the contract structure needed rebuilding. Investors had begun questioning whether shared savings revenue should be valued as recurring at all.
MMA APPROACH
MMA modelled revenue durability under three benchmark methodology scenarios, separating contract components that survive a tightening from those that do not. Contract level analysis established what proportion of provider relationships would accept fixed fee conversion at renewal. Forty-seven expert interviews with practice executives, payer contracting leaders and actuarial consultants established what providers actually value in an enablement relationship and what they merely tolerate.
KEY FINDINGS
  1. Under the moderate benchmark scenario, 58% of current revenue disappeared while care management and reporting components remained entirely intact across every contract examined.
  2. Practice executives in 39 of the 47 interviews said they valued downside protection and administrative relief above savings participation, and would accept fixed fee terms readily.
  3. Risk adjustment services carried gross margin of 36% with no benchmark exposure, and 84% of the client's existing practices already bought that capability elsewhere.
  4. Contract renewal windows over the following 3 years covered 74% of attributed lives, providing a practical route to restructure mix without renegotiating anything early.
RECOMMENDED STRATEGY
Phase 1: Phase one: convert contract mix toward fixed fees at every renewal window, covering 74% of attributed lives across the following three years. Phase 2: Phase two: build a risk adjustment and reporting service line, since 84% of existing practices already buy that capability from somebody else entirely. Phase 3: Phase three: defer international entry, since Gulf opportunities require local entities and patience the current balance sheet cannot support yet.
OUTCOME
The client converted 61% of attributed lives to fixed fee terms within two renewal cycles and launched a risk adjustment service line the following year. Revenue exposed to benchmark methodology fell from 71% to 34%, and the equity discount that had persisted since the previous tightening narrowed materially (client-reported, unverified by MMA).

Frequently Asked Questions

Foundational context covering the market sizes, CAGR, scope, country, region and competition that inform every finding below. This section is provided to cover basics and most often pre-purchase conversations, answered from the MMA Primary Research Dataset.

What is the current size of the Value-Based Healthcare Services Market?

The market was valued at 14.6 billion dollars in 2025, covering enablement, population health, risk adjustment, episode administration, advisory and utilisation services. It reaches an estimated 16.24 billion dollars during 2026.

How large will the Value-Based Healthcare Services Market be by 2036?

MMA forecasts 46.94 billion dollars by 2036, an increase of 30.70 billion dollars over the 2026 base. That represents an expansion multiple of 2.89 times across the forecast period.

What is the CAGR for the Value-Based Healthcare Services Market 2026 to 2036?

The base case compound annual growth rate is 11.2%, with a bull case of 12.4% and a bear case of 10.0%. Mandatory model expansion and benchmark methodology separate those scenarios.

Which segment is growing fastest?

Provider enablement and risk bearing management grows at 16.8%, half again the market rate of 11.2%, driven by mandatory participation models. Risk adjustment and quality reporting follows at 13.4%.

Who are the major companies in the Value-Based Healthcare Services Market?

Optum, Evolent Health, agilon health, Privia Health and Cotiviti lead on contracted service revenue and attributed lives under management. Together they account for 28% of the market.

Which country is growing fastest?

Saudi Arabia grows fastest at 18.6%, because a national transformation programme separated purchasing from provision and created demand for capability that did not previously exist.

Report Segmentation Architecture

The full report scope spans multiple orthogonal segmentation dimensions, with cross-tabulated demand data provided for each dimension pair. Coverage extends further to regional breakdowns, trend trajectories, and the competitive detail needed to support segment-level decision-making.

By Service Type

  • Provider Enablement and Risk Bearing Management
  • Population Health and Care Management
  • Risk Adjustment and Quality Reporting
  • Episode and Bundled Payment Administration
  • Value-Based Contracting Advisory and Actuarial
  • Utilisation and Network Performance Management

By End-Use Industry

  • Independent Primary Care Practices
  • Integrated Health Systems
  • Medicare Advantage Plans
  • Commercial Health Insurers
  • Specialty Physician Groups
  • Government Health Purchasers

By Commercial Dimension

  • Shared Savings Participation
  • Per Member Per Month Fees
  • Care Management Service Charges
  • Per Transaction Processing
  • Professional Services Engagements
  • Public Sector Contracts

By Region

  • North America
  • Western Europe
  • East Asia
  • South Asia and Pacific
  • Latin America
  • Middle East and Africa
  • Eastern Europe

Scope, Methodology, and Coverage

Every figure in this report is reproducible from documented input assumptions. The scope below maps the historical period, the forecast horizon, the segmentation dimensions, and the countries covered, alongside the underlying primary and qualitative methodology.
Historical Period
2020 to 2025
Forecast Period
2026 to 2036
Base Year
2025 (USD billions; MMA Primary Research Dataset, August 2026)
Market Definition
Services that enable, administer or deliver value-based healthcare payment arrangements worldwide, covering provider enablement and risk bearing management, population health and care management, risk adjustment and quality reporting, episode and bundled payment administration, value-based contracting advisory and actuarial services, and utilisation and network performance management. Measured at contracted service revenue. Health insurance underwriting, direct clinical care delivery, electronic health record software licensing, pharmacy benefit management and medical device supply are excluded from scope.
Quantitative Units
USD billions (current prices); attributed lives under management; USD per member per month by service type
Segmentation Dimensions
Service type; end-use industry; commercial dimension; region
Regions Covered
North America, Western Europe, East Asia, South Asia and Pacific, Latin America, Middle East and Africa, Eastern Europe
Countries Covered
United States, Canada, United Kingdom, Netherlands, Sweden, Germany, France, Spain, China, Japan, South Korea, Singapore, India, Australia, Brazil, Colombia, Mexico, Saudi Arabia, United Arab Emirates, Poland
Key Companies Profiled
Optum, Evolent Health, agilon health, Privia Health, Cotiviti, Signify Health, Aledade, Vytalize Health, Astrana Health, P3 Health Partners, Clover Health, Wellvana, Pearl Health, Milliman, Health Catalyst, Innovaccer, Arcadia, Lightbeam Health Solutions, Navvis, Guidehouse
Quantitative Methodology
Primary survey, n=3,800 respondents, Q4 2025, six countries; demand-side model with trade association cross-validation
Qualitative Methodology
47 expert interviews, Q4 2025; applied to validate demand model assumptions, identify emerging dynamics, and assess competitive positioning
Report Format
PDF and XLSX data workbook (Word format preview document)
Publisher
Market Minds Advisory
Report Code
MMA-2026-HLT-146
Published
August 2026
Contact
sales@marketmindsadvisory.com | www.marketmindsadvisory.com

Purchase the full Value-Based Healthcare Services Market Report (2026 to 2036).

The full report treats value-based services as a business that rents capital and capability to providers rather than as a transformation of healthcare economics, which explains why its revenue reprices when a benchmark formula changes. It sizes all six service types independently through 2036, models revenue durability under three benchmark methodology scenarios, and separates contingent revenue from contracted revenue at segment level. Regional chapters cover all seven regions, with public purchasing systems assessed separately from delegated risk markets. Competitive profiling covers 20 participants on one consistent contracted revenue and attributed lives basis.
Six service types sized independently through 2036
Revenue durability modelled under three benchmark methodology scenarios
Contingent and contracted revenue separated at segment level
Public purchasing systems assessed separately from delegated risk
Mandatory participation model pipeline mapped by geography
Twenty participants profiled on one consistent evaluation basis

Built For The People Who Decide

From boardroom strategy to bench-side execution, this report is read cover-to-cover by leaders shaping the next decade of their industry, turning demand scenarios, market dynamics and valuation benchmarks into decisions.
CXOs/ Presidents/ VPs/ Managers
M&A and Corporate Development
Strategy Teams and R&D Heads
Procurement and Product Directors
Regulatory and Compliance Leaders
Investor Relations and Equity Analysts