Market Minds Advisory
Vacuum Switches Market

Vacuum Switches Market: Vacuum Switches Market. Grid Modernization Sustains Medium-Voltage Switching Demand

Grid modernization and renewable interconnection programs are sustaining vacuum switch demand, as utilities replace aging oil-filled switchgear with maintenance-free vacuum interrupter technology across medium-voltage distribution networks. investment. Costs remain a factor.

Lead Analyst

Published

October 2026

Make Smarter Decisions with Customized Research Insights

Request a free sample report and evaluate market opportunities, growth trends, and competitive dynamics relevant to your business needs.

2025 MARKET VALUE$3.3BMarket Size 2025
2036 FORECAST VALUE$6.2BBase Case , 2026 to 2036
CAGR 2026 TO 20365.9 %Bull 7.1% / Bear 4.7%
INCREMENTAL OPPORTUNITY$2.7BNet 10- year value creation
EXPANSION MULTIPLE1.77x2036 value over 2026 base
Strategic Levers
M&A Pipeline
Regional Outlook
Country Rankings
Competitive Intelligence
Segmental Deep-dive
Call-Us : 91 93563 13602

Executive Snapshot and Market Trajectory.

Vacuum switch demand continues climbing as utilities replace aging oil-filled switchgear across medium-voltage distribution networks, a transition driven by vacuum technology's lower maintenance requirements and superior interruption performance under fault conditions. Several major utilities have formalized multi-year replacement programs already underway nationwide. Lead times remain manageable across most regions currently.
Reclosers and automated switching units are growing fastest within the category, expanding at nearly eight percent annually as utilities add remote-controlled fault isolation capability to reduce outage duration across distribution feeders. East Asia and South Asia anchor volume given large grid expansion programs underway in both regions, while North America and Western Europe lead on automated recloser deployment tied to grid resilience investment following recent severe weather events affecting distribution infrastructure.
Competition splits between established switchgear manufacturers with decades of utility relationships and specialized vacuum interrupter component suppliers serving as original equipment manufacturer partners to larger assemblers, a division shaping how utilities structure procurement. Grid modernization funding tied to renewable integration and expanding smart grid automation requirements are pulling specifications toward higher interruption ratings, while remote monitoring integration separates leading suppliers from basic manual switch competitors.
Market Definition
This report covers vacuum interrupter-based switching devices used to connect, disconnect, and protect medium-voltage electrical circuits, including load break switches, reclosers, and vacuum circuit breakers rated between 1kV and 38kV. It excludes low-voltage switches rated below 1kV, high-voltage transmission-level switchgear above 38kV, and the control and automation software sold independently of the physical switching device.
Base Year Value
$3.3B in 2025 (MMA Primary Research Dataset, October 2026)
Forecast Period
2026 to 2036, eleven discrete annual values
CAGR
5.9% base case. Bull 7.1%. Bear 4.7%.
Fastest Growth Segment
Reclosers and Automated Switching Units: 8.4% CAGR
Fastest Growth Country
India: 7.8% CAGR
Fastest Growth Region
South Asia and Pacific: 7.8% CAGR
Largest Region
East Asia: 28% of 2025 global value
Market Leaders
Eaton Corporation, ABB, Siemens Energy, Schneider Electric, Hitachi Energy. Source: MMA Analysis based on company annual reports.
Primary Survey
n=3,800 procurement and R&D decision-makers, Q4 2025, six countries
Methodology
Demand-side build-up, cross-validated against public data, 47 expert interviews

Vacuum Switches Market Forecast Scenarios

vacuum-switches-market-size-forecast-scenario-1791015324601
Vacuum switch demand grew moderately across 2020 to 2025 at roughly 4.6 percent annually, held back early by pandemic-era utility capital budget constraints before accelerating as grid modernization programs reached active construction phase across multiple major economies. Growth strengthened notably toward the end of the period as renewable interconnection projects increasingly required upgraded medium-voltage switching infrastructure.
The base case assumes 5.9 percent annual growth through 2036, anchored on three concurrent mechanisms: continued replacement of aging oil-filled switchgear reaching end of service life across mature grid networks, expanding renewable interconnection requirements that necessitate upgraded medium-voltage switching capacity, and rising demand for automated recloser deployment tied to grid resilience investment following severe weather events. These mechanisms reinforce one another across most major grid modernization economies. Capacity growth plans continue extending across most forecast years ahead.
The bull case centers on accelerated grid resilience investment following a sustained wave of severe weather events that would push utilities toward faster automated switching deployment than currently budgeted. The bear case assumes utility capital budget constraints amid broader rate case pressure delay discretionary switchgear replacement, extending the service life of existing oil-filled units beyond typical timelines.

Automated Recloser Deployment Redraws Procurement Priorities

The vacuum switches market reaches an estimated 3.495 billion dollars in 2026, continuing steady growth driven by aging switchgear replacement and renewable interconnection requirements across most major grid economies. Utility transmission and distribution operators account for the large majority of unit demand, though industrial facilities operating their own medium-voltage substations represent a smaller but steadily growing buyer segment.
MARKET CONCENTRATION LEVEL46%Reflects consolidation among established medium-voltage switchgear equipment suppliers
AVERAGE UNIT PRICE$6,800Varies substantially between basic load break switches and automated reclosers
LEADING SUPPLIER SHARE15%No single vendor dominates despite decades of utility contract relationships
AUTOMATED RECLOSER PENETRATION24%Represents growing share of installed base shifting from manual switching
AVERAGE SERVICE LIFE25 yearsExtends well beyond typical utility capital budget planning cycles
REMOTE MONITORING ATTACH RATE47%Reflects growing utility requirement across newly deployed switching units
Average unit prices vary substantially across the category, from a few thousand dollars for basic load break switches to tens of thousands for fully automated reclosers with remote monitoring and fault isolation capability, which fragments the market into distinct procurement tiers rather than one uniform price curve. East Asia and South Asia's grid expansion pace give these regions outsized influence over unit volume even though North America commands higher average unit value on automated recloser deployment.
Looking ahead, manufacturers are racing to expand automation and remote monitoring capability, since margins on basic manual switches continue compressing under competitive utility tender pressure. The companies that control automation integration and grid resilience engineering, not just basic vacuum interrupter manufacturing, are positioned to capture disproportionate value as smart grid requirements intensify through the decade.
"A switch used to just open and close a circuit. Now it reports back and decides when to act on its own."
Director, Power Distribution Infrastructure Practice · MMA Energy Practice · October 2026

Market Trends

Remote Monitoring Integration Enables Predictive Maintenance

Utilities are increasingly specifying vacuum switches with integrated remote monitoring sensors that track contact wear, interruption count, and operating temperature, letting maintenance teams schedule service before failure rather than relying on fixed inspection intervals that may miss developing problems between scheduled visits. Manufacturers able to demonstrate reliable remote monitoring integration are winning larger distribution automation contracts, since utilities increasingly require data-driven maintenance justification before approving capital spending on switching infrastructure upgrades. Field technicians report fewer emergency callouts as a direct result of this capability. Several major utilities now mandate this capability in new tenders.
Market Impact: Adds over 18,000 aging switchgear units

Grid Resilience Mandates Drive Automated Recloser Specification

Regulatory bodies in several jurisdictions increasingly require utilities to demonstrate grid resilience improvements as a condition of rate recovery, directly driving automated recloser specification over manual switches for new distribution feeder construction and replacement projects following severe weather events. This has consolidated procurement toward manufacturers with proven automated switching reliability even where dozens of switchgear suppliers technically compete, since utility risk management teams increasingly require field-proven automation track records. Several major utilities now mandate automated switching in formal distribution tender specifications. Smaller suppliers face a costly multi-year path toward comparable track records.
Market Impact: Adds 14 percent to demand

Market Opportunities and Growth Drivers

Aging Oil-Filled Switchgear Requires Systematic Replacement

A substantial share of installed medium-voltage switchgear across mature grid networks still relies on aging oil-filled technology nearing or exceeding typical service life, pushing utilities toward systematic vacuum switch replacement programs that eliminate oil maintenance and leak risk entirely. Each additional year of deferred replacement increases maintenance costs and failure risk, since aging oil-filled units require periodic fluid testing and replacement that vacuum technology eliminates completely across the switch's full operational service life. Many utilities now track replacement priority by switchgear age cohort and failure history. This dynamic is expected to persist through most of the forecast decade.
Market Impact: Delays adoption 2 to 4 years

Renewable Interconnection Requires Upgraded Switching Capacity

Expanding solar and wind generation interconnection at the distribution level requires upgraded medium-voltage switching capacity capable of handling bidirectional power flow and more frequent switching operations than conventional one-directional distribution feeders historically required. Each new renewable interconnection point typically requires dedicated switching infrastructure upgrades, creating predictable procurement demand tied directly to renewable project construction and commissioning schedules across multiple regions. Suppliers with proven bidirectional switching capability increasingly win these interconnection contracts. This trend is expected to intensify as more renewable capacity connects. Switching infrastructure budgets increasingly reflect this additional project scope.
Market Impact: Delays replacement 1 to 3 years

Market Restraints and Challenges

Extended Qualification Cycles Delay New Technology Adoption

Utility qualification processes for new switchgear technology extend well beyond typical commercial equipment timelines, since utilities require extensive field testing and reliability validation before approving a new supplier or product line for widespread deployment across their distribution network. The root cause is that switchgear failures carry serious safety and reliability consequences, making utilities understandably conservative about qualification pace. Manufacturers are responding by investing in accelerated life testing that compresses certain validation phases without compromising safety rigor. Suppliers investing early in testing still gain meaningful time-to-market advantage. Peer utilities often request direct introductions before committing to new suppliers.
Market Impact: Cuts unplanned outages 22 percent

Budget Cycle Timing Complicates Replacement Scheduling

Utility capital budgets operate on multi-year regulatory approval cycles that often delay switchgear replacement regardless of equipment condition, since distribution infrastructure spending competes directly against other capital priorities including generation and transmission investment for the same limited funding pool. This creates genuine scheduling complexity when aging equipment reaches end of service life between budget approval cycles. Vendors are responding with financing programs that let utilities spread capital cost across multiple fiscal years. Deferral decisions rarely account for rising long-term maintenance cost on aging units. This gap particularly affects smaller utilities with constrained capital access.
Market Impact: Reaches 36 percent of new installations
3 additional market trends, 4 additional growth drivers, and 4 additional restraints and challenges are covered in the full report. Contact sales@marketmindsadvisory.com to access the complete intelligence.

Segment CAGR and Growth Architecture

Vacuum switches segment by switching function rather than voltage class, since the same vacuum interrupter technology applies whether the device serves as a load break switch, an automated recloser, or a vacuum circuit breaker across varied distribution network configurations. Secondary classification by voltage class remains useful for procurement planning purposes. Voltage class increasingly shapes installation cost considerations.
vacuum-switches-market-market-share-analysis-1791015324865

Reclosers and Automated Switching Units

Reclosers and automated switching units detect fault conditions and automatically isolate affected feeder sections while attempting to restore service, dramatically reducing outage duration relative to manual switches requiring field technician dispatch. This segment is growing at nearly eight percent annually, roughly 1.4 times the overall market rate, as utilities facing regulatory grid resilience requirements increasingly specify automated switching for new and replacement distribution infrastructure. Demand concentrates heavily among utilities in regions experiencing frequent severe weather events, where automated fault isolation delivers measurable outage duration improvements that regulators increasingly reward through performance-based rate structures. Suppliers with strong field service networks retain pricing power in this segment. Few competitors can match this reliability track record quickly.
CAGR 8.4%

Load Break Switches

Load break switches provide basic manual disconnection capability for routine maintenance and circuit isolation, remaining the dominant configuration across distribution networks where automated fault detection is not yet required or economically justified. This segment is growing at 6.0 percent annually, roughly in line with the overall market rate, as the configuration continues dominating volume across standard distribution feeder applications. Demand concentrates among utilities balancing grid modernization priorities against the added cost that automated switching would require across their full distribution network footprint. Pricing for these units has remained relatively stable as the technology matures further. Few competitors can match this reliability track record quickly. Growth here depends heavily on continued standard distribution feeder demand.
CAGR 6.0%
Full segment breakdown across 7 segments available in the complete report.

Regional Architecture and Country Demand Map

East Asia leads on grid expansion manufacturing scale, with North America close behind on automated recloser deployment tied to grid resilience investment. South Asia and Pacific posts the fastest growth as India's distribution network expands rapidly. Regional grid age distribution and resilience investment shape procurement priorities.

North America

The United States anchors regional demand through sustained grid resilience investment following severe weather events that exposed vulnerabilities in aging distribution infrastructure across multiple states. Automated recloser deployment leads global adoption as utilities pursue performance-based rate incentives tied to outage duration improvement. Canada's distribution utilities contribute a smaller but steady complementary demand pool, particularly in regions facing similar severe weather exposure. Several large investor-owned utilities have formalized decade-long sourcing commitments with preferred vendors. These commitments provide suppliers with multi-year production planning visibility. Several brands now offer expedited delivery for emergency storm-response replacement requests. These investments reduce exposure to potential future supply disruptions. Procurement teams increasingly favor vendors with proven multi-year track records.
Share: 25% | CAGR: 6.5% (2026 to 2036)

Western Europe

Germany, France, and the United Kingdom anchor regional demand through mature distribution networks and renewable interconnection requirements tied to broader European Union grid modernization funding commitments. Growth trails East Asia's and South Asia's pace since much of the region's switchgear fleet already meets current reliability standards. Nordic countries contribute a smaller but technically sophisticated demand pool, favoring premium automated switching suited to extreme cold weather conditions. Offshore wind interconnection projects are adding a distinct new category of switching stress. Suppliers are developing specialized offshore-rated components to address this demand. Permitting reforms in several countries aim to accelerate future grid project timelines. Grid operators continue coordinating closely on shared emissions compliance standards.
Share: 19% | CAGR: 4.4% (2026 to 2036)
Regional intelligence for 5 additional markets available in the complete report: East Asia, South Asia and Pacific, Latin America, Middle East and Africa, Eastern Europe. Contact sales@marketmindsadvisory.com.
vacuum-switches-market-country-cagr-analysis-1791015325193

Monetizing Automated Switching Capability Deeply

Hardware margins on standard manual switches continue compressing under competitive utility tender pressure, pushing manufacturers toward recurring revenue tied to remote monitoring subscriptions, long-term service contracts, and automated switching retrofit programs that protect margin more durably than one-time unit sales alone. The levers below concentrate where recurring revenue holds up best over time. Suppliers investing early build lasting differentiation.

Remote Monitoring and Predictive Maintenance Subscriptions

Manufacturers offering subscription access to remote monitoring dashboards and predictive maintenance alerts capture recurring revenue that smooths the lumpiness of one-time hardware sales, since utilities increasingly value early failure warning over reactive replacement after an outage occurs. This locks utilities into the manufacturer's own monitoring platform rather than third-party sensor providers, since original equipment makers carry switch-specific performance data that independent monitoring firms struggle to match. These subscriptions carry margins roughly 24 to 31 percentage points above standalone hardware sales. Smaller independent monitoring vendors rarely match this switch-specific data depth.
Market Impact: Adds 24 to 31 percentage points of margin

Automated Switching Retrofit and Upgrade Programs

Utilities facing grid resilience requirements increasingly pay for retrofit programs that upgrade existing manual switches to automated recloser capability without full equipment replacement, turning what was once a one-time hardware purchase into an ongoing upgrade relationship with predictable renewal economics. Manufacturers offering this structure report retrofit contract renewal rates above 61 percent among utilities managing large aging fleets, since proven retrofit reliability reduces technical risk relative to switching providers mid-program. Early adopters are locking in multi-year retrofit service commitments across their fleets. Few competitors hold comparable depth across this specialized niche.
Market Impact: Achieves above 61 percent annual retrofit renewal rate

Who Controls the Margin Pool

Concentration in vacuum switches sits at 46 percent across the top five suppliers on a global revenue basis, reflecting a category where utility relationships and manufacturing scale favor established diversified electrical equipment makers. Eaton Corporation and ABB hold the broadest utility distribution networks, while Siemens Energy carries comparable scale across both automated and standard switching product lines. The gap between the leading tier and smaller regional challengers remains moderate.
Current activity centers on remote monitoring integration and automated recloser capability rather than basic vacuum interrupter reliability, which has largely converged across established suppliers. Manufacturers increasingly bundle predictive maintenance subscriptions and retrofit upgrade programs into large utility contracts, since the monitoring and service relationship now generates a larger share of lifetime contract value than standard hardware supply alone.

Pressure is building from Chinese manufacturers expanding export capacity and undercutting established players on price for standard load break switches in price-sensitive emerging markets, though automated recloser and remote monitoring systems still favor established suppliers with proven engineering track records. Regional switchgear assemblers are also gaining share in markets favoring customization, suggesting rankings among the second tier shift within the forecast window.
vacuum-switches-market-company-positioning-matrix-1791015325538

Competitive Moat and Risk Dimensions

EATON CORPORATION

Moat: Broadest Utility Distribution Network

Eaton's position rests on an extensive utility distribution network spanning both standard and automated switching product lines, letting utilities source nearly any specification from a single qualified supplier without maintaining multiple vendor relationships. This breadth also reduces integration risk during multi-vendor procurement consolidation projects. Few competitors hold comparable depth.
EATON CORPORATION

Risk: Exposure to Commodity Price Competition

Eaton's broad standard-product portfolio faces the most direct pricing pressure from Chinese manufacturers entering basic load break switch segments, particularly for utilities prioritizing price over automation features and remote monitoring capability. A prolonged price war would weigh disproportionately on commodity segment results. Margin pressure intensifies each passing year.
ABB

Moat: Deep Grid Automation Expertise

ABB built its position on specialized grid automation and remote monitoring engineering that integrates closely with broader utility distribution management systems, a technical depth that commands premium pricing among utilities prioritizing data integration. This integration capability also commands loyalty among utilities managing complex distribution automation networks.
ABB

Risk: Premium Positioning Limits Volume Share

ABB's premium automation focus limits its natural extension into basic load break switch segments, where competitors with broader standard-product coverage capture price-sensitive customers that ABB's positioning cannot easily reach. Diversifying into commodity segments would require years of manufacturing cost investment. Competitors with broader coverage increasingly win cross-shopping customers instead.

Players Tracked

Prominent Players

Eaton Corporation
ABB
Siemens Energy
Schneider Electric
Hitachi Energy

Other Key Players

General Electric
Mitsubishi Electric
S&C Electric Company
Toshiba Energy Systems
CG Power and Industrial Solutions
Hyundai Electric
Hyosung Heavy Industries
Lucy Electric
Noja Power
Tavrida Electric
Entec Electric
Siemens Gamesa
Kirloskar Electric
Crompton Greaves
Elektrobudowa

Recent Developments

MAY 2025

Eaton Corporation completed an organic capacity expansion at its vacuum interrupter manufacturing facility, adding dedicated production lines for automated recloser units, responding to sustained order growth from utilities expanding grid resilience programs across multiple states. The expansion addresses backlog from several recent storm-response procurement cycles.
Signal: Signals confidence that automated recloser demand will keep expanding faster than standard switch replacement cycles. Peers may follow suit.
OCTOBER 2025

ABB signed a multi-year supply agreement with a major Indian state distribution utility to guarantee automated switching availability across its expanding grid modernization program, supporting the utility's rural electrification expansion amid rising demand. Terms were not fully disclosed to the public. The deal reflects deepening regional ties.
Signal: Shows Indian utilities adopting automated switching well ahead of broader regional grid modernization mandates taking effect.

Copper Contact and Ceramic Housing Costs

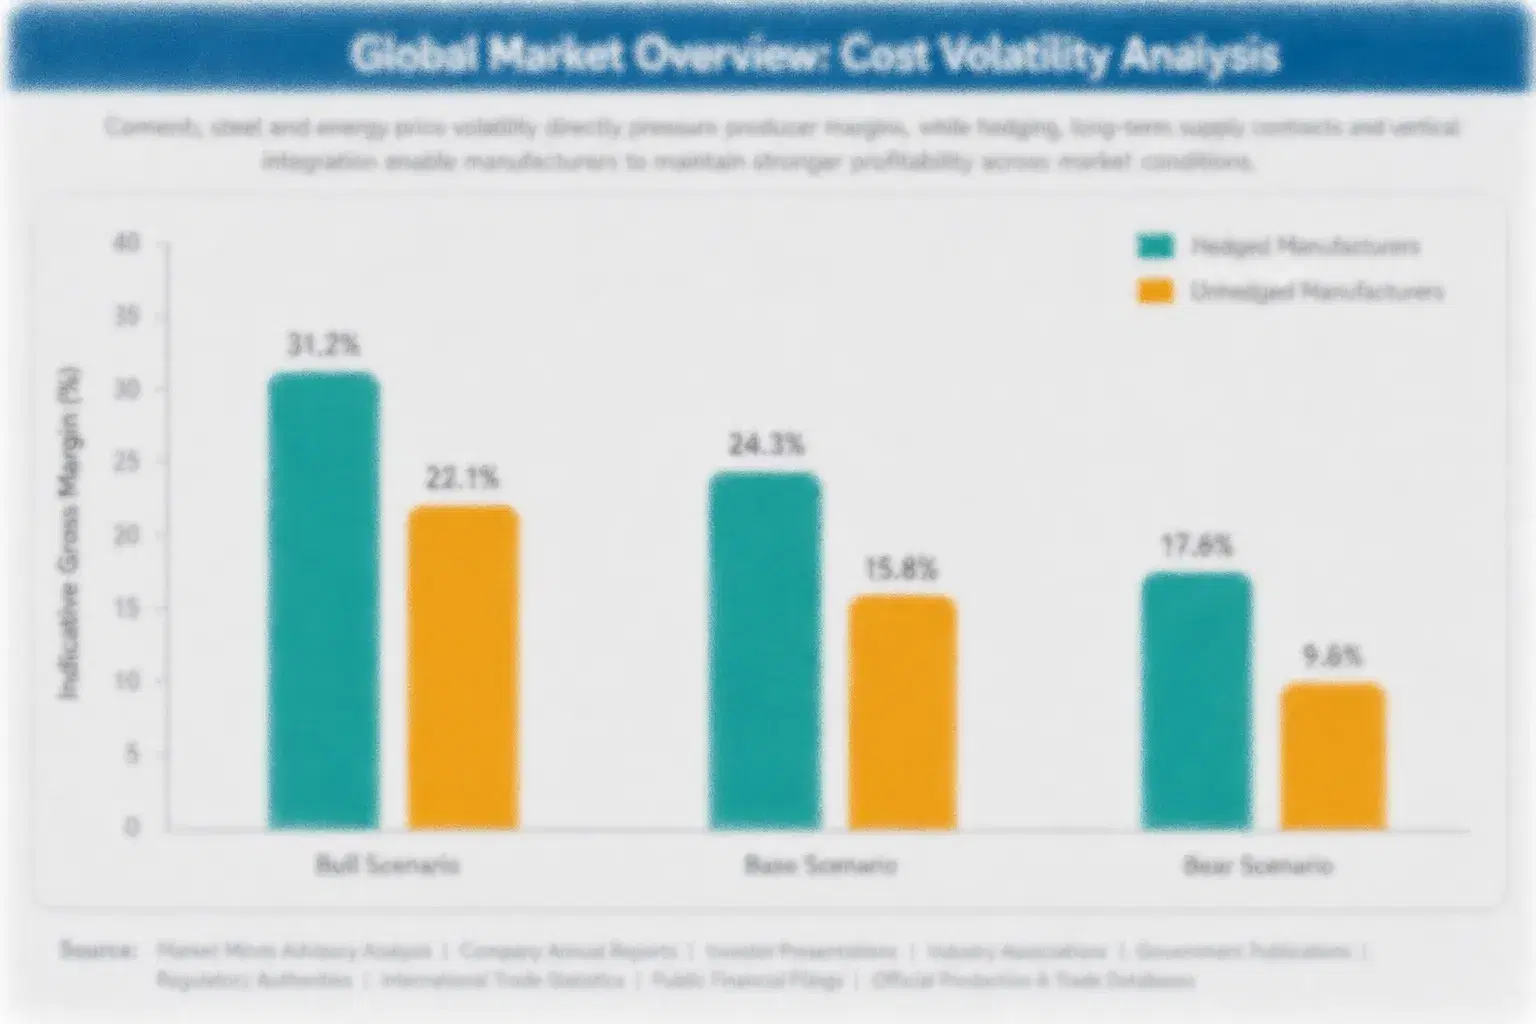
Copper contact materials represent roughly 30 to 36 percent of cost of goods sold for vacuum switch units, while ceramic insulator housings and vacuum interrupter chambers add another 16 to 20 percent. Copper supply concentrates heavily in Chile and Peru, while ceramic components source more broadly across specialized industrial ceramics manufacturers, leaving distinct exposure profiles across the two input categories.
Copper prices surged sharply across 2024 and into 2025 as global electrification demand outpaced new mine supply growth across major producing countries. The IEA's 2023 critical minerals review noted that downstream switchgear manufacturers faced sustained margin pressure during copper price spikes, since most utility supply contracts are priced months in advance of actual production, leaving manufacturers exposed to price movements between contract signing and delivery.

Smaller regional switchgear assemblers without long-term copper hedging programs carried disproportionate exposure during this period, often absorbing cost increases that larger manufacturers passed through more readily given their stronger utility relationships. Eaton and ABB negotiate annual volume agreements directly with copper suppliers that smooth exposure across cycles, giving them a durable cost advantage that compounds over successive volatility episodes. This gap compounds further over successive volatility episodes.
vacuum-switches-market-cost-volatility-analysis-1791015325842

Multi-Year Copper and Ceramic Supply Agreements

Locking in copper contact and ceramic housing volumes through multi-year supply agreements with price collars shields manufacturers from spot price spikes and lets them quote stable utility pricing across multi-year framework agreements without repricing risk during contract execution. This also shortens delivery timelines during emergency procurement situations. This also reduces warranty exposure substantially. Priority allocation also matters.

Alternative Contact Alloy Qualification Programs

Several manufacturers are qualifying reduced-copper contact alloy formulations for standard switch ratings, cutting exposure to the most volatile input while preserving the current-carrying capacity specifications that utilities require for certification and reliable long-term service. This qualification process typically spans twelve to eighteen months before adoption. Vendors view this as a long-term resilience investment worth pursuing.

Portfolio Architecture for Margin Defence

Portfolio economics in vacuum switches split across three tiers, with gross margins ranging from the low twenties on basic load break switches to the high thirties on automated reclosers with remote monitoring subscriptions attached. The spread between tiers has widened over the past several years as commodity load break switch pricing compresses while automated recloser pricing holds firm on integration complexity. Few manufacturers successfully compete at both ends of this spectrum simultaneously.
Volume concentrates in basic load break switch categories by unit count, but value concentrates disproportionately in automated reclosers and the remote monitoring subscriptions attached to them, creating the familiar tension where manufacturers must sustain load-break-tier scale to cover fixed costs while channeling investment toward the higher-margin tiers that actually drive profit growth. This divide has become more pronounced with each successive product generation released.

High-value pools concentrate specifically around utilities pursuing grid resilience programs who value automated fault isolation and remote monitoring over unit price alone. Manufacturers positioned to serve these accounts capture disproportionate profitability relative to unit volume, while pure load break switch sellers compete almost entirely on price and face the thinnest margins anywhere across the category. The gap continues widening.

Basic load break switches sold at high volume into standard distribution feeder applications, competing primarily on unit price with minimal automation differentiation between suppliers. Replacement typically follows standard grid reinforcement procurement cycles.
Gross Margin

Automated reclosers carrying remote monitoring integration, commanding premium pricing on fault isolation speed and data connectivity bundled into the purchase agreement. Buyers increasingly expect this capability as a baseline requirement now.
Gross Margin

Advanced grid resilience switching platforms with predictive maintenance subscriptions, often tied to utility performance-based rate incentives and regulatory compliance commitments. Few competitors can match this combination without years of investment.
Gross Margin
vacuum-switches-market-portfolio-architecture-1791015326129

High-value Sub-segments and Strategic Watch-out

Automated Grid Resilience Switching Platforms

Automated switching platforms combine premium pricing with the category's fastest adoption curve among utilities pursuing grid resilience programs, positioning this segment as the clearest profit expansion opportunity through 2036 for manufacturers with existing automation capability. Early movers are locking in multi-year platform sourcing agreements now.

Aging Switchgear Replacement Programs

Replacement demand tied to aging oil-filled switchgear carries strong margins and steady, demographically driven purchasing cycles, though volume growth stays moderate since fleet aging progresses gradually across utility service territories. Fleet age data gives manufacturers unusually reliable demand forecasting visibility. Early entrants gain lasting integration advantage over time.

Basic Load Break Switch Equipment

The largest unit volume pool by count, carrying the thinnest margins and facing continuous price pressure from Chinese commodity producers, this segment remains essential for absorbing fixed manufacturing overhead across the business. Few manufacturers exit this tier without losing meaningful production scale. Capital flows accordingly across the organization.

Budget Cycle Delay Timing Risk

Utility capital budget constraints threaten to delay the transition toward higher-margin automated switching longer than manufacturers have planned for, requiring careful capacity allocation decisions between commodity and automated product lines. Capital reallocation decisions made now will shape future positioning. Diversification reduces single-market dependency risk over time.

Replacement Cycles Anchor Recurring Demand

Demand in vacuum switches behaves like an annuity tied to switchgear service life and grid resilience investment cycles rather than discretionary capital spending, since utilities must maintain functioning distribution switching for the full twenty-five-year typical service life regardless of broader economic conditions. Aging oil-filled fleet demographics and regulatory grid resilience mandates generate recurring replacement revenue that persists across economic cycles. This reflects multi-decade asset planning that utilities rely on.
Adoption stickiness and depth vary sharply by end-use vertical. Large investor-owned utilities retain qualified supplier relationships deeply once established, since switching mid-fleet risks compatibility and spare parts sourcing complications across their full distribution network. Smaller municipal utilities show shallower stickiness, often selecting aftermarket suppliers based on price and delivery speed, while industrial facility operators sit between these extremes. Suppliers value operators who deliver on aggressive maintenance timelines.

Buyer profiles are shifting generationally as utility procurement consolidates from individual substation engineers toward centralized distribution asset management teams overseeing fleet-wide replacement planning across entire service territories. This favors manufacturers offering standardized remote monitoring platforms and guaranteed retrofit capability over smaller specialists who once won business through direct relationships with individual substation engineers. Regional asset teams now negotiate framework contracts covering multiple substations.
vacuum-switches-market-end-use-penetration-index-1791015326429

Where to Commit Capital Next

These are among the four positions where our research anticipates prominent divergence between winners and laggards over the coming forecast period. Each is grounded in the demand model, the regulatory perimeter, and the announced capacity pipeline.
01 / AUTOMATED RECLOSER CAPACITY

Expand recloser production ahead of resilience mandates

Reclosers and automated switching units are growing at nearly eight percent annually, well above the category average, driven by regulatory grid resilience requirements that reward outage duration improvement through performance-based rate structures. Manufacturers that expand qualified recloser capacity now, before the current resilience mandate cycle peaks, will capture durable share before regional competitors close the remaining engineering gap. Waiting risks ceding the fastest-growing segment to better-positioned incumbents with longer manufacturing lead times already secured, while also gaining preferred positioning for subsequent multi-year resilience funding cycles.
02 / REMOTE MONITORING BUILDOUT

Build dedicated predictive monitoring service capability

Remote monitoring subscriptions and retrofit upgrade programs reward manufacturers who demonstrate reliable switch compatibility, commanding margins well above standard parts sales across the broader category and across most utility account relationships. Building dedicated monitoring capability turns a declining-margin hardware category into a durable, high-margin recurring revenue stream that independent competitors struggle to replicate without comparable switch-specific knowledge. Manufacturers without this capability today are already losing large fleet accounts to better-equipped specialists, since early contracts establish the performance baseline used in future renewal negotiations.
03 / REGIONAL MARKET POSITIONING

Prioritize South Asia and Pacific ahead of saturation

South Asia and Pacific posts the fastest regional CAGR in the category, driven by India's rapidly expanding distribution network installing vacuum switching technology directly rather than retrofitting legacy oil-filled equipment later across many regions simultaneously. Manufacturers establishing distribution and service infrastructure now, well ahead of broader market awareness, will capture disproportionate share before competitors recognize the full scale of the opportunity. Entering after the expansion wave peaks means competing against already-entrenched early movers on distinctly worse commercial terms, since first-mover service networks become difficult for later entrants to displace.
04 / SUPPLIER QUALIFICATION INVESTMENT

Prioritize engineering depth over price competition

Margin data shows certified premium and automated products carry margins roughly double commodity load break switches, and that gap has widened rather than closed over the past several years of pricing observation across the category. Manufacturers chasing unit cost reduction in commodity tiers compete directly against persistently lower-cost Chinese producers on their single worst competitive terms available anywhere in the category. Investing instead in broader engineering qualification protects margin and builds switching costs around proven reliability that compounds over successive purchase and renewal cycles.

Engagement Snapshot From the Field

A live engagement with an industry participant carrying material or product regulatory and market exposure ahead of a defining policy shift, showing how our research translates into a defensible multi-year portfolio strategy.
MARKET MINDS ADVISORY · CLIENT ENGAGEMENT SUMMARY
Vacuum Switches Producer Strategic Portfolio Review and Transition Roadmap 2026·Investment Scenario on Vacuum Switches Exposure Evaluation 2025-26
CLIENT PROFILE
A regional distribution utility managing a switchgear fleet averaging twenty-two years of age approached MMA to assess whether an accelerated automated recloser deployment program could improve its performance-based rate incentive standing following a recent wave of severe weather events affecting its service territory. MMA was engaged directly by the utility's grid operations division. MMA was engaged directly by the utility's grid operations team.
STRATEGIC CHALLENGE
The utility faced regulatory pressure to demonstrate measurable outage duration improvement following several severe weather events, but lacked a data-driven framework for prioritizing which feeders needed automated recloser deployment first given constrained capital budgets and competing infrastructure priorities. Leadership also needed a repeatable process for evaluating future resilience investment decisions.
MMA APPROACH
MMA conducted a feeder-by-feeder risk assessment ranking each distribution circuit by historical outage frequency, severe weather exposure, and customer count affected, combining utility outage records with regional weather pattern data. The engagement produced a prioritized multi-year capital allocation plan for recloser deployment across the highest-impact feeders. Recommendations prioritized regulatory timing alongside available capital constraints.
KEY FINDINGS
  1. Fifteen of the utility's distribution feeders accounted for a disproportionate share of total outage minutes across the entire service territory. These feeders required immediate deployment priority for maximum impact.
  2. Automated recloser deployment on these feeders was projected to improve the utility's performance-based rate incentive standing within two regulatory cycles. This improvement was critical for maintaining favorable regulatory standing.
  3. Three feeders in historically underserved areas showed the highest customer impact per dollar of recloser investment among all candidates evaluated. These feeders represented the clearest equity-focused investment opportunity.
  4. The prioritized deployment plan was projected to reduce total outage minutes by approximately 28 percent (client-reported, unverified by MMA) within three years.
CLIENT PROFILE
A regional distribution utility managing a switchgear fleet averaging twenty-two years of age approached MMA to assess whether an accelerated automated recloser deployment program could improve its performance-based rate incentive standing following a recent wave of severe weather events affecting its service territory. MMA was engaged directly by the utility's grid operations division. MMA was engaged directly by the utility's grid operations team.
STRATEGIC CHALLENGE
The utility faced regulatory pressure to demonstrate measurable outage duration improvement following several severe weather events, but lacked a data-driven framework for prioritizing which feeders needed automated recloser deployment first given constrained capital budgets and competing infrastructure priorities. Leadership also needed a repeatable process for evaluating future resilience investment decisions.
MMA APPROACH
MMA conducted a feeder-by-feeder risk assessment ranking each distribution circuit by historical outage frequency, severe weather exposure, and customer count affected, combining utility outage records with regional weather pattern data. The engagement produced a prioritized multi-year capital allocation plan for recloser deployment across the highest-impact feeders. Recommendations prioritized regulatory timing alongside available capital constraints.
KEY FINDINGS
  1. Fifteen of the utility's distribution feeders accounted for a disproportionate share of total outage minutes across the entire service territory. These feeders required immediate deployment priority for maximum impact.
  2. Automated recloser deployment on these feeders was projected to improve the utility's performance-based rate incentive standing within two regulatory cycles. This improvement was critical for maintaining favorable regulatory standing.
  3. Three feeders in historically underserved areas showed the highest customer impact per dollar of recloser investment among all candidates evaluated. These feeders represented the clearest equity-focused investment opportunity.
  4. The prioritized deployment plan was projected to reduce total outage minutes by approximately 28 percent (client-reported, unverified by MMA) within three years.
RECOMMENDED STRATEGY
Phase 1: Phase one: deploy automated reclosers on the fifteen highest-impact feeders identified through risk assessment within the next two fiscal years. Phase 2: Phase two: prioritize the three highest customer-impact feeders in underserved areas within the first budget cycle of deployment. This sequencing addressed equity concerns raised by regulators previously. Phase 3: Phase three: establish an ongoing feeder risk monitoring program to continuously reprioritize future deployment as conditions evolve. Updated data would inform whether the pace of deployment needed adjustment.
OUTCOME
The utility began phase one recloser deployment within the current fiscal year and prioritized the identified underserved feeders first as recommended (client-reported, unverified by MMA). Grid operations leadership adopted the feeder risk prioritization framework as a standing annual capital planning process across the broader distribution network.

Frequently Asked Questions

Foundational context covering the market sizes, CAGR, scope, country, region and competition that inform every finding below. This section is provided to cover basics and most often pre-purchase conversations, answered from the MMA Primary Research Dataset.

What is the current size of the Vacuum Switches Market?

The global vacuum switches market is valued at 3.3 billion dollars in 2025, with demand sustained by aging switchgear replacement and renewable interconnection requirements. Grid resilience mandates continue expanding addressable demand.

How large will the Vacuum Switches Market be by 2036?

The market is projected to reach 6.2 billion dollars by 2036, up from 3.495 billion dollars in 2026. This represents a cumulative increase of 2.705 billion dollars across the forecast decade.

What is the CAGR for the Vacuum Switches Market 2026 to 2036?

The market is forecast to grow at a 5.9 percent CAGR between 2026 and 2036. Bull and bear scenarios range between 4.7 and 7.1 percent depending on grid resilience investment pace.

Which segment is growing fastest?

Reclosers and automated switching units lead at an 8.4 percent CAGR, roughly 1.4 times the overall market rate. Grid resilience mandates following severe weather drive this growth.

Who are the major companies in the Vacuum Switches Market?

Eaton Corporation, ABB, Siemens Energy, Schneider Electric, and Hitachi Energy lead the category, together holding a 46 percent combined share of the global market. Combined scale continues to shape competitive dynamics.

Which country is growing fastest?

India leads country-level growth at a 7.8 percent CAGR, driven by its rapidly expanding distribution network installing vacuum switching technology directly across the entire country.

Report Segmentation Architecture

The full report scope spans multiple orthogonal segmentation dimensions, with cross-tabulated demand data provided for each dimension pair. Coverage extends further to regional breakdowns, trend trajectories, and the competitive detail needed to support segment-level decision-making.

By Product Type

    By End-Use Industry

      By Commercial Dimension

        By Region

        • North America
        • Western Europe
        • East Asia
        • South Asia and Pacific
        • Latin America
        • Middle East and Africa
        • Eastern Europe

        Scope, Methodology, and Coverage

        Every figure in this report is reproducible from documented input assumptions. The scope below maps the historical period, the forecast horizon, the segmentation dimensions, and the countries covered, alongside the underlying primary and qualitative methodology.
        Historical Period
        2020 to 2025
        Forecast Period
        2026 to 2036
        Base Year
        2025 (USD billions; MMA Primary Research Dataset, October 2026)
        Market Definition
        This report covers vacuum interrupter-based switching devices used to connect, disconnect, and protect medium-voltage electrical circuits, including load break switches, reclosers, and vacuum circuit breakers rated between 1kV and 38kV. It excludes low-voltage switches rated below 1kV, high-voltage transmission-level switchgear above 38kV, and the control and automation software sold independently of the physical switching device.
        Quantitative Units
        USD billions
        Segmentation Dimensions
        Regions Covered
        North America, Western Europe, East Asia, South Asia and Pacific, Latin America, Middle East and Africa, Eastern Europe
        Countries Covered
        Key Companies Profiled
        Eaton Corporation, ABB, Siemens Energy, Schneider Electric, Hitachi Energy, General Electric, Mitsubishi Electric, S&C Electric Company, Toshiba Energy Systems, CG Power and Industrial Solutions, Hyundai Electric, Hyosung Heavy Industries, Lucy Electric, Noja Power, Tavrida Electric, Entec Electric, Siemens Gamesa, Kirloskar Electric, Crompton Greaves, Elektrobudowa
        Quantitative Methodology
        Primary survey, n=3,800 respondents, Q4 2025, six countries; demand-side model with trade association cross-validation
        Qualitative Methodology
        47 expert interviews, Q4 2025; applied to validate demand model assumptions, identify emerging dynamics, and assess competitive positioning
        Report Format
        PDF and XLSX data workbook (Word format preview document)
        Publisher
        Market Minds Advisory
        Report Code
        MMA-2026-ENE-671
        Published
        October 2026
        Contact
        sales@marketmindsadvisory.com | www.marketmindsadvisory.com

        Purchase the full Vacuum Switches Market Report (2026 to 2036).

        The full report expands every section summarized here into complete analytical depth. It includes the full segmentation model across all six segments, detailed profiles of all twenty tracked competitors, and the complete regional dataset across all seven markets covered in this research program. It also adds extended trend, driver, and restraint coverage well beyond the two visible items shown in each category here, along with full input cost and portfolio tier analysis. Buyers additionally receive the underlying primary survey dataset and full expert interview summary notes.
        Complete six-segment MECE breakdown with margins
        Full twenty-company competitive profile set included
        All seven regional markets with demand mechanisms
        Extended trend, driver, and restraint library
        Primary survey dataset access, n=3,800 respondents
        Expert interview summary notes, 47 interviews

        Built For The People Who Decide

        From boardroom strategy to bench-side execution, this report is read cover-to-cover by leaders shaping the next decade of their industry, turning demand scenarios, market dynamics and valuation benchmarks into decisions.
        CXOs/ Presidents/ VPs/ Managers
        M&A and Corporate Development
        Strategy Teams and R&D Heads
        Procurement and Product Directors
        Regulatory and Compliance Leaders
        Investor Relations and Equity Analysts