Market Minds Advisory
Vacuum Pressure Impregnated (VPI) Transformer Market

Vacuum Pressure Impregnated (VPI) Transformer Market: Vacuum Pressure Impregnated (VPI) Transformer Market. Global Demand, Technology, and Competitive Outlook 2026 to 2036

Fire safety codes and data center power growth are pulling specification toward VPI dry-type designs faster than domestic winding capacity can scale, forcing manufacturers to compete on lead time as much as efficiency ratings.

Lead Analyst

Published

October 2026

Make Smarter Decisions with Customized Research Insights

Request a free sample report and evaluate market opportunities, growth trends, and competitive dynamics relevant to your business needs.

2025 MARKET VALUE$2.4BMarket Size 2025
2036 FORECAST VALUE$5.0BBase Case , 2026 to 2036
CAGR 2026 TO 20366.9 %Bull 8.1% / Bear 5.7%
INCREMENTAL OPPORTUNITY$2.4BNet 10- year value creation
EXPANSION MULTIPLE1.95x2036 value over 2026 base
Strategic Levers
M&A Pipeline
Regional Outlook
Country Rankings
Competitive Intelligence
Segmental Deep-dive
Call-Us : 91 93563 13602

Executive Snapshot and Market Trajectory.

VPI transformer demand is shifting from standard industrial distribution applications toward renewable energy and data center power infrastructure, as fire safety codes increasingly favor dry-type designs over oil-filled alternatives in sensitive locations. Suppliers unable to demonstrate large-scale winding reliability risk losing relationships to specialists. Lead times stretch.
China's renewable energy buildout and general manufacturing scale anchor the largest absolute volume globally, while North American data center construction sustains the fastest developed-market growth tied to AI infrastructure power requirements. VPI transformers for renewable energy applications are growing fastest as wind and solar capacity additions require step-up transformers meeting increasingly stringent fire safety and environmental standards at substation sites. Mixed demand channels are straining winding capacity across the industry. Timelines extend accordingly.
Competitive intensity concentrates among a handful of established global electrical equipment manufacturers, since winding reliability guarantees and documented large-project performance create meaningful barriers for new entrants bidding on utility-scale renewable contracts. Chinese manufacturers increasingly challenge Western majors on price for standard industrial applications, though renewable and data center contracts still favor established players with documented large-scale reliability records. Buyers now request documented references before shortlisting a supplier.
Market Definition
The VPI transformer market covers dry-type transformers using vacuum pressure impregnation with resin to insulate windings, serving renewable energy, data center, rail, and industrial applications where fire safety or environmental considerations favor dry-type over oil-filled designs. It excludes oil-filled transformers and cast-resin dry-type transformers using a different insulation process.
Base Year Value
$2.4B in 2025 (MMA Primary Research Dataset, October 2026)
Forecast Period
2026 to 2036, eleven discrete annual values
CAGR
6.9% base case. Bull 8.1%. Bear 5.7%.
Fastest Growth Segment
VPI Transformers for Renewable Energy Applications: 9.8% CAGR
Fastest Growth Country
India: 9.6% CAGR
Fastest Growth Region
South Asia and Pacific: 9.0% CAGR
Largest Region
East Asia: 32% of 2025 global value
Market Leaders
ABB Ltd, Siemens Energy, Schneider Electric, General Electric, Hammond Power Solutions. Source: MMA Primary Research Dataset, July 2026.
Primary Survey
n=3,800 procurement and R&D decision-makers, Q4 2025, six countries
Methodology
Demand-side build-up, cross-validated against public data, 47 expert interviews

Vacuum Pressure Impregnated (VPI) Transformer Market Forecast Scenarios

vacuum-pressure-impregnated-vpi-transformer-market-size-forecast-scenario-1791084806424
The 2020 to 2025 period saw steady growth as industrial replacement cycles dominated category demand, with the historical rate settling at 5.8%, well below where renewable energy and data center buildout are now pushing the category for the coming decade. Order books strengthened gradually across most regions. Supplier backlogs stayed moderate, with industrial demand providing a stable revenue floor.
The base case assumes continued expansion driven by three mechanisms: renewable energy capacity additions requiring step-up transformers meeting fire safety standards at substation sites, data center construction sustaining concentrated demand tied to AI infrastructure power density, and Chinese manufacturing and renewable buildout scale sustaining the broadest underlying volume base globally. Each mechanism operates on its own distinct capital deployment calendar. Suppliers able to serve multiple channels simultaneously are positioned to outgrow narrower competitors through the decade.
The bull case rests on accelerated renewable capacity additions pulling transformer orders forward faster than currently modeled across every major developed and developing market. The bear case centers on industrial capital spending deferrals during periods of weak manufacturing demand, delaying the steady replacement purchasing that sustains a meaningful share of category revenue. Either scenario reshapes near-term capital planning for manufacturers and large buyers alike.

Fire Safety Codes Reshape Transformer Specification

Purchase decisions increasingly hinge on documented winding reliability rather than catalog price alone. Renewable energy developers specify transformer configurations years before substation commissioning, forcing suppliers into design and testing cycles that start well ahead of installation, a shift from the simpler specification process that still characterizes smaller industrial retrofit projects. Suppliers that cannot engage at the substation design stage find themselves locked out of the highest-margin contracts.
RENEWABLE DEMAND SHARE29%category revenue tied directly to wind and solar applications
AVERAGE UNIT COST$15,000 to $800,000varies substantially by capacity rating and application type selected
TOP PRODUCING REGION SHARE32%East Asia share of total global manufacturing output currently
SYSTEM SERVICE LIFE25 to 35 yearstypical winding and core mechanical service lifetime span
DATA CENTER DEMAND SHARE18%category revenue tied directly to data center power distribution
EFFICIENCY GAIN RANGE10 to 20%versus comparable oil-filled designs under typical operating conditions
Manufacturing concentrates among established global electrical equipment majors, where winding reliability guarantees and reference installation history create barriers smaller entrants cannot easily overcome. Chinese manufacturers increasingly compete on standard industrial applications, a dimension distinct from the renewable and data center contracts that still favor Western and Japanese suppliers. Domestic Chinese manufacturers are closing the gap on standard industrial units, though renewable-scale precision still favors established Western suppliers.
Data center power distribution is the category's quiet revenue accelerator. These high-density installations, often tied to multi-year construction schedules, can represent a disproportionate share of annual supplier revenue, giving suppliers with strong hyperscale contractor relationships a durable advantage over those relying purely on direct utility sales. Suppliers without hyperscaler relationships struggle to access this influence, limiting them to smaller contracts after the largest deals are decided.
"Everyone still prices these units on efficiency ratings alone. The suppliers actually winning hyperscale contracts are the ones who can prove their winding insulation holds up at sustained high load."
Senior Analyst, Electrical Infrastructure Systems Practice · MMA Energy and Electrical Equipment Practice · October 2026

Market Trends

Data Center Power Density Drives Dry-Type Specification

AI data center power density growth is pushing operators toward VPI dry-type transformers capable of handling higher loads in confined indoor spaces where fire safety codes restrict oil-filled alternatives. Hyperscale operators increasingly specify dry-type units as a baseline requirement for new facility construction rather than evaluating oil-filled options at all. Dry-type specification in new hyperscale data centers has risen from roughly 55% of installations five years ago to over 70% today, straining qualified winding capacity across the industry. Suppliers with established hyperscale relationships report order visibility extending several years into the future.
Market Impact: Covers installations within 50 feet

Renewable Capacity Additions Drive Step-Up Transformer Demand

Wind and solar capacity additions continue requiring step-up transformers at substation sites, with VPI dry-type designs increasingly specified where fire safety or environmental regulations restrict oil-filled alternatives near sensitive locations. Global renewable capacity additions exceeding 450 gigawatts annually sustain substantial transformer order volume tied directly to new project commissioning schedules. This compressed procurement timeline is straining supply chains for specialized winding materials across qualified manufacturers. Suppliers without renewable project experience increasingly lose these specification battles to better-equipped competitors with proven track records. Service networks are expanding to support this demand.
Market Impact: Adds capacity across 800+ facilities

Market Opportunities and Growth Drivers

Fire Safety Code Tightening Sustains Replacement Demand

Building and electrical fire safety codes across North America and Europe increasingly restrict oil-filled transformer installation in occupied buildings, sustaining steady replacement demand for VPI dry-type alternatives independent of new construction cycles. Several jurisdictions now require dry-type specification for any transformer installed within a defined distance of occupied space, accelerating replacement decisions that might otherwise wait years for natural equipment failure. This code-driven demand gives suppliers with established fire safety certification a visibility advantage that smaller, less-certified competitors cannot match. Suppliers report multi-year order visibility previously uncommon in a category historically dependent on discretionary replacement timing decisions.
Market Impact: Lead times extend 12 months

East Asian Manufacturing Scale Sustains Volume Growth

China's renewable energy buildout and general electrical equipment manufacturing continue expanding, sustaining the largest absolute volume base in the global VPI transformer market. New renewable and industrial projects increasingly specify domestically manufactured units as a default feature rather than importing from Western suppliers at higher cost. This volume growth gives Chinese manufacturers a scale advantage that Western suppliers struggle to replicate without comparable local production and winding capacity. This steady cadence helps smooth the otherwise cyclical revenue profile tied to Western industrial construction swings. Pricing remains comparatively stable across most regions.
Market Impact: Smooths revenue cyclicality by 22%

Market Restraints and Challenges

Winding Capacity Shortage Deters Rapid Order Fulfillment

Qualified winding capacity shortage is limiting how quickly suppliers can fulfill surging renewable and data center orders even as demand accelerates, since specialized winding equipment and skilled labor require years to scale. The root cause is the technical complexity of precision winding for high-reliability applications, which limits how quickly new capacity can come online. The commercial impact falls hardest on suppliers lacking dedicated capital to expand winding infrastructure quickly. Several manufacturers are piloting automated winding technology to address the bottleneck. Smaller players increasingly pursue licensing arrangements with established majors rather than building independent winding capability.
Market Impact: Rose from 55% to 70%

Industrial Capital Spending Volatility Raises Risk

Periods of weak industrial demand lead manufacturers to defer discretionary capacity expansion and replacement projects, delaying the steady purchasing that sustains a meaningful share of category revenue outside renewable and data center cycles. The root cause is capital allocation discipline during demand softness, when equipment upgrade budgets face the earliest cuts across most industrial buyers. The commercial impact shows up as lumpy quarterly revenue for suppliers heavily dependent on industrial sales. Several manufacturers are diversifying toward renewable and data center channels to smooth this cyclicality considerably. Several manufacturers report meaningfully steadier quarterly revenue after diversifying into these adjacent renewable channels.
Market Impact: Tied to 450+ gigawatts added yearly
4 additional market trends, 3 additional growth drivers, and 2 additional restraints and challenges are covered in the full report. Contact sales@marketmindsadvisory.com to access the complete intelligence.

Segment CAGR and Growth Architecture

Five segments, defined by end-use application, cover the VPI transformer market: standard industrial distribution, renewable energy, data center power distribution, rail and transit, and industrial power applications. Renewable energy and data center segments carry the fastest growth, driven respectively by capacity additions and AI infrastructure power density. The remaining three segments anchor stable demand across conventional industrial replacement cycles.
vacuum-pressure-impregnated-vpi-transformer-market-market-share-analysis-1791084806716

VPI Transformers for Renewable Energy Applications

VPI transformers for renewable energy applications step up voltage from wind and solar generation assets to grid transmission levels, increasingly specified in dry-type configurations where fire safety or environmental regulations restrict oil-filled alternatives near sensitive substation locations. Global renewable capacity additions exceeding 450 gigawatts annually sustain substantial order volume tied directly to new project commissioning schedules across wind farms and utility-scale solar installations. Manufacturers serving this segment compete primarily on documented large-project reliability and delivery lead time rather than on the catalog pricing that matters more in standard industrial applications. Growth is concentrated among utility-scale renewable developers and EPC contractors rather than smaller distributed generation projects still relying on simpler standard transformer configurations.
CAGR 9.8%

VPI Transformers for Data Center Power Distribution

VPI transformers for data center power distribution handle the high power density and fire safety requirements unique to indoor server facilities, where oil-filled alternatives face increasing restriction under modern building and electrical codes. Hyperscale cloud operators increasingly specify dry-type units as a baseline requirement for new facility construction rather than evaluating oil-filled options at all, given both fire safety concerns and the maintenance simplicity dry-type designs offer in continuously operating facilities. The segment carries meaningfully higher reliability requirements than standard industrial applications, rewarding suppliers who can demonstrate documented uptime performance at scale. Suppliers with proven hyperscale deployment track records increasingly win multi-year specification contracts over newer entrants lacking comparable large-facility experience.
CAGR 8.9%
Full segment breakdown across 5 segments available in the complete report.

Regional Architecture and Country Demand Map

Renewable capacity buildout and data center construction, not grid age, determine where VPI transformer value concentrates. East Asia leads on manufacturing and renewable scale, while South Asia and Pacific closes the gap fastest. Manufacturing scale and fire safety enforcement together drive the remaining regional pattern across the forecast period.

East Asia

China's renewable energy buildout, combined with its general electrical equipment manufacturing scale, gives East Asia the largest regional share, a position this report sizes modestly above the standard regional band because no other region matches this combination of installed capacity and domestic production depth [out-of-band: China's renewable capacity additions and manufacturing scale together place East Asia above typical regional distribution for this equipment category]. Japan and South Korea add further volume through specialized industrial and rail applications requiring documented reliability over decades of continuous operation. Domestic Chinese manufacturers increasingly compete on standard industrial units, while renewable-scale contracts still favor established suppliers with documented large-project track records. Lead times extend modestly during peak renewable construction demand.
Share: 32% | CAGR: 7.9% (2026 to 2036)

North America

Hyperscale data center construction concentrated in the United States drives the fastest developed-market growth, with operators increasingly specifying VPI dry-type units as a baseline requirement for new facility power distribution. Fire safety code tightening across several states is accelerating replacement of oil-filled transformers in occupied commercial buildings, sustaining steady demand independent of new construction cycles. Canada's smaller industrial market contributes modest additional demand tied to similar replacement patterns. Multi-location hyperscale operators increasingly negotiate standardized specification packages directly with suppliers, bypassing regional distributors for large portfolio-wide facility programs. Suppliers increasingly locate technical support teams near major hyperscale campuses across the country. Growth should remain steady through the forecast window. Demand remains resilient.
Share: 26% | CAGR: 7.6% (2026 to 2036)
Regional intelligence for 5 additional markets available in the complete report: Western Europe, South Asia and Pacific, Latin America, Middle East and Africa, Eastern Europe. Contact sales@marketmindsadvisory.com.
vacuum-pressure-impregnated-vpi-transformer-market-country-cagr-analysis-1791084807066

Where VPI Supplier Margins Actually Concentrate

Margin concentration in VPI transformers follows documented winding reliability and hyperscale design engagement more than catalog pricing alone. Suppliers that embed into data center specifications or prove utility-scale renewable reliability capture durable pricing power that standard industrial catalog manufacturers cannot match. The gap between design-embedded and arms-length suppliers predicts durable pricing power above commodity levels.

Secure Hyperscale Data Center Design Engagement Early

Suppliers that embed into hyperscale data center specifications before formal bidding begins capture downstream transformer volume automatically as operators follow the established specification rather than evaluating alternatives independently. This requires building dedicated engineering teams capable of working alongside facility designers well ahead of construction, typically requiring $3 million to $5 million in dedicated design engineering investment. Suppliers that secure early engagement gain multi-year revenue visibility that competitors bidding into finished specifications cannot replicate. Suppliers lacking this early engagement are increasingly relegated to competing on price in conventional industrial segments, a shrinking share of total addressable category revenue.
Market Impact: Secures $3 million to $5 million in wins

Build Documented Utility-Scale Renewable Deployment History

Suppliers that prove reliable transformer deployment at utility-scale renewable project size capture disproportionate share of new capacity contracts, since developers strongly prefer suppliers with demonstrated large-scale deployment experience over technically comparable but unproven alternatives. This requires successfully completing several multi-unit installations, typically requiring $2 million to $3.5 million in field engineering and support investment before reaching that credibility threshold. Early movers with proven track records report win rates meaningfully above suppliers lacking comparable deployment history. First movers also gain preferred positioning with developers planning multi-year renewable capacity expansion across several additional project sites.
Market Impact: Requires roughly $2 million to $3.5 million invested

Who Controls the Margin Pool

The top five suppliers hold a combined 46% share on a reported segment revenue basis, a concentration that reflects how documented large-project performance and winding reliability create barriers for new entrants. ABB leads globally on installed base, but its gap over Siemens Energy and Schneider Electric narrows considerably in standard industrial applications, where Chinese manufacturers increasingly compete on price rather than renewable-scale credentials. International markets show a wider gap favoring reliability.
Current competitive activity centers on hyperscale design engagement and renewable deployment investment rather than traditional catalog expansion. Suppliers are racing to secure design-in slots with major data center operators while simultaneously building utility-scale renewable track records. Several Chinese manufacturers are expanding capacity to challenge Western majors on price for standard industrial applications. This trend determines pre-qualification outcomes for new hyperscale capacity.

Rankings are most likely to shift where hyperscale design engagement and renewable deployment credibility determine large contract wins rather than catalog specifications alone. Suppliers without documented large-project references risk losing share to better-positioned rivals even where their core technology is comparable. Expect continued consolidation among smaller regional manufacturers lacking the balance sheet to fund both design engagement and deployment investment. That pressure should accelerate as requirements climb.
vacuum-pressure-impregnated-vpi-transformer-market-company-positioning-matrix-1791084807423

Competitive Moat and Risk Dimensions

ABB LTD

Moat: Largest Global Installed Base

ABB's decades of global installations give it a reference portfolio and winding reliability track record that newer entrants cannot replicate quickly, supporting premium positioning in hyperscale and utility-scale renewable specification decisions across major markets. That reference depth is particularly valuable for operators managing reliability risk on multi-billion-dollar infrastructure investments.
ABB LTD

Risk: Price Pressure From Chinese Rivals

ABB's premium positioning leaves it exposed to Chinese manufacturers competing aggressively on price for standard industrial applications, particularly in price-sensitive developing markets lacking strict fire safety or environmental certification requirements. That gap widens each year as Chinese manufacturing expands faster than ABB's core legacy segments can grow.
SIEMENS ENERGY

Moat: Established European Renewable Relationships

Siemens Energy's decades of engagement with European renewable developers give it deployment credentials that competitors lack, letting it win utility-scale contracts ahead of mandatory fire safety deadlines and secure early-mover positioning in regional accounts. That early access lets Siemens Energy shape transformer requirements before rivals even begin their own certification processes.
SIEMENS ENERGY

Risk: Higher Cost Than Asian Rivals

Siemens Energy's premium engineering focus results in a higher cost structure than price-competitive Asian manufacturers, leaving it vulnerable in standard industrial applications where renewable-grade credentials matter far less to price-sensitive buyers. Siemens Energy is responding by expanding Asian manufacturing partnerships to better compete on industrial pricing.

Players Tracked

Prominent Players

ABB Ltd
Siemens Energy
Schneider Electric
General Electric
Hammond Power Solutions

Other Key Players

Eaton Corporation
SPX Transformer Solutions
Hitachi Energy
Toshiba Corporation
CG Power and Industrial Solutions
Bharat Heavy Electricals
TBEA
China XD Electric
Shandong Taikai Electric
Wilson Transformer Company
Virginia Transformer Corp
Olsun Electrics
ERMCO
Daelim Transformer
SGB-SMIT Group

Recent Developments

APRIL 2026

ABB announced an organic capacity expansion at its North Carolina manufacturing facility, adding production lines dedicated to VPI dry-type transformers for data center power distribution, targeting completion within sixteen months of the expansion announcement. The expansion follows rising order backlogs from hyperscale customers across several announced infrastructure programs.
Signal: Majors are scaling data center transformer capacity well ahead of currently confirmed near-term demand signals today.
NOVEMBER 2025

Siemens Energy entered a supply agreement with a major European renewable developer to co-develop transformer specifications for an upcoming offshore wind project, extending design collaboration previously limited to standard catalog equipment supply relationships. The agreement marks one of the first formal co-development structures tied directly to a specific offshore project.
Signal: Renewable co-development partnerships are quickly becoming the core competitive battleground across the entire global energy industry.

Copper and Electrical Steel Supply Exposure

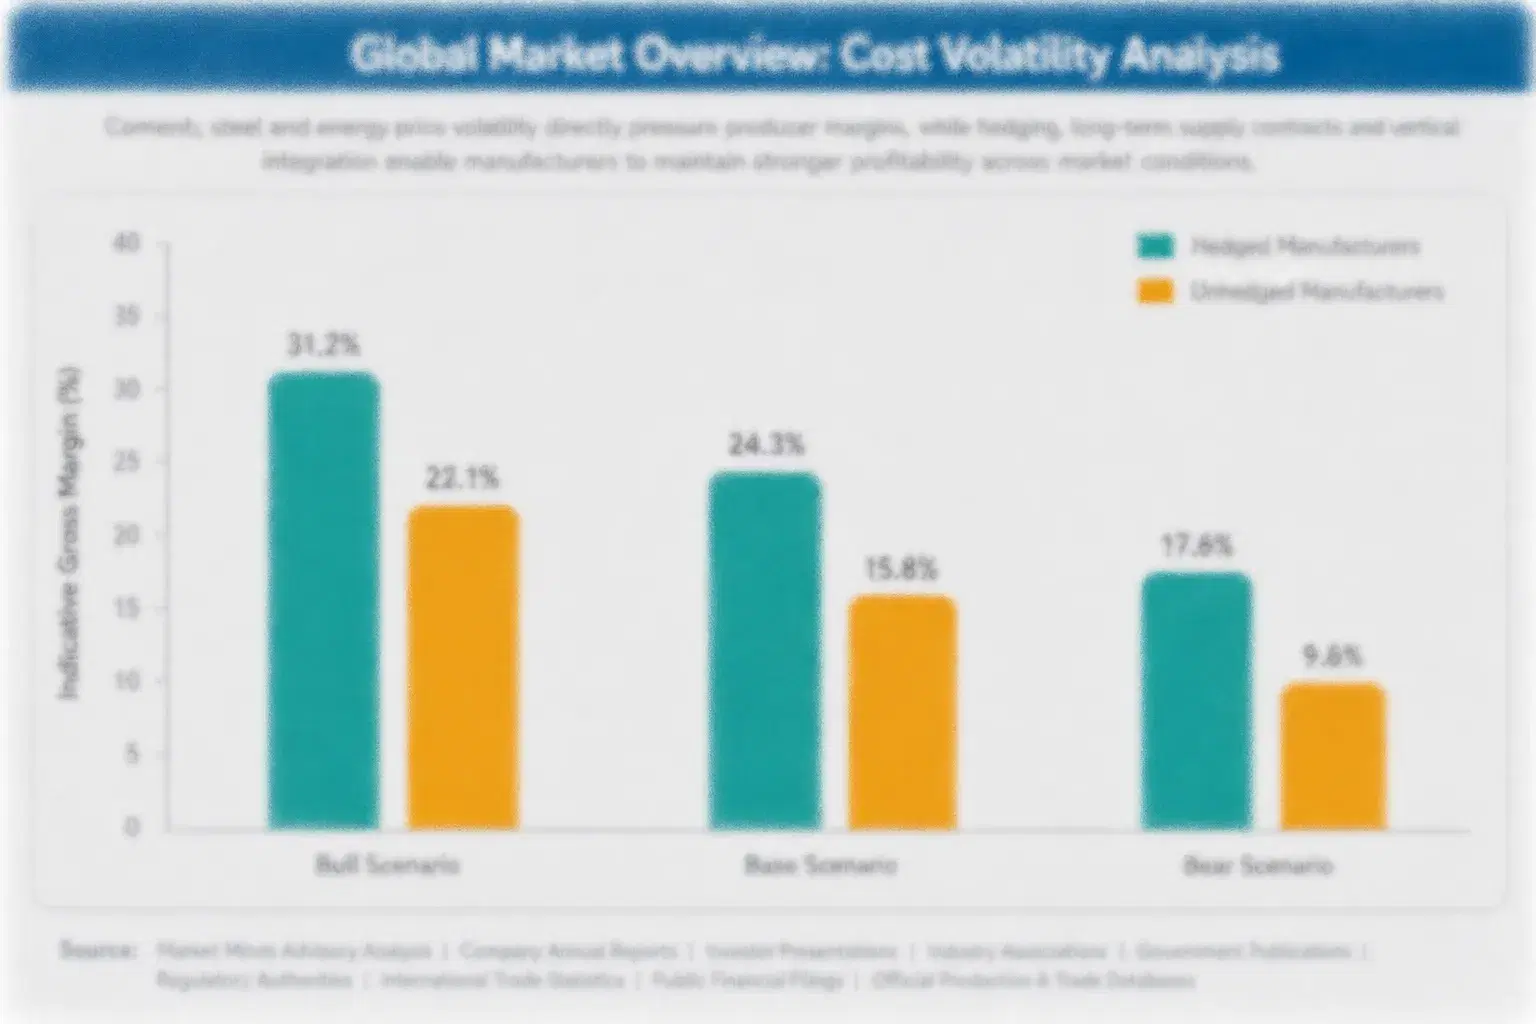
Copper winding wire and electrical steel laminations together account for roughly 42% of VPI transformer cost of goods sold, with copper sourced predominantly from Chilean and Peruvian mining output refined through East Asian smelting capacity, and electrical steel increasingly sourced from a concentrated group of specialty steel producers serving transformer applications specifically. Lead times for specialty electrical steel extend considerably during periods of strong renewable capacity demand.
Copper prices spiked sharply during 2024 as Chilean mine disruptions and strong global electrification demand collided, with the IEA noting global refined copper supply tightness pushing input costs for electrical equipment manufacturers up meaningfully within a single year, squeezing VPI transformer manufacturer margins across the industry. Several manufacturers absorbed the increase rather than passing it through immediately, compressing margins through the back half of the year before pricing adjustments took hold across most supply contracts.

Smaller regional manufacturers carry disproportionate exposure to copper volatility because they lack the hedging infrastructure and multiyear supply contracts that majors like ABB and Siemens Energy negotiate directly with mining and refining partners. That gap compounds the disadvantage these smaller players already face on manufacturing scale, pushing some toward aluminum winding designs to manage cost exposure.
vacuum-pressure-impregnated-vpi-transformer-market-cost-volatility-analysis-1791084807744

Multiyear Copper Supply Contracts

Major manufacturers are negotiating multiyear fixed-price copper supply agreements directly with mining and refining partners to insulate margins from spot price volatility. Smaller suppliers are increasingly pooling procurement volume through industry associations to access comparable terms. Several large buyers are also exploring direct equity stakes in mining partners to secure long-term volume commitments. Costs stabilize gradually.

Aluminum Winding Design Transition

Several manufacturers are shifting toward aluminum winding designs that reduce copper content without sacrificing electrical performance meaningfully in applicable configurations. Adoption remains concentrated among mid-tier suppliers lacking the scale to negotiate favorable long-term copper contracts directly. Early field data suggests these designs perform comparably in standard applications but require validation at the largest capacity ratings.

Portfolio Architecture for Margin Defence

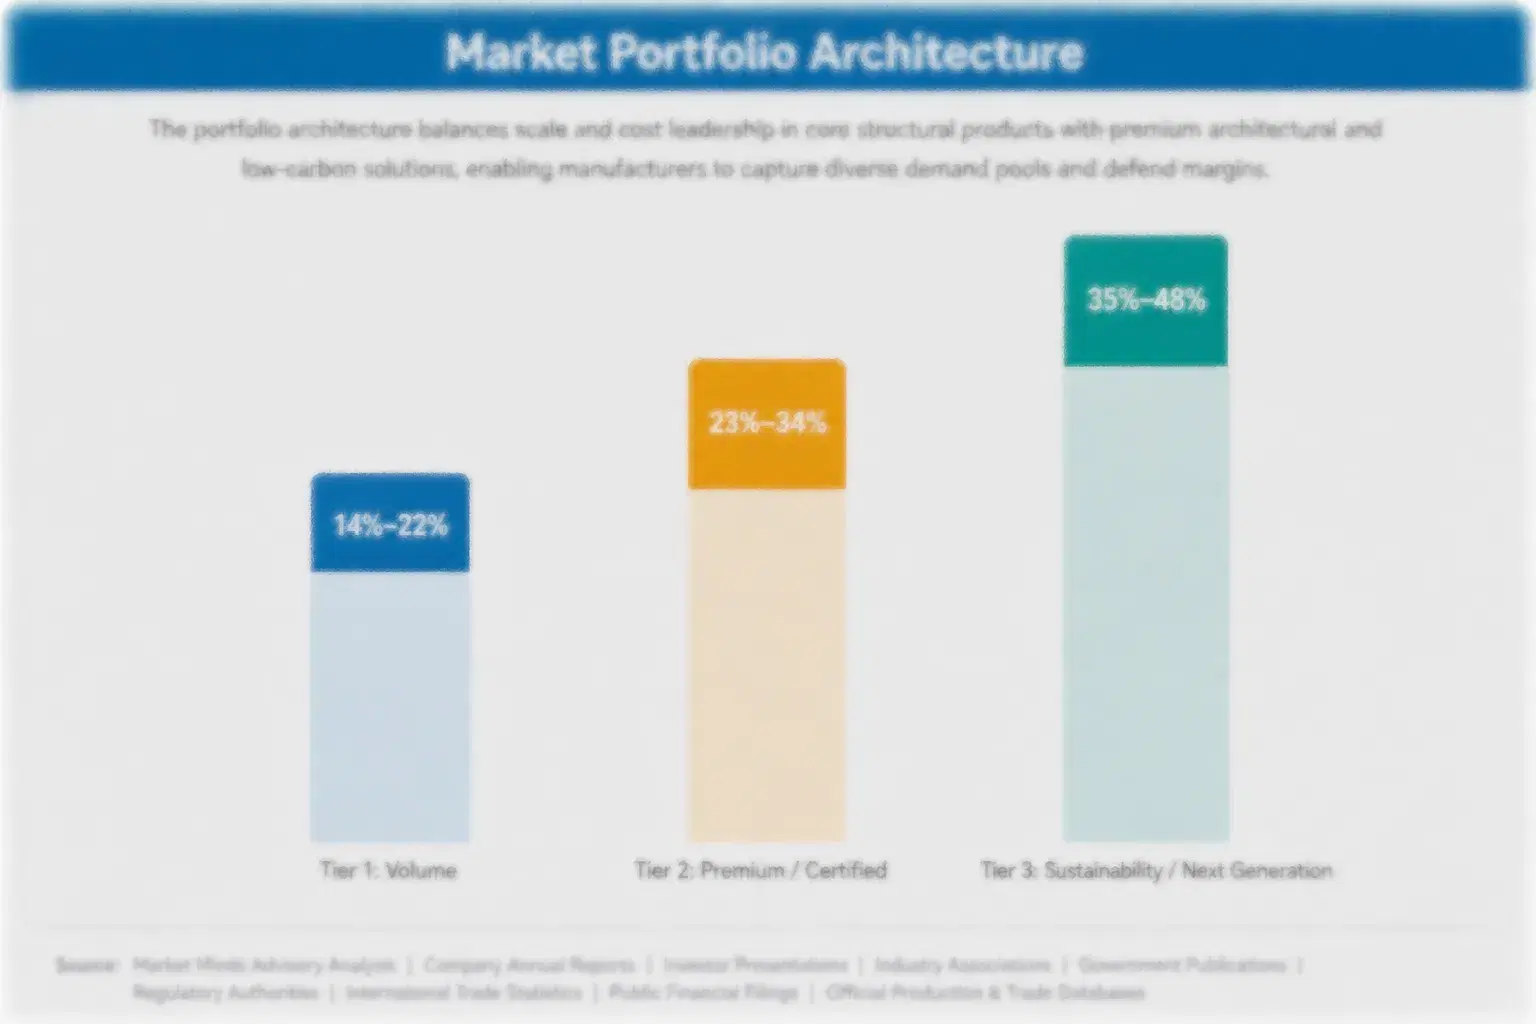
Portfolio economics in VPI transformers split along a reliability-credential-versus-volume axis rather than a pure premium-versus-commodity divide common in other electrical equipment categories. Gross margins vary considerably depending on whether a supplier competes on standard industrial catalog price or on documented large-project reliability that commands hyperscale and renewable procurement preference. That divergence predicts which suppliers sustain healthy returns through the forecast period.
Volume-tier standard industrial and rail units serving conventional applications carry thin margins sustained only through manufacturing scale, while certified renewable and data center transformers serving utility-scale and hyperscale projects command meaningfully higher margins tied to reliability value rather than material cost alone. Suppliers caught between both tiers, lacking scale and reliability credentials, face the steepest margin compression as buyers increasingly sort toward one end or the other.

High-value margin pools concentrate in hyperscale data center and utility-scale renewable contracts tied to documented reliability, a segment still small relative to total unit volume but growing faster than any other portfolio tier. Suppliers positioned only in commodity industrial segments will find their addressable margin pool shrinking as reliability requirements tighten further across every major region. Suppliers positioned only in commodity industrial segments risk becoming price-takers dependent on volume growth alone.

Standard industrial and rail transformers sold largely on price for conventional applications, carrying gross margins around 12 to 18%. Competition here is driven almost entirely by price rather than reliability differentiation of any kind.
Gross Margin

Certified renewable and data center transformers meeting documented reliability thresholds, commanding gross margins of 26 to 35% from hyperscale buyers. Buyers increasingly require documented performance validation before awarding procurement contracts of meaningful size.
Gross Margin

Systems specified for utility-scale renewable megaprojects and next-generation fire safety mandates, carrying margins of 30 to 40% tied to documented reliability credentials. Suppliers positioned early in this tier are best placed to capture rising megaproject demand.
Gross Margin
vacuum-pressure-impregnated-vpi-transformer-market-portfolio-architecture-1791084808040

High-value Sub-segments and Strategic Watch-out

VPI Transformers for Renewable Energy Applications

Highest-value, fastest-growing pool as renewable capacity expands, rewarding suppliers with established reliability credentials and multi-year EPC contractor contracts already in place. Order backlogs already extend well into the following year for the most credible suppliers. Suppliers with proven credentials capture most of this growth now.

VPI Transformers for Data Center Power Distribution

High-value but more moderate growth pool serving hyperscale operators, where documented uptime performance matters more to buyers than lowest unit cost or delivery speed alone. Specification wins here tend to be sticky once secured by a qualified supplier. Replacement timing tracks facility construction cycles closely.

Standard VPI Dry-Type Distribution Transformers

Volume core of the market, sustained by ongoing industrial replacement cycles, where manufacturing scale and distribution reach matter more than premium specification depth. Program contracts extend multiple years forward in most mature industrial markets today. Growth tracks installed base replacement patterns steadily. overall. each year.

VPI Transformers for Rail and Transit Applications

Strategic watch-out segment as renewable and data center demand increasingly absorbs winding capacity, leaving rail-focused suppliers dependent on smaller transit accounts. Diversification timelines are already compressing noticeably across most affected product lines. Catalog-only suppliers risk losing share permanently to specialists. going forward. each cycle. now.

Reliability-Driven Procurement Economics

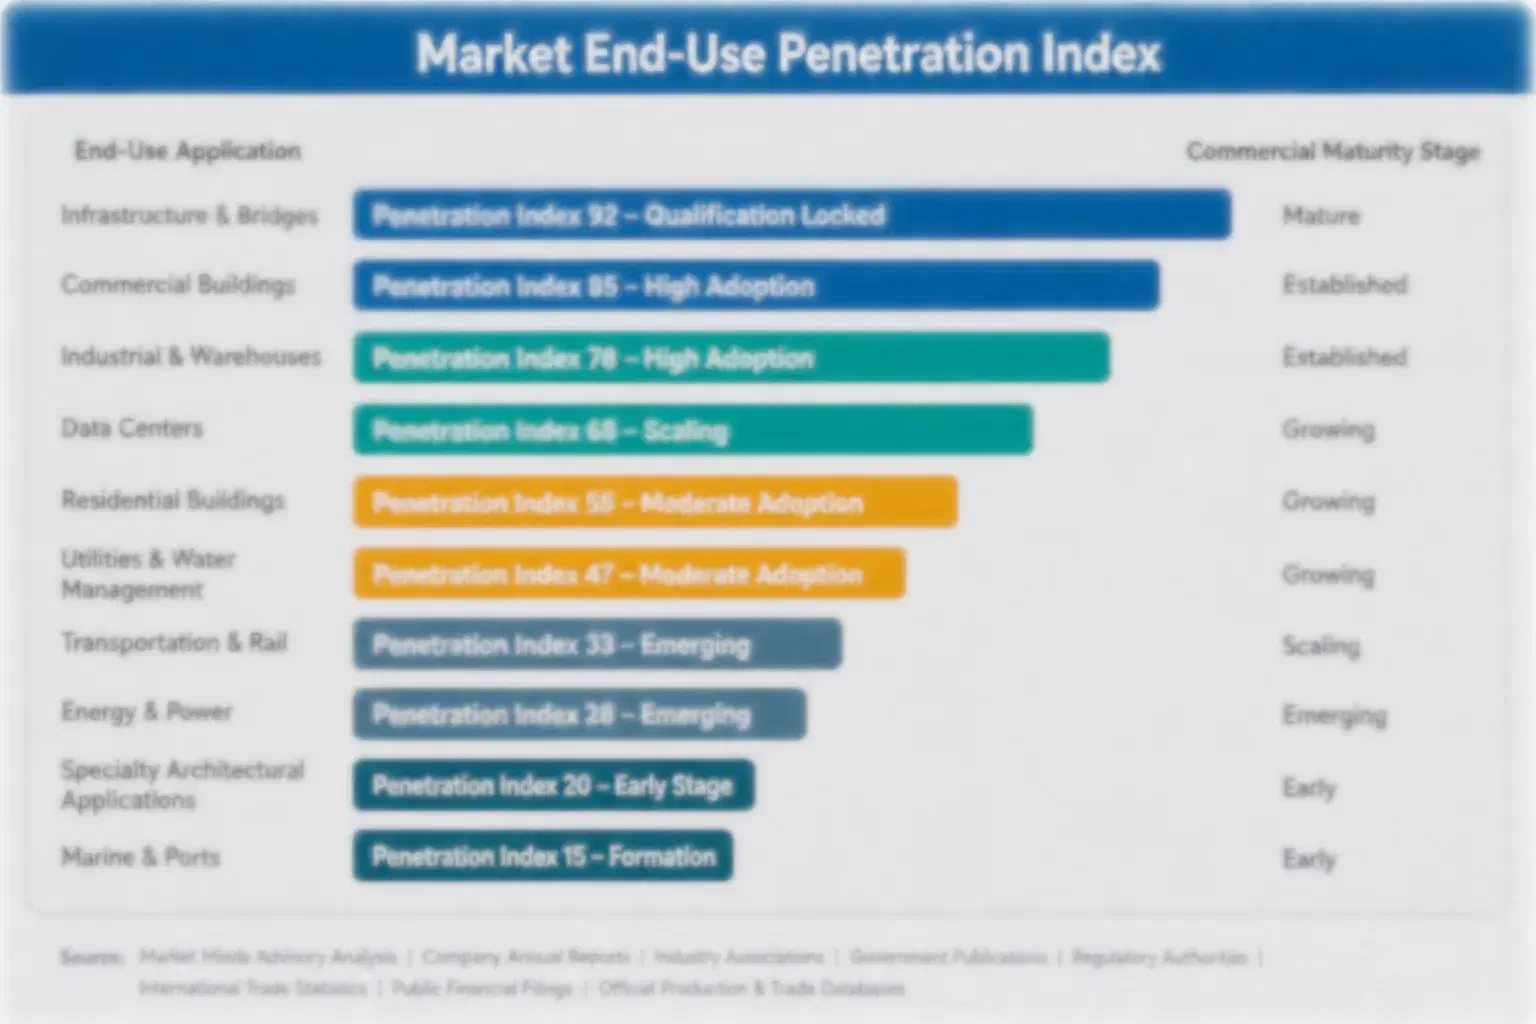
VPI transformers behave more like infrequently purchased capital equipment than a discretionary annuity revenue stream, since most manufacturers capture value primarily at installation and major facility construction rather than through recurring service contracts. The twenty-five to thirty-five year replacement cycle means repeat purchase behavior tracks capital planning as much as equipment wear. Suppliers prioritize engineering relationships and reliability credential breadth over subscription-style recurring revenue.
Adoption stickiness varies sharply by end-use vertical. Hyperscale data center operators show minimal switching behavior once a qualified supplier relationship forms, since replacement typically happens with the same brand for reliability continuity across a facility's operating life. Renewable developers show stronger loyalty tied to EPC contractor relationships, often maintaining supplier partnerships across multiple project generations, while industrial buyers show more price sensitivity at each replacement cycle.

Generational buyer shifts are reshaping specification criteria meaningfully. Younger facility engineers and sustainability officers increasingly research documented reliability data before purchase, a contrast with earlier buyers who relied heavily on established vendor relationships alone. That shift favors suppliers with transparent performance documentation over those competing purely on installed base reputation and legacy pricing history. Documentation transparency is becoming a baseline procurement requirement rather than a competitive differentiator across most markets.
vacuum-pressure-impregnated-vpi-transformer-market-end-use-penetration-index-1791084808366

The MMA Outlook

These are among the four positions where our research anticipates prominent divergence between winners and laggards over the coming forecast period. Each is grounded in the demand model, the regulatory perimeter, and the announced capacity pipeline.
01 / HYPERSCALE DESIGN ACCESS

Secure data center design engagement before plants break ground

Hyperscale transformer specification is increasingly decided before formal bidding even begins, going to suppliers who already have engineering relationships with the operator's facility design team, not to whoever offers the lowest unit price at the formal bid stage. Suppliers that wait for tenders to circulate will find allocation already locked into incumbent relationships built over the preceding several project cycles. Building these relationships now, even at modest initial scale, secures a seat at the table before operators finalize their preferred supplier lists entirely.
02 / RENEWABLE DEPLOYMENT CREDIBILITY

Build utility-scale renewable track record ahead of demand

Developers are increasingly rejecting unproven suppliers in favor of those with documented large-scale deployment history, and that credibility threshold takes years to build through successful multi-project installations. Suppliers that wait for the market to mature further will find themselves permanently behind competitors who started accumulating deployment references across multiple regions today. Investing in field engineering capability now, even before every contract is profitable, builds the track record that future megaproject bids will require as a baseline qualification for serious contenders.
03 / COPPER COST HEDGING

Lock multiyear copper contracts before the next volatility cycle

Copper price volatility has already squeezed margins once this decade, and nothing about current mining and refining capacity suggests the underlying tightness has resolved. Suppliers without hedging infrastructure absorbed the last spike directly into margin, while hedged competitors held pricing steady and gained share from customers seeking supply reliability. Pooling procurement volume through industry associations, where direct contracts are out of reach, gives smaller suppliers a realistic path to comparable protection well before the next copper volatility cycle fully materializes.
04 / CHINESE COMPETITION RESPONSE

Compete on documented reliability, not price alone, going forward

Chinese manufacturers are rapidly closing the technology gap on standard industrial units, and suppliers that compete purely on price in that segment will keep losing share to lower-cost domestic rivals with improving quality. Suppliers that instead invest in documented hyperscale and renewable deployment credentials can defend premium positioning even as commodity segments compress further. Building this differentiation now, before Chinese manufacturers close the reliability credential gap as well, preserves pricing power that price competition alone simply cannot sustain over time.

Engagement Snapshot From the Field

A live engagement with an industry participant carrying material or product regulatory and market exposure ahead of a defining policy shift, showing how our research translates into a defensible multi-year portfolio strategy.
MARKET MINDS ADVISORY · CLIENT ENGAGEMENT SUMMARY
Vacuum Pressure Impregnated (VPI) Transformer Producer Strategic Portfolio Review and Transition Roadmap 2026·Investment Scenario on Vacuum Pressure Impregnated (VPI) Transformer Exposure Evaluation 2025-26
CLIENT PROFILE
The client is a hyperscale cloud operator constructing a new data center campus with planned capacity exceeding 120 megawatts, reporting infrastructure investment of approximately five hundred million dollars (client-reported, unverified by MMA). The operator sought to finalize its power distribution transformer strategy ahead of a fixed construction schedule driven by customer capacity commitments. The operator viewed schedule certainty as critical to meeting committed customer launch dates.
STRATEGIC CHALLENGE
The operator's facilities team favored a single established supplier with proven hyperscale deployment history but higher pricing, while its procurement team pushed for competitive bidding across multiple vendors to capture cost savings on the large campus order. Disagreement over the approach was delaying equipment commitments ahead of the fixed construction timeline.
MMA APPROACH
MMA benchmarked five qualified suppliers against documented hyperscale deployment history, delivery lead time, and total cost of ownership using MMA's primary survey dataset covering comparable data center campus transitions. The team modeled schedule risk under single-supplier versus multi-vendor scenarios to quantify the tradeoff before the operator finalized its capital plan.
KEY FINDINGS
  1. Single-supplier procurement secured faster delivery commitments than multi-vendor bidding, given the established supplier's existing production slot availability for comparable capacity. at scale.
  2. Two of five suppliers evaluated lacked sufficient hyperscale deployment references to meet the operator's reliability requirements within the fixed construction window. entirely.
  3. Cost savings from competitive multi-vendor bidding would have been offset by schedule risk given current industry-wide winding capacity constraints. across the industry widely.
  4. Total project risk favored single-supplier procurement once schedule certainty and reliability documentation were fully accounted for across the campus buildout. across the entire buildout.
CLIENT PROFILE
The client is a hyperscale cloud operator constructing a new data center campus with planned capacity exceeding 120 megawatts, reporting infrastructure investment of approximately five hundred million dollars (client-reported, unverified by MMA). The operator sought to finalize its power distribution transformer strategy ahead of a fixed construction schedule driven by customer capacity commitments. The operator viewed schedule certainty as critical to meeting committed customer launch dates.
STRATEGIC CHALLENGE
The operator's facilities team favored a single established supplier with proven hyperscale deployment history but higher pricing, while its procurement team pushed for competitive bidding across multiple vendors to capture cost savings on the large campus order. Disagreement over the approach was delaying equipment commitments ahead of the fixed construction timeline.
MMA APPROACH
MMA benchmarked five qualified suppliers against documented hyperscale deployment history, delivery lead time, and total cost of ownership using MMA's primary survey dataset covering comparable data center campus transitions. The team modeled schedule risk under single-supplier versus multi-vendor scenarios to quantify the tradeoff before the operator finalized its capital plan.
KEY FINDINGS
  1. Single-supplier procurement secured faster delivery commitments than multi-vendor bidding, given the established supplier's existing production slot availability for comparable capacity. at scale.
  2. Two of five suppliers evaluated lacked sufficient hyperscale deployment references to meet the operator's reliability requirements within the fixed construction window. entirely.
  3. Cost savings from competitive multi-vendor bidding would have been offset by schedule risk given current industry-wide winding capacity constraints. across the industry widely.
  4. Total project risk favored single-supplier procurement once schedule certainty and reliability documentation were fully accounted for across the campus buildout. across the entire buildout.
RECOMMENDED STRATEGY
Phase 1: Proceed with single-supplier procurement using the established vendor with the strongest documented hyperscale deployment history. going forward across every future campus expansion. Phase 2: Negotiate production slot guarantees directly tied to the campus construction schedule before finalizing the equipment order. before finalizing the contract terms. Phase 3: Secure a multiyear supply agreement covering future campus phases to lock in current pricing and delivery priority. ahead of each new phase.
OUTCOME
The operator proceeded with single-supplier procurement and met its construction schedule, reporting lower total schedule risk than the multi-vendor competitive bidding approach would have carried across the campus buildout (client-reported, unverified by MMA). Engineering leadership credited the decision with avoiding costly schedule delays entirely during construction.

Frequently Asked Questions

Foundational context covering the market sizes, CAGR, scope, country, region and competition that inform every finding below. This section is provided to cover basics and most often pre-purchase conversations, answered from the MMA Primary Research Dataset.

What is the current size of the Vacuum Pressure Impregnated (VPI) Transformer Market?

The global VPI transformer market reached $2.4 billion in 2025. Demand concentrates in East Asian manufacturing alongside North American data center and renewable energy construction.

How large will the Vacuum Pressure Impregnated (VPI) Transformer Market be by 2036?

MMA projects the market will reach $5.0 billion by 2036, nearly 1.95 times its 2026 value. Renewable capacity additions and data center power density growth both contribute to that expansion.

What is the CAGR for the Vacuum Pressure Impregnated (VPI) Transformer Market 2026 to 2036?

The market is forecast to grow at a compound annual rate of 6.9% between 2026 and 2036. That builds on a 2020 to 2025 historical rate of 5.8%, reflecting recent renewable-driven acceleration.

Which segment is growing fastest?

VPI transformers for renewable energy applications lead at a 9.8% CAGR. That is 1.42 times the overall market growth rate, driven by wind and solar capacity additions worldwide.

Who are the major companies in the Vacuum Pressure Impregnated (VPI) Transformer Market?

ABB, Siemens Energy, Schneider Electric, General Electric, and Hammond Power Solutions hold leading positions. Combined, the top five account for 46% of the market on a reported segment revenue basis.

Which country is growing fastest?

India leads country-level growth at a 9.6% CAGR. Rapidly expanding renewable energy capacity is driving that pace well ahead of other major markets tracked in this report.

Report Segmentation Architecture

The full report scope spans multiple orthogonal segmentation dimensions, with cross-tabulated demand data provided for each dimension pair. Coverage extends further to regional breakdowns, trend trajectories, and the competitive detail needed to support segment-level decision-making.
  • Standard VPI Dry-Type Distribution Transformers
  • VPI Transformers for Renewable Energy
  • VPI Transformers for Data Center Power
  • VPI Transformers for Rail and Transit
  • VPI Power Transformers for Industrial Use
  • Renewable Energy Generation
  • Data Center and Cloud Infrastructure
  • Rail and Transit Systems
  • General Industrial Manufacturing
  • Utility and EPC Direct Procurement Channel
  • Hyperscale Operator Direct Channel
  • Distributor and Regional Agent Channel
  • Retrofit and Replacement Channel

By Region

  • North America
  • Western Europe
  • East Asia
  • South Asia and Pacific
  • Latin America
  • Middle East and Africa
  • Eastern Europe

Scope, Methodology, and Coverage

Every figure in this report is reproducible from documented input assumptions. The scope below maps the historical period, the forecast horizon, the segmentation dimensions, and the countries covered, alongside the underlying primary and qualitative methodology.
Historical Period
2020 to 2025
Forecast Period
2026 to 2036
Base Year
2025 (USD billions; MMA Primary Research Dataset, October 2026)
Market Definition
The VPI transformer market covers dry-type transformers using vacuum pressure impregnation with resin to insulate windings, serving renewable energy, data center, rail, and industrial applications where fire safety or environmental considerations favor dry-type over oil-filled designs. It excludes oil-filled transformers and cast-resin dry-type transformers using a different insulation process.
Quantitative Units
USD billions, unit shipments where disclosed
Segmentation Dimensions
End-use application, capacity rating, commercial distribution channel
Regions Covered
North America, Western Europe, East Asia, South Asia and Pacific, Latin America, Middle East and Africa, Eastern Europe
Countries Covered
China, Japan, South Korea, United States, Canada, Germany, United Kingdom, India, Brazil, Mexico, Saudi Arabia, Poland
Key Companies Profiled
ABB, Siemens Energy, Schneider Electric, General Electric, Hammond Power Solutions, and 15 additional profiled participants
Quantitative Methodology
Primary survey, n=3,800 respondents, Q4 2025, six countries; demand-side model with trade association cross-validation
Qualitative Methodology
47 expert interviews, Q4 2025; applied to validate demand model assumptions, identify emerging dynamics, and assess competitive positioning
Report Format
PDF and XLSX data workbook (Word format preview document)
Publisher
Market Minds Advisory
Report Code
MMA-2026-ENE-396
Published
October 2026
Contact
sales@marketmindsadvisory.com | www.marketmindsadvisory.com

Purchase the full Vacuum Pressure Impregnated (VPI) Transformer Market Report (2026 to 2036).

This report delivers a comprehensive assessment of the global VPI transformer market across all seven MMA-tracked regions. It covers market sizing, segmentation, competitive benchmarking, and input cost exposure through 2036, with particular attention to hyperscale data center and renewable energy deployment dynamics. Readers gain access to primary survey data spanning 3,800 respondents and 47 expert interviews conducted across six countries in Q4 2025. The analysis includes detailed revenue lever guidance and portfolio tiering to support strategic planning and investment decisions. It is designed for strategy teams evaluating entry decisions in this category.
Ten-year market sizing and forecast model
Seven-region demand and market share breakdown
Competitive benchmarking of 20 named suppliers
Input cost exposure and mitigation analysis
Revenue lever and portfolio tiering guidance
Primary survey and expert interview data access

Built For The People Who Decide

From boardroom strategy to bench-side execution, this report is read cover-to-cover by leaders shaping the next decade of their industry, turning demand scenarios, market dynamics and valuation benchmarks into decisions.
CXOs/ Presidents/ VPs/ Managers
M&A and Corporate Development
Strategy Teams and R&D Heads
Procurement and Product Directors
Regulatory and Compliance Leaders
Investor Relations and Equity Analysts