Market Minds Advisory
Utility-Scale Power Optimizer Market

Utility-Scale Power Optimizer Market: Utility-Scale Power Optimizer Market. Module-Level Optimization Gains Ground as Yield Demands Rise

Rising panel wattage and stricter yield guarantees are colliding as utility-scale developers weigh module-level power optimization against traditional string inverter architecture to defend project returns against shading and mismatch losses.

Lead Analyst

Published

September 2026

Make Smarter Decisions with Customized Research Insights

Request a free sample report and evaluate market opportunities, growth trends, and competitive dynamics relevant to your business needs.

2025 MARKET VALUE$2.6BMarket Size 2025
2036 FORECAST VALUE$7.3BBase Case , 2026 to 2036
CAGR 2026 TO 20369.8 %Bull 11.1% / Bear 8.5%
INCREMENTAL OPPORTUNITY$4.4BNet 10- year value creation
EXPANSION MULTIPLE2.55x2036 value over 2026 base
Strategic Levers
M&A Pipeline
Regional Outlook
Country Rankings
Competitive Intelligence
Segmental Deep-dive
Call-Us : 91 93563 13602

Executive Snapshot and Market Trajectory.

Module-level power optimization is gaining share against traditional string inverter architecture as utility-scale developers chase incremental yield gains that compound meaningfully across decade-long project lifetimes, financing structures, and negotiated power purchase agreement terms with offtakers, lenders, equity investors, and independent engineering advisors alike. Investment follows closely behind.
Rising panel wattage and bifacial module adoption are increasing the financial cost of shading and mismatch losses, pushing asset owners toward optimizer-equipped designs despite the additional upfront capital cost per watt of installed capacity across most new utility-scale project developments currently under construction worldwide, particularly in regions with variable terrain or partial shading conditions affecting long-term energy yield forecasts considerably more than flat, unobstructed sites typically do.
Competitive intensity is increasing as inverter manufacturers bundle optimization capability directly into their product lines, challenging pure-play optimizer specialists that built early market position through independent module-level electronics before the broader industry consolidated around integrated system architectures spanning inverters, optimizers, and monitoring software sold as a single procurement package to developers seeking simplified vendor relationships, reduced integration risk, and clearer single-point accountability across the entire system lifecycle, warranty period, and ongoing operations phase.
Market Definition
This report covers module-level and string-level power optimization equipment used in utility-scale solar photovoltaic installations to maximize energy yield and enable panel-level monitoring, measured on a global shipment-capacity basis. It excludes residential and commercial rooftop optimizers and standalone inverter hardware sold without optimization functionality.
Base Year Value
$2.6B in 2025 (MMA Primary Research Dataset, September 2026)
Forecast Period
2026 to 2036, eleven discrete annual values
CAGR
9.8% base case. Bull 11.1%. Bear 8.5%.
Fastest Growth Segment
Bifacial-Optimized Power Optimizer Modules: 14.5% CAGR
Fastest Growth Country
China: 13.2% CAGR
Fastest Growth Region
South Asia and Pacific: 12.0% CAGR
Largest Region
East Asia: 30% of 2025 global value
Market Leaders
SolarEdge Technologies, Tigo Energy, Huawei, Sungrow, SMA Solar Technology
Primary Survey
n=3,800 procurement and R&D decision-makers, Q4 2025, six countries
Methodology
Demand-side build-up, cross-validated against public data, 47 expert interviews

Utility-Scale Power Optimizer Market Forecast Scenarios

utility-scale-power-optimizer-market-size-forecast-scenario-1788256658217
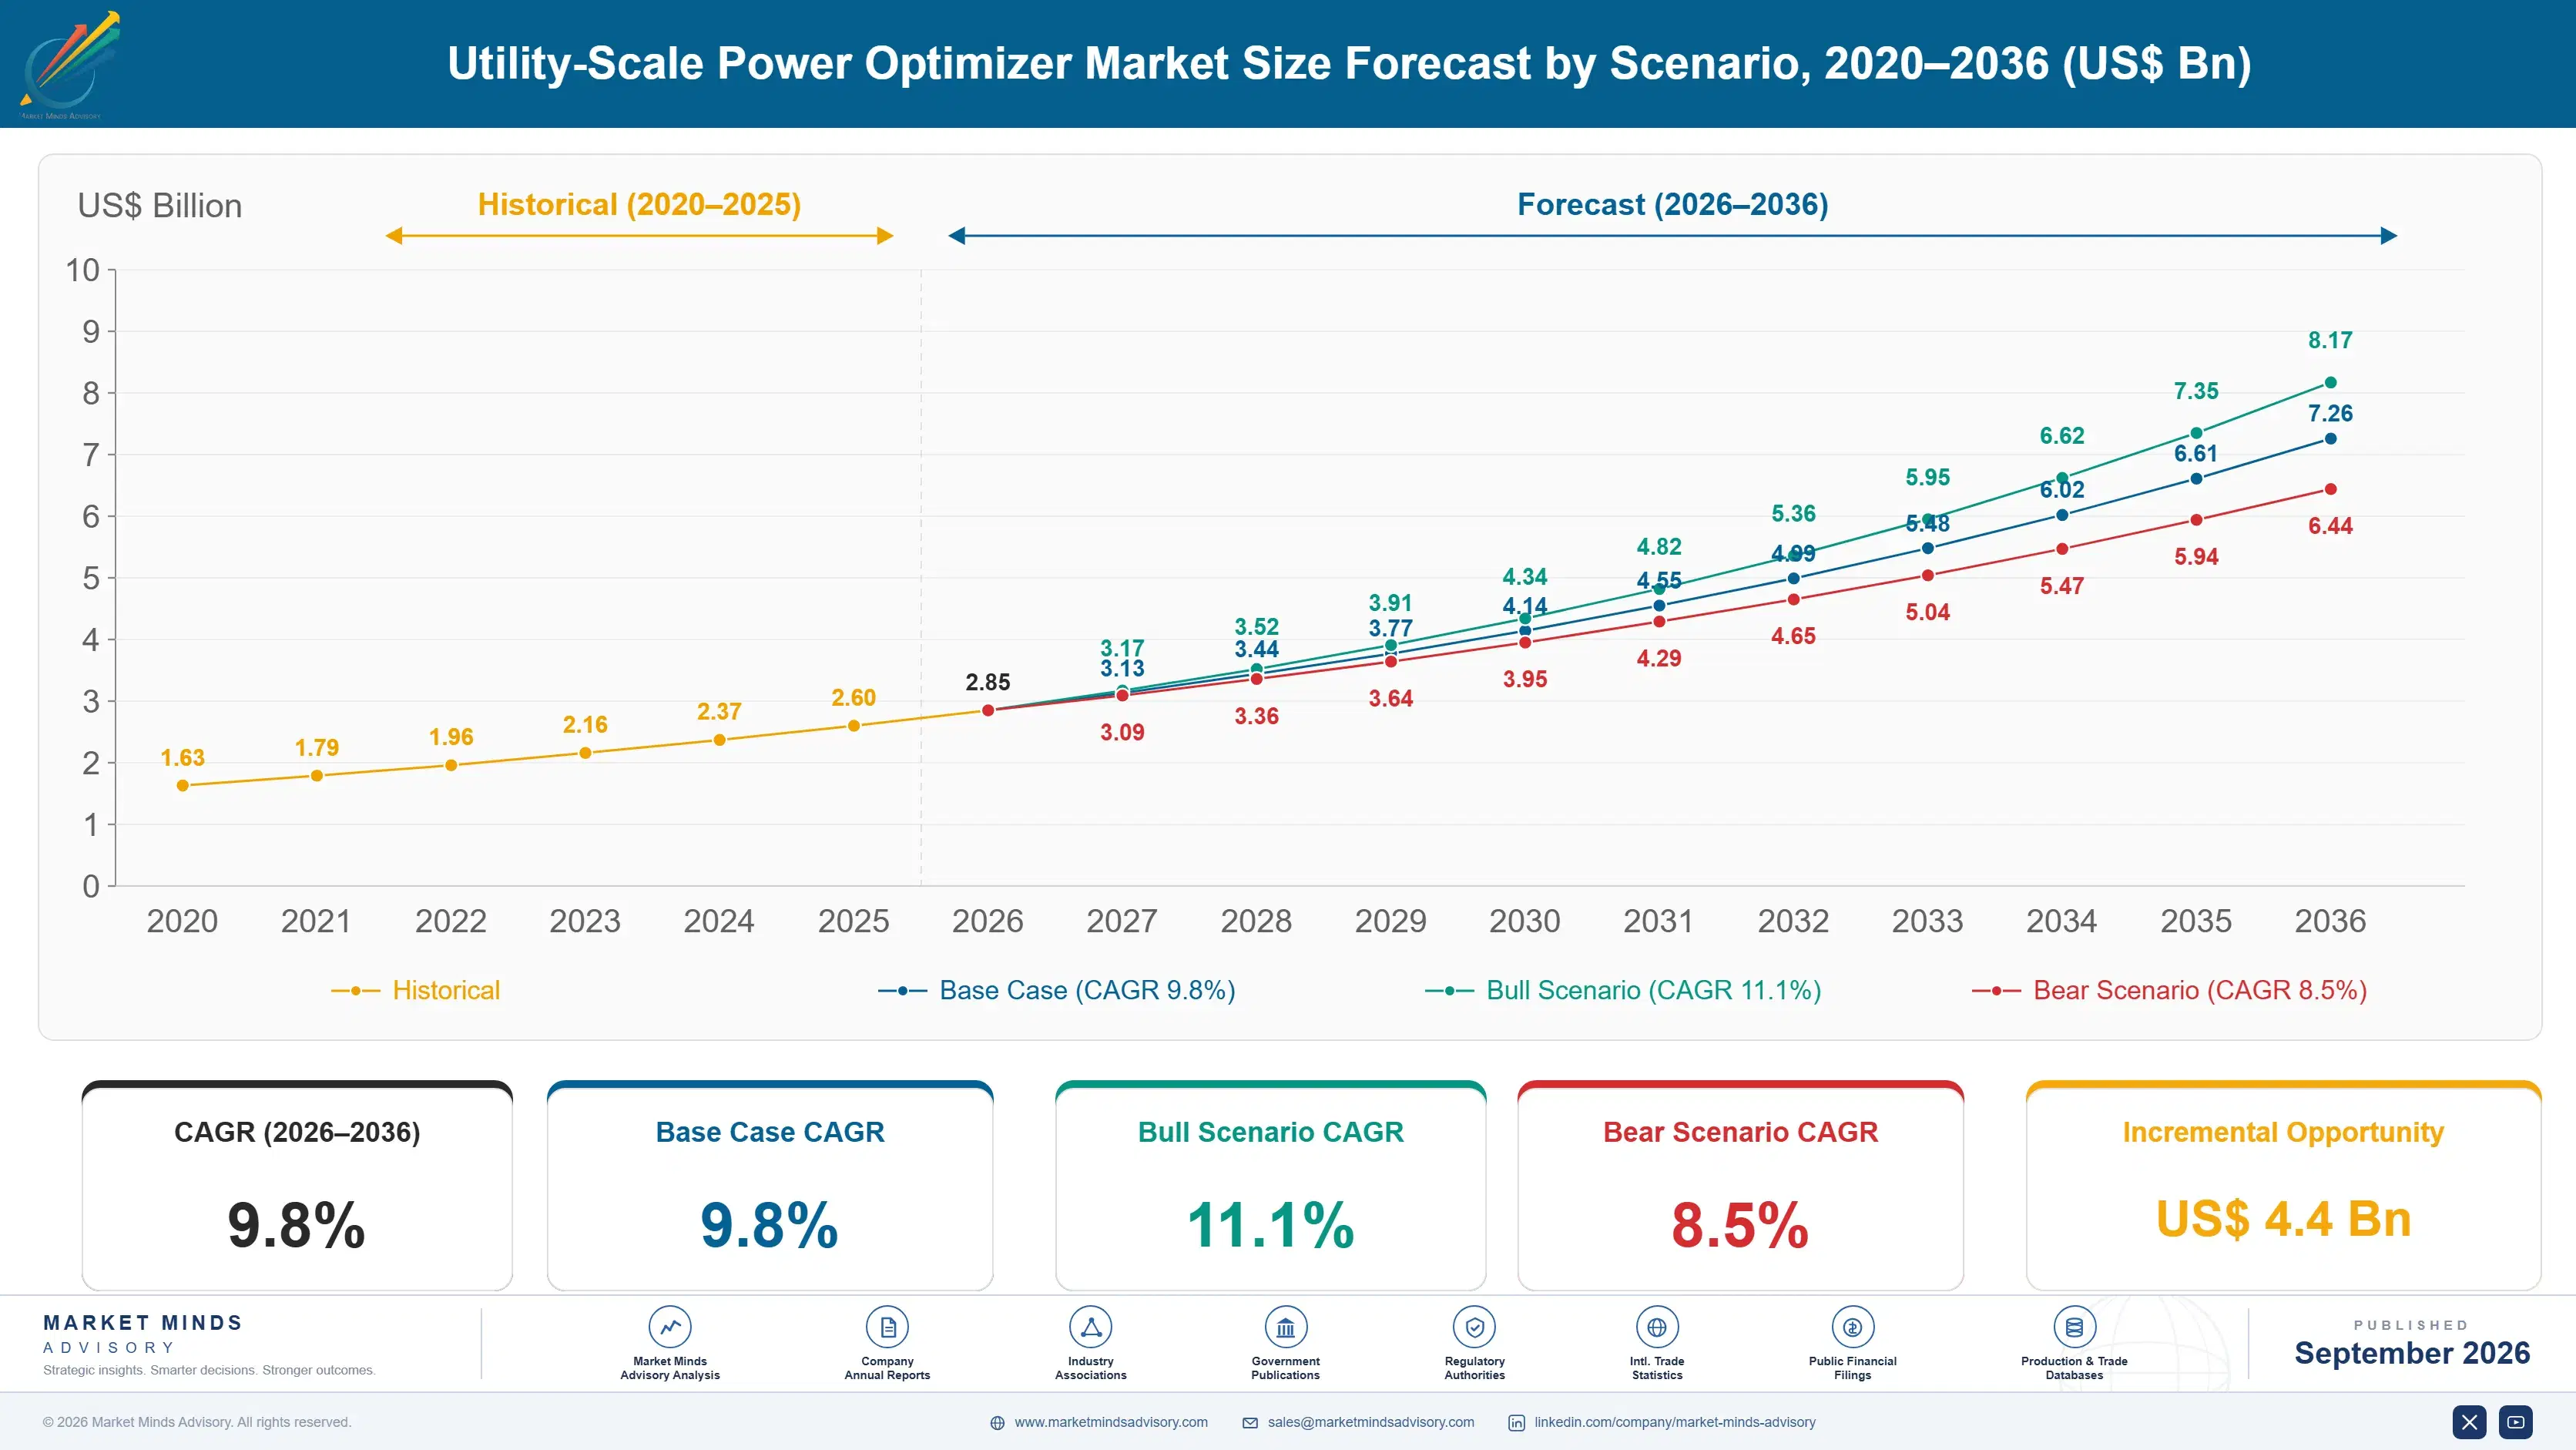
Between 2020 and 2025, power optimizer adoption in utility-scale solar grew steadily as bifacial modules and higher-wattage panels became standard, though string inverter architecture retained majority share given its lower upfront cost for uniform, unshaded project sites without terrain complexity or partial shading obstacles affecting energy yield forecasts meaningfully across most developed markets. Financing terms reflected these premiums by the period's end.
The base case rests on three mechanisms holding through the entire forecast window: continued panel wattage escalation raising mismatch loss stakes considerably, growing developer preference for panel-level monitoring and fault diagnostics capability across most utility-scale project portfolios, and integrated inverter-optimizer product bundles simplifying procurement decisions for utility-scale asset owners seeking single-vendor accountability across project lifetimes and long-term maintenance and warranty support arrangements spanning multiple decades of continuous operation. Underwriting practices increasingly reflect these mechanisms.
A bull scenario emerges if optimizer cost premiums narrow faster than expected as manufacturing scale improves and component costs decline meaningfully, while a bear risk centers on string inverter manufacturers closing the yield gap through improved maximum power point tracking algorithms that reduce the financial case for module-level electronics across most standard project configurations. Component cost trajectories will determine which architecture wins going forward.

Yield Optimization Justifies the Cost Premium

Yield economics, not raw hardware cost, drive purchasing decisions in this category, since the incremental energy capture from module-level optimization compounds meaningfully across a twenty-year project lifetime and directly affects power purchase agreement revenue projections. Developers increasingly model this yield uplift explicitly during initial site selection and technology procurement decisions. Lenders now routinely request site-specific optimization studies before finalizing debt terms on new utility-scale projects.
TOP REGION SHARE30%East Asia's share of global optimizer shipment volume today
COST PREMIUM RATIO8-12%Typical upfront cost premium versus conventional string inverter systems
YIELD IMPROVEMENT3-6%Typical energy yield gain from module-level optimization deployment currently
MARKET CONCENTRATION58%Combined shipment share held by the top five manufacturers globally
BIFACIAL MODULE ATTACH RATE45%Share of new installations pairing optimizers with bifacial panels
AVERAGE WARRANTY TERM20 yearsTypical product warranty length offered by leading manufacturers currently
Manufacturers increasingly compete on software and monitoring capability rather than pure hardware specifications, since basic optimization functionality has become commoditized among established suppliers competing on price and warranty terms alone. Manufacturers investing early in cloud-based analytics platforms are capturing disproportionate share of premium-tier procurement decisions among sophisticated asset owners. Cloud-based platforms also reduce maintenance labor cost by flagging underperforming modules automatically.
Terrain complexity and shading exposure are the strongest predictors of optimizer adoption at the project level, with flat, unobstructed sites favoring lower-cost string inverter architecture and complex or partially shaded sites favoring module-level optimization despite the additional capital cost. Developers increasingly conduct site-specific shading analysis during the earliest feasibility stages. Sites with meaningful elevation change or nearby structures tend to favor module-level optimization regardless of the resulting cost premium.
"Optimizers used to be a nice-to-have for tricky sites. Now developers model the yield gain into their base case before they even pick a site."
Practice Lead, Solar Power Electronics and Grid Integration · MMA Solar Power Electronics and Grid Optimization Equipment Practice · September 2026

Market Trends

Integrated Inverter-Optimizer Product Bundles Reshape Procurement

Major inverter manufacturers including Huawei, Sungrow, and SMA Solar Technology are increasingly bundling module-level optimization capability directly into their central and string inverter product lines rather than leaving the category entirely to independent optimizer specialists operating standalone product businesses. This integration simplifies procurement for utility-scale developers seeking single-vendor accountability across warranty claims and technical support, and bundled offerings now represent an estimated 55 percent of new optimizer-equipped project capacity, up from roughly 30 percent five years earlier as inverter manufacturers expanded their product portfolios considerably across most major markets. Independent specialists must now differentiate on software depth.
Market Impact: Panels grew from 350W to 600W+
Bifacial Module Adoption Accelerates Optimizer Attach Rates

Bifacial solar modules, which capture reflected light on their rear surface and are more sensitive to ground albedo variation and shading asymmetry than monofacial panels, are driving higher optimizer attach rates across new utility-scale projects worldwide. Roughly 45 percent of new installations pairing bifacial modules now include module-level optimization, compared with under 25 percent for monofacial installations, as developers seek to capture the full yield benefit that bifacial technology promises without losing performance to unaccounted mismatch losses across variable terrain conditions. Manufacturers are marketing bifacial-optimized product variants specifically to capture this growing demand segment.
Market Impact: Covers 40% of newly financed projects

Market Opportunities and Growth Drivers

Rising Panel Wattage Increases Mismatch Loss Financial Stakes

Utility-scale solar panels have grown from roughly 350 watts to over 600 watts per module within a decade, meaning a single underperforming or shaded panel now drags down proportionally more string output than under older, lower-wattage designs. This dynamic makes module-level optimization financially compelling even at modest yield improvement percentages, since the absolute energy value at stake per panel has increased substantially. Developers modeling twenty-year project economics increasingly find optimizer premiums justified by yield gains worth 3 to 6 percent of total energy production across the asset's operating lifetime. Component suppliers are responding with higher-current-rated optimizer designs.
Market Impact: Costs 8 to 12% less upfront

Power Purchase Agreement Yield Guarantees Tighten Underwriting Standards

Offtakers and lenders increasingly require contractual energy yield guarantees backed by detailed shading and mismatch loss modeling before finalizing power purchase agreements and project debt terms, raising the analytical bar for developers proposing string-only inverter architecture on complex terrain. This shift has pushed optimizer adoption higher on projects where independent engineering firms flag meaningful yield risk under conventional string architecture, since developers face financial penalties for underperformance relative to contracted guarantees. Roughly 40 percent of newly financed utility-scale projects now specify module-level optimization in their yield guarantee documentation. This trend shows no sign of reversing given ongoing yield guarantee tightening.
Market Impact: Failure rates run under 0.5% annually

Market Restraints and Challenges

String Inverter Cost Advantage Persists for Simple Sites

String inverter architecture remains 8 to 12 percent cheaper upfront than optimizer-equipped systems, and this cost gap fully justifies string-only designs on flat, unobstructed sites without shading or terrain complexity where module-level optimization delivers minimal incremental yield benefit. The root cause is straightforward: optimizers add per-panel hardware and installation labor cost that only pays back through measurable yield improvement, and simple sites simply do not generate enough mismatch loss to justify the investment. Manufacturers are responding by developing lower-cost optimizer variants targeting price-sensitive simple-site applications specifically. This price-sensitive segment remains meaningfully large across most emerging solar markets.
Market Impact: Bundles cover 55% of capacity

Field Reliability Concerns Persist for Distributed Electronics

Module-level electronics distributed across thousands of panels per project introduce more potential failure points than centralized string inverter architecture, and field failure rates, while generally low, create meaningful operations and maintenance cost and downtime risk at utility scale. The root cause is the sheer multiplication of individual electronic components across large installations, each representing a potential failure point requiring field diagnosis and replacement. Manufacturers are responding with extended warranty terms, remote diagnostic capability, and more rigorous quality testing protocols to address reliability concerns before they affect purchasing decisions. Insurance underwriters are also factoring reliability data into premium calculations.
Market Impact: Bifacial attach rate reached 45%
4 additional market trends, 3 additional growth drivers, and 3 additional restraints and challenges are covered in the full report. Contact sales@marketmindsadvisory.com to access the complete intelligence.

Segment CAGR and Growth Architecture

The utility-scale power optimizer market splits into six product-technology segments defined by module compatibility, monitoring capability, and integration architecture, ranging from mature standalone optimizer units through fast-growing bifacial-optimized and integrated inverter-bundled designs. Growth diverges sharply as bifacial adoption and inverter bundling reshape procurement patterns across most major utility-scale markets worldwide and beyond it today.
utility-scale-power-optimizer-market-market-share-analysis-1788256658798

Bifacial-Optimized Power Optimizer Modules

Bifacial-optimized power optimizers represent the fastest-growing segment, engineered specifically to manage the ground albedo variation and rear-side shading asymmetry unique to bifacial panel installations that standard optimizer designs handle less effectively across variable terrain conditions. Adoption tracks closely with broader bifacial module penetration, which itself continues climbing as manufacturers scale bifacial cell production and developers recognize the yield benefit these panels offer over monofacial alternatives at comparable installed cost. Manufacturers including SolarEdge and Tigo Energy have launched dedicated bifacial-optimized product lines, betting that this technology pairing will define utility-scale procurement standards over the coming decade of installations and beyond. Bifacial-specific firmware optimization further widens the yield advantage over generic designs.
CAGR 14.5%

Integrated Inverter-Bundled Optimizer Systems

Integrated systems bundling optimizer hardware directly with central or string inverters appeal to developers seeking single-vendor accountability and simplified warranty and technical support relationships across project lifetimes and financing structures. This segment benefits from major inverter manufacturers including Huawei, Sungrow, and SMA Solar Technology expanding their product portfolios to compete directly with independent optimizer specialists rather than ceding the category entirely to standalone hardware providers. Procurement simplification and reduced integration risk increasingly outweigh the marginal performance differences between bundled and standalone optimizer architectures for most utility-scale developers evaluating long-term vendor relationships and warranty structures. Independent specialists face growing pressure to match this bundled convenience through third-party integration partnerships. Consolidation seems likely.
CAGR 11.8%
Full segment breakdown across 7 segments available in the complete report.

Regional Architecture and Country Demand Map

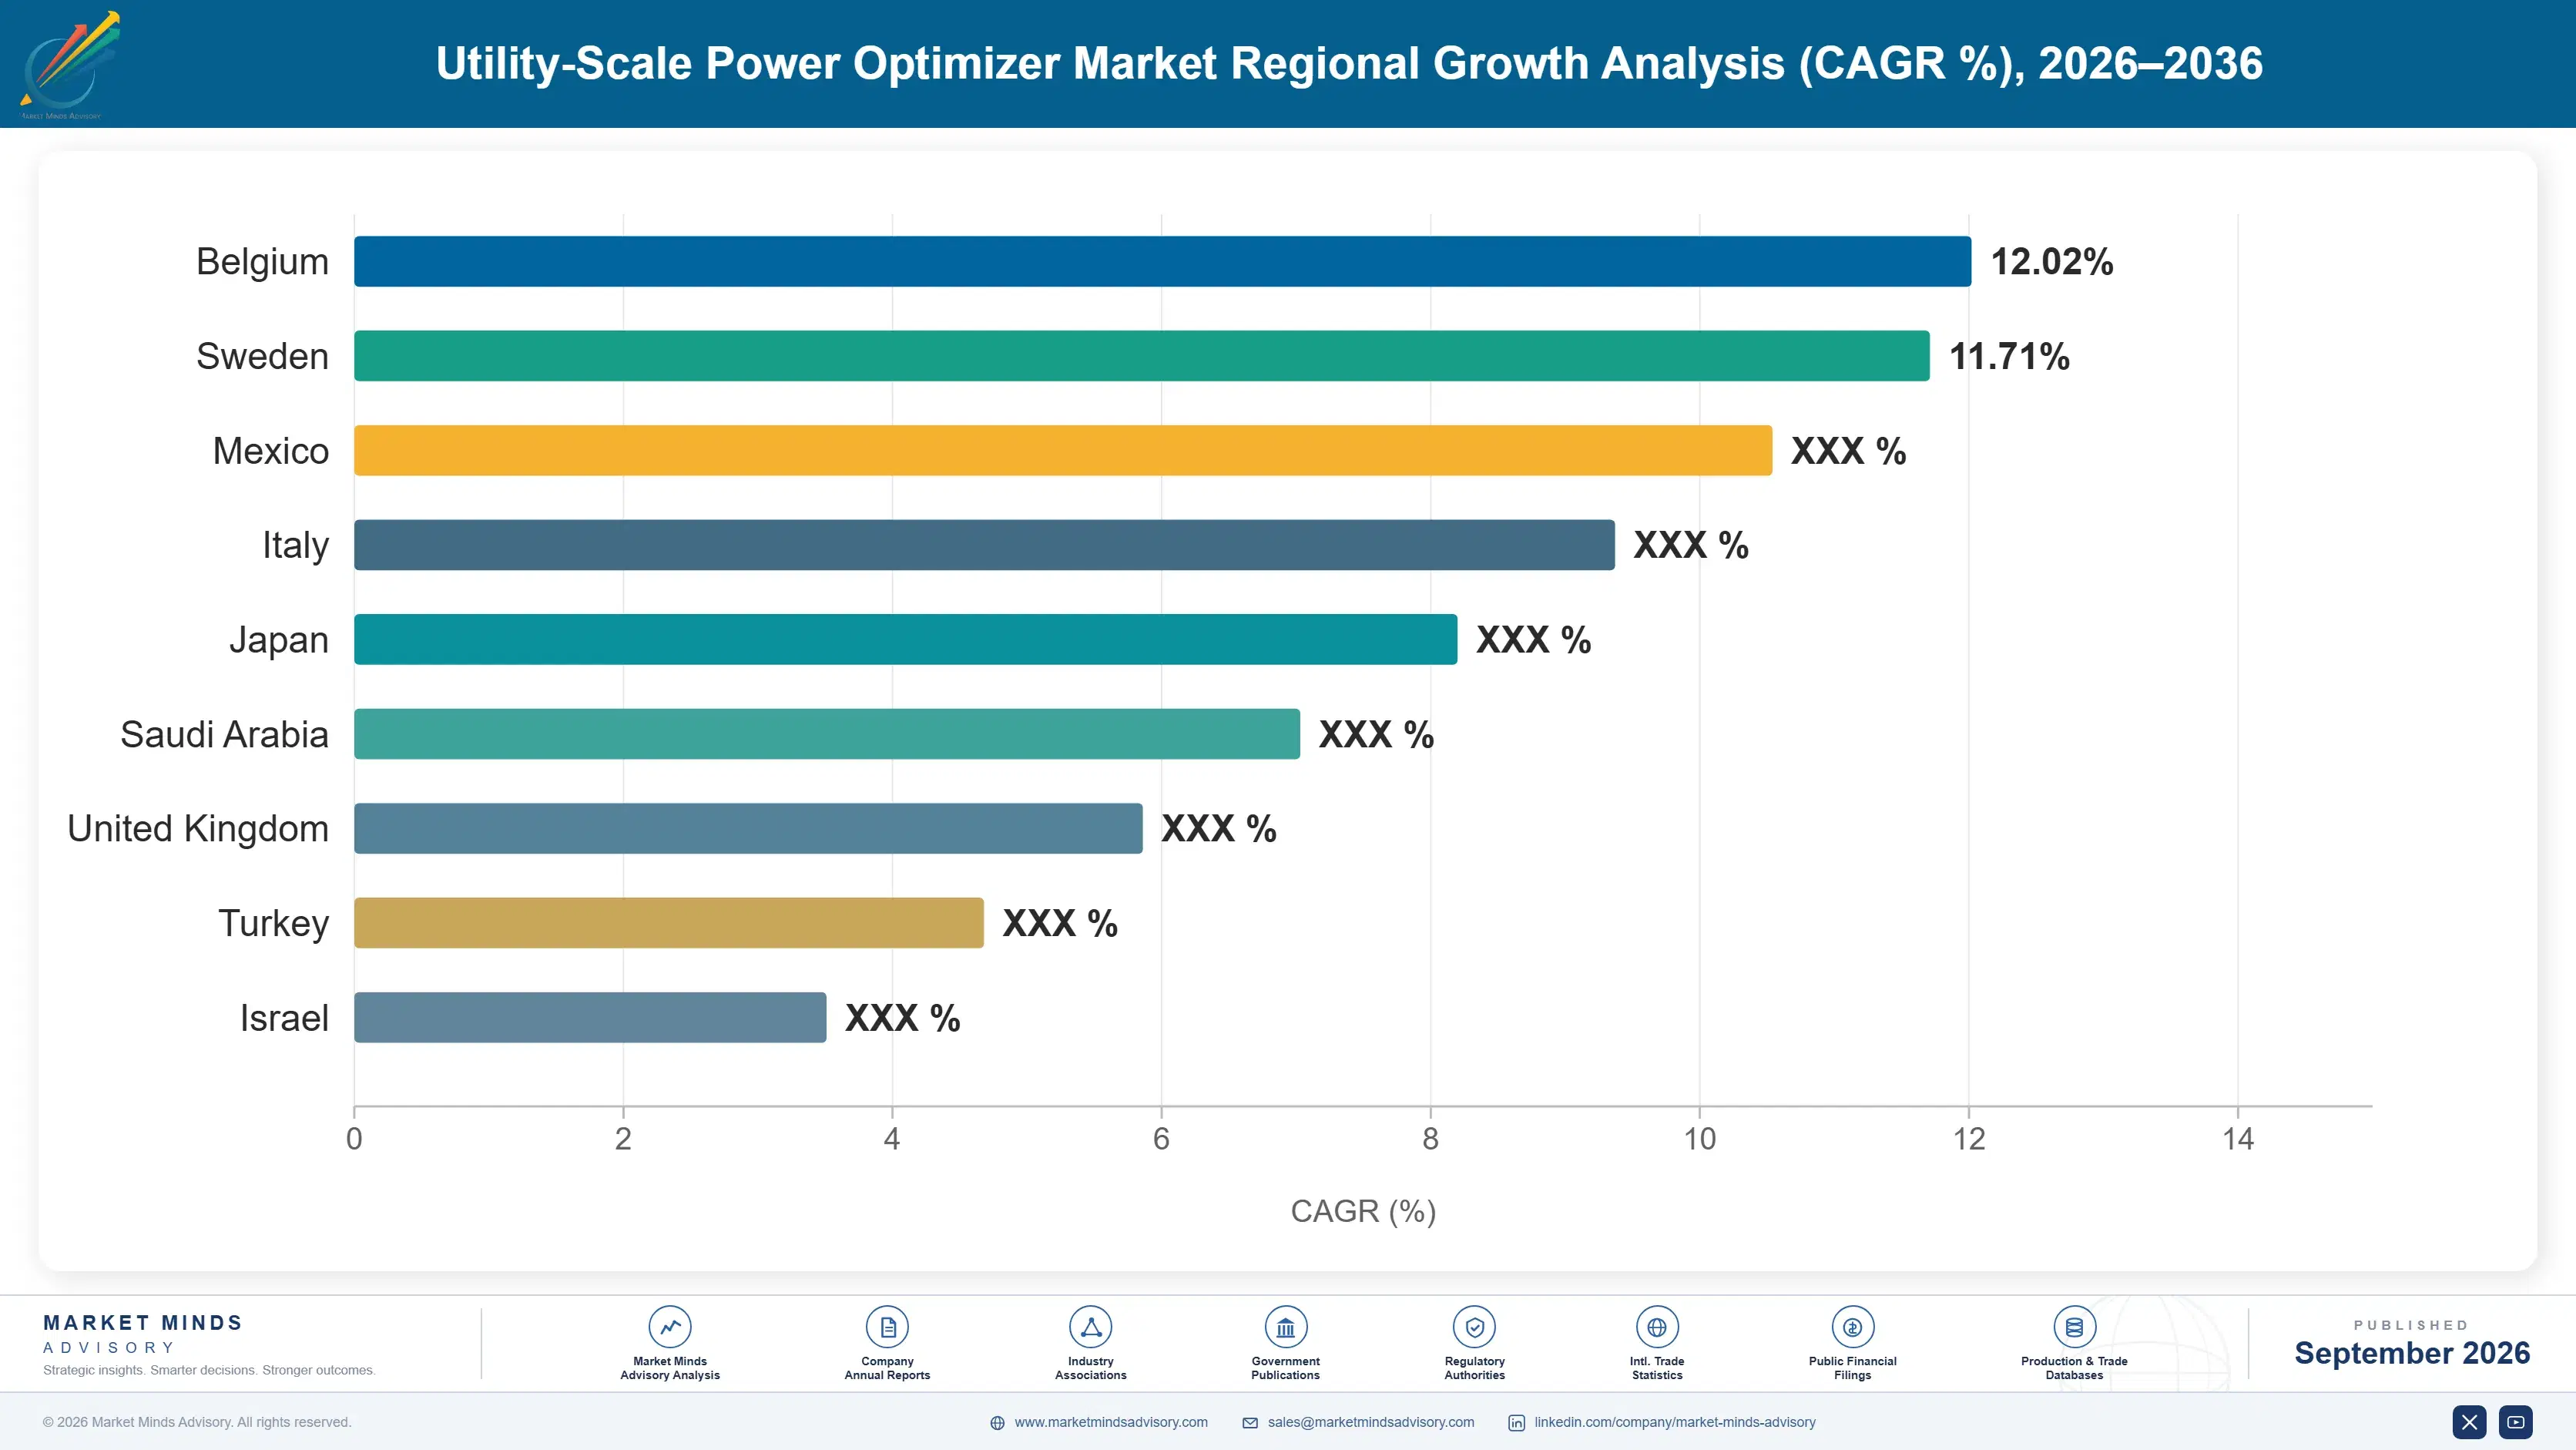
East Asia leads global utility-scale power optimizer shipments, anchored by China's manufacturing scale across Huawei and Sungrow's integrated inverter-optimizer product lines, while South Asia and Pacific posts the fastest regional growth rate as utility-scale solar buildout accelerates through the 2036 forecast horizon and well beyond.

East Asia

China dominates both manufacturing and installation volume for utility-scale power optimizers, with Huawei and Sungrow supplying integrated inverter-optimizer systems across the country's massive utility-scale solar buildout program. Domestic manufacturing scale gives Chinese suppliers meaningful cost advantages that export markets across Southeast Asia and beyond increasingly benefit from as well. Japan and South Korea maintain smaller but technically sophisticated markets favoring premium optimizer brands given complex terrain and land constraints common across their mountainous installation sites. Regional demand growth tracks closely with each country's utility-scale solar capacity expansion targets and grid interconnection queue processing speed. Grid interconnection queue speed also shapes near-term deployment pacing considerably across most provincial markets. Momentum remains strong.
Share: 30% | CAGR: 10.8% (2026 to 2036)

North America

The United States utility-scale solar market favors optimizer adoption on projects with meaningful terrain complexity or partial shading, while flat desert and agricultural sites in states like Texas and Arizona often default to lower-cost string inverter architecture. SolarEdge and Tigo Energy maintain strong domestic manufacturing presence supported by Inflation Reduction Act domestic content incentives that favor US-assembled optimizer hardware over imported alternatives. Canada's smaller utility-scale market follows similar adoption logic tied to project-specific terrain and shading analysis. Financing lender requirements increasingly influence optimizer specification decisions across newly structured project debt agreements. Domestic content requirements continue reshaping supplier selection decisions across most newly announced projects. Adoption continues rising steadily across most regions.
Share: 24% | CAGR: 9.5% (2026 to 2036)
Regional intelligence for 5 additional markets available in the complete report: Western Europe, South Asia and Pacific, Latin America, Middle East and Africa, Eastern Europe. Contact sales@marketmindsadvisory.com.
utility-scale-power-optimizer-market-country-cagr-analysis-1788256659304

Software Differentiation and Bundling Priorities

Manufacturers generate outsized returns not from hardware margins alone but from software differentiation, integrated bundling partnerships, and bifacial-specific product positioning across the industry. Four levers stand out as the clearest paths to margin expansion across the forecast period, each requiring distinct engineering and channel investment from manufacturers pursuing them seriously and consistently over time.

Expand Cloud-Based Monitoring and Analytics Platforms

Adding cloud-based monitoring, predictive fault diagnostics, and automated underperformance alerts to optimizer hardware commands a 10 to 15 percent price premium over comparable hardware-only offerings, appealing to asset owners managing large multi-site portfolios who value reduced operations and maintenance labor cost considerably. Manufacturers investing early in software capability are capturing disproportionate share of premium-tier procurement decisions as sophisticated developers increasingly evaluate software depth alongside hardware specifications during vendor selection across most major utility-scale project tenders. Data-driven service contracts also open recurring revenue opportunities beyond the initial hardware sale. Subscription-based analytics pricing further diversifies revenue away from one-time hardware transactions.
Market Impact: Commands a 10 to 15% price premium overall

Secure Inverter Manufacturer Integration Partnerships Broadly

Partnering directly with major inverter manufacturers to supply bundled optimizer hardware captures share of the roughly 55 percent of new optimizer-equipped capacity now procured through integrated bundles rather than standalone purchases across most utility-scale project tenders. These partnerships provide independent optimizer specialists distribution reach through established inverter sales channels, reducing customer acquisition cost while providing inverter manufacturers proven optimization technology without the capital investment required to develop it internally from scratch. Revenue sharing arrangements vary but typically favor the inverter manufacturer given its stronger customer relationship. Some independent specialists resist partnership given margin dilution concerns over time.
Market Impact: Captures share of the 55% bundled demand share

Develop Bifacial-Specific Optimizer Product Variants Broadly

Engineering optimizer products specifically tuned for bifacial module characteristics captures share of the fastest-growing segment, where bifacial-paired installations already show a 45 percent optimizer attach rate compared with under 25 percent for monofacial installations across most major markets. Manufacturers with dedicated bifacial firmware and hardware optimization can command premium pricing from developers seeking to maximize the yield benefit bifacial technology promises without losing performance to unaccounted rear-side shading and albedo variation effects at scale. Early movers in this segment are building meaningful brand loyalty among bifacial-focused developers. Continued bifacial cost declines should further reinforce this segment's growth trajectory.
Market Impact: Targets the fast-growing 45% bifacial attach rate share

Reduce Field Failure Rates Through Quality Testing

Investing in more rigorous component quality testing and extended burn-in protocols reduces field failure rates that currently run under 0.5 percent annually but still generate meaningful operations and maintenance cost concerns among utility-scale asset owners managing large multi-site portfolios. Manufacturers with demonstrably lower failure rates and longer warranty terms increasingly command buyer preference from risk-averse developers and lenders who weight reliability heavily during financing due diligence and long-term operations and maintenance cost modeling exercises. Extended warranties funded by these improvements strengthen competitive positioning considerably. Field data collection also accelerates future design iteration cycles considerably.
Market Impact: Cuts failure rates to below 0.5% every year

Who Controls the Margin Pool

The market remains moderately concentrated, with the top five manufacturers holding an estimated 58 percent combined shipment-capacity share globally today. SolarEdge Technologies leads independent optimizer specialists by a meaningful margin, while Huawei and Sungrow compete closely through integrated inverter-optimizer bundles targeting comparable utility-scale project segments across most major markets worldwide and their expanding regional distribution networks. Smaller regional players compete mainly through localized pricing and service advantages.
Current competitive activity centers on software differentiation, inverter integration partnerships, and bifacial-specific product development rather than pure hardware price competition alone across most manufacturer strategies. Chinese manufacturers are increasingly exporting cost-competitive integrated systems into emerging utility-scale markets, intensifying price pressure on premium independent specialists defending their software and reliability positioning against lower-cost bundled alternatives and aggressive new entrants. Warranty terms increasingly serve as a key competitive differentiator across the industry.

Rankings could shift meaningfully as bundled inverter-optimizer systems continue capturing share from standalone optimizer specialists across most utility-scale project tenders and procurement decisions. Manufacturers with strong software platforms and bifacial-specific product lines are best positioned, while smaller hardware-only competitors risk losing ground to better-capitalized rivals investing heavily in integrated system development, software capability, and global distribution reach.
utility-scale-power-optimizer-market-company-positioning-matrix-1788256659829

Competitive Moat and Risk Dimensions

SOLAREDGE TECHNOLOGIES

Moat: Software Platform Depth Advantage

SolarEdge's mature cloud monitoring platform and extensive installed base give it data and software development advantages that newer entrants and hardware-only competitors cannot replicate quickly, reinforcing customer retention through switching costs tied to established monitoring workflows, historical performance data, and integrated maintenance service relationships built over many years.
SOLAREDGE TECHNOLOGIES

Risk: Inverter Bundling Competitive Pressure

SolarEdge's standalone optimizer business model faces growing pressure from integrated inverter manufacturers bundling comparable optimization capability directly into their product lines, potentially eroding SolarEdge's addressable market as bundled procurement becomes the industry default among cost-conscious utility-scale developers seeking simplified vendor relationships and clearer single-point accountability.
HUAWEI

Moat: Integrated Manufacturing Scale Advantage

Huawei's vertically integrated inverter and optimizer manufacturing, combined with massive domestic Chinese production scale, gives it cost advantages that pure-play optimizer specialists dependent on third-party inverter partnerships cannot match, supporting aggressive pricing in cost-sensitive emerging markets across Asia, Latin America, and parts of Africa where price sensitivity remains particularly acute.
HUAWEI

Risk: Geopolitical Trade Restriction Exposure

Huawei faces ongoing trade restrictions and market access limitations in several Western markets tied to broader geopolitical technology tensions, constraining its addressable market and forcing continued reliance on China, emerging markets, and friendly trading partner regions for growth rather than the higher-margin developed markets its competitors can still freely access.

Players Tracked

Prominent Players

SolarEdge Technologies
Tigo Energy
Huawei
Sungrow
SMA Solar Technology

Other Key Players

Delta Electronics
Fronius International
GoodWe
Sineng Electric
Ginlong Solis
Growatt New Energy
Chint Power Systems
Enphase Energy
Power Electronics
TMEIC
Schneider Electric
ABB
Yaskawa Solectria Solar
Hoymiles Power Electronics
Deye

Recent Developments

JANUARY 2026

SolarEdge launched a new bifacial-optimized power optimizer product line specifically engineered for utility-scale installations, targeting the fastest-growing segment of the market as bifacial module adoption continues accelerating across major solar development regions worldwide and their expanding project pipelines and procurement cycles for the coming years.
Signal: Signals independent optimizer specialists are prioritizing bifacial-specific engineering to defend their existing market position more broadly
SEPTEMBER 2025

Huawei announced an expanded partnership with a major utility-scale developer to supply integrated inverter-optimizer systems across a multi-gigawatt project pipeline spanning several countries, reinforcing its position in the fast-growing bundled systems segment considerably across multiple regional markets, procurement channels, financing structures, and long-term supply agreements.
Signal: Signals integrated bundled systems continue capturing meaningful share from standalone optimizer hardware providers globally and steadily
APRIL 2025

Sungrow acquired a smaller software analytics company to strengthen its cloud monitoring and predictive diagnostics capability, aiming to compete more directly with SolarEdge's established software platform advantage among sophisticated utility-scale asset owners managing large multi-site portfolios across several regions, countries, and financing structures. Terms remain confidential.
Signal: Signals hardware manufacturers are investing heavily in software capability to defend their competitive positioning more broadly

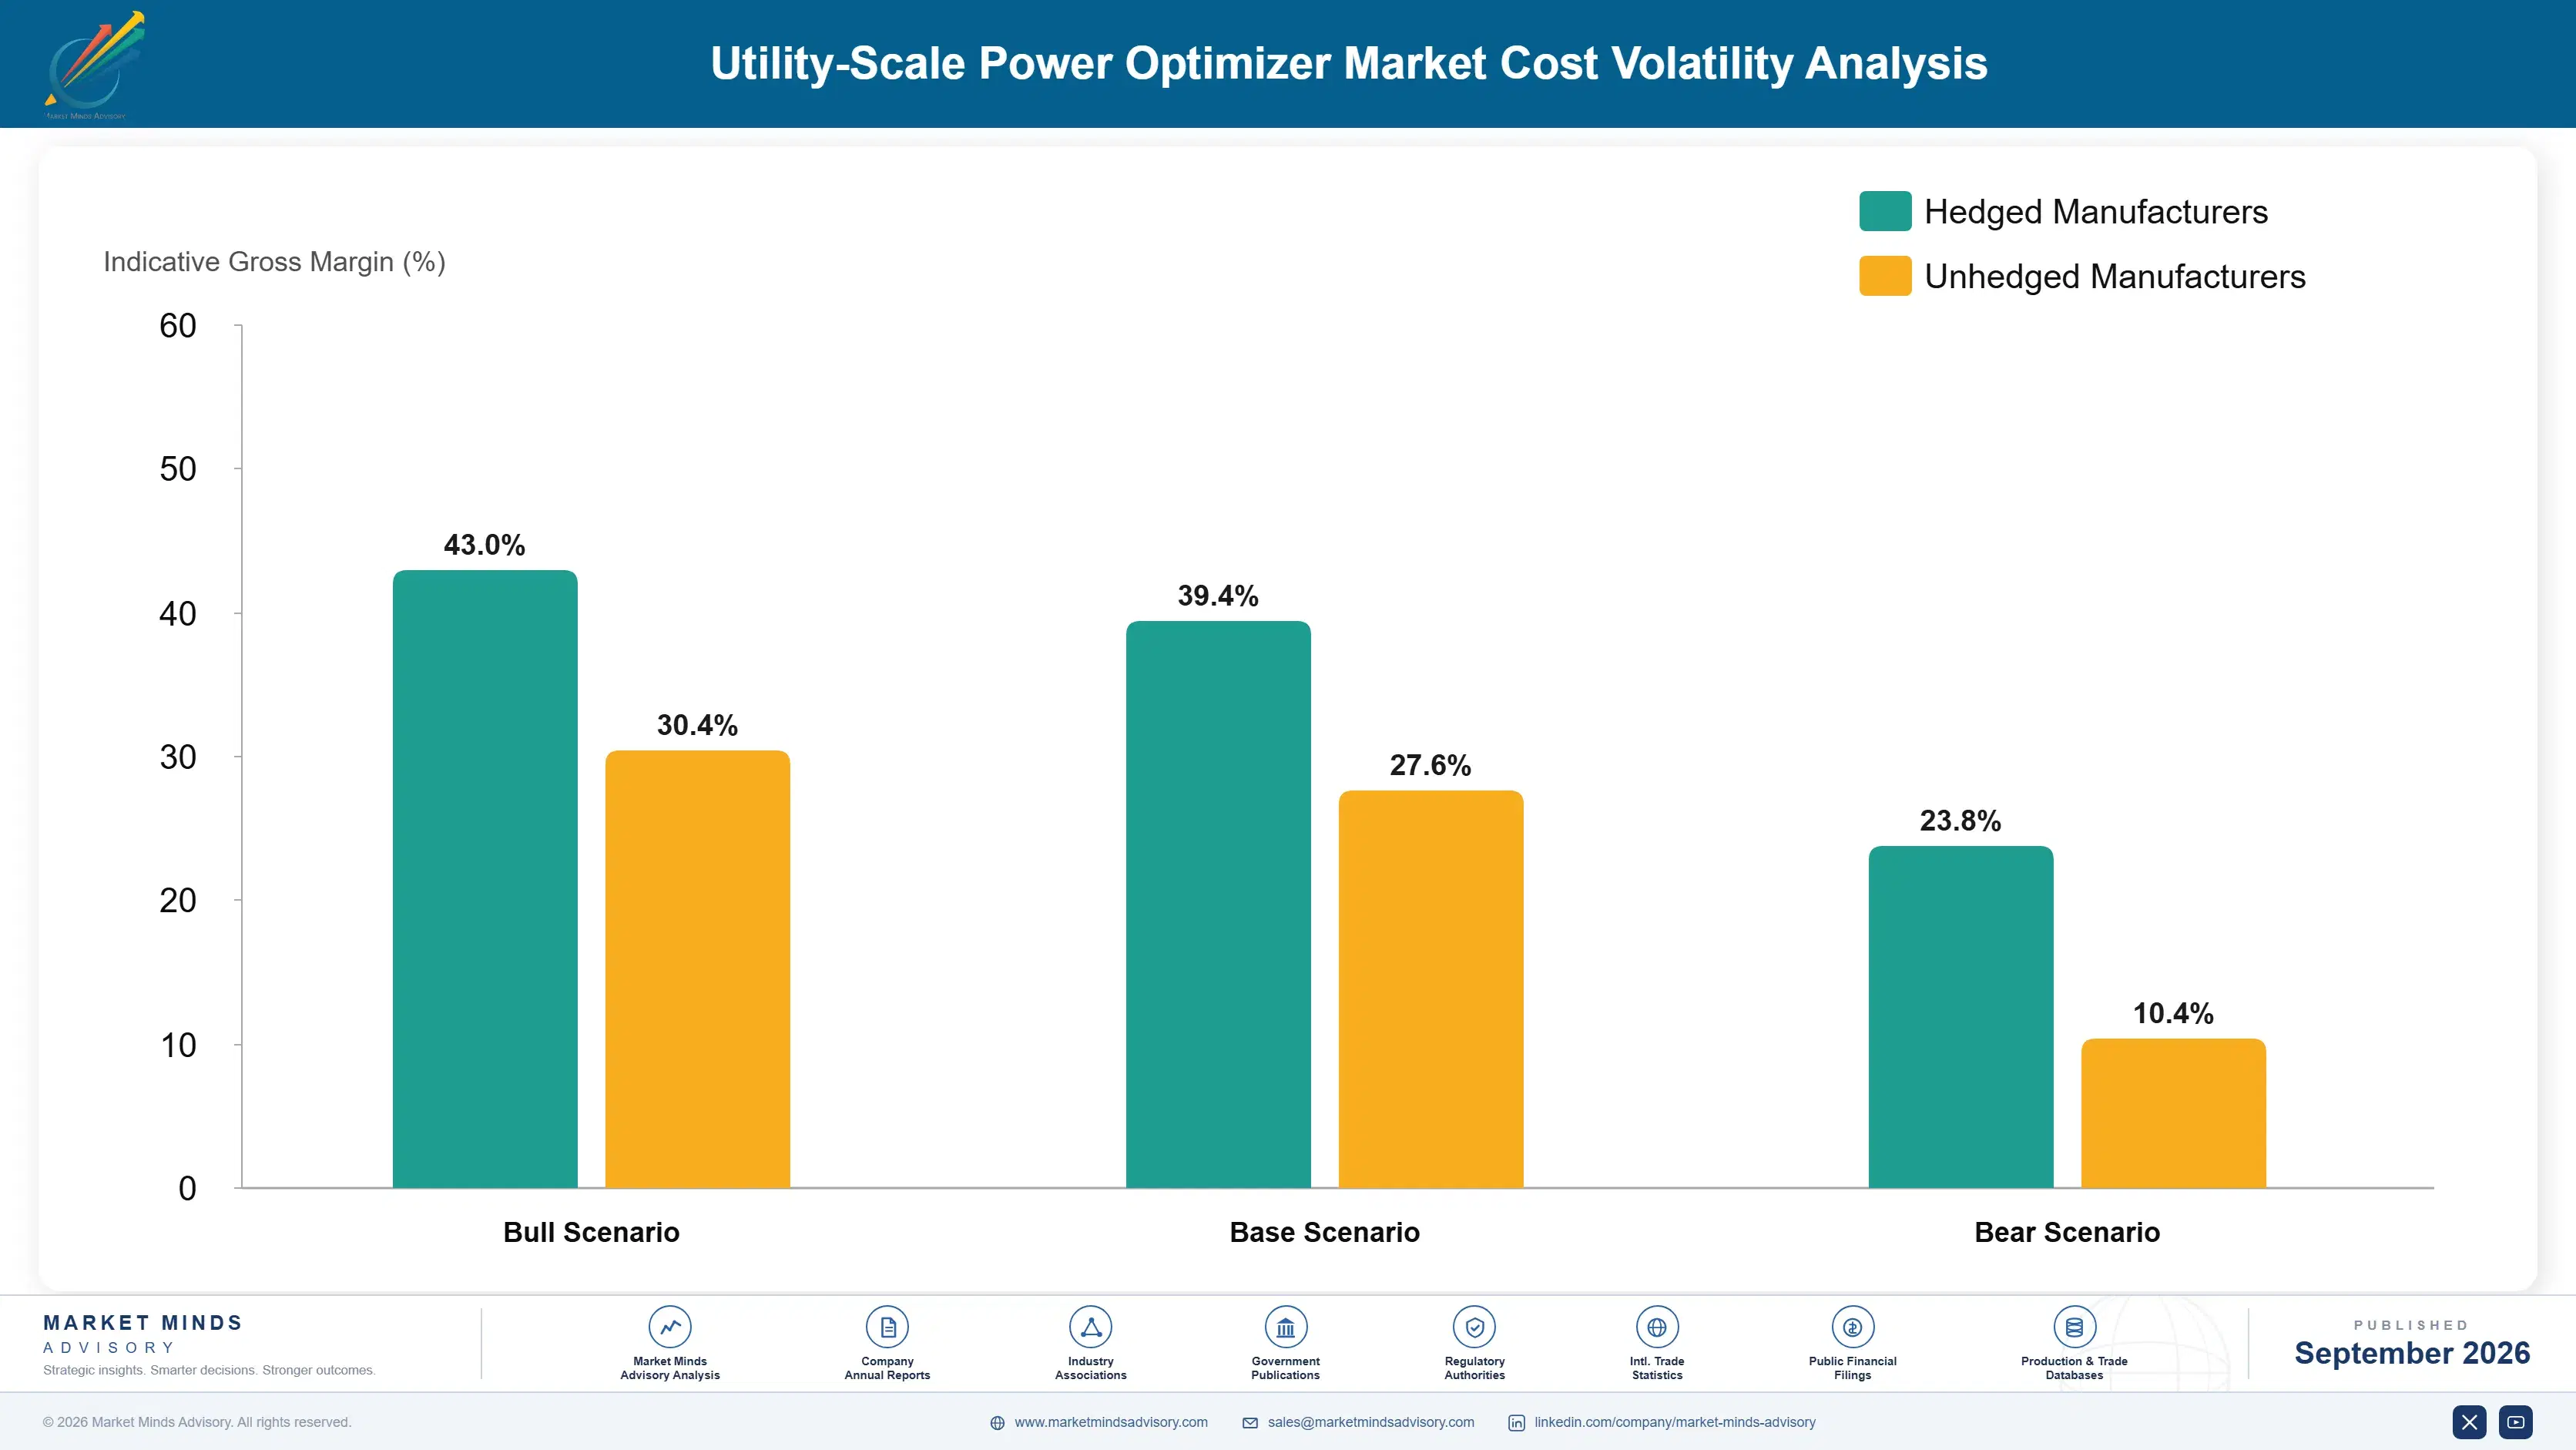
Semiconductor Costs Shape Optimizer Margins

Power semiconductor components, printed circuit board assembly, and enclosure materials represent 50 to 60 percent of total optimizer production cost, with semiconductor sourcing increasingly concentrated among a handful of specialized chip manufacturers supplying the broader solar and industrial electronics sector across multiple end markets and applications worldwide, spanning automotive, consumer electronics, and renewable energy simultaneously.
Global semiconductor supply constraints during 2021 and 2022 extended optimizer delivery lead times to over six months at their peak, according to industry supplier disclosures, delaying several utility-scale project commissioning schedules and forcing developers to lock in component allocation well ahead of installation timelines across most major manufacturers and their global supply chains, some of which have not fully normalized even years later. Component lead times have since normalized but remain a watch item for procurement teams.

Manufacturers without diversified semiconductor supplier relationships face considerably higher supply disruption risk than larger competitors with dedicated procurement teams and multi-source component qualification programs built over many years of supplier relationship development. This dynamic increasingly favors scaled manufacturers like Huawei and Sungrow over smaller independent specialists dependent on single-source component relationships and limited procurement leverage.
utility-scale-power-optimizer-market-cost-volatility-analysis-1788256660025

Qualify Multiple Semiconductor Supplier Sources

Establishing qualified relationships with multiple semiconductor suppliers reduces exposure to single-source supply disruption, protecting production continuity during component shortage events that have repeatedly disrupted delivery schedules across the broader electronics industry in recent years and supply cycles. Manufacturers with established multi-source qualification programs weathered the last shortage cycle considerably better than single-source-dependent competitors. Diversification takes time.

Build Strategic Component Inventory Buffers

Maintaining strategic inventory buffers for critical semiconductor components provides a cushion against short-term supply disruptions, trading modest carrying cost for meaningfully reduced risk of production delays during periods of component market volatility and unexpected demand surges. Excessive buffering carries its own carrying cost risk, so manufacturers calibrate stock levels carefully against realistic demand forecasting models.

Redesign Circuits for Component Flexibility

Engineering optimizer circuit designs to accommodate multiple interchangeable semiconductor component options reduces dependence on any single supplier's specific chip architecture, providing manufacturers flexibility to shift sourcing quickly when supply constraints emerge unexpectedly across the broader component supply chain. This flexible design approach requires more upfront engineering investment but pays back considerably during future supply disruption events.

Portfolio Architecture for Margin Defence

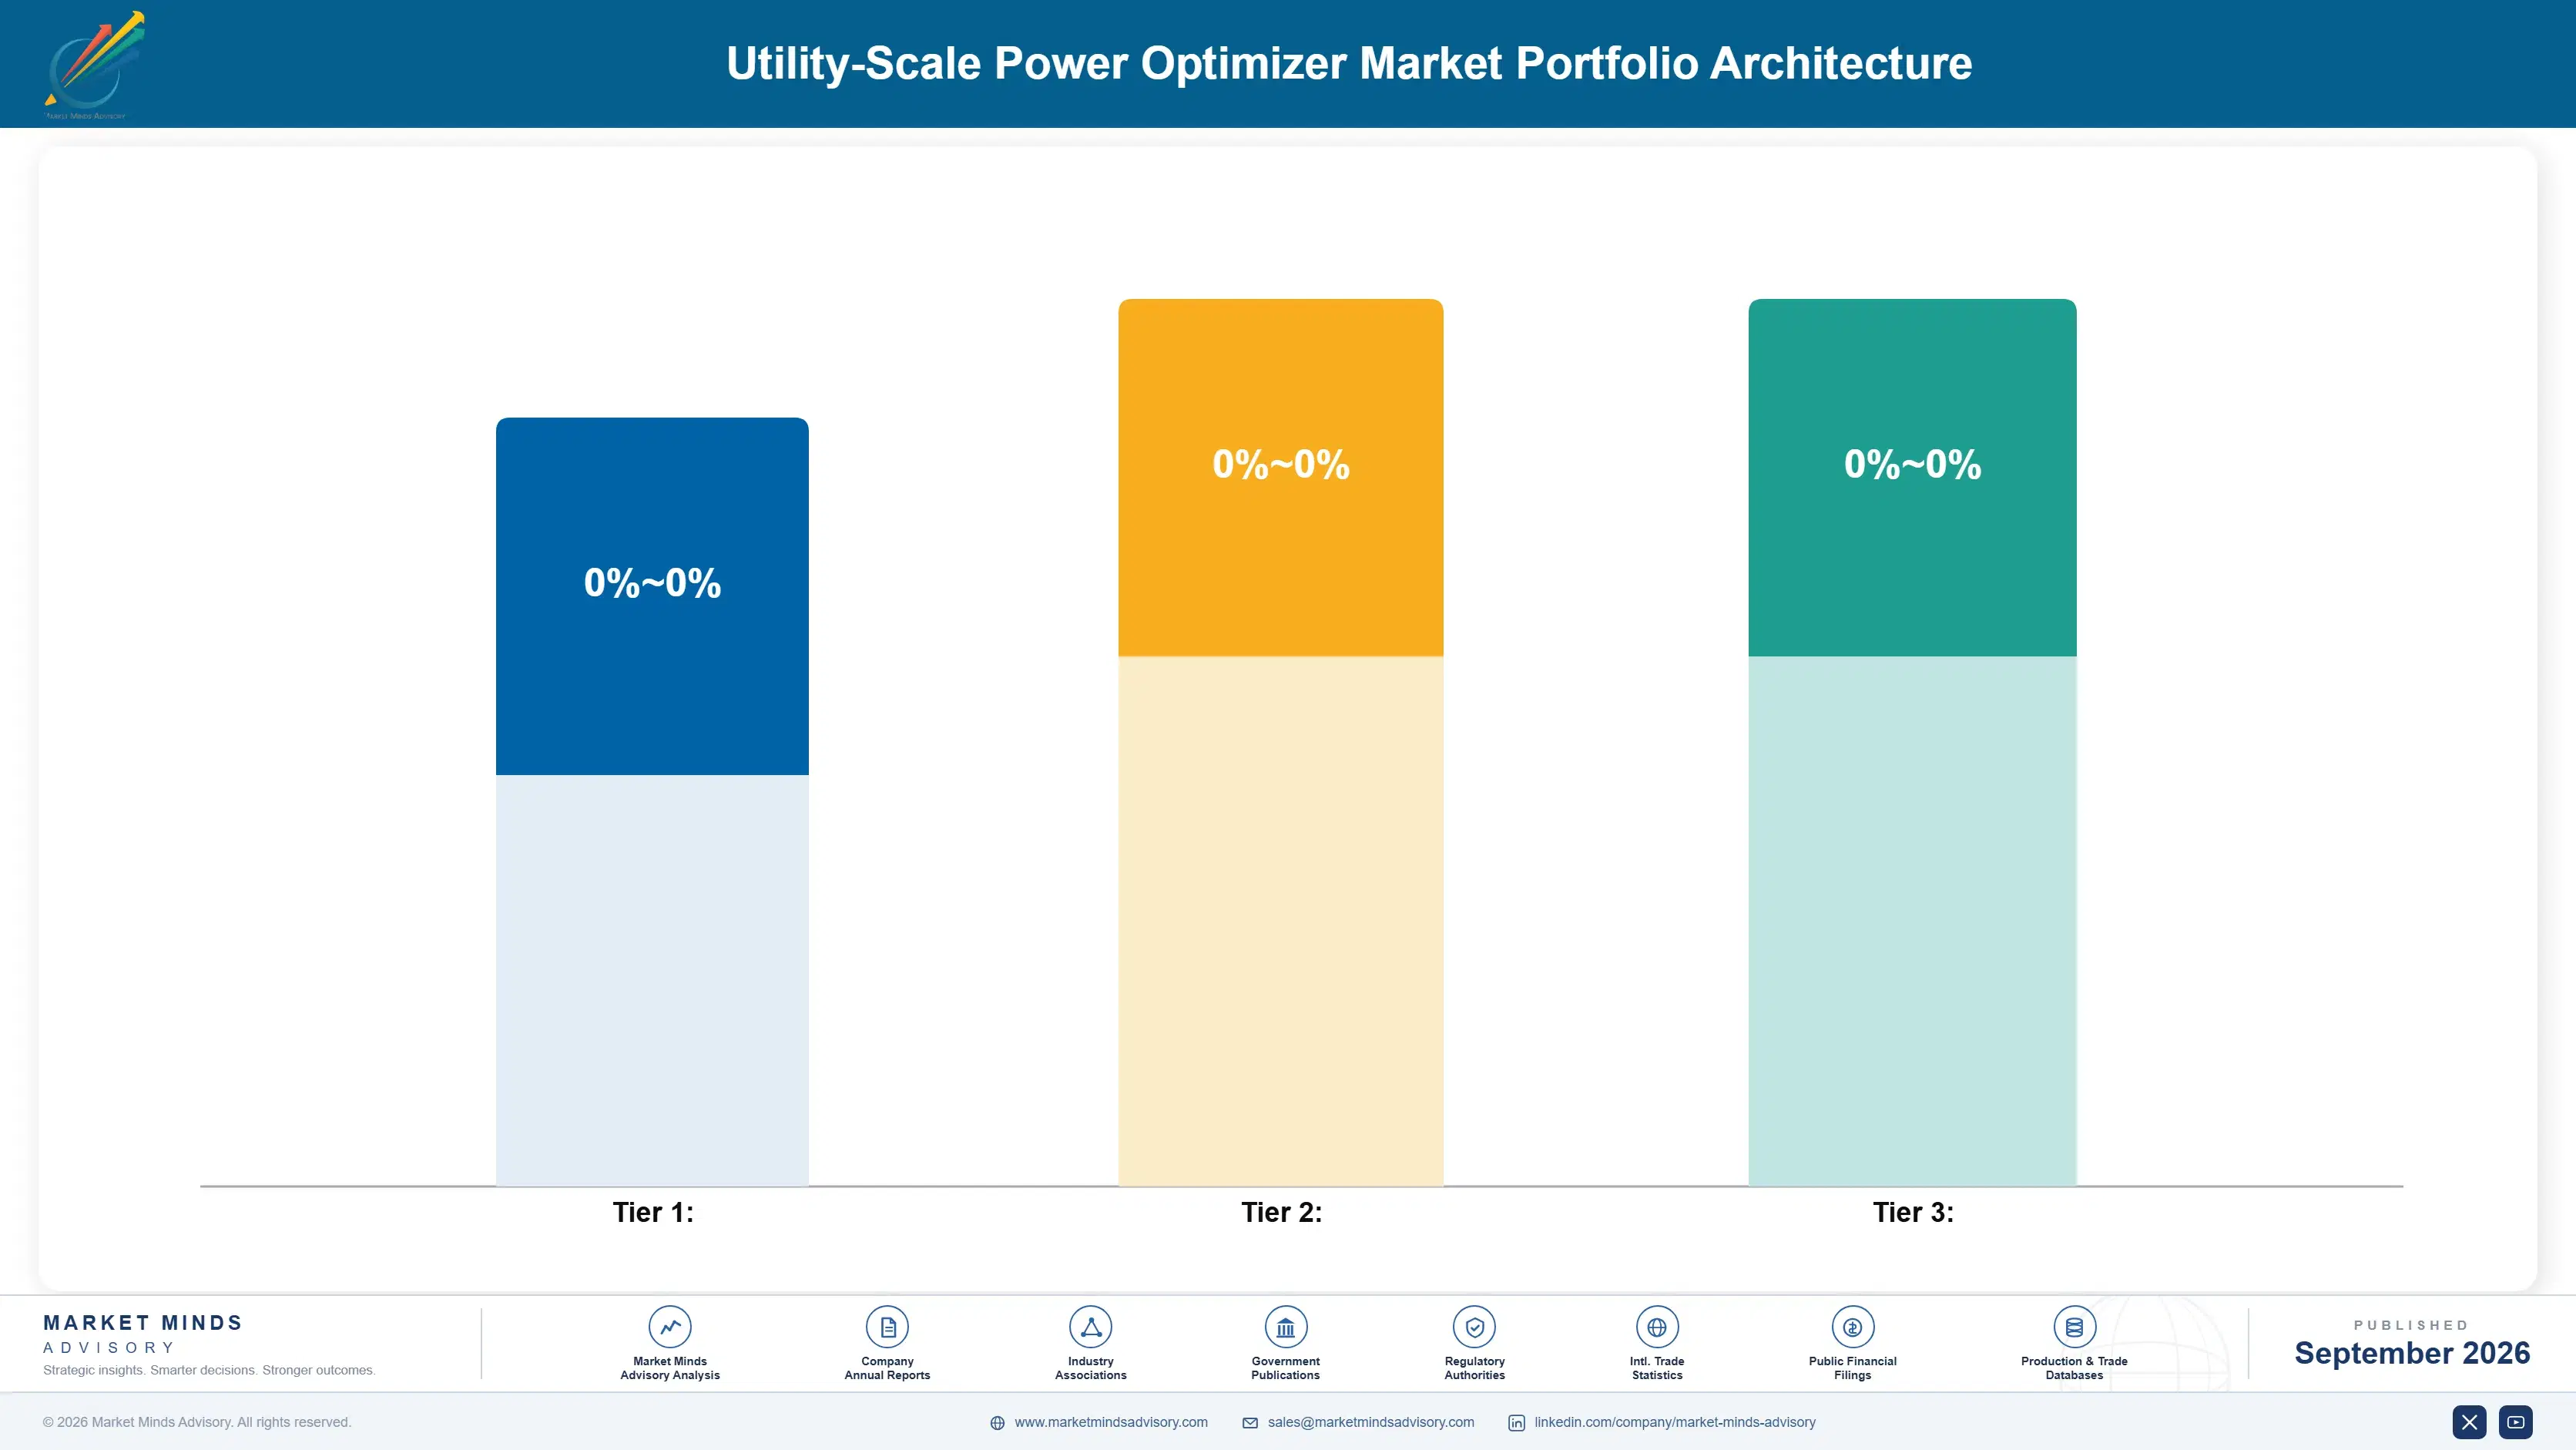
Manufacturer portfolios split across three tiers: commodity hardware-only optimizers competing on price, integrated bundled systems commanding procurement-simplification premiums, and next-generation bifacial-optimized and software-differentiated products still gaining share across most major markets. Margin economics diverge meaningfully between tiers, and the gap continues widening as software and bundling become more prevalent industry-wide. This bifurcation increasingly shapes manufacturer investment priorities and product roadmap decisions.
Hardware-only commodity products compete almost entirely on manufacturing cost and basic reliability, with thin margins that leave little room for differentiation beyond price and warranty terms built over many years of market presence. Integrated bundled and software-differentiated products capture meaningfully wider margins through procurement simplification and data-driven service revenue, insulating manufacturers from pure hardware price competition entirely across most product categories. Manufacturers without a credible software strategy increasingly struggle to defend premium pricing.

High-value pools concentrate in bifacial-optimized and cloud-software-enabled segments, where technology differentiation and recurring software revenue reward manufacturers willing to invest in engineering and platform development considerably over time. Commodity hardware-only optimizers remain the volume anchor but offer limited margin upside absent meaningful software or bundling differentiation across most standard procurement channels and developer relationships. Investment allocation increasingly follows this margin logic across most manufacturer strategic plans.

Hardware-only optimizers competing primarily on manufacturing cost and basic reliability specifications for price-sensitive utility-scale procurement decisions across most cost-conscious emerging and mature markets alike, offering minimal software differentiation. Regional price wars remain common.
Gross Margin

Integrated bundled inverter-optimizer systems commanding procurement-simplification premiums from developers seeking single-vendor accountability and consolidated warranty and support relationships across their entire project lifecycle and financing structure. Warranty terms matter considerably here.
Gross Margin

Bifacial-optimized and cloud-software-enabled products still gaining broader market penetration among sophisticated utility-scale developers valuing yield performance, data visibility, and predictive maintenance capability over pure hardware cost. Investment here continues rising steadily.
Gross Margin
utility-scale-power-optimizer-market-portfolio-architecture-1788256660529

High-value Sub-segments and Strategic Watch-out

Bifacial-Optimized Power Optimizer Modules

The clearest high-value, high-growth pool, combining strong technology-driven margins with a 14.5 percent CAGR as bifacial adoption accelerates across most utility-scale project pipelines and manufacturer product roadmaps. Manufacturers continue racing to launch dedicated bifacial-tuned product lines as this segment expands considerably faster than the overall market average.

Integrated Inverter-Bundled Optimizer Systems

Strong margins and steady growth from procurement simplification appeal and expanding inverter manufacturer product portfolios across most major markets and developer relationships built over multiple project cycles. Independent optimizer specialists face growing pressure to match this bundled convenience through their own integration partnerships or lose share steadily.

Standalone Hardware-Only Optimizer Units

The volume core for now, generating meaningful revenue despite thinner margins, anchored by established manufacturing scale and distribution relationships built over many years of market presence. Price competition remains intense here as differentiation opportunities narrow considerably relative to software-enabled and bundled alternatives gaining share. Volume stays high.

Legacy String-Compatible Retrofit Optimizers

A strategic watch-out given declining relevance as new installations increasingly favor integrated designs over retrofit-compatible standalone hardware options across most greenfield project development pipelines. Manufacturers still serving this niche increasingly focus on maintenance and replacement demand rather than new installation opportunities. Decline continues steadily. Interest keeps fading.

Yield Guarantees Drive Recurring Replacement

Demand for power optimizers behaves as a project-lifecycle annuity rather than one-time hardware purchase, since twenty-year warranty terms and periodic component replacement generate recurring revenue opportunities across each installed project's operating lifetime and eventual repowering cycle. Software and monitoring subscription revenue increasingly supplements the initial hardware sale, extending the manufacturer relationship well beyond installation and commissioning into ongoing operations and maintenance support.
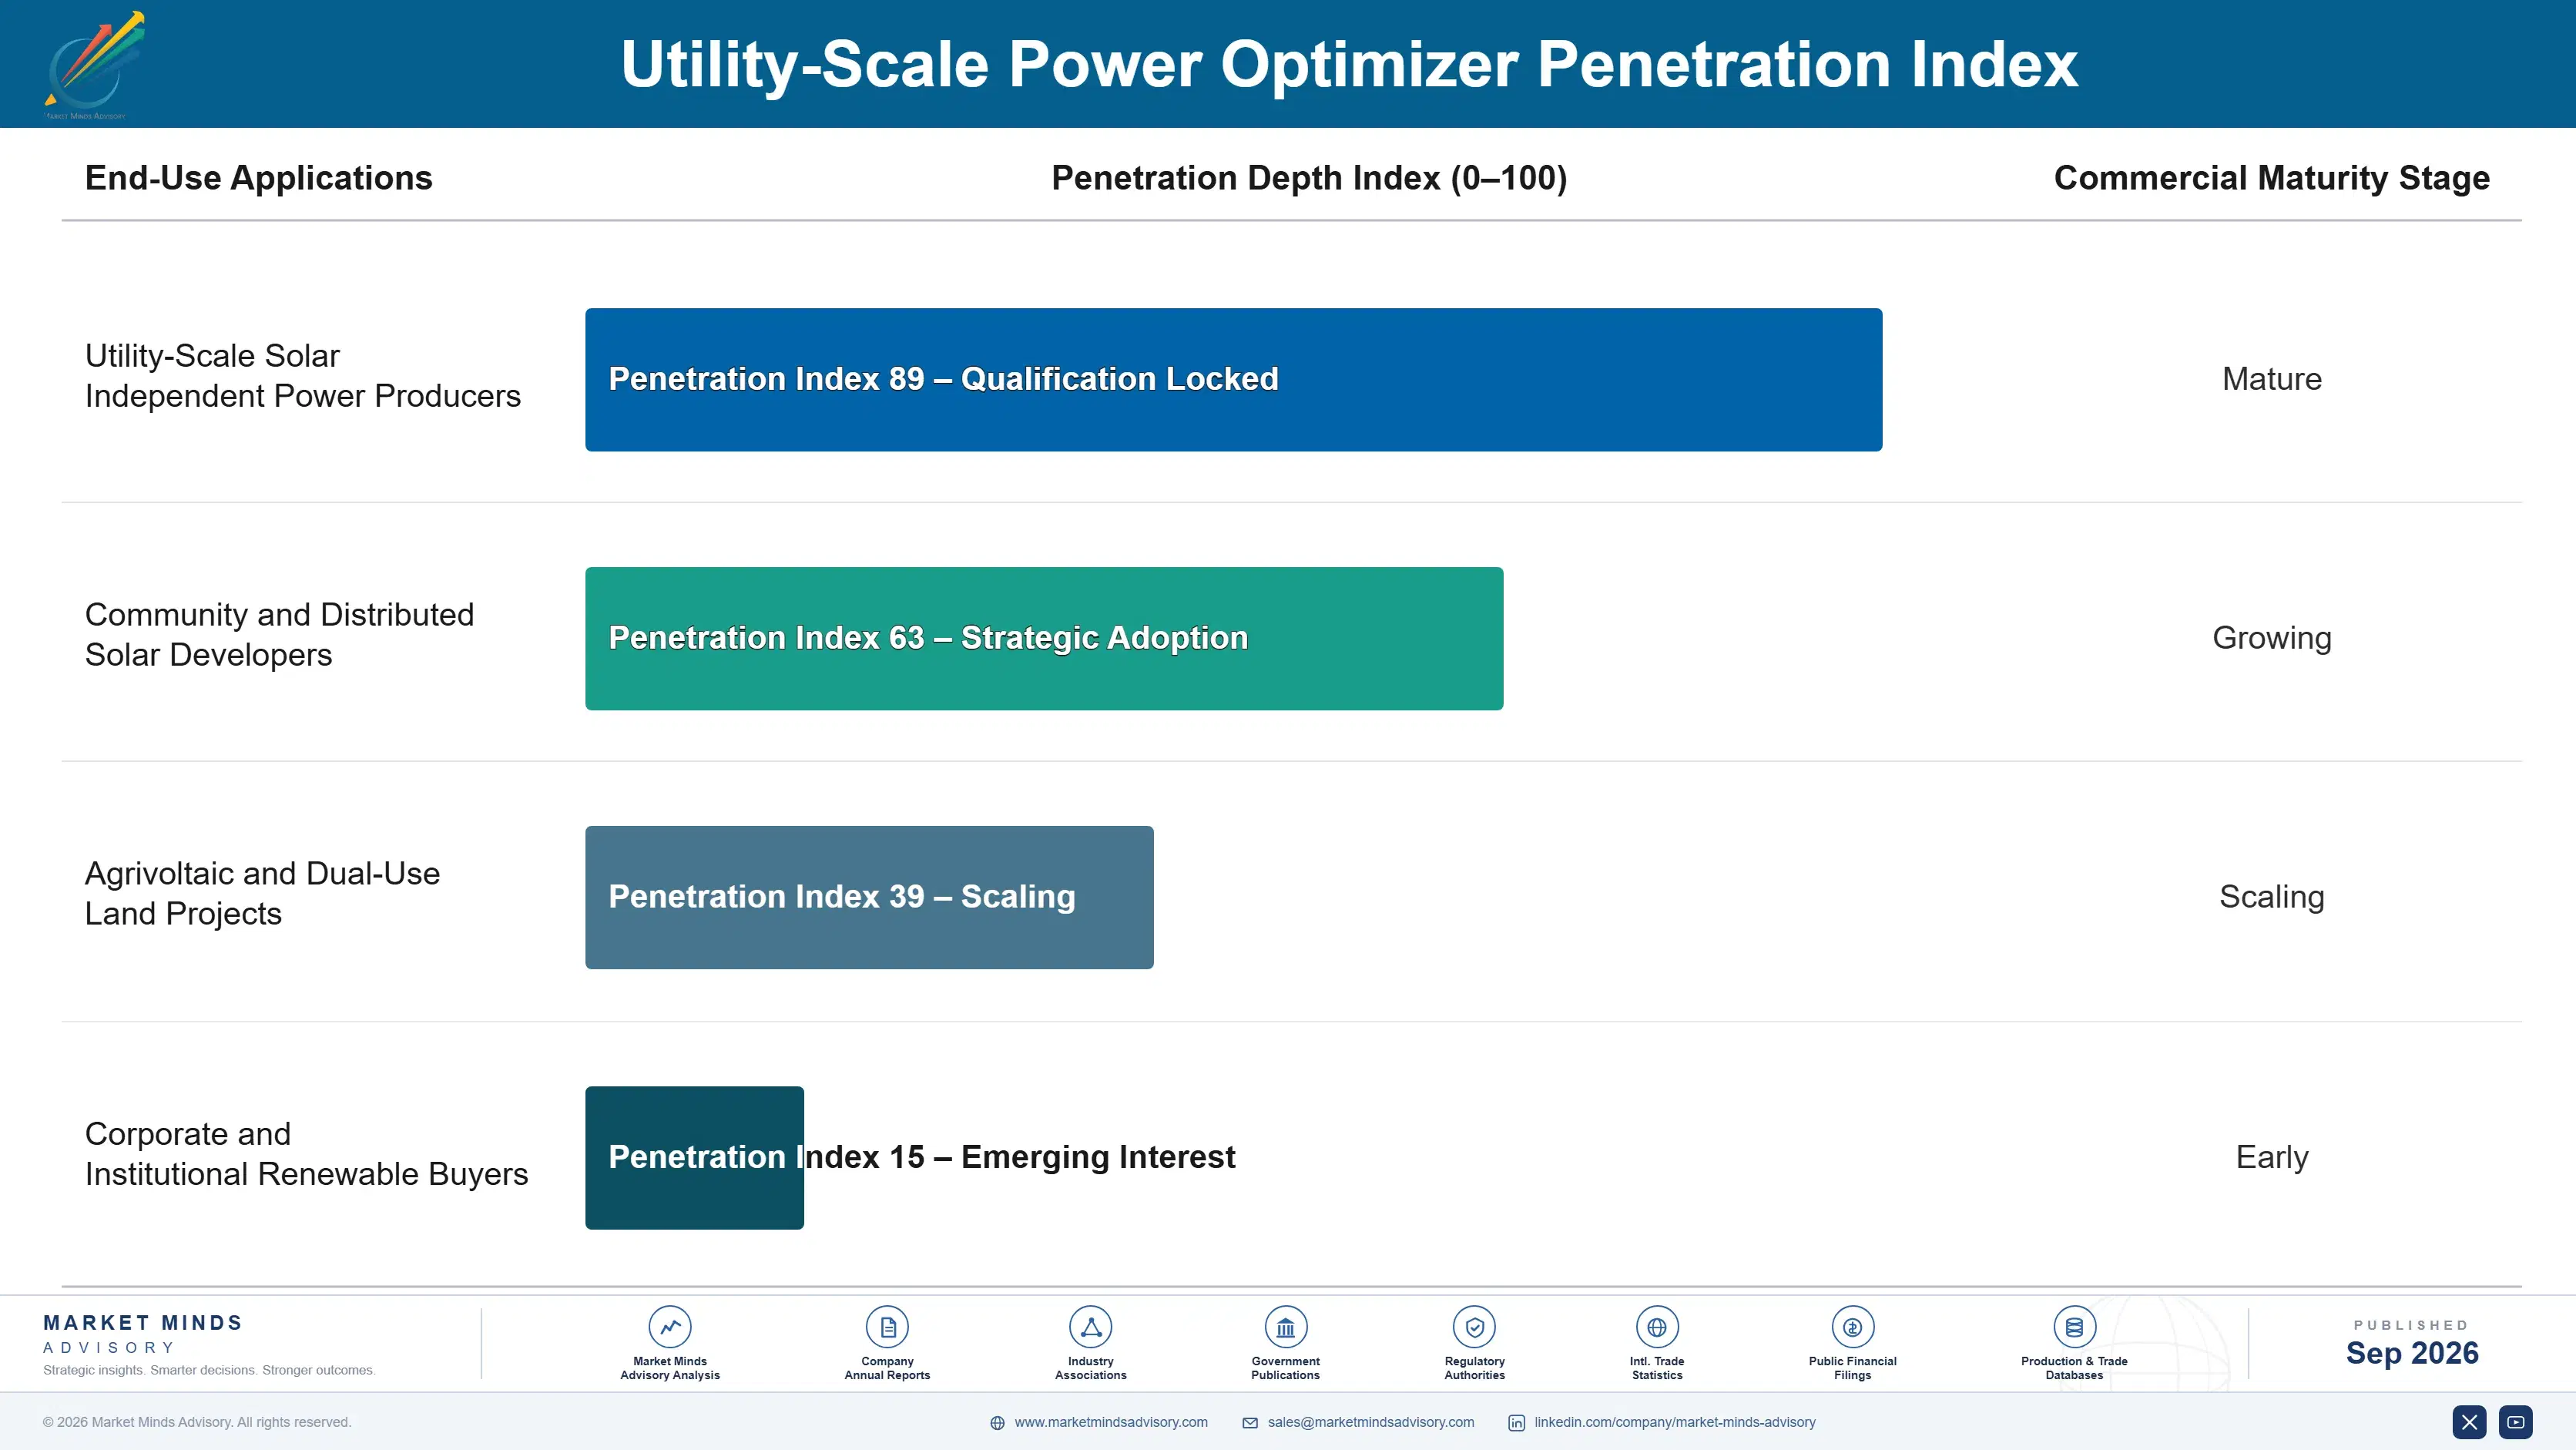
Adoption depth varies considerably by site characteristic rather than end-use vertical, since utility-scale solar itself is the primary application: flat, unobstructed sites show minimal optimizer penetration, while complex terrain, partial shading, or bifacial-paired installations show adoption rates approaching universal within their respective project categories. This site-driven adoption pattern means manufacturers must segment demand by installation complexity and terrain characteristics.

Buyer profiles are shifting as institutional asset owners and yield-focused infrastructure funds increasingly specify optimizer requirements directly in procurement documentation, reflecting a generational shift from developer-led technology selection toward financing-driven specification requirements imposed by increasingly sophisticated capital providers evaluating long-term project performance risk. Manufacturers increasingly engage directly with financing and investment teams earlier in the procurement cycle rather than waiting for developer-led technology decisions to reach final specification stages.
utility-scale-power-optimizer-market-end-use-penetration-index-1788256661015

Software and Bifacial Investment Priorities

These are among the four positions where our research anticipates prominent divergence between winners and laggards over the coming forecast period. Each is grounded in the demand model, the regulatory perimeter, and the announced capacity pipeline.
01 / SOFTWARE PLATFORM INVESTMENT

Build cloud monitoring capability before competitors close the gap

Manufacturers relying purely on hardware specifications face a widening gap against software-differentiated competitors already capturing 10 to 15 percent price premiums from sophisticated asset owners managing large multi-site portfolios across most major markets. Cloud monitoring platforms take years to mature into genuinely useful predictive diagnostics tools, meaning manufacturers starting now will only reach competitive parity as software expectations continue rising across the industry and buyer sophistication increases. Delaying software investment further risks permanent share loss among the fastest-growing premium customer segment.
02 / BIFACIAL PRODUCT DEVELOPMENT

Engineer bifacial-specific optimizer variants without further delay

Bifacial-paired installations already show a 45 percent optimizer attach rate compared with under 25 percent for monofacial installations, and this gap will likely widen as bifacial module costs continue declining relative to monofacial alternatives across most utility-scale markets. Manufacturers without dedicated bifacial firmware and hardware optimization risk losing share in the fastest-growing segment of the market to competitors already capturing this demand through targeted product development. Early investment in bifacial-specific engineering positions manufacturers well ahead of the broader industry shift.
03 / INVERTER PARTNERSHIP STRATEGY

Secure integration partnerships with major inverter manufacturers

Bundled inverter-optimizer systems now represent roughly 55 percent of new optimizer-equipped project capacity, up sharply from 30 percent five years earlier, meaning independent optimizer specialists without integration partnerships face a shrinking addressable market over time. Securing partnerships with major inverter manufacturers provides distribution reach through established sales channels that standalone specialists struggle to replicate independently at comparable scale or cost. Manufacturers that delay these partnerships risk being squeezed out entirely as bundled procurement becomes the accepted industry default across most utility-scale markets.
04 / RELIABILITY AND WARRANTY STRATEGY

Reduce field failure rates through rigorous quality testing

Field failure rates for distributed module-level electronics, while generally low, create meaningful operations and maintenance cost concerns that increasingly influence purchasing decisions among risk-averse developers and lenders evaluating long-term project economics. Manufacturers demonstrating lower failure rates and longer warranty terms through rigorous quality testing and extended burn-in protocols increasingly command buyer preference during financing due diligence and technical evaluation processes. Investing in reliability now positions manufacturers favorably as yield guarantee requirements continue tightening across the broader utility-scale solar industry going forward.

Engagement Snapshot From the Field

A live engagement with an industry participant carrying material or product regulatory and market exposure ahead of a defining policy shift, showing how our research translates into a defensible multi-year portfolio strategy.
MARKET MINDS ADVISORY · CLIENT ENGAGEMENT SUMMARY
Utility-Scale Power Optimizer Producer Strategic Portfolio Review and Transition Roadmap 2026·Investment Scenario on Utility-Scale Power Optimizer Exposure Evaluation 2025-26
CLIENT PROFILE
A mid-sized independent power optimizer manufacturer with an established hardware-only product line and meaningful market presence in North America sought to evaluate whether developing a bifacial-specific optimizer variant made commercial sense given accelerating bifacial module adoption and growing competition from integrated inverter-bundled systems entering its core addressable market segment and customer base. Its board wanted a data-driven recommendation before committing significant engineering resources.
STRATEGIC CHALLENGE
The client's engineering resources were focused on maintaining its existing hardware product line, leaving limited capacity for new bifacial-specific development, while competing manufacturers were already shipping dedicated bifacial-optimized products and capturing early share in the fastest-growing segment of the broader optimizer market across several key regional territories. Leadership needed clarity on the fastest viable path forward.
MMA APPROACH
MMA benchmarked bifacial-optimized product launches from three category leaders, modeled the revenue opportunity from the client's existing bifacial-adjacent customer base, and evaluated build-versus-partner options for acquiring bifacial-specific engineering capability within a realistic twelve-month development timeline given the client's current resource constraints and competitive positioning. Interviews with prospective firmware partners informed the final recommendation.
KEY FINDINGS
  1. A dedicated engineering team could develop a competitive bifacial-optimized product within roughly ten to twelve months of sustained effort (client-reported, unverified by MMA).
  2. Existing customers showed strong interest in a bifacial-specific product, with 60 percent indicating likely early adoption within the first year (client-reported, unverified by MMA).
  3. Partnering with a specialized firmware developer could reduce development time by approximately three months compared to solo development (client-reported, unverified by MMA).
  4. Competitors without bifacial-specific products saw meaningful share loss within their core bifacial-adjacent customer segments over the past year (client-reported, unverified by MMA).
CLIENT PROFILE
A mid-sized independent power optimizer manufacturer with an established hardware-only product line and meaningful market presence in North America sought to evaluate whether developing a bifacial-specific optimizer variant made commercial sense given accelerating bifacial module adoption and growing competition from integrated inverter-bundled systems entering its core addressable market segment and customer base. Its board wanted a data-driven recommendation before committing significant engineering resources.
STRATEGIC CHALLENGE
The client's engineering resources were focused on maintaining its existing hardware product line, leaving limited capacity for new bifacial-specific development, while competing manufacturers were already shipping dedicated bifacial-optimized products and capturing early share in the fastest-growing segment of the broader optimizer market across several key regional territories. Leadership needed clarity on the fastest viable path forward.
MMA APPROACH
MMA benchmarked bifacial-optimized product launches from three category leaders, modeled the revenue opportunity from the client's existing bifacial-adjacent customer base, and evaluated build-versus-partner options for acquiring bifacial-specific engineering capability within a realistic twelve-month development timeline given the client's current resource constraints and competitive positioning. Interviews with prospective firmware partners informed the final recommendation.
KEY FINDINGS
  1. A dedicated engineering team could develop a competitive bifacial-optimized product within roughly ten to twelve months of sustained effort (client-reported, unverified by MMA).
  2. Existing customers showed strong interest in a bifacial-specific product, with 60 percent indicating likely early adoption within the first year (client-reported, unverified by MMA).
  3. Partnering with a specialized firmware developer could reduce development time by approximately three months compared to solo development (client-reported, unverified by MMA).
  4. Competitors without bifacial-specific products saw meaningful share loss within their core bifacial-adjacent customer segments over the past year (client-reported, unverified by MMA).
RECOMMENDED STRATEGY
Phase 1: Phase one: partner with a specialized firmware developer to meaningfully accelerate bifacial-specific product development timelines. Timeline discipline matters considerably here. Phase 2: Phase two: launch a pilot bifacial-optimized product with existing customers before beginning full-scale commercial rollout activities. Pilot feedback informs final design refinements. Phase 3: Phase three: scale production and marketing efforts once pilot performance data validates the product's yield improvement claims. Marketing should emphasize verified yield data.
OUTCOME
The client launched its bifacial-optimized product within eleven months using the firmware partnership approach, securing early orders from three existing customers who had indicated strong interest during the initial engagement, ahead of the original twelve-month development target (client-reported, unverified by MMA). Additional customer orders followed shortly after launch.

Frequently Asked Questions

Foundational context covering the market sizes, CAGR, scope, country, region and competition that inform every finding below. This section is provided to cover basics and most often pre-purchase conversations, answered from the MMA Primary Research Dataset.

What is the current size of the Utility-Scale Power Optimizer Market?

The global utility-scale power optimizer market reached an estimated $2.6 billion in 2025, driven by rising panel wattage and bifacial module adoption increasing shading and mismatch loss stakes. East Asia hosts the largest manufacturing base.

How large will the Utility-Scale Power Optimizer Market be by 2036?

MMA projects the market will reach approximately $7.26 billion by 2036, up from $2.85 billion in 2026. That represents roughly a 2.55x expansion across the ten-year forecast window.

What is the CAGR for the Utility-Scale Power Optimizer Market 2026 to 2036?

The base case forecast CAGR is 9.8% across 2026 to 2036, with a bull scenario of 11.1% and a bear scenario of 8.5% depending on component cost trends and bundling competition.

Which segment is growing fastest?

Bifacial-Optimized Power Optimizer Modules lead at a 14.5% CAGR, roughly 1.48 times the overall market rate, as bifacial module adoption drives higher optimizer attach rates industry-wide.

Who are the major companies in the Utility-Scale Power Optimizer Market?

SolarEdge Technologies, Tigo Energy, Huawei, Sungrow, and SMA Solar Technology lead the market, together holding an estimated combined shipment-capacity share of 58% measured globally today.

Which country is growing fastest?

China leads growth at a 13.2% CAGR, supported by its massive utility-scale solar buildout program and dominant domestic inverter-optimizer manufacturing base built out nationwide today.

Report Segmentation Architecture

The full report scope spans multiple orthogonal segmentation dimensions, with cross-tabulated demand data provided for each dimension pair. Coverage extends further to regional breakdowns, trend trajectories, and the competitive detail needed to support segment-level decision-making.
  • Bifacial-Optimized Power Optimizer Modules
  • Integrated Inverter-Bundled Optimizer Systems
  • Standalone Hardware-Only Optimizer Units
  • Legacy String-Compatible Retrofit Optimizers
  • Cloud-Software-Enabled Optimizer Platforms
  • Utility-Scale Solar Independent Power Producers
  • Community and Distributed Solar Developers
  • Agrivoltaic and Dual-Use Land Projects
  • Corporate and Institutional Renewable Buyers
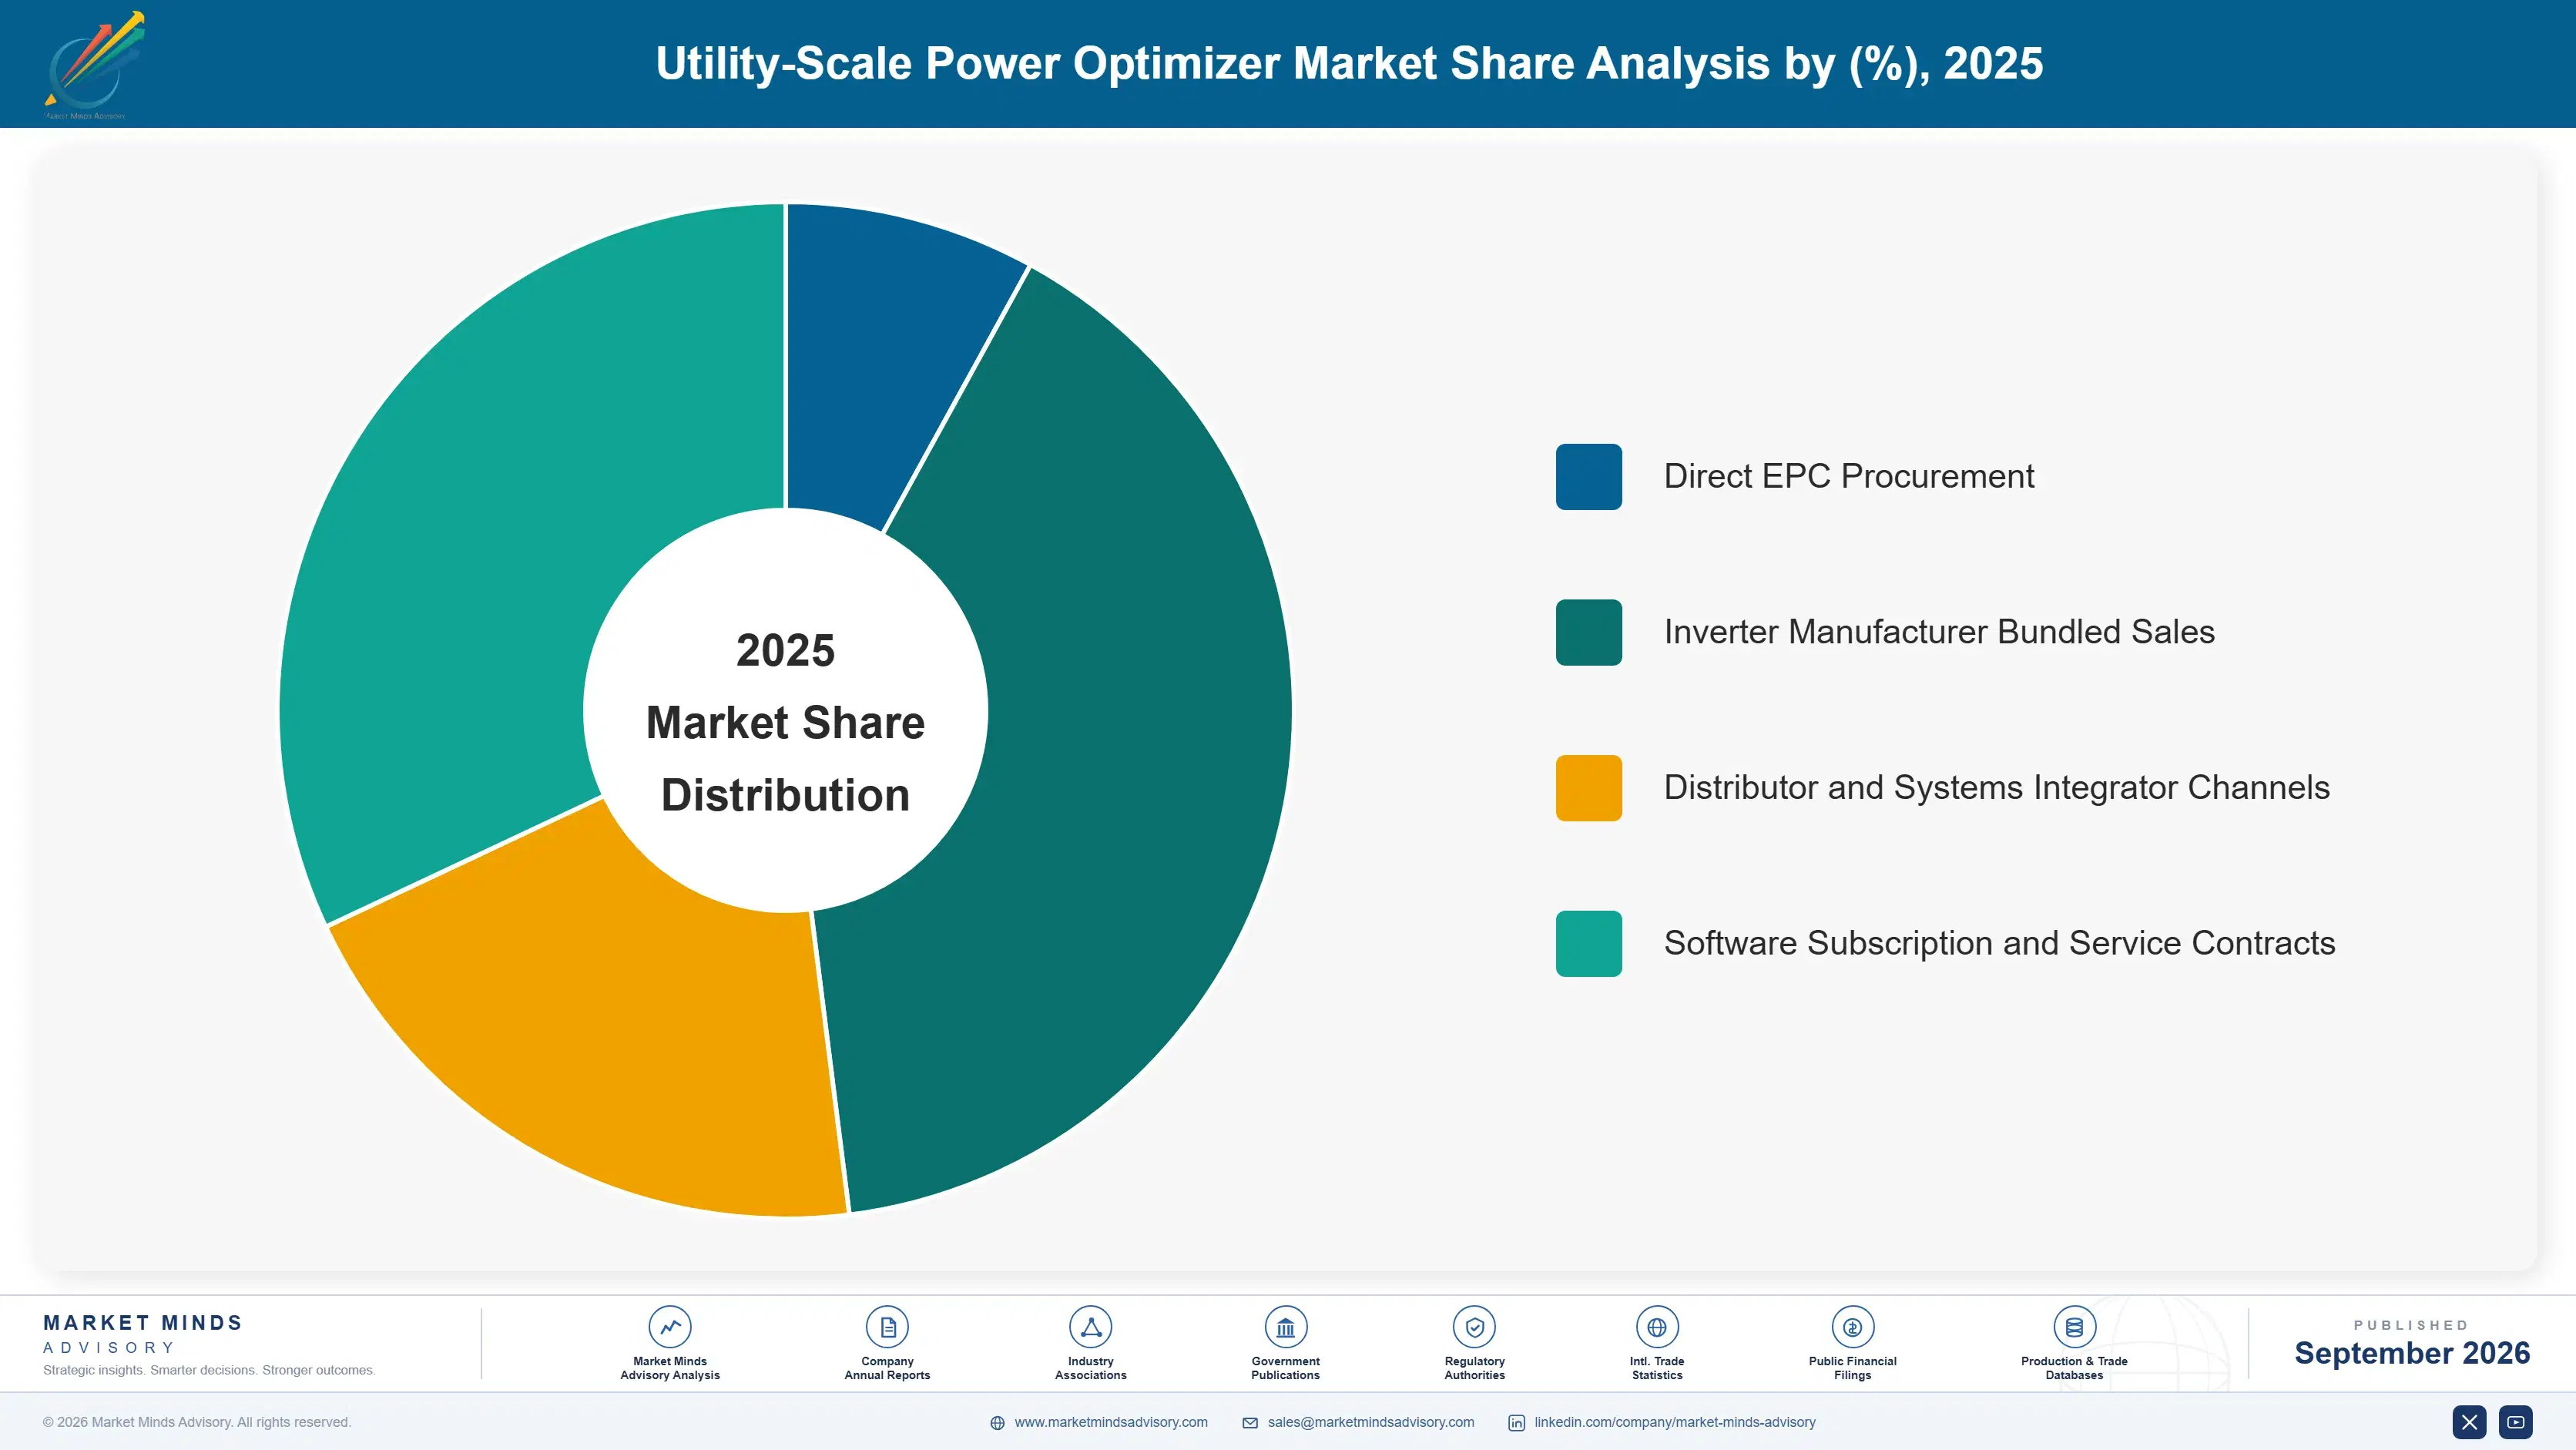
  • Direct EPC Procurement
  • Inverter Manufacturer Bundled Sales
  • Distributor and Systems Integrator Channels
  • Software Subscription and Service Contracts

By Region

  • North America
  • Western Europe
  • East Asia
  • South Asia and Pacific
  • Latin America
  • Middle East and Africa
  • Eastern Europe

Scope, Methodology, and Coverage

Every figure in this report is reproducible from documented input assumptions. The scope below maps the historical period, the forecast horizon, the segmentation dimensions, and the countries covered, alongside the underlying primary and qualitative methodology.
Historical Period
2020 to 2025
Forecast Period
2026 to 2036
Base Year
2025 (USD billions; MMA Primary Research Dataset, September 2026)
Market Definition
This report covers module-level and string-level power optimization equipment used in utility-scale solar photovoltaic installations to maximize energy yield and enable panel-level monitoring, measured on a global shipment-capacity basis. It excludes residential and commercial rooftop optimizers and standalone inverter hardware sold without optimization functionality.
Quantitative Units
USD billions, gigawatts of shipment capacity, and percentage CAGR
Segmentation Dimensions
Product technology (bifacial-optimized, integrated inverter-bundled, standalone hardware-only, legacy retrofit, cloud-software-enabled), end-use vertical, commercial channel, and geography
Regions Covered
North America, Western Europe, East Asia, South Asia and Pacific, Latin America, Middle East and Africa, Eastern Europe
Countries Covered
China, United States, Germany, India, Australia, Chile, and 20+ additional countries across seven global regions
Key Companies Profiled
SolarEdge Technologies, Tigo Energy, Huawei, Sungrow, SMA Solar Technology, and 15 additional manufacturers across the global competitive set
Quantitative Methodology
Primary survey, n=3,800 respondents, Q4 2025, six countries; demand-side model with trade association cross-validation
Qualitative Methodology
47 expert interviews, Q4 2025; applied to validate demand model assumptions, identify emerging dynamics, and assess competitive positioning
Report Format
PDF and XLSX data workbook (Word format preview document)
Publisher
Market Minds Advisory
Report Code
MMA-2026-ENE-127
Published
September 2026
Contact
sales@marketmindsadvisory.com | www.marketmindsadvisory.com

Purchase the full Utility-Scale Power Optimizer Market Report (2026 to 2036).

This report delivers a complete assessment of the global utility-scale power optimizer market across the full 2026 to 2036 forecast period ahead. It combines primary survey data from 3,800 respondents with 47 expert interviews to quantify segment, regional, and competitive dynamics in careful detail. Coverage spans bifacial-optimized, integrated inverter-bundled, and standalone hardware product categories, alongside detailed manufacturer benchmarking across twenty companies. Analysts translate raw data into actionable software strategy, bundling partnership, and market entry guidance for manufacturers, investors, and developers evaluating this maturing power electronics category.
Ten-year global market sizing and forecast model
Seven-region demand, pricing, and share breakdown
Twenty-company competitive benchmarking and positioning analysis
Segment-level growth, margin, and pricing analysis
Semiconductor cost exposure and supply risk assessment
Strategic verdict and prioritized investment guidance

Built For The People Who Decide

From boardroom strategy to bench-side execution, this report is read cover-to-cover by leaders shaping the next decade of their industry, turning demand scenarios, market dynamics and valuation benchmarks into decisions.
CXOs/ Presidents/ VPs/ Managers
M&A and Corporate Development
Strategy Teams and R&D Heads
Procurement and Product Directors
Regulatory and Compliance Leaders
Investor Relations and Equity Analysts