Market Minds Advisory
Utility Asset Management Market

Utility Asset Management Market: Utility Asset Management Market: Functional Classes, Wildfire Liability and Regulatory Incentives 2026 to 2036

An electricity utility's largest financial exposure stopped being a plant failure and became a tree. Settlements in several jurisdictions have exceeded the entire market value of the company held responsible.

Lead Analyst

Published

September 2026

Make Smarter Decisions with Customized Research Insights

Request a free sample report and evaluate market opportunities, growth trends, and competitive dynamics relevant to your business needs.

2025 MARKET VALUE$6.9BMarket Size 2025
2036 FORECAST VALUE$19.3BBase Case , 2026 to 2036
CAGR 2026 TO 20369.8 %Bull 11.1% / Bear 8.6%
INCREMENTAL OPPORTUNITY$11.7BNet 10- year value creation
EXPANSION MULTIPLE2.55x2036 value over 2026 base
Strategic Levers
M&A Pipeline
Regional Outlook
Country Rankings
Competitive Intelligence
Segmental Deep-dive
Call-Us : 91 93563 13602

Executive Snapshot and Market Trajectory.

Wildfire liability changed what this software is for. Settlements in several jurisdictions have exceeded the market value of the utility involved, and the proximate cause is repeatedly vegetation contacting a conductor. Asset management became a solvency question boards now examine directly. Insurers and rating agencies examine it too.
The market reaches USD 7.58 billion in 2026 and USD 19.31 billion by 2036, a 2.55 times expansion at 9.8%. Aerial and remote inspection analytics grow at 14.7%, half again the market rate of 9.8%, because automated imagery inspects a whole network for around USD 41 per kilometre where patrols covered 22% of it. North America holds 34% of software and service revenue on wildfire liability, and Australia compounds fastest at 15.2% on bushfire obligations.
Five suppliers hold 38% of software and service revenue, split between enterprise asset platforms and inspection analytics specialists who did not exist a decade ago. Oracle, IBM, SAP and Hexagon sell registers and work management to utility technology functions. Bentley Systems reaches engineering. AiDash, Overstory and Sharper Shape sell vegetation and inspection analytics into operations and risk budgets instead, which carry no payback test whatsoever. Two buyers, two procurement routes.
Market Definition
This report covers software and analytics services used to manage utility physical network assets: aerial and remote inspection analytics, asset health and condition monitoring, vegetation management planning, risk-based investment planning, work and field force management, and asset register and network records. It excludes metering hardware and advanced metering infrastructure, customer information and billing systems, grid control and supervisory systems, physical inspection contracting labour, and vegetation cutting services themselves.
Base Year Value
$6.9B in 2025 (MMA Primary Research Dataset, September 2026)
Forecast Period
2026 to 2036, eleven discrete annual values
CAGR
9.8% base case. Bull 11.1%. Bear 8.6%.
Fastest Growth Segment
Aerial And Remote Inspection Analytics: 14.7% CAGR
Fastest Growth Country
Australia: 15.2% CAGR
Fastest Growth Region
South Asia and Pacific: 11.8% CAGR
Largest Region
North America: 34% of 2025 global value
Market Leaders
Oracle, IBM, Hexagon, SAP and Bentley Systems lead on utility asset management software and analytics service revenue. Source: MMA Analysis.
Primary Survey
n=3,800 procurement and R&D decision-makers, Q4 2025, six countries
Methodology
Demand-side build-up, cross-validated against public data, 47 expert interviews

Utility Asset Management Market Forecast Scenarios

utility-asset-management-market-size-forecast-scenario-1789992026970
Between 2020 and 2025 the category compounded at 8.7%, and litigation did more for it than any product improvement achieved. Utility wildfire liability produced settlements and judgments large enough to force one major operator into bankruptcy, and every board in an exposed jurisdiction reassessed what it knew about its own network. Spending on inspection and vegetation analytics rose sharply and has not fallen back since.
The base case holds 9.8% on three mechanisms. Aerial imagery with automated analysis keeps replacing patrol inspection that covered around 22% of network annually, at unit costs that continue falling. Regulators in several jurisdictions now reward demonstrated asset management performance explicitly rather than only capital deployment. And grid expansion for renewable connection keeps adding network kilometres that have to be recorded, inspected and maintained from the moment they are first energised.
The bull case at 11.1% assumes more regulators tie allowed revenue to asset management outcomes, which would correct an incentive that currently runs against condition based maintenance. The bear case at 8.6% is wildfire attention receding without regulatory change behind it, since much of the recent spending was driven by litigation exposure rather than by any settled requirement to maintain it.

When A Tree Becomes A Solvency Question

The largest financial exposure at an electricity distribution utility is now a tree, which nobody in the sector would have said fifteen years ago. Wildfire settlements have exceeded the market value of the company involved in more than one jurisdiction, and the proximate cause is repeatedly vegetation contacting a conductor. Vegetation now absorbs around 31% of distribution operations spending and is a board level topic.
TOP FIVE CONCENTRATION38%Fragmented between enterprise platforms and inspection analytics specialists entirely
NETWORK INSPECTED ANNUALLY22%Distribution line kilometres examined under traditional patrol methods
AERIAL INSPECTION UNIT COSTUSD 41Per line kilometre inspected with automated imagery analysis today
VEGETATION BUDGET SHARE31%Distribution operations spending directed at vegetation management alone
ASSET REGISTER ACCURACY76%Recorded network assets matching what is actually installed
FINDING RESOLUTION BACKLOG94 daysFrom inspection defect identification to completed field remediation work
Inspection economics inverted and most utilities have not restructured around it. Traditional patrol and helicopter methods examined around 22% of distribution network in a year at costs that made covering more impossible. Aerial imagery with automated analysis inspects everything at around USD 41 per kilometre. The constraint moved from coverage to consequence, and findings wait around 94 days for remediation.
The regulatory incentive runs the wrong way and very few people outside the sector realise it. A regulated utility earns a return on capital deployed rather than on maintenance performed, so asset management that extends life and defers replacement reduces the regulated asset base and the utility's own earnings with it. Several regulators now pay for asset management performance explicitly, and where they have not, better practice is punished.
"I asked a distribution utility how many poles it owned. The answer was a number, then a pause, then a different number. Their register is about three quarters right and they know it, and every investment plan they file is built on top of that."
Director, Utility Operations and Network Asset Practice · MMA Energy and Utilities Practice · September 2026

Market Trends

Wildfire Liability Made Vegetation A Board Topic

Utility caused wildfire settlements have exceeded the entire market value of the company involved in more than one jurisdiction, and investigations repeatedly identify vegetation contacting a conductor as the proximate cause. That moved tree management from a field maintenance budget into a solvency discussion, and vegetation now absorbs around 31% of distribution operations spending in exposed regions. Vegetation management planning compounds at 12.6% against 9.8% for the market. Insurers and rating agencies now examine vegetation programmes directly, which is a scrutiny no maintenance activity previously attracted anywhere. No maintenance activity previously attracted this attention.
Market Impact: Risk planning compounds at 9.4%

Aerial Analytics Inverted The Inspection Constraint

Patrol and helicopter inspection examined around 22% of distribution network annually because covering more cost more than utilities could justify against any measurable benefit. Aerial imagery with automated defect analysis inspects the entire network at around USD 41 per kilometre and repeats the survey as often as required. The constraint moved from coverage to consequence, since a utility that can now see every defect has to decide what to do about all of them. Findings currently wait around 94 days for field remediation, which is where the value is being lost.
Market Impact: Australia compounds at 15.2% annually

Market Opportunities and Growth Drivers

Regulators Are Starting To Pay For Asset Performance

A regulated utility earns a return on capital deployed rather than on maintenance performed, which means asset management that extends life and defers replacement shrinks the regulated asset base and the earnings with it. Several regulators have recognised that and now reward demonstrated asset management outcomes explicitly within allowed revenue frameworks. Risk-based investment planning compounds at 9.4% wherever those frameworks exist, because a utility must then evidence how investment decisions were reached rather than simply justify the total. Elsewhere the incentive still runs the wrong way entirely. Better practice is financially punished where it does.
Market Impact: Registers are about 76% accurate

Bushfire Regulation Is Reshaping Australian Network Obligations

Australian distribution networks cover enormous line lengths per customer across terrain where bushfire risk is severe and rising, and regulatory obligations covering inspection frequency, vegetation clearance and asset condition have tightened considerably following successive fire seasons. Australia compounds at 15.2%, ahead of every other country, on requirements that are prescriptive rather than advisory. Network length per customer here is many times what European utilities manage, which makes automated aerial inspection economically compelling in a way it is not for dense urban networks anywhere. Prescriptive obligations rather than advisory guidance drive it, which changes how utilities respond entirely.
Market Impact: Remediation lags around 94 days

Market Restraints and Challenges

Utilities Do Not Reliably Know What They Own

Asset registers match physically installed equipment around 76% of the time across typical distribution networks, and every investment plan, condition assessment and risk model is built on top of that. The root cause is a century of construction, acquisition and emergency replacement recorded by people under time pressure with no system that made accuracy easy. Commercially this undermines every analytical product sold on top of the register. Mitigation runs through aerial survey reconciliation, field verification during routine work, and accepting register uncertainty rather than modelling around it. Every analytical product rests on that inaccuracy.
Market Impact: Vegetation absorbs 31% of spending

Findings Accumulate Faster Than Crews Resolve Them

Inspection defects wait around 94 days from identification to completed remediation, and automated analysis that finds far more defects makes that backlog worse rather than better. The root cause is that field crew capacity is fixed and cannot expand quickly against a labour market that is already short. Commercially this means a utility buying better inspection acquires documented knowledge of unresolved defects, which is a liability position rather than a safety improvement. Mitigation runs through risk based prioritisation and honest reporting of what will not be fixed. Plaintiffs' lawyers understand that position very well.
Market Impact: Inspection costs USD 41 per kilometre
3 additional market trends, 4 additional growth drivers, and 2 additional restraints and challenges are covered in the full report. Contact sales@marketmindsadvisory.com to access the complete intelligence.

Segment CAGR and Growth Architecture

Segmentation follows asset management function, since what a system does determines which utility department funds it and whether a regulator takes an interest. Six functions cover the market: aerial and remote inspection analytics, vegetation management planning, asset health monitoring, risk-based investment planning, work and field force management, and asset register and network records. Utility type is a separate dimension.
utility-asset-management-market-market-share-analysis-1789992027535

Aerial And Remote Inspection Analytics

Aerial and remote inspection analytics grow at 14.7%, half again the market rate of 9.8%, because the economics of looking at a network changed completely. Patrol and helicopter methods examined around 22% of distribution line annually since covering more could not be justified, while aerial imagery with automated defect analysis inspects everything at around USD 41 per kilometre and repeats it as often as required. The uncomfortable consequence is that a utility which can now see every defect must decide what to do about all of them, and findings already wait around 94 days for remediation before any expansion of coverage. Coverage was never really the constraint. Consequence became the limit instead.
CAGR 14.7%

Vegetation Management Planning

Vegetation management planning compounds at 12.6% on liability rather than on efficiency. Utility caused wildfire settlements have exceeded the market value of the company involved in more than one jurisdiction, with investigations repeatedly identifying vegetation contacting a conductor as the cause. That moved tree management from a maintenance line into a solvency discussion examined by boards, insurers and rating agencies directly. Vegetation now absorbs around 31% of distribution operations spending in exposed regions. Satellite and aerial growth modelling that predicts which spans will encroach before they do is the specific capability that regulators and insurers now expect to see. Insurers examine that capability directly now. Prediction beats inspection entirely here.
CAGR 12.6%
Full segment breakdown across 6 segments available in the complete report.

Regional Architecture and Country Demand Map

North America holds 34% of software and service revenue, above the standard band, because wildfire liability turned asset management into a solvency question here before it did anywhere else. Western Europe follows at 26% on regulatory frameworks that reward demonstrated asset performance directly within allowed revenue.

North America

North America holds 34% of software and service revenue, above the 32% band ceiling, and one mechanism explains almost all of the excess. Wildfire settlements in western states have exceeded the market value of the utility involved, forcing one major operator into bankruptcy and making network condition a board and investor topic across the whole continent. Vegetation absorbs around 31% of distribution operations spending in exposed territories. Oracle, IBM, Bentley Systems and most inspection analytics specialists operate from here. Growth at 10.4% sits above the global rate on liability driven spending that has not receded since it started. Liability driven spending has not receded once since it started. Board attention has not moved on.
Share: 34% | CAGR: 10.4% (2026 to 2036)

Western Europe

Twenty-six percent of software and service revenue reaches Western Europe, where regulatory framework design rather than litigation drives adoption. British price control arrangements reward demonstrated asset management performance within allowed revenue, which obliges utilities to evidence how investment decisions were reached rather than simply justify totals. Similar mechanisms operate across several other national regulators. Hexagon, SAP and Siemens all develop here. Dense urban networks make aerial inspection economics less compelling than in sparse territories. Growth at 8.4% is the slowest of any region, on mature adoption within long established regulatory cycles. Dense urban networks make aerial inspection economics considerably less compelling here than in sparse territories elsewhere. Regulatory design rather than litigation drives it.
Share: 26% | CAGR: 8.4% (2026 to 2036)
Regional intelligence for 5 additional markets available in the complete report: East Asia, South Asia and Pacific, Latin America, Middle East and Africa, Eastern Europe. Contact sales@marketmindsadvisory.com.
utility-asset-management-market-country-cagr-analysis-1789992028152

What Utilities Will Actually Fund

Liability rather than efficiency now moves budgets across this sector, the regulated return works against good asset management wherever regulators have not corrected it, and better inspection produces more findings than field crews can possibly resolve. Each of the four levers below responds to one of those rather than to any product capability argument.

Sell Against Liability, Not Against Efficiency

Utility wildfire settlements have exceeded the market value of the company involved, and vegetation now absorbs around 31% of distribution operations spending in exposed regions. A maintenance efficiency argument competes against every other operational budget and loses regularly. A liability argument reaches a board, a general counsel and an insurer simultaneously, and none of them applies a payback test. Vendors presenting cost per kilometre inspected are answering a question the exposed utilities stopped asking after the first nine figure settlement landed. Boards, counsel and insurers all read the same evidence.
Market Impact: Vegetation absorbs fully 31% of all operations spending

Solve The Backlog Before Expanding Coverage

Inspection findings wait around 94 days from identification to completed remediation, and automated analysis producing far more defects makes that considerably worse rather than better. A utility buying broader coverage acquires documented knowledge of unresolved defects, which is a liability position that plaintiffs' lawyers understand very well. Risk based prioritisation that routes the genuinely dangerous findings to crews within days, and honestly defers the rest, converts an inspection product into an operational one. Very few vendors sell against that constraint at all. Very few vendors sell against that constraint, and the ones who do reach a different buyer entirely.
Market Impact: Backlogs near 94 days create genuine legal liability

Work With Regulators On Performance Frameworks

A regulated utility earns a return on capital deployed rather than on maintenance performed, so extending asset life and deferring replacement reduces the regulated asset base and the earnings with it. Where regulators reward demonstrated asset management performance, risk-based investment planning compounds at 9.4% because utilities must evidence how decisions were reached. Where they do not, better practice is financially punished. Vendors engaging with regulatory consultations shape frameworks that then create their own demand, and almost nobody in this category does it. Almost nobody in this category attends those consultations at all.
Market Impact: Planning compounds at 9.4% under these frameworks alone

Target Networks With Extreme Length Per Customer

Aerial inspection at around USD 41 per kilometre is compelling where a utility manages enormous line length per connection and nearly pointless in dense urban networks where crews already pass everything constantly. Australia compounds at 15.2% on exactly that geometry combined with prescriptive bushfire obligations. Similar conditions exist across rural North America, Brazil and parts of Southern Africa. Vendors selling identical propositions to dense European networks and sparse Australian ones misjudge where the economics genuinely work by a very wide margin. The economics differ by a very wide margin. Geometry decides where this works.
Market Impact: Aerial economics work at USD 41 per kilometre

Who Controls the Margin Pool

Five suppliers hold 38% of utility asset management software and service revenue, split between enterprise platforms and inspection analytics specialists who did not exist a decade ago. Oracle, IBM, SAP and Hexagon sell registers and work management into utility technology functions on long procurement cycles. Bentley Systems reaches engineering departments. AiDash, Overstory and Sharper Shape sell to operations instead. All participants are assessed on software and analytics service revenue.
Competition splits by which department holds the budget and neither group reaches the other well. Enterprise platforms are procured by technology functions against multi-year requirements and integration criteria. Inspection and vegetation analytics are bought by operations and risk functions on liability arguments with results visible in a season. The specialists win those decisions against far larger competitors regularly, and the larger competitors frequently never learn the evaluation happened.

Rankings shift as liability driven spending consolidates, since utilities buying inspection analytics from four vendors will eventually want fewer. The second pressure is regulatory framework design, which favours suppliers who can evidence decision quality to a regulator rather than those who simply record what a utility already decided to do.
utility-asset-management-market-company-positioning-matrix-1789992028675

Competitive Moat and Risk Dimensions

ORACLE

Moat: Utility Systems Integration Depth

Oracle asset management sits alongside customer, billing and outage systems inside utilities that run several of its products together, so records reconcile without integration work the utility would otherwise fund itself. That breadth makes displacement an enterprise programme rather than a software change. Utility technology functions value that continuity above almost anything a specialist can demonstrate on a single function.
ORACLE

Risk: Operations Budget Distance

The growth sits in inspection and vegetation analytics bought by operations and risk functions on liability arguments, not by technology functions on integration criteria. An enterprise platform position provides no advantage in that conversation and the procurement route is entirely different. Specialists reach that buyer directly and win decisions against considerably larger competitors.
AIDASH

Moat: Satellite Vegetation Prediction Capability

AiDash models vegetation growth from satellite imagery to predict which spans will encroach before they do, which is the specific capability regulators and insurers examine after a wildfire investigation. Building it requires imagery access, growth modelling and utility network data together. The company sells to operations and risk functions who fund it from liability budgets rather than technology ones.
AIDASH

Risk: Single Function Concentration

A position built on vegetation analytics depends on liability attention persisting, and this spending rose sharply after litigation rather than after any settled regulatory requirement in most jurisdictions. Utilities consolidating inspection vendors will prefer breadth over depth at renewal. A specialist has no adjacent function to hold the relationship when attention moves.

Players Tracked

Prominent Players

Oracle
IBM
Hexagon
SAP
Bentley Systems

Other Key Players

Schneider Electric
Siemens
GE Vernova
AspenTech
Itron
Copperleaf Technologies
AiDash
Overstory
Sharper Shape
Esri
Trimble
Infosys
Capgemini
Sensus
Neara

Recent Developments

FEBRUARY 2025

AiDash Expands Satellite Vegetation Risk Products For Distribution Utilities

AiDash expanded satellite based vegetation risk products aimed at distribution network operators, an organic product development rather than an acquisition or joint venture. Vegetation absorbs around 31% of distribution operations spending in wildfire exposed regions, and investigations repeatedly identify tree contact as the proximate cause of ignition.
Signal: Liability budgets rather than maintenance budgets fund this work entirely, which changes who signs it off.
SEPTEMBER 2024

Bentley Systems Extends Network Records Reconciliation Against Survey Data

Bentley Systems extended capability for reconciling utility asset records against aerial and field survey data, an organic engineering development rather than any transaction. Asset registers match installed equipment around 76% of the time, and every investment plan and condition model is built on top of that inaccuracy.
Signal: Every analytical product in this category rests on a register that is roughly three quarters right.
JUNE 2025

Copperleaf Adds Regulatory Evidence Reporting To Investment Planning

Copperleaf Technologies added regulatory evidence reporting to its risk-based investment planning products, an organic development rather than a partnership or merger. Several regulators now reward demonstrated asset management performance within allowed revenue, which requires a utility to evidence exactly how its investment decisions were actually reached.
Signal: Where regulators pay for decision quality, evidencing the decision itself becomes the actual product being sold.

What These Services Cost To Deliver

Imagery acquisition and processing account for roughly 31% of inspection analytics cost, covering satellite tasking, aerial survey contracting and the compute required to analyse it. Engineering salaries carry around 34%, weighted toward machine learning specialists and utility domain engineers together. Cloud infrastructure absorbs about 15%, and customer implementation plus regulatory support take most of the remaining balance.
Satellite imagery pricing and aerial survey capacity both tightened through 2023 and 2024 as demand from utilities, insurers and agriculture rose together against limited collection capacity. Oracle Annual Report 2024 and Hexagon Annual Report 2024 both record data acquisition and engineering talent as operating variables. Vendors on multi-year utility contracts absorbed those increases directly, since pricing agreed against a network size does not adjust when imagery costs move upward.

The competitive disadvantage mechanism is imagery cost per kilometre rather than software capability. A vendor tasking satellite collection for one utility pays far more per kilometre than one aggregating demand across many networks in the same territory, and utilities compare delivered price rather than method. Exposure concentrates among specialists serving few customers in dispersed geographies, which is precisely the position most inspection analytics entrants start from.
utility-asset-management-market-cost-volatility-analysis-1789992028873

Aggregate Imagery Tasking Across Neighbouring Utilities

Imagery acquisition runs around 31% of inspection analytics cost and satellite tasking priced per collection favours whoever aggregates demand. Neighbouring distribution utilities frequently occupy overlapping collection areas without any coordination between them. Combining tasking across several customers in one territory cuts unit cost substantially, and utilities rarely object once the saving appears in their pricing.

Reuse Detection Models Across Utility Networks

Engineering runs about 34% of cost and vendors frequently retrain defect detection models per customer because network equipment and vegetation differ. Much of that difference is superficial rather than fundamental, and a shared base model with customer specific tuning removes duplicated training work. The discipline is machine learning architecture rather than utility knowledge, and domain teams rarely own it.

Process Imagery Selectively By Assessed Risk

Cloud infrastructure runs around 15% of cost and most vendors analyse every collected image at full resolution regardless of what the span looks like. Screening at reduced resolution and processing only areas showing potential defects cuts compute substantially with no detection loss that matters. Vendors process everything because it is simpler to explain, and that simplicity costs them.

Portfolio Architecture for Margin Defence

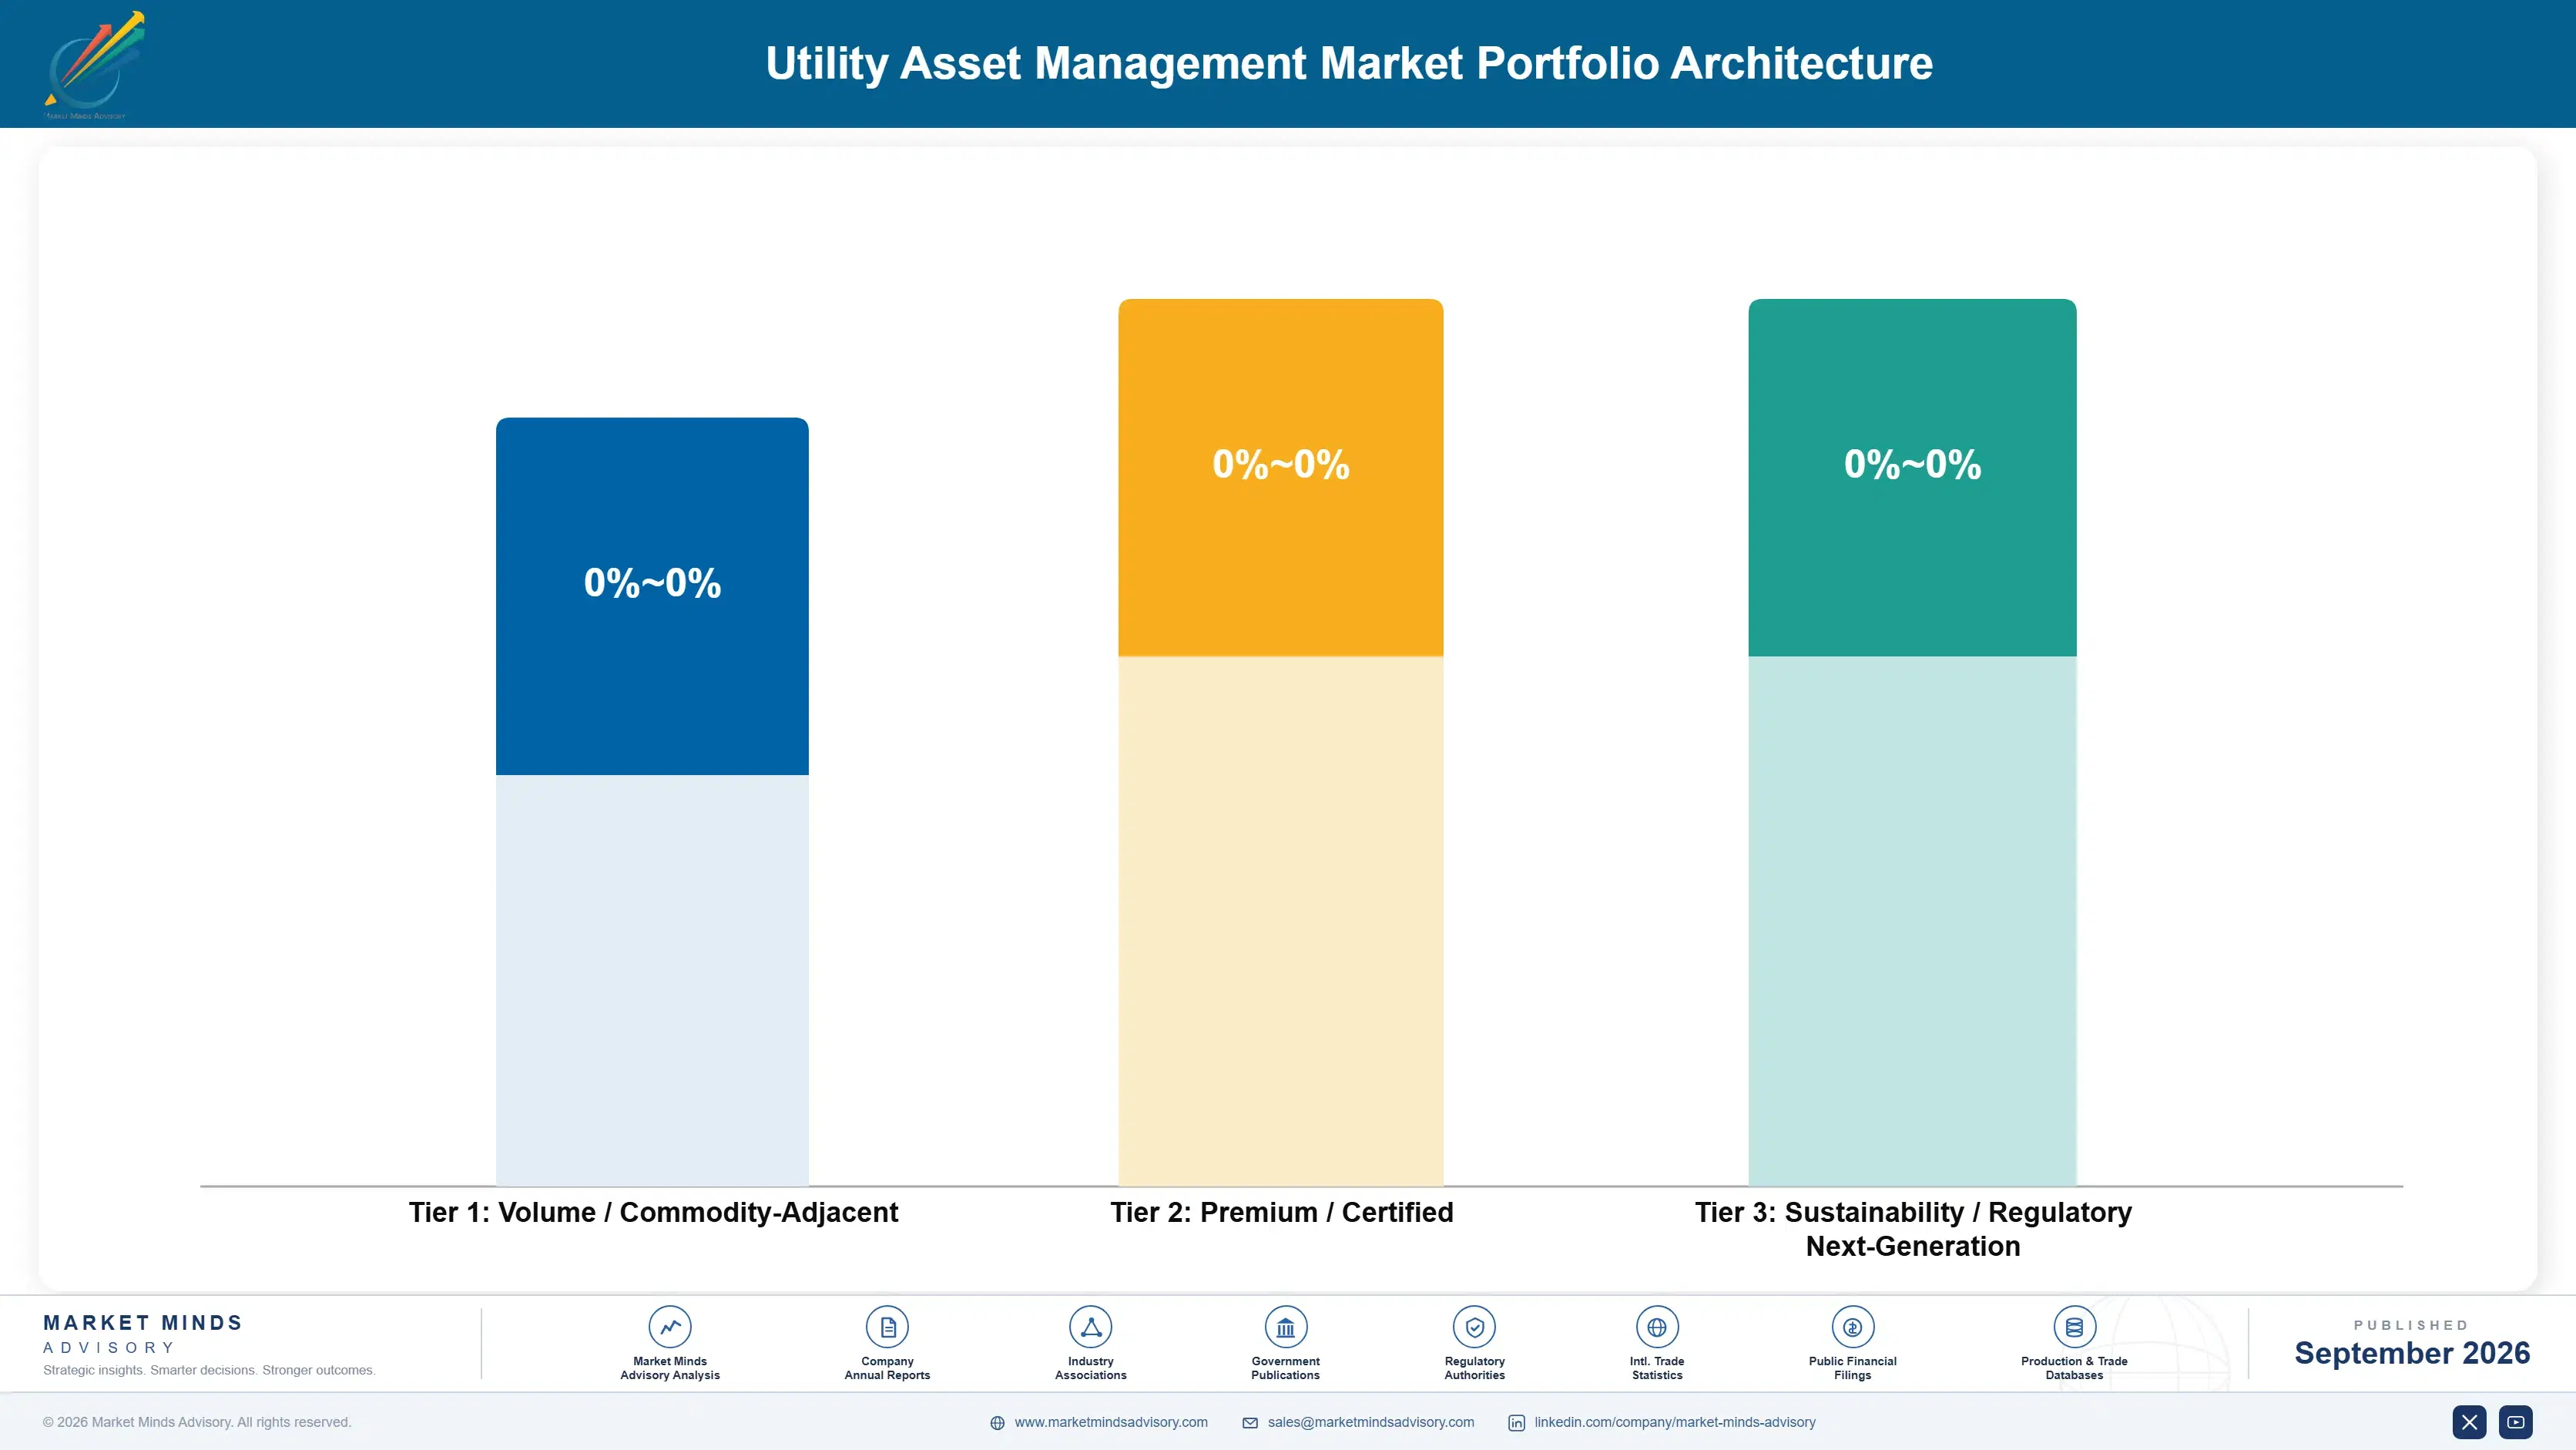
Margin architecture separates on which budget funds the purchase and whether a regulator examines the output. Asset registers and work management earn least, since both are enterprise systems bought on procurement criteria against several comparable alternatives. Asset health monitoring sits in the middle. Vegetation planning, inspection analytics and risk-based investment planning earn most, because liability and regulatory evidence rather than efficiency justify them.
The volume versus premium tension is about which utility department a vendor is built to reach. Technology functions procure enterprise platforms on multi-year cycles with integration requirements and formal evaluation. Operations and risk functions buy analytics on liability arguments with results visible within a season and considerably less procurement ceremony. Vendors organised for the first route are absent from the conversation where growth is actually happening.

High-value pools concentrate in vegetation prediction and in regulatory evidence, and neither is reached from an enterprise asset platform. Vegetation prediction requires imagery access and growth modelling that enterprise vendors have not built. Regulatory evidence requires understanding what a specific regulator will accept, which varies by jurisdiction and changes. Both are capabilities that sit outside platform engineering entirely.

Volume / Commodity-Adjacent

Asset register, network records and work and field force management systems, procured by technology functions against several comparable enterprise alternatives. The ten point spread separates vendors with wider utility system integration from those selling asset management as a standalone application without adjacent products.
Gross Margin: 42% to 52%

Premium / Certified

Asset health and condition monitoring sold on equipment failure prevention and network reliability performance. The twelve point spread tracks how much sensing and analytics a vendor supplies rather than integrating from equipment already installed, which determines whether the revenue is software or a pass through.
Gross Margin: 56% to 68%

Sustainability / Regulatory / Next-Generation

Aerial inspection analytics, vegetation management planning and risk-based investment planning, funded from liability and regulatory budgets rather than from operational efficiency cases. The fourteen point spread reflects imagery cost per kilometre, which decides whether the analytics margin survives the acquisition expense underneath it.
Gross Margin: 70% to 84%
utility-asset-management-market-portfolio-architecture-1789992029374

High-value Sub-segments and Strategic Watch-out

Aerial And Remote Inspection Analytics

Grows at 14.7% because automated imagery covers a whole network at around USD 41 per kilometre where patrols reached 22% of it. The fourteen point spread reflects imagery cost. Seeing every defect obliges a utility to decide what it will do about all of them.
Gross Margin: 70% to 84%

Vegetation Management Planning

Grows at 12.6% on wildfire liability that has exceeded the market value of the utility involved in more than one jurisdiction entirely. The fourteen point spread reflects prediction accuracy. Boards, insurers and rating agencies all examine these programmes directly now. Prediction rather than inspection is the capability.
Gross Margin: 70% to 84%

Asset Health And Condition Monitoring

Grows at 11.2% on transformer, cable and switchgear condition assessment that defers replacement while extending safe operating life. The twelve point spread reflects sensing depth. Regulated returns on capital work against exactly this wherever regulators have not corrected the incentive. Regulated returns work against exactly this.
Gross Margin: 56% to 68%

Asset Register And Network Records

Grows at 4.3%, slowest of the six functions, on systems every utility already operates and replaces only during major technology programmes. The ten point spread reflects integration breadth. Registers match installed equipment around 76% of the time, which everybody knows and few address. Everybody knows and few address it.
Gross Margin: 42% to 52%

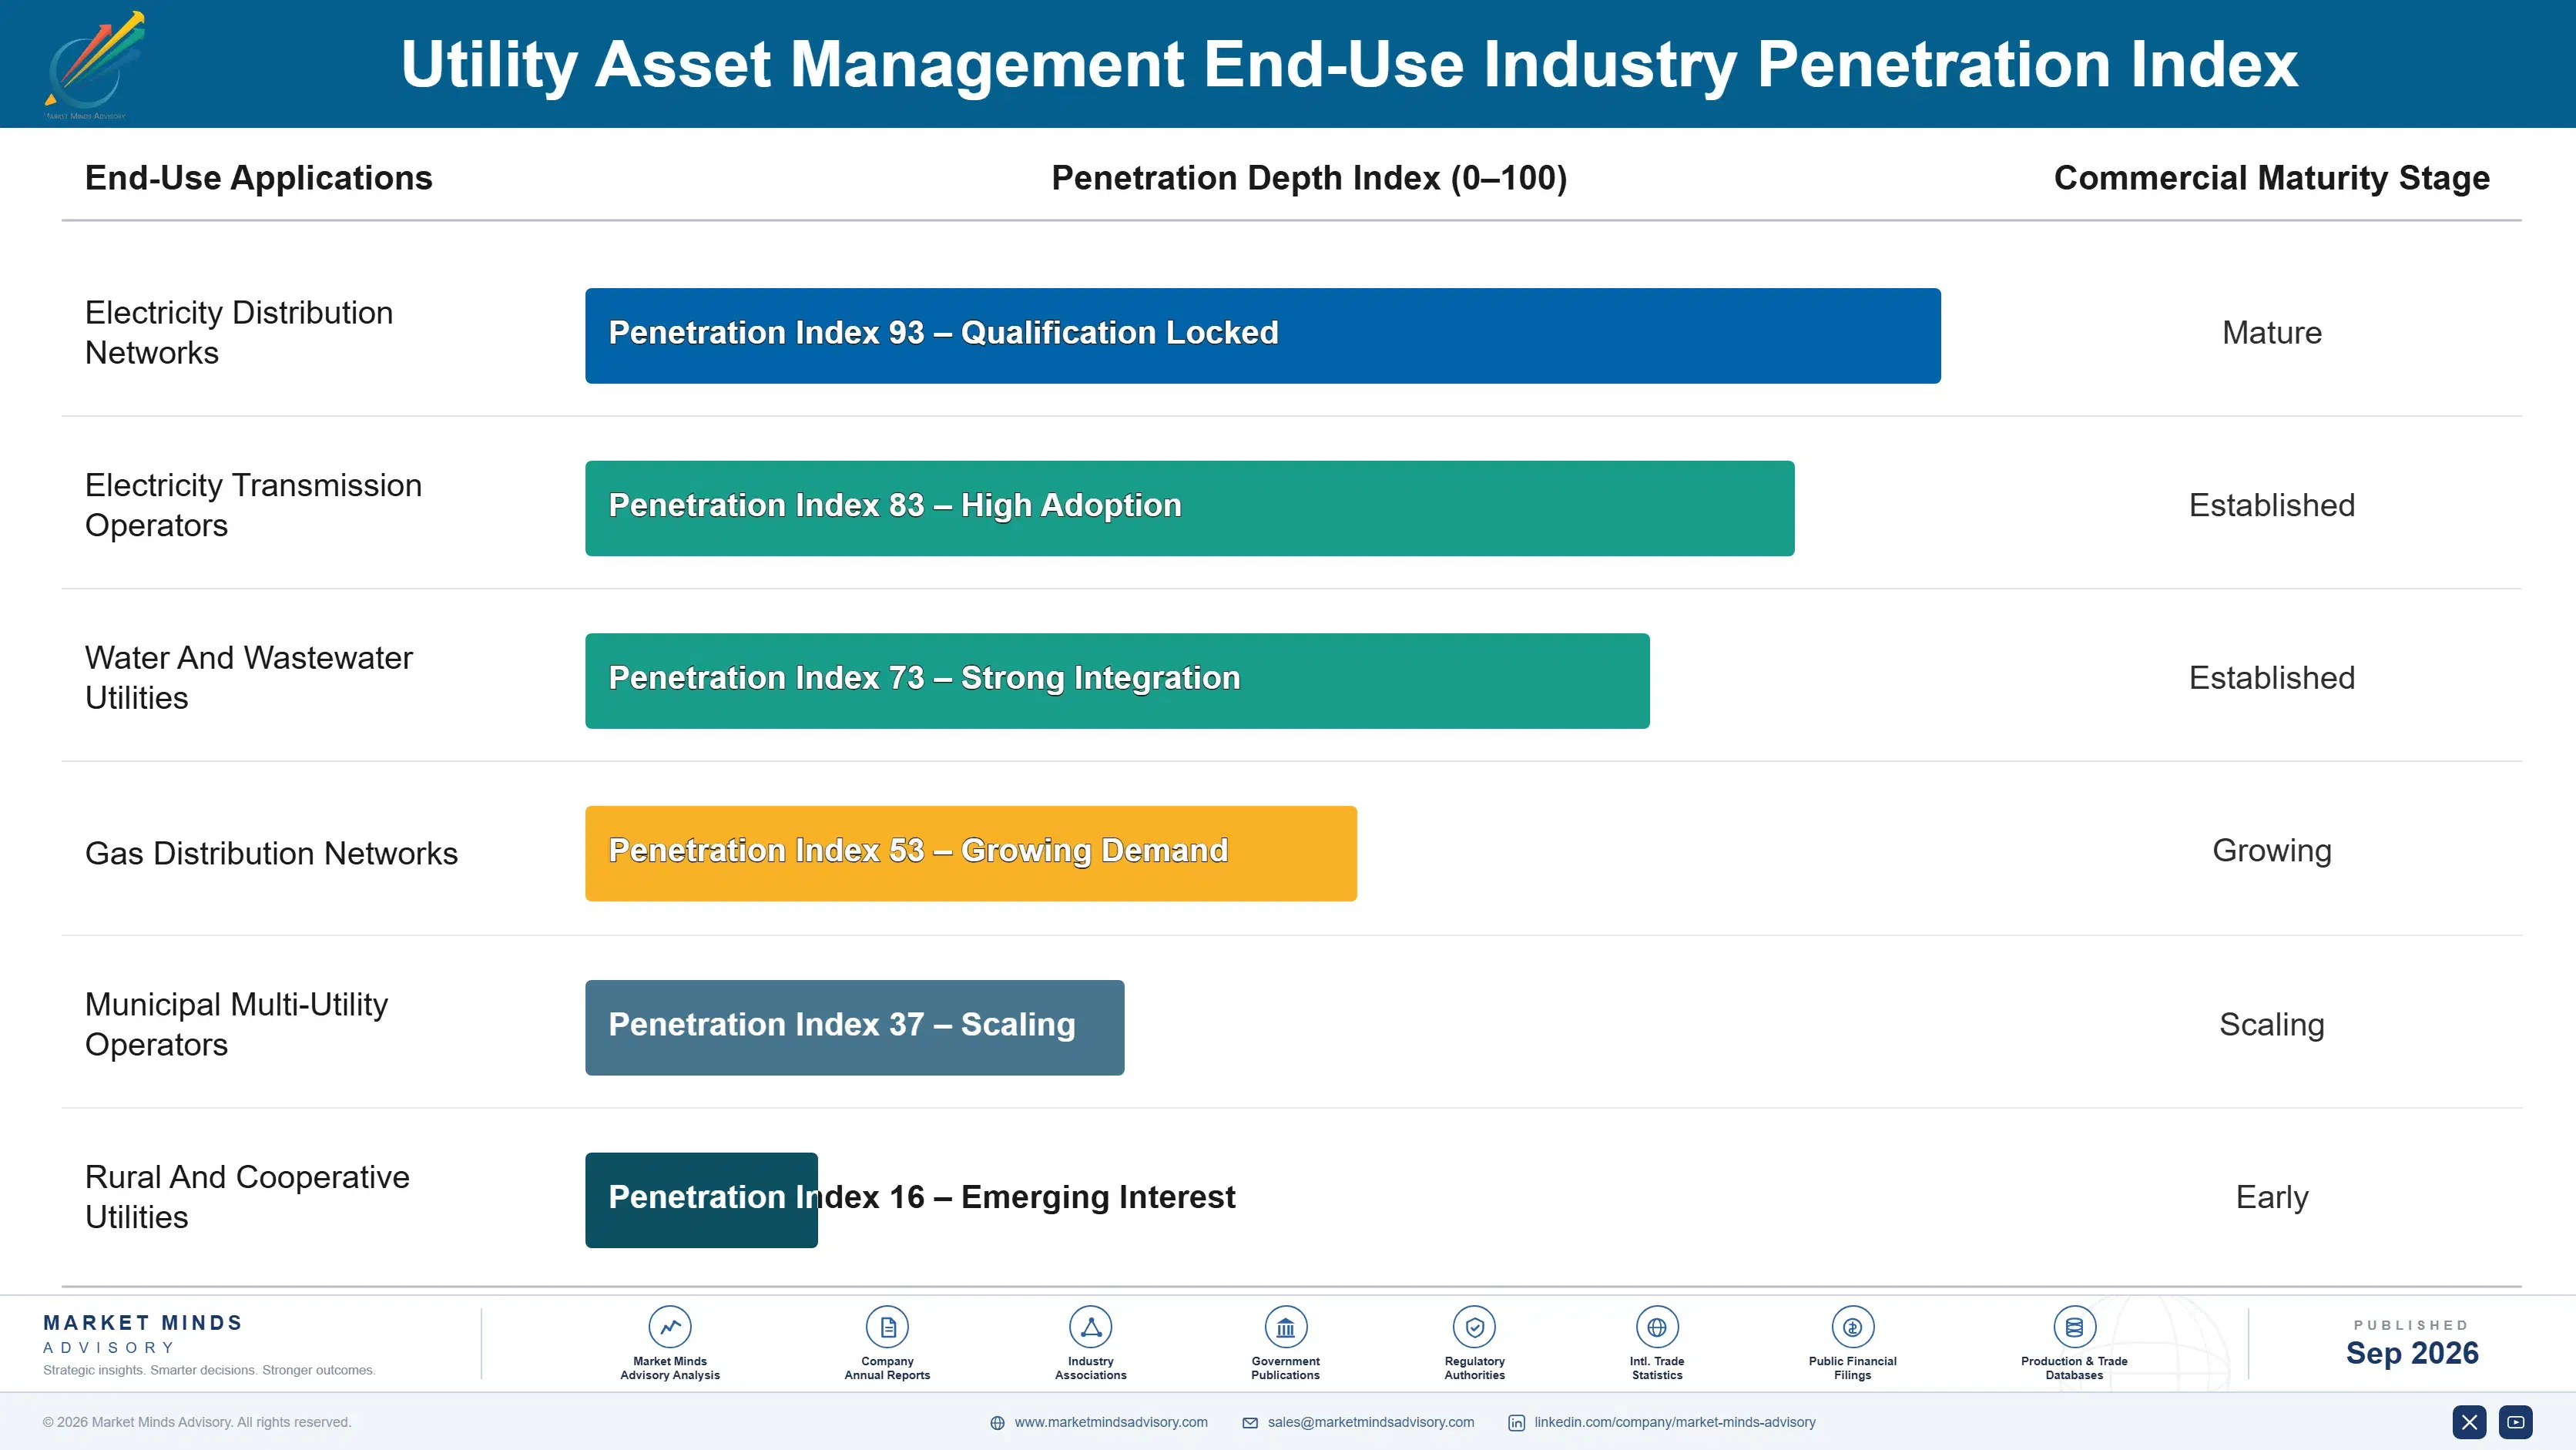
Why Utilities Rarely Change Suppliers

The annuity is the historical record rather than the licence. An asset management system holding decades of inspection history, maintenance records and condition assessments against a specific network cannot be replaced without losing the trend information every investment decision and regulatory filing depends on. Reconciling migration against a register already only 76% accurate is a project nobody volunteers for.
Depth varies by whether a regulator sees the output. A risk-based investment planning system whose outputs appear in a regulatory filing is effectively permanent, since changing methodology mid-cycle invites questions no utility wants. Vegetation programmes examined by insurers are similarly embedded. Inspection analytics bought on a season by season basis are the shallowest, and utilities move between specialists on price and detection performance without much friction at all.

The buyer moved from a technology function to operations and risk, and the vendors have not followed. A technology function procures platforms on integration and multi-year requirements with formal evaluation. An operations director buys inspection analytics because the general counsel asked what the utility knows about its own network. That conversation carries no payback test and more urgency, and most established vendors are absent.
utility-asset-management-market-end-use-penetration-index-1789992029869

What Moves Utility Budgets

These are among the four positions where our research anticipates prominent divergence between winners and laggards over the coming forecast period. Each is grounded in the demand model, the regulatory perimeter, and the announced capacity pipeline.
01 / LIABILITY ARGUMENT FRAMING

Sell To The General Counsel's Question

Utility wildfire settlements have exceeded the entire market value of the company involved in more than one jurisdiction, and vegetation now absorbs around 31% of distribution operations spending across exposed territories. A maintenance efficiency argument competes against every other operational budget line and loses that contest regularly. A liability argument reaches a board, a general counsel and an insurer at the same time, and none of them applies a payback test to it in the way an operations budget review would.
02 / BACKLOG RESOLUTION PRIORITY

Fix The Findings Before Finding More

Inspection findings currently wait around 94 days from identification to completed field remediation, and automated analysis producing far more defects makes that backlog considerably worse rather than better. A utility buying broader coverage is acquiring documented knowledge of unresolved defects, which is a liability position that plaintiffs' lawyers understand extremely well. Risk based prioritisation routing genuinely dangerous findings to crews within days, while honestly deferring the rest, turns an inspection product into a genuinely operational one that changes what crews actually do.
03 / REGULATORY FRAMEWORK ENGAGEMENT

Shape The Rules That Create Demand

A regulated utility earns its return on capital deployed rather than on maintenance performed, so asset management extending life and deferring replacement shrinks the regulated asset base and the earnings alongside it. Where regulators reward demonstrated asset management performance, risk-based investment planning compounds at 9.4% because utilities must then evidence how decisions were reached. Where regulators have not made that correction, better practice is financially punished instead, and vendors engaging in regulatory consultation shape frameworks that then generate their own demand afterwards.
04 / NETWORK GEOMETRY TARGETING

Follow The Kilometres Per Customer

Aerial inspection at around USD 41 per line kilometre is compelling where a utility manages enormous length per connection and nearly pointless in dense urban networks where crews already pass everything constantly anyway. Australia compounds at 15.2% on precisely that geometry combined with prescriptive bushfire obligations covering inspection and clearance. Comparable conditions exist across rural North America, Brazil and parts of Southern Africa, and vendors pitching identical propositions to dense and sparse networks misjudge those economics by a very wide margin.

Engagement Snapshot From the Field

A live engagement with an industry participant carrying material or product regulatory and market exposure ahead of a defining policy shift, showing how our research translates into a defensible multi-year portfolio strategy.
MARKET MINDS ADVISORY · CLIENT ENGAGEMENT SUMMARY
Utility Asset Management Producer Strategic Portfolio Review and Transition Roadmap 2026·Investment Scenario on Utility Asset Management Exposure Evaluation 2025-26
CLIENT PROFILE
A North American electricity distribution utility operating around 71,000 line kilometres across territory with significant wildfire exposure, three years into an aerial inspection programme covering the full network annually. Identified defects had accumulated faster than crews could resolve them and the open finding count had grown every quarter. Legal counsel had begun asking what the accumulated record represented.
STRATEGIC CHALLENGE
Operations wanted more field crews and could not recruit them in a labour market already short. The inspection vendor proposed higher resolution imagery and more frequent surveys. Legal counsel was concerned that a growing documented list of unresolved defects created exposure rather than reducing it. Nobody had assessed which findings actually corresponded to ignition risk.
MMA APPROACH
MMA analysed three years of inspection findings against subsequent failure and ignition events, establishing which defect categories preceded incidents and which never did. We modelled crew capacity against a risk prioritised backlog rather than a chronological one, and assessed the legal exposure position with external counsel input. The work drew on 47 expert interviews conducted in Q4 2025 with utilities, vendors and regulatory specialists.
KEY FINDINGS
  1. Around 7 in 10 recorded defects belonged to categories that had never once preceded a failure or ignition event across the full three year record.
  2. The defect categories that did precede incidents numbered only 5, and existing crews could have cleared all of those within current capacity.
  3. Median resolution latency ran at 118 days against a category norm near 94, and it was lengthening every quarter as findings accumulated.
  4. Increasing imagery resolution would have raised finding volume by roughly 2 times against crew capacity that could not expand (client-reported, unverified by MMA).
CLIENT PROFILE
A North American electricity distribution utility operating around 71,000 line kilometres across territory with significant wildfire exposure, three years into an aerial inspection programme covering the full network annually. Identified defects had accumulated faster than crews could resolve them and the open finding count had grown every quarter. Legal counsel had begun asking what the accumulated record represented.
STRATEGIC CHALLENGE
Operations wanted more field crews and could not recruit them in a labour market already short. The inspection vendor proposed higher resolution imagery and more frequent surveys. Legal counsel was concerned that a growing documented list of unresolved defects created exposure rather than reducing it. Nobody had assessed which findings actually corresponded to ignition risk.
MMA APPROACH
MMA analysed three years of inspection findings against subsequent failure and ignition events, establishing which defect categories preceded incidents and which never did. We modelled crew capacity against a risk prioritised backlog rather than a chronological one, and assessed the legal exposure position with external counsel input. The work drew on 47 expert interviews conducted in Q4 2025 with utilities, vendors and regulatory specialists.
KEY FINDINGS
  1. Around 7 in 10 recorded defects belonged to categories that had never once preceded a failure or ignition event across the full three year record.
  2. The defect categories that did precede incidents numbered only 5, and existing crews could have cleared all of those within current capacity.
  3. Median resolution latency ran at 118 days against a category norm near 94, and it was lengthening every quarter as findings accumulated.
  4. Increasing imagery resolution would have raised finding volume by roughly 2 times against crew capacity that could not expand (client-reported, unverified by MMA).
RECOMMENDED STRATEGY
Phase 1: Phase one: prioritise the five defect categories that precede incidents and clear those within days rather than working the backlog chronologically. Phase 2: Phase two: decline the imagery resolution increase entirely, since the programme cannot resolve the findings that current imagery already produces. Phase 3: Phase three: document the deferral policy formally with counsel, so unresolved low risk findings represent a reasoned decision rather than a backlog.
OUTCOME
The utility reprioritised against the five categories and declined the imagery expansion (client-reported, unverified by MMA). Resolution latency on high risk findings fell to under two weeks and the open finding count stabilised for the first time. Deferral decisions are now formally documented with counsel, which is the change that outlasted the engagement itself.

Frequently Asked Questions

Foundational context covering the market sizes, CAGR, scope, country, region and competition that inform every finding below. This section is provided to cover basics and most often pre-purchase conversations, answered from the MMA Primary Research Dataset.

What is the current size of the Utility Asset Management Market?

Global value reaches USD 7.58 billion in 2026, measured as utility asset management software and analytics service revenue. The 2025 base is USD 6.9 billion.

How large will the Utility Asset Management Market be by 2036?

Software and service revenue reaches USD 19.31 billion by 2036, an increase of USD 11.73 billion over the forecast period. That represents 2.55 times expansion from the 2026 base.

What is the CAGR for the Utility Asset Management Market 2026 to 2036?

The base case runs at 9.8% annually, with a bull case at 11.1% if more regulators tie allowed revenue to asset performance and a bear case at 8.6% if wildfire attention recedes.

Which segment is growing fastest?

Aerial and remote inspection analytics grow at 14.7%, half again the market rate of 9.8%. Automated imagery covers a whole network at around USD 41 per kilometre where patrols reached 22% of it.

Who are the major companies in the Utility Asset Management Market?

Oracle, IBM, Hexagon, SAP and Bentley Systems lead on software and service revenue, together holding 38%. AiDash, Overstory and Copperleaf Technologies sell to operations budgets instead.

Which country is growing fastest?

Australia leads at 15.2%, on enormous line length per customer combined with prescriptive bushfire obligations covering inspection frequency and vegetation clearance. India and Brazil follow.

Report Segmentation Architecture

The full report scope spans multiple orthogonal segmentation dimensions, with cross-tabulated demand data provided for each dimension pair. Coverage extends further to regional breakdowns, trend trajectories, and the competitive detail needed to support segment-level decision-making.

By Asset Management Function

  • Aerial And Remote Inspection Analytics
  • Vegetation Management Planning
  • Asset Health And Condition Monitoring
  • Risk-Based Investment Planning
  • Work And Field Force Management
  • Asset Register And Network Records

By End-Use Industry

  • Electricity Distribution Networks
  • Electricity Transmission Operators
  • Water And Wastewater Utilities
  • Gas Distribution Networks
  • Municipal Multi-Utility Operators
  • Rural And Cooperative Utilities

By Commercial Dimension

  • Enterprise Platform Licensing
  • Operations Budget Analytics Subscription
  • Regulated Programme Funded Procurement
  • Systems Integrator Delivery
  • Managed Inspection Services
  • Consulting Led Assessment Contracts

By Region

  • North America
  • Western Europe
  • East Asia
  • South Asia and Pacific
  • Latin America
  • Middle East and Africa
  • Eastern Europe

Scope, Methodology, and Coverage

Every figure in this report is reproducible from documented input assumptions. The scope below maps the historical period, the forecast horizon, the segmentation dimensions, and the countries covered, alongside the underlying primary and qualitative methodology.
Historical Period
2020 to 2025
Forecast Period
2026 to 2036
Base Year
2025 (USD billions; MMA Primary Research Dataset, September 2026)
Market Definition
This report covers software and analytics services used to manage utility physical network assets: aerial and remote inspection analytics, asset health and condition monitoring, vegetation management planning, risk-based investment planning, work and field force management, and asset register and network records. It excludes metering hardware and advanced metering infrastructure, customer information and billing systems, grid control and supervisory systems, physical inspection contracting labour, and vegetation cutting services themselves.
Quantitative Units
USD millions, software and analytics service revenue basis; managed network kilometres; inspection cost per line kilometre in USD; asset register accuracy as a percentage; finding resolution latency in days.
Segmentation Dimensions
Asset management function; utility type; commercial procurement route; geography across seven regions.
Regions Covered
North America, Western Europe, East Asia, South Asia and Pacific, Latin America, Middle East and Africa, Eastern Europe
Countries Covered
United States, Canada, Mexico, Brazil, Chile, Colombia, United Kingdom, Germany, France, Netherlands, Italy, Spain, Poland, Romania, Japan, South Korea, China, India, Australia, South Africa.
Key Companies Profiled
Oracle, IBM, Hexagon, SAP, Bentley Systems, Schneider Electric, Siemens, GE Vernova, Itron, Copperleaf Technologies, AiDash, Overstory, Sharper Shape, Esri, Trimble.
Quantitative Methodology
Primary survey, n=3,800 respondents, Q4 2025, six countries; demand-side model with trade association cross-validation
Qualitative Methodology
47 expert interviews, Q4 2025; applied to validate demand model assumptions, identify emerging dynamics, and assess competitive positioning
Report Format
PDF and XLSX data workbook (Word format preview document)
Publisher
Market Minds Advisory
Report Code
MMA-2026-ENE-151
Published
September 2026
Contact
sales@marketmindsadvisory.com | www.marketmindsadvisory.com

Purchase the full Utility Asset Management Market Report (2026 to 2036).

This report sizes the global utility asset management market from 2026 to 2036 across six functional classes, six utility types and seven regions. It explains why wildfire liability turned vegetation into a solvency question rather than a maintenance line, how aerial analytics at USD 41 per kilometre inverted an inspection constraint that limited coverage to 22% of network, and why regulated returns on capital work against good asset management. Cost composition is sourced to company annual reports, with imagery acquisition analysed as the margin determinant. Regional analysis explains why North America leads at 34% while Australia compounds at 15.2%.
Six asset management functions sized through to 2036
Wildfire liability economics modelled against maintenance budgets
Imagery acquisition cost composition from company annual filings
Twenty named suppliers assessed on service revenue
Four revenue levers with quantified commercial impact
Anonymised distribution utility inspection engagement included in full

Built For The People Who Decide

From boardroom strategy to bench-side execution, this report is read cover-to-cover by leaders shaping the next decade of their industry, turning demand scenarios, market dynamics and valuation benchmarks into decisions.
CXOs/ Presidents/ VPs/ Managers
M&A and Corporate Development
Strategy Teams and R&D Heads
Procurement and Product Directors
Regulatory and Compliance Leaders
Investor Relations and Equity Analysts