

Market Minds Advisory
USA Medical Coding Market

USA Medical Coding Market: Automation Takes The Easy Charts

Autonomous coding clears the structured specialties at high rates and leaves humans the narrative charts requiring judgement, which raises the average cost of every remaining chart rather than lowering it.

Lead Analyst

Published

September 2026

Make Smarter Decisions with Customized Research Insights

Request a free sample report and evaluate market opportunities, growth trends, and competitive dynamics relevant to your business needs.

2025 MARKET VALUE$22.6BMarket Size 2025
2036 FORECAST VALUE$58.3BBase Case , 2026 to 2036
CAGR 2026 TO 20369.0 %Bull 10.2% / Bear 7.8%
INCREMENTAL OPPORTUNITY$33.7BNet 10- year value creation
EXPANSION MULTIPLE2.37x2036 value over 2026 base
Strategic Levers
M&A Pipeline
Regional Outlook
Country Rankings
Competitive Intelligence
Segmental Deep-dive
Call-Us : 91 93563 13602

Executive Snapshot and Market Trajectory

Autonomous coding reaches roughly 71% direct-to-bill rates in radiology and pathology and performs poorly on narrative charts requiring sequencing judgement. It is taking the cheap volume and leaving the expensive residue, which raises average cost per remaining chart rather than reducing it. Fewer people remain qualified to do that work.
North America takes 42% of value, well above the standard band, because coding exists as a distinct commercial industry chiefly on account of American code-based fee-for-service payment. India grows fastest at 11.1% and delivers roughly 38% of American coding work, which makes it simultaneously the fastest growing market and the largest offshore delivery base for another one. Data protection and licensure overhead partly offsets the labour arbitrage available there.
Concentration is very low at 24% and the binding constraint is demographic rather than technological. Certified coders are leaving the workforce faster than replacements qualify, with roughly 18% of posted positions unfilled beyond three months. That shortage drove offshoring and automation, not the other way round. Technology followed the labour problem rather than creating it, which is the opposite of how this story is usually told anywhere. The shortage came first. Nobody designed this.
Market Definition
The market covers medical coding services and technology supporting healthcare reimbursement, including outpatient and professional fee coding, inpatient and facility coding, risk adjustment and hierarchical condition category coding, autonomous and computer-assisted coding, coding audit and compliance review, and coding education and credentialing services. Claims submission and denial management, patient billing and collections, clinical documentation software, and payer claims adjudication are excluded from scope.
Base Year Value
$22.6B in 2025 (MMA Primary Research Dataset, August 2026)
Forecast Period
2026 to 2036, eleven discrete annual values
CAGR
9.0% base case. Bull 10.2%. Bear 7.8%.
Fastest Growth Segment
Autonomous and Computer-Assisted Coding: 13.5% CAGR
Fastest Growth Country
India: 11.1% CAGR
Fastest Growth Region
South Asia and Pacific: 11.2% CAGR
Largest Region
North America: 42% of 2025 global value
Market Leaders
Optum, R1 RCM, Ensemble Health Partners, AGS Health, Conifer Health Solutions. Source: MMA Analysis based on disclosed revenue cycle and health information management services revenue, company annual reports 2025.
Primary Survey
n=3,800 procurement and R&D decision-makers, Q4 2025, six countries
Methodology
Demand-side build-up, cross-validated against public data, 47 expert interviews

USA Medical Coding Market Forecast Scenarios

usa-medical-coding-market-size-forecast-scenario-1787702385397
Growth from 2020 to 2025 ran at 8.0% and labour shortage rather than volume drove much of it. Certified coder vacancies persisted throughout, which pushed providers toward offshore delivery and toward automation in whichever specialties would support it. Risk adjustment coding expanded rapidly with Medicare Advantage enrolment and then attracted intense regulatory scrutiny, which changed the commercial risk profile of that whole service line within about two years.
The 9.0% base case rests on three mechanisms. Autonomous coding keeps clearing structured specialties, which shifts human effort toward complex charts that cost considerably more per unit to process. Audit and compliance review keeps expanding because repayment exposure has become a board-level concern rather than an operational one. And offshore delivery capacity keeps growing faster than domestic training pipelines replace retiring coders. None of the three depends on encounter volume rising.
The bull case at 10.2% assumes audit intensity continues rising and providers invest heavily in pre-submission review rather than accepting repayment risk. The bear case at 7.8% is autonomous coding extending successfully into complex inpatient work, which would remove a large block of human coding volume without any corresponding growth elsewhere in the market to replace it.

The Charts Machines Cannot Read

This industry exists because payment and clinical documentation use different languages. A clinician writes what happened; a coder converts it into standardised codes; a payer pays on the code rather than on the note. Everything commercially interesting here sits in that translation gap, and the gap is not closing. Automation has changed who does the translating in some specialties without changing the fact that translation remains necessary at all.
FIVE-FIRM CONCENTRATION24%Share of coding services revenue held by the largest providers
COST PER CODED CHART$4.20Typical blended cost of coding a single outpatient encounter
TOP DELIVERY COUNTRYIndia 38%Indian share of globally delivered American coding work
AUTONOMOUS DIRECT RATE71%Charts billed without human review in structured specialties
CODER VACANCY RATE18%Posted coding positions remaining unfilled beyond three months
AUDIT ADJUSTMENT EXPOSURE6.4%Reviewed claims requiring adjustment after formal compliance review
Autonomous coding works where reports are structured and code sets repeat, reaching roughly 71% direct-to-bill rates in radiology, pathology and ophthalmology. It works considerably less well on emergency medicine and inpatient charts, where narrative documentation, sequencing decisions and clinical judgement determine the correct code. Machines take the cheap charts and humans keep the expensive ones.
The constraint underneath all of it is demographic. Certified coders are leaving the workforce faster than new ones qualify, and roughly 18% of posted positions remain unfilled beyond three months. That shortage is what drove offshore delivery to India and the Philippines and what made automation commercially attractive in the first place. Technology followed the labour problem rather than creating it.
"Everyone models automation as cost reduction. It is cost reallocation. You automate the four dollar chart and you are left holding the forty dollar one, and now you have fewer people who can do it."
Director, Revenue Cycle and Health Information Practice · MMA Healthcare Services Practice · August 2026

Market Trends

Autonomous Coding Clears Structured Specialties And Stops

Direct-to-bill rates reach roughly 71% in radiology, pathology and ophthalmology where reports are structured and code sets repeat predictably. Emergency medicine and inpatient work resist automation because narrative documentation and sequencing judgement determine the correct code rather than any pattern in the text. Growth at 13.5% therefore concentrates in a bounded set of specialties. Providers modelling automation as general cost reduction discover instead that they have reallocated cost toward the charts that were always the most expensive. The residue is more expensive than the automated volume ever was, and there are fewer people qualified to handle it.
Market Impact: Leaves 18% of positions unfilled

Audit Exposure Moved From Operational To Board Level

Roughly 6.4% of reviewed claims require adjustment after compliance review, and risk adjustment coding in particular attracted intense regulatory scrutiny that changed how boards view the whole activity. Undercoding loses revenue quietly while overcoding creates repayment liability and litigation exposure, which is a genuinely asymmetric risk. Growth at 8.4% in audit and compliance review follows that shift directly, and pre-submission review is increasingly preferred to discovering problems after payment has already been received. Providers now fund verification deliberately rather than treating audit as an overhead they tolerate. Boards ask about it now.
Market Impact: Delivers 38% of American work

Market Opportunities and Growth Drivers

Coder Shortage Drives Offshore And Automated Delivery

Certified coders are leaving the workforce faster than the credentialing pipeline replaces them, and roughly 18% of posted positions stay unfilled beyond three months, which is a demographic problem no technology decision created. Providers responded by moving work offshore and by automating whatever specialties would support it. India delivers roughly 38% of American coding work as a direct consequence. Domestic training capacity has not expanded anywhere near enough to change that trajectory meaningfully. Complex charts remain entirely dependent on credentialed human judgement whatever happens elsewhere. Training capacity has not expanded nearly enough.
Market Impact: Automates the cheapest 71%

Indian Delivery Capacity Grows Faster Than Any Market

India grows fastest of any country at 11.1%, and it does so in two ways at once, expanding both its domestic healthcare administration market and its share of American coding work delivered offshore. Roughly 38% of that work is already performed there. Data protection obligations and credentialing requirements add overhead that partly offsets the labour cost advantage, which is why offshoring has not gone further than it has despite the arbitrage available. Training and credentialing capacity has expanded substantially around that work over the past decade. Arbitrage is narrower than it appears.
Market Impact: Penalises 1 error direction heavily

Market Restraints and Challenges

Automation Raises Average Cost Per Remaining Chart

Autonomous coding clears the structured specialties at roughly 71% direct-to-bill rates and leaves human coders the narrative charts that always cost most to process. Root cause is that automation succeeds precisely where judgement is least required, which is also where cost was lowest. The commercial impact is providers projecting cost reduction and finding cost reallocation instead, with a smaller workforce handling harder work. Mitigation involves modelling blended cost honestly rather than counting automated charts alone. Fewer people remain qualified to handle it. Blended cost modelling is the honest answer. Optimism costs margin.
Market Impact: Reaches 71% in structured specialties

Asymmetric Audit Risk Punishes Errors Unequally

Undercoding loses revenue silently and creates no liability, while overcoding produces repayment obligations and litigation exposure that reach board attention quickly. Root cause is a regulatory structure that treats the two error directions very differently. The commercial impact is systematic conservatism that costs providers legitimate revenue, and roughly 6.4% of reviewed claims still require adjustment. Mitigation runs through pre-submission audit rather than post-payment correction, which more providers now fund deliberately. Conservatism costs legitimate revenue quietly, and nobody measures that loss anywhere in the organisation. Pre-submission review addresses both directions. Boards fund it now.
Market Impact: Adjusts 6.4% of reviewed claims
3 additional market trends, 4 additional growth drivers, and 2 additional restraints and challenges are covered in the full report. Contact sales@marketmindsadvisory.com to access the complete intelligence.

Segment CAGR and Growth Architecture

Segmentation follows the coding work performed: what is being coded or reviewed and by what method, rather than which provider organisation buys it or where it is delivered. Six work categories cover the market without overlap. Delivery location and contracting model are treated as separate commercial dimensions throughout this report. Chart complexity cuts across every one of these categories.
usa-medical-coding-market-market-share-analysis-1787702385570

Autonomous and Computer-Assisted Coding

Growth at 13.5%, half again the market rate of 9.0%, concentrates in radiology, pathology and ophthalmology where structured reports and repeating code sets support direct-to-bill rates around 71%. Emergency medicine and inpatient coding resist automation because narrative documentation and sequencing judgement determine the correct code rather than any pattern a model can reliably learn. Providers modelling this as general cost reduction find cost reallocation instead, since the charts left behind are precisely the ones that always cost most to process. Fewer credentialed people remain available to process that residue, which compounds the problem considerably. Automation succeeded exactly where judgement mattered least, which is also where the cost per chart was already lowest anywhere.
CAGR 13.5%

Risk Adjustment and HCC Coding

Risk adjustment coding expanded rapidly with Medicare Advantage enrolment and then attracted intense regulatory scrutiny that changed the commercial risk profile of the whole service line within roughly two years. Growth at 10.2% continues because the coding remains necessary and the scrutiny made accuracy considerably more valuable than volume. Providers now fund pre-submission review rather than accepting repayment exposure after the fact, which shifts spending from throughput toward verification and rewards a quite different kind of capability. Accuracy has become worth more than throughput, which rewards a different capability from the one most providers built. Verification rather than throughput is what providers now fund, and the buyer inside the organisation has changed accordingly.
CAGR 10.2%
Full segment breakdown across 6 segments available in the complete report.

Regional Architecture and Country Demand Map

Geography follows payment structure and delivery capacity rather than healthcare volume, since coding exists as a commercial industry chiefly under American billing rules. North America dominates demand and India dominates offshore delivery. Two regions sit outside the standard share bands for that same reason, and both are flagged here.

North America

The 42% share sits far above the standard band because code-based fee-for-service payment created a distinct commercial coding industry that has no direct equivalent under capitated or budget-funded systems. Certified coder vacancies persist at roughly 18% beyond three months, which drove both offshore delivery and automation adoption. Risk adjustment scrutiny changed how boards regard coding accuracy, moving spending toward pre-submission audit. Autonomous coding adoption is furthest advanced here, concentrated in the structured specialties where it genuinely works well. Complex specialty coding and audit capability are where remaining value concentrates, since structured volume is being cleared by software that improves every year. Boards now treat coding accuracy as a governance question rather than an operational metric.
Share: 42% | CAGR: 8.2% (2026 to 2036)

Western Europe

Coding supports casemix funding and activity monitoring rather than claim-by-claim payment, which makes it a hospital administrative function rather than a large commercial services market. National classification systems differ between countries, so no pan-European service market has formed at any scale. Clinical coders are employed directly by hospitals in most systems. Automation is developing where structured reporting supports it, though the commercial incentive is weaker because coding accuracy affects budget allocation rather than immediate payment. Commercial coding services remain a small market relative to healthcare spending, and no equivalent of the American outsourcing industry has formed anywhere. Automation follows structured reporting adoption rather than any reimbursement incentive, which slows it considerably.
Share: 18% | CAGR: 7.4% (2026 to 2036)
Regional intelligence for 5 additional markets available in the complete report: East Asia, South Asia and Pacific, Latin America, Middle East and Africa, Eastern Europe. Contact sales@marketmindsadvisory.com.
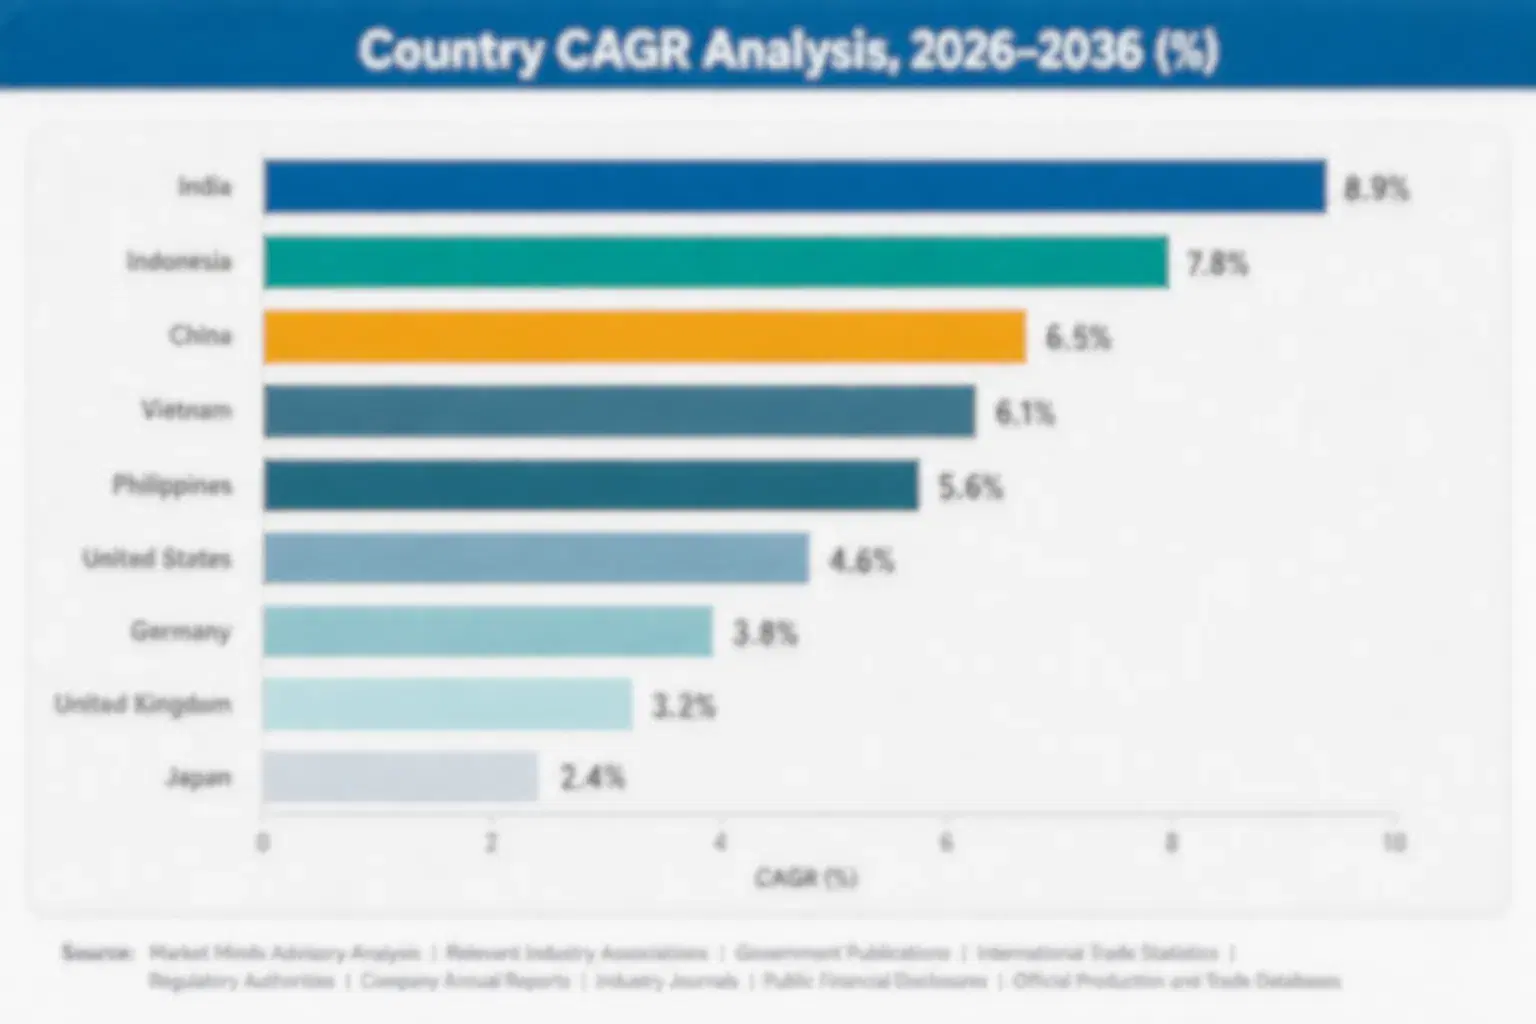
usa-medical-coding-market-country-cagr-analysis-1787702385748

Pricing The Charts That Remain

Autonomous coding clears roughly 71% of structured specialty charts, about 18% of coder positions stay unfilled, some 6.4% of reviewed claims need adjustment, and India delivers 38% of American work. Four levers work on blended pricing, audit capability, training supply and specialty focus rather than on throughput. Throughput is no longer where value sits.

Price On Blended Cost Not Automated Volume

Automation clears roughly 71% of charts in structured specialties and leaves human coders the narrative work that always cost most, which means average cost per remaining chart rises rather than falls. Providers pricing contracts on automated throughput discover the residue is more expensive than the blended rate they agreed. Modelling the mix honestly at contract stage protects margin that optimistic automation assumptions destroy quietly across the whole term of an agreement. The difference compounds quietly across a whole contract term, and it is rarely visible until renewal comes round. Renewal exposes it.
Market Impact: Prices the 29% that requires genuine human judgement

Build Pre-Submission Audit Rather Than Correction

Roughly 6.4% of reviewed claims require adjustment, and undercoding loses revenue silently while overcoding creates repayment and litigation exposure that reaches board attention quickly. Pre-submission review addresses both directions before money moves, which post-payment correction cannot do at all. Providers now fund this deliberately rather than treating it as overhead. Service providers offering verification capability compete on a dimension throughput specialists have never built. Compliance officers fund accuracy where revenue cycle directors buy throughput, which means a different buyer entirely. Very few providers have made that call. Accuracy is now the product.
Market Impact: Corrects the 6.4% before any payment actually moves

Fund Credentialing Pipelines You Will Hire From

Certified coders leave the workforce faster than the pipeline replaces them and roughly 18% of posted positions stay unfilled beyond 3 months, which no automation decision fixes for the complex charts that matter most. Service providers funding training and credentialing build a labour supply competitors must bid against them for. It takes years and it addresses the only genuinely binding constraint in this industry rather than working around it. Recruitment from a shrinking pool is a bidding contest nobody wins. Building supply beats bidding for it, and the providers who started early are already several cohorts ahead of everybody else.
Market Impact: Addresses the 18% of unfilled credentialed coder positions

Specialise In Work Automation Will Not Reach

Emergency medicine, inpatient and complex surgical coding resist automation because narrative documentation and sequencing judgement determine the code rather than any learnable pattern. Providers building capability there hold work that will not be automated away, at rates reflecting genuine difficulty. Competitors chasing the structured specialties are competing directly against software that improves every year and prices toward zero. Specialising in difficulty is uncomfortable and considerably more durable. Roughly 29% of charts resist automation entirely, and that share is where credentialed judgement earns what it is genuinely worth rather than what a volume contract pays.
Market Impact: Holds the 29% of charts resisting automation entirely

Who Controls the Margin Pool

Measured on disclosed revenue cycle and health information management services revenue, the five largest providers hold a CR5 of just 24%, which reflects a fragmented services market where provider relationships are local and switching is operationally disruptive rather than technically difficult. Optum, R1 RCM and Ensemble hold substantial integrated revenue cycle positions, while AGS Health and Conifer carry large dedicated coding operations across American provider organisations. Local relationships matter more here than national scale ever has.
Three contests define activity. Volume coding services compete on price per chart and delivery capacity, increasingly from offshore locations. Autonomous coding technology competes on direct-to-bill rates within the specialties where it genuinely works. And audit and compliance review competes on accuracy capability and regulatory understanding, which is a professional services contest rather than a throughput one. A provider organised for one contest is rarely equipped for the others.

Pressure builds as automation takes structured volume while the remaining work grows more expensive and harder to staff. Rankings shift toward providers holding complex specialty capability and audit expertise. Anybody competing on price per chart in radiology is competing against software that improves annually. That is a losing position.
usa-medical-coding-market-company-positioning-matrix-1787702385927

Competitive Moat and Risk Dimensions

OPTUM

Moat: Integrated Revenue Cycle Position

Optum delivers coding within a broader revenue cycle and payer relationship, which lets it price the activity against total revenue outcomes rather than against cost per chart alone. That integration is not available to a dedicated coding provider competing on unit price. A health system already using the wider platform faces meaningful disruption in separating coding out to somebody else.
OPTUM

Risk: Regulatory And Integration Scrutiny

Combining payer, provider services and revenue cycle assets attracts sustained regulatory attention, and risk adjustment coding in particular has drawn intense scrutiny across the sector. Integration advantages depend on arrangements that policy could restrict. An advantage resting on permitted combination is exposed to decisions made entirely elsewhere.
AGS HEALTH

Moat: Offshore Delivery And Credentialing Scale

AGS operates offshore coding delivery at a scale supported by its own credentialing and training capacity, which addresses the labour constraint rather than merely working around it. India already delivers roughly 38% of American coding work. Building comparable trained capacity takes years, and clients depend on continuity that smaller providers struggle to guarantee reliably.
AGS HEALTH

Risk: Automation Displacement Of Volume

Offshore delivery scale is most valuable in high-volume structured coding, which is precisely the work autonomous systems clear at roughly 71% direct-to-bill rates. Labour cost advantage competes against software that improves annually and prices toward zero. Scale in the automatable segment is an asset with a visible expiry attached to it.

Players Tracked

Prominent Players

Optum
R1 RCM
Ensemble Health Partners
AGS Health
Conifer Health Solutions

Other Key Players

Omega Healthcare Management Services
GeBBS Healthcare Solutions
Access Healthcare
Savista
Nym Health
CodaMetrix
Fathom
AAPC
AHIMA
Solventum
Episource
Datavant
Cotiviti
Vee Technologies
Harmony Healthcare

Recent Developments

FEBRUARY 2025

Health system reports automation shifting cost rather than reducing it

A health system reported that autonomous coding had cleared a large share of structured specialty volume while total coding cost fell far less than projected, an operational disclosure rather than any corporate transaction. The charts remaining were the complex ones that always cost most to process.
Signal: Automation reallocates cost toward complex charts rather than removing it from the overall coding function. Savings disappoint.
JUNE 2025

Regulatory scrutiny reshapes risk adjustment coding service demand

Continued regulatory attention to risk adjustment coding accuracy moved provider spending toward pre-submission verification and away from throughput, a market shift driven by enforcement rather than by any corporate event. Repayment and litigation exposure had become a board-level concern across a number of large organisations.
Signal: Audit exposure moved coding accuracy from an operational metric to a governance question for provider boards.
OCTOBER 2025

Service provider funds domestic coder credentialing programme directly

A coding services provider funded credentialing and training places directly rather than recruiting from an already constrained pool, an organic investment rather than any acquisition. Roughly one in six posted coding positions had been remaining unfilled beyond three months across American provider organisations for several years.
Signal: Funding the credentialing pipeline addresses the only genuinely binding constraint in this industry. Nothing else fixes it.

What Coding Costs To Deliver

Labour dominates and everything else is comparatively minor, which is why delivery location matters so much here. Coder salaries, supervision and quality review account for 61 to 72% of service delivery cost in domestic operations and a smaller absolute figure offshore. Technology platforms, secure infrastructure and compliance overhead add the remainder. Autonomous coding inverts the structure entirely, replacing recurring labour with development cost amortised across processed volume.
The volatility that mattered was coder wage inflation together with data protection compliance cost. Certified coder wages rose sharply through 2022 and 2023 as vacancies persisted, which raised domestic delivery cost on contracts frequently priced years earlier. Offshore delivery carries data protection and licensure overhead that grew alongside, partly offsetting the labour arbitrage. Facility costs also rose, which IEA commercial energy price data records. Contracts priced years earlier absorbed it.

Exposure divides by delivery model rather than by scale. Domestic providers carry wage inflation on a constrained labour pool with no substitute available for complex work. Offshore providers carry compliance overhead alongside currency exposure. Technology-led providers carry development cost against volume that automation itself is making cheaper per unit. Every model here has a cost problem, and automation does not solve it.
usa-medical-coding-market-cost-volatility-analysis-1787702386114

Model residual chart complexity into contract pricing

Automation clears the structured specialties and leaves the narrative charts that always cost most to process, so blended rates agreed on projected automation levels understate what delivery will actually cost. Modelling the residue honestly at contract stage protects margin across the full term. Providers who priced on automated throughput alone have discovered the difference painfully over several years.

Fund credentialing rather than bidding for scarce coders

Certified coders leave the workforce faster than the pipeline replaces them and roughly one in six posted positions stays unfilled beyond three months, which makes recruitment a bidding contest nobody wins. Funding training and credentialing places builds supply rather than competing for it. It takes years and it addresses the binding constraint rather than working around it.

Weight capability toward specialties automation cannot reach

Emergency medicine, inpatient and complex surgical coding resist automation because judgement and sequencing rather than pattern determine the correct code. Capability there holds work that will not be automated away and prices according to genuine difficulty. Competing on price per chart in radiology means competing against software that improves every year and trends toward negligible marginal cost.

Portfolio Architecture for Margin Defence

Margin follows difficulty and regulatory exposure rather than volume, which inverts the usual services logic. High-volume outpatient coding earns thinly and is the most automatable work in the market. Inpatient and facility coding earns better on complexity. Risk adjustment coding earns well and carries regulatory exposure that has grown considerably. Audit and compliance review earns most, because accuracy verification is a professional judgement service rather than a throughput one entirely.
The tension is that scale was built for exactly the work that is disappearing. Offshore delivery capacity and process discipline were assembled to handle structured high-volume coding, which autonomous systems now clear at roughly 71% direct-to-bill rates in the relevant specialties. The capability that remains valuable is complex specialty judgement and audit expertise, which requires senior credentialed people rather than scaled delivery, and those are different businesses entirely.

High-value pools sit in three places. Complex specialty coding that automation cannot reach, priced on genuine difficulty. Pre-submission audit and compliance verification, where asymmetric regulatory risk makes accuracy worth paying for. And credentialing capacity, which addresses the binding labour constraint and creates supply competitors must bid against you to obtain.

Volume / Commodity-Adjacent

High-volume outpatient and professional fee coding delivered at scale, principally from offshore locations. The 9-point range is wide because domestic and offshore delivery carry entirely different labour cost bases despite competing for identical work at similar prices.
Gross Margin: 17-26%

Premium / Certified

Inpatient and facility coding together with risk adjustment work requiring credentialed judgement and regulatory understanding. The 10-point spread separates providers with senior credentialed capability from those staffing complex work with generalist coders under supervision.
Gross Margin: 31-41%

Sustainability / Regulatory / Next-Generation

Autonomous coding technology, audit and compliance verification, and coding education and credentialing services. The 26-point range is wide because software margins and professional services economics behave completely differently at scale.
Gross Margin: 38-64%
usa-medical-coding-market-portfolio-architecture-1787702386305

High-value Sub-segments and Strategic Watch-out

Audit And Compliance Verification

Highest margin and growing at 8.4%, because asymmetric regulatory risk makes pre-submission accuracy worth considerably more than throughput. The risk is that it requires senior credentialed judgement rather than scaled delivery, which is a fundamentally different business from volume coding services. Senior judgement is scarce.
Gross Margin: 56-64%

Autonomous Coding Technology

Fastest growth at 13.5% with software economics, clearing roughly 71% of charts in the structured specialties. The risk is that the addressable specialties are bounded, and extending into narrative inpatient work has proved considerably harder than early projections assumed. Narrative charts resist it. Progress there has been slow.
Gross Margin: 48-58%

High-Volume Outpatient Coding

The volume core, thin on margin and the most automatable work anywhere in this market. Providers hold it because it carries delivery scale and client relationships, and because losing it removes the account before higher value work can ever be introduced. Accounts start here always.
Gross Margin: 18-24%

The Residual Complex Chart

The strategic watch-out. Automation clears the cheap charts and leaves the expensive ones, which raises average cost per remaining chart against contracts priced on projected savings. The risk is that providers who priced on automated throughput carry that difference across whole contract terms. Renewal exposes it.
Gross Margin: 26-32%

Every Encounter Needs Translating

Demand is continuous and tracks clinical activity directly, since every encounter that generates a claim must be coded before anybody is paid for it. That produces reliable recurring volume tied to a provider's patient throughput rather than to any purchasing cycle. What varies is who performs the translation and at what cost, which is where all the movement happens.
Stickiness is operational rather than contractual. Switching coding providers means transferring workflow, retraining on local documentation practice and accepting a quality dip during transition, which health systems avoid unless something has gone genuinely wrong. Audit and compliance relationships are stickier still, since they involve regulatory judgement a provider organisation comes to depend on. Autonomous coding technology embedded in workflow is the stickiest of all once integrated.

The decision maker has moved upward as risk has grown. Volume coding is contracted by revenue cycle directors on price per chart and turnaround. Audit and compliance capability is increasingly selected with chief financial officer and compliance officer involvement, because repayment exposure reaches boards. Autonomous coding decisions involve clinical informatics and health information leadership together. Providers organised only for the first conversation are absent from the two that carry margin.
usa-medical-coding-market-end-use-penetration-index-1787702386489

Where Difficulty Creates Value

These are among the four positions where our research anticipates prominent divergence between winners and laggards over the coming forecast period. Each is grounded in the demand model, the regulatory perimeter, and the announced capacity pipeline.
01 / BLENDED PRICING REALISM

You automated the cheap chart not the cost

Autonomous coding now clears roughly 71% of all charts in radiology, pathology and ophthalmology and performs poorly on narrative work where sequencing judgement determines the correct code. What remains for the human coders is precisely the material that always carried the highest processing cost of anything sitting in the queue. Providers who price contracts on projected automation levels discover that average cost per remaining chart has risen, and they then carry that difference across the entire term of the agreement.
02 / PRE-SUBMISSION VERIFICATION CAPABILITY

Undercoding is silent and overcoding is litigated

Roughly 6.4% of all reviewed claims require adjustment after compliance review, and the two possible error directions carry radically different consequences for the provider organisation involved. Undercoding quietly loses legitimate revenue and creates no liability at all for anybody, whereas overcoding instead produces repayment obligations and litigation exposure that reaches a provider board within weeks. Pre-submission review addresses both of those directions before any money at all moves, which any post-payment correction process is inherently incapable of ever doing at all.
03 / CREDENTIALING SUPPLY BUILDING

Recruiting from an empty pool is not strategy

Certified coders are now leaving the workforce considerably faster than the credentialing pipeline is replacing them, and roughly 18% of all posted positions stay unfilled beyond three months across American provider organisations. No automation decision anywhere fixes that problem for the complex charts where credentialed judgement is genuinely required. Providers who fund training and credentialing places build labour supply that competitors must then bid against them to obtain, which takes several years and addresses the only genuinely binding constraint here.
04 / DIFFICULTY FOCUSED SPECIALISATION

Compete where software improves the slowest

Emergency medicine, inpatient and complex surgical coding all resist automation, because narrative documentation and sequencing judgement determine the correct code rather than any pattern a model reliably learns from the text. Providers who build genuine capability in exactly that work hold volume that will not be automated away, priced according to what its real difficulty is actually worth. Competitors who chase the structured specialties are competing directly against software that improves annually and which prices steadily toward nothing at all.

Engagement Snapshot From the Field

A live engagement with an industry participant carrying material or product regulatory and market exposure ahead of a defining policy shift, showing how our research translates into a defensible multi-year portfolio strategy.
MARKET MINDS ADVISORY · CLIENT ENGAGEMENT SUMMARY
USA Medical Coding Producer Strategic Portfolio Review and Transition Roadmap 2026·Investment Scenario on USA Medical Coding Exposure Evaluation 2025-26
CLIENT PROFILE
A coding services provider delivering outpatient, inpatient and risk adjustment work to American health systems through combined domestic and offshore operations, with reported revenue of 340 million dollars (client-reported, unverified by MMA). Roughly 74% of revenue came from high-volume outpatient coding. Audit capability existed as a small internal function and had never been offered commercially to any client.
STRATEGIC CHALLENGE
Two large clients had implemented autonomous coding for structured specialties and renegotiated rates downward, while the remaining volume proved considerably more expensive to deliver than the blended rate assumed. Management was pursuing further offshore capacity and price competitiveness. Neither addressed the composition of the work actually left behind. Work composition had never been examined.
MMA APPROACH
MMA modelled delivery cost by chart complexity across the client base, separating automatable structured work from narrative charts requiring judgement, which the company had never distinguished in its own costing. Nineteen expert interviews with revenue cycle directors, compliance officers and health information leaders established how contracting decisions are reached. The analysis treated work composition and audit exposure, rather than delivery cost, as the central issues.
KEY FINDINGS
  1. Delivery cost per chart varied by more than five times between structured and narrative work, and contracts had been priced on blended rates that ignored that distinction entirely.
  2. Both renegotiated clients had retained the company for exactly the complex charts automation could not handle, at rates set for the automatable volume that had gone.
  3. Compliance officers interviewed identified pre-submission audit as a service they would fund readily, and no incumbent provider had offered it to them at all.
  4. Credentialed coder recruitment costs had risen for four consecutive years, and the company had never considered funding training places rather than bidding for scarce candidates.
CLIENT PROFILE
A coding services provider delivering outpatient, inpatient and risk adjustment work to American health systems through combined domestic and offshore operations, with reported revenue of 340 million dollars (client-reported, unverified by MMA). Roughly 74% of revenue came from high-volume outpatient coding. Audit capability existed as a small internal function and had never been offered commercially to any client.
STRATEGIC CHALLENGE
Two large clients had implemented autonomous coding for structured specialties and renegotiated rates downward, while the remaining volume proved considerably more expensive to deliver than the blended rate assumed. Management was pursuing further offshore capacity and price competitiveness. Neither addressed the composition of the work actually left behind. Work composition had never been examined.
MMA APPROACH
MMA modelled delivery cost by chart complexity across the client base, separating automatable structured work from narrative charts requiring judgement, which the company had never distinguished in its own costing. Nineteen expert interviews with revenue cycle directors, compliance officers and health information leaders established how contracting decisions are reached. The analysis treated work composition and audit exposure, rather than delivery cost, as the central issues.
KEY FINDINGS
  1. Delivery cost per chart varied by more than five times between structured and narrative work, and contracts had been priced on blended rates that ignored that distinction entirely.
  2. Both renegotiated clients had retained the company for exactly the complex charts automation could not handle, at rates set for the automatable volume that had gone.
  3. Compliance officers interviewed identified pre-submission audit as a service they would fund readily, and no incumbent provider had offered it to them at all.
  4. Credentialed coder recruitment costs had risen for four consecutive years, and the company had never considered funding training places rather than bidding for scarce candidates.
RECOMMENDED STRATEGY
Phase 1: Phase one: reprice contracts by chart complexity rather than blended rate, since automation has permanently changed the composition of remaining work. Phase 2: Phase two: build pre-submission audit as a commercial service, reaching compliance officers who fund accuracy rather than revenue cycle directors buying throughput. Phase 3: Phase three: fund credentialing places directly instead of competing for candidates in a pool that keeps shrinking every year. Supply beats recruitment.
OUTCOME
Complexity-based repricing was implemented across renewals and margin on retained complex volume recovered materially (client-reported, unverified by MMA). A pre-submission audit service was launched and secured contracts at six accounts within two quarters, reaching compliance officers the company had never previously called upon. A funded credentialing programme began with its first cohort that autumn.

Frequently Asked Questions

Foundational context covering the market sizes, CAGR, scope, country, region and competition that inform every finding below. This section is provided to cover basics and most often pre-purchase conversations, answered from the MMA Primary Research Dataset.

What is the current size of the USA Medical Coding Market?

The market was worth 22.6 billion dollars in 2025, covering outpatient, inpatient, risk adjustment, autonomous, audit and education coding services. It reaches 24.63 billion dollars in 2026.

How large will the USA Medical Coding Market be by 2036?

MMA forecasts 58.32 billion dollars by 2036, an increase of 33.69 billion dollars over the 2026 base. That represents an expansion multiple of 2.37 times across the forecast period.

What is the CAGR for the USA Medical Coding Market 2026 to 2036?

The base case compounds at 9.0% annually. The bull case reaches 10.2% if audit intensity keeps rising, while the bear case sits at 7.8% on automation extending into complex inpatient work.

Which segment is growing fastest?

Autonomous and computer-assisted coding, at 13.5%, half again the market rate of 9.0%. It reaches roughly 71% direct-to-bill rates across radiology, pathology and ophthalmology specialties.

Who are the major companies in the USA Medical Coding Market?

Optum, R1 RCM, Ensemble Health Partners, AGS Health and Conifer Health Solutions lead on disclosed revenue cycle services revenue. Omega Healthcare, GeBBS and Access Healthcare hold substantial offshore delivery positions.

Which country is growing fastest?

India at 11.1%, growing its domestic market and its share of American coding work at the same time. It already delivers roughly 38% of that work offshore.

Report Segmentation Architecture

The full report scope spans multiple orthogonal segmentation dimensions, with cross-tabulated demand data provided for each dimension pair. Coverage extends further to regional breakdowns, trend trajectories, and the competitive detail needed to support segment-level decision-making.

By Coding Work Type

  • Outpatient and Professional Fee Coding
  • Inpatient and Facility Coding
  • Risk Adjustment and HCC Coding
  • Autonomous and Computer-Assisted Coding
  • Coding Audit and Compliance Review
  • Coding Education and Credentialing Services

By End-Use Setting

  • Hospital and Health Systems
  • Physician Group Practices
  • Ambulatory Surgery Centres
  • Medicare Advantage Plans
  • Diagnostic Imaging and Laboratory Providers
  • Post-Acute and Long-Term Care

By Commercial Dimension

  • Domestic Delivery Contract
  • Offshore Delivery Contract
  • Autonomous Coding Software Licence
  • Audit and Verification Engagement
  • Integrated Revenue Cycle Agreement
  • Training and Credentialing Supply

By Region

  • North America
  • Western Europe
  • East Asia
  • South Asia and Pacific
  • Latin America
  • Middle East and Africa
  • Eastern Europe

Scope, Methodology, and Coverage

Every figure in this report is reproducible from documented input assumptions. The scope below maps the historical period, the forecast horizon, the segmentation dimensions, and the countries covered, alongside the underlying primary and qualitative methodology.
Historical Period
2020 to 2025
Forecast Period
2026 to 2036
Base Year
2025 (USD billions; MMA Primary Research Dataset, August 2026)
Market Definition
Scope covers medical coding services and enabling technology supporting healthcare reimbursement and reporting, spanning outpatient and professional fee coding, inpatient and facility coding, risk adjustment and hierarchical condition category coding, autonomous and computer-assisted coding, coding audit and compliance review, and coding education and credentialing services. Claims submission, denial management and appeals, patient billing, statements and collections, clinical documentation improvement software sold separately, payer claims adjudication and processing, and general health information technology platforms are excluded from the market size and all derived figures. United States dynamics are examined as the analytical focus within the global category.
Quantitative Units
USD billions (current prices); charts coded; cost per coded chart; direct-to-bill automation rate; credentialed coder headcount
Segmentation Dimensions
By Coding Work Type; By End-Use Setting; By Commercial Dimension; By Region
Regions Covered
North America, Western Europe, East Asia, South Asia and Pacific, Latin America, Middle East and Africa, Eastern Europe
Countries Covered
USA, India, Philippines, Canada, UK, Germany, China, Japan, Australia, Brazil, Mexico, Saudi Arabia, Poland, Turkey, South Korea
Key Companies Profiled
Optum, R1 RCM, Ensemble Health Partners, AGS Health, Conifer Health Solutions, Omega Healthcare Management Services, GeBBS Healthcare Solutions, Access Healthcare, Savista, Nym Health, CodaMetrix, Fathom, AAPC, AHIMA, Solventum, Episource, Datavant, Cotiviti, Vee Technologies, Harmony Healthcare
Quantitative Methodology
Primary survey, n=3,800 respondents, Q4 2025, six countries; demand-side model with trade association cross-validation
Qualitative Methodology
47 expert interviews, Q4 2025; applied to validate demand model assumptions, identify emerging dynamics, and assess competitive positioning
Report Format
PDF and XLSX data workbook (Word format preview document)
Publisher
Market Minds Advisory
Report Code
MMA-2026-HLT-125
Published
August 2026
Contact
sales@marketmindsadvisory.com | www.marketmindsadvisory.com

Purchase the full USA Medical Coding Market Report (2026 to 2036).

The full report runs to 176 pages and covers all six coding work type segments, seven regions and 20 profiled providers in detail. It includes the complete segment CAGR set, regional payment structure comparison, and delivery cost modelling by chart complexity across automated and human coded work. Company profiles carry evaluation on disclosed revenue cycle and health information management revenue, with moat and risk assessment for the top five providers. The competitive section extends to 15 tracked regulatory, corporate and technology developments across 2024 and 2025. Primary research inputs include a quantitative survey of 3,800 respondents and 47 expert interviews conducted in Q4 2025.
Six coding work type segments with individual CAGR forecasts
Seven regional markets with payment structure and delivery comparison
Twenty provider profiles on consistent revenue evaluation basis
Fifteen tracked regulatory and technology developments with commercial interpretation
Delivery cost modelling by chart complexity across coding types
Credentialed coder supply analysis against projected demand requirements

Built For The People Who Decide

From boardroom strategy to bench-side execution, this report is read cover-to-cover by leaders shaping the next decade of their industry, turning demand scenarios, market dynamics and valuation benchmarks into decisions.
CXOs/ Presidents/ VPs/ Managers
M&A and Corporate Development
Strategy Teams and R&D Heads
Procurement and Product Directors
Regulatory and Compliance Leaders
Investor Relations and Equity Analysts