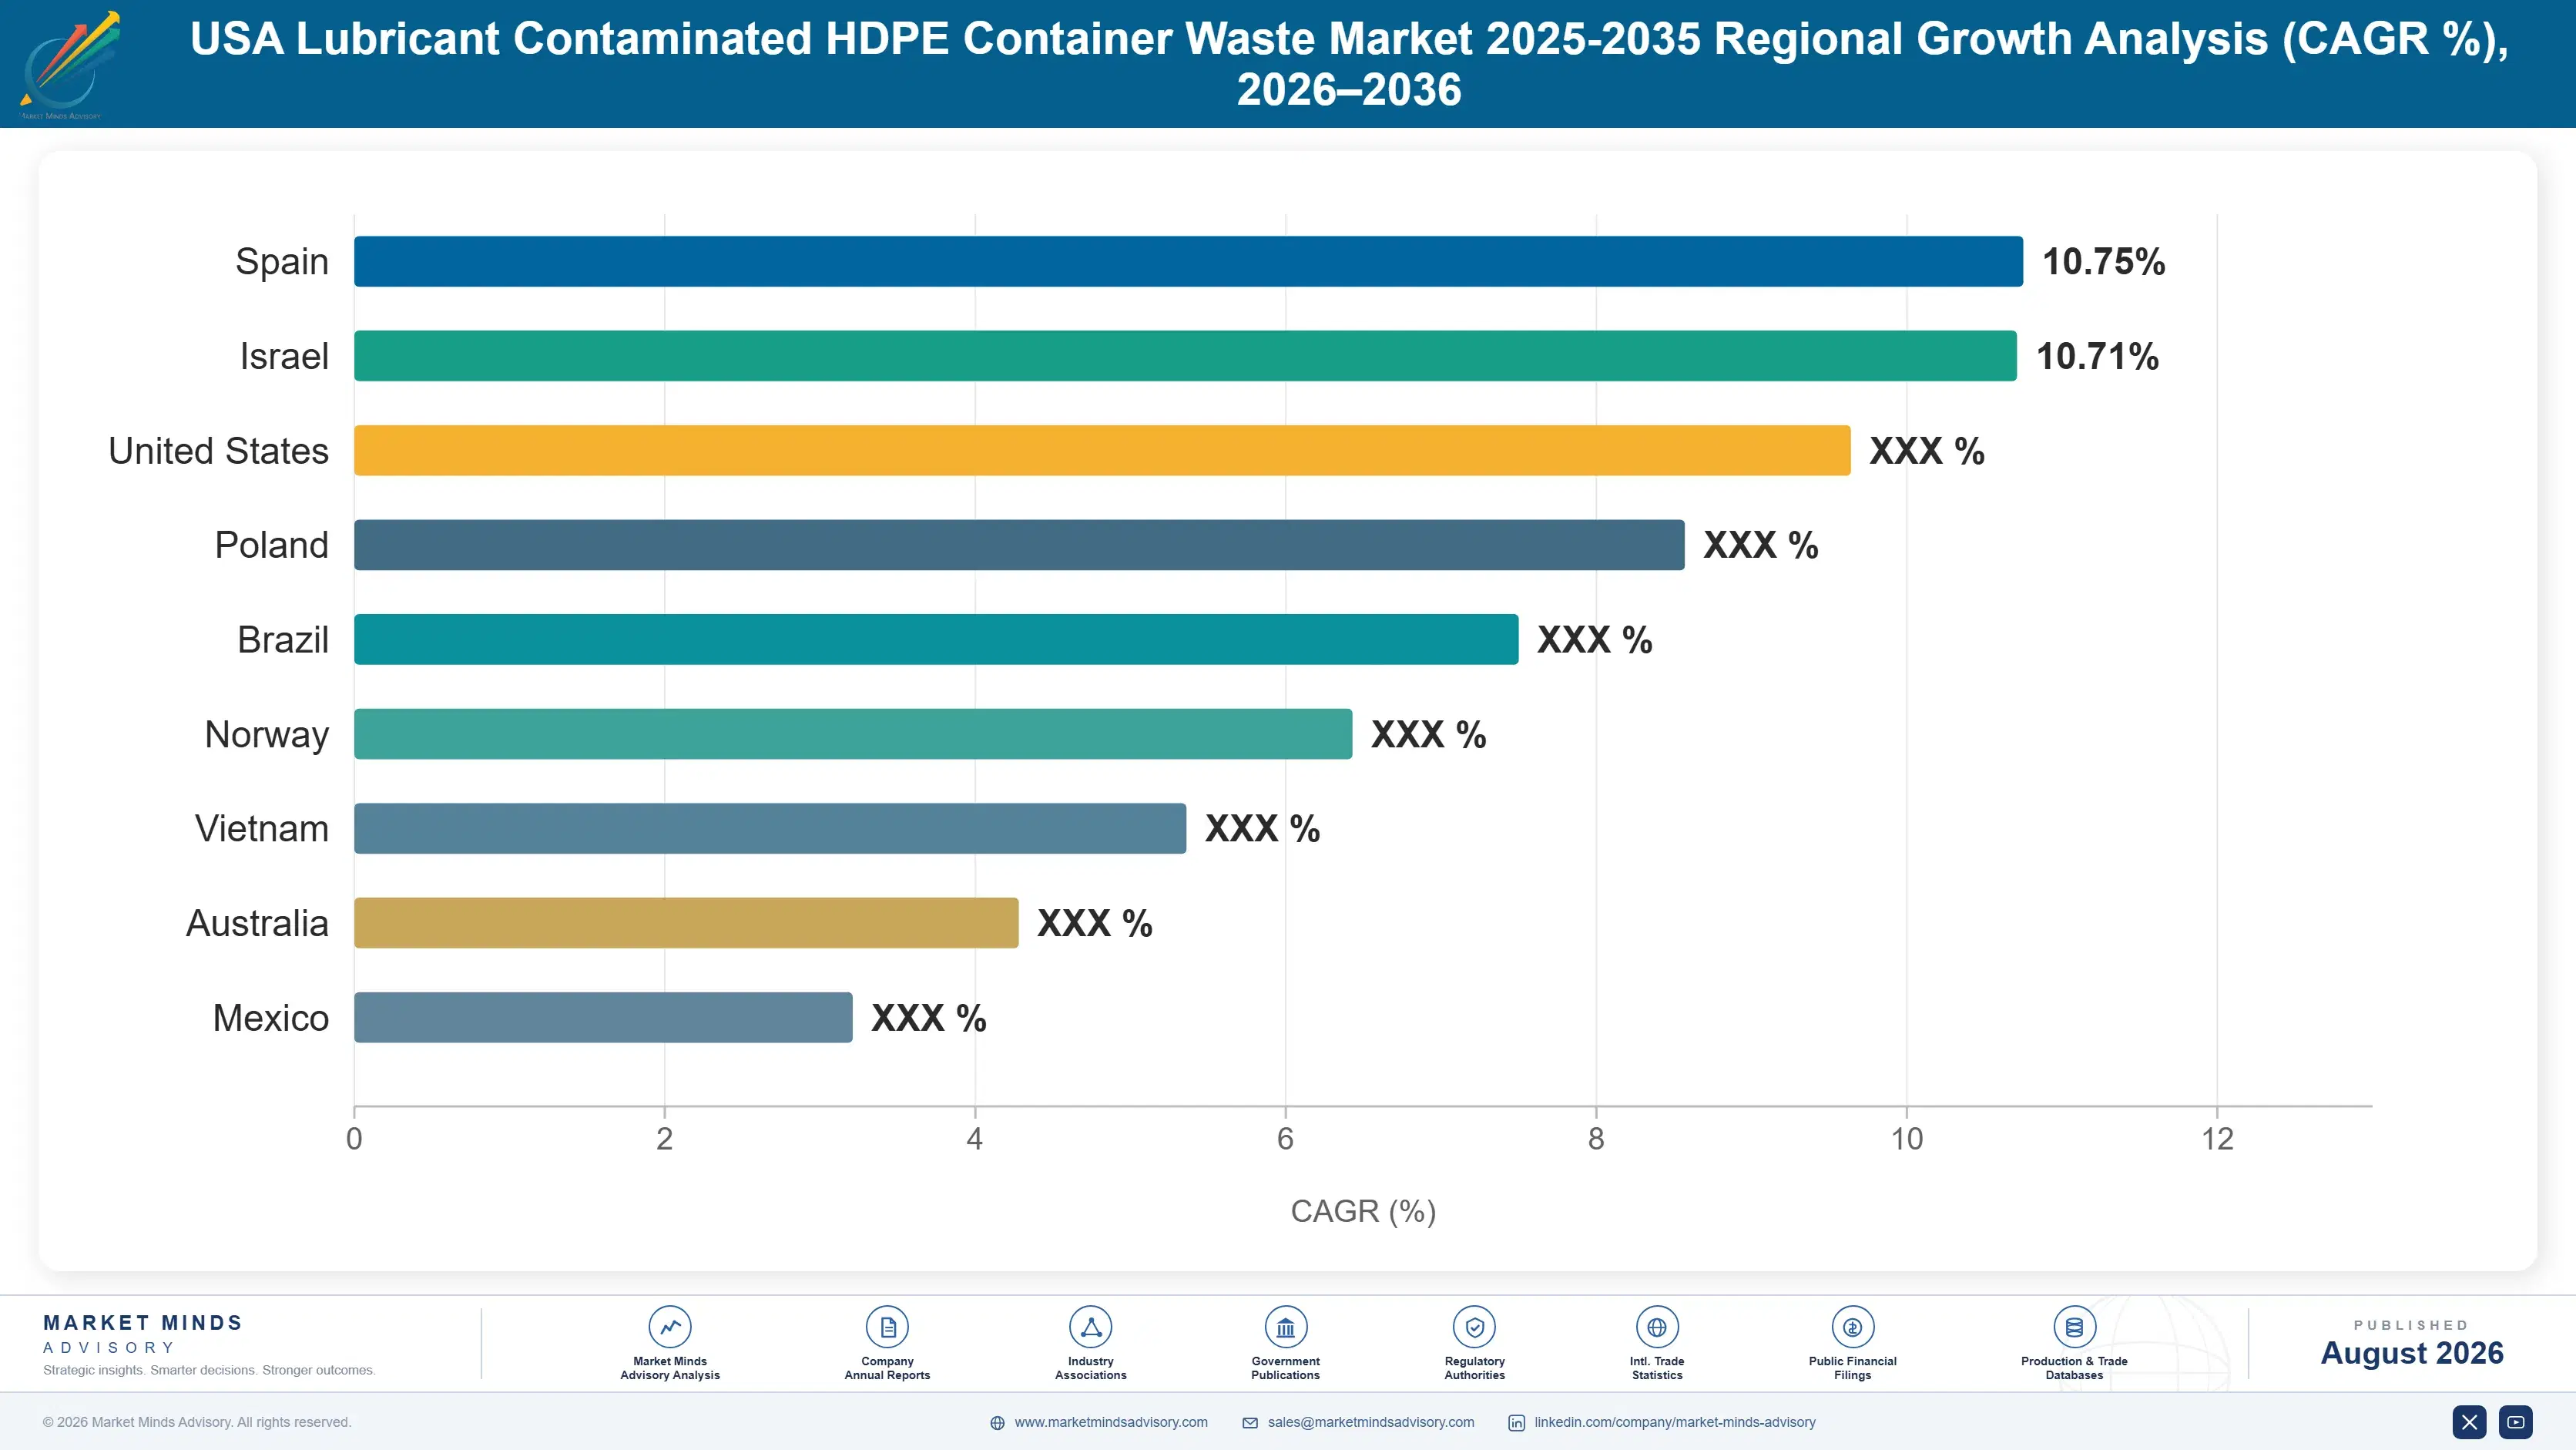
USA Lubricant Contaminated HDPE Container Waste Market 2025-2035
USA Lubricant Contaminated HDPE Container Waste Market 2026-2035: Producer Responsibility Fees, Route Economics and a Permanent Resin Discount
A drained motor oil bottle keeps about 5% of its contents and the hydrocarbon migrates into the polymer wall, so what finally changed this market was a state legislature rather than a wash line.
2025 MARKET VALUE$0.2BMarket Size 2025
2036 FORECAST VALUE$0.6BBase Case , 2026 to 2036
CAGR 2026 TO 20369.4 %Bull 10.6% / Bear 8.2%
INCREMENTAL OPPORTUNITY$0.4BNet 10- year value creation
EXPANSION MULTIPLE2.46x2036 value over 2026 base
Strategic Levers
M&A Pipeline
Regional Outlook
Country Rankings
Competitive Intelligence
Segmental Deep-dive
Executive Snapshot and Market Trajectory
High density polyethylene is the easiest plastic in the world to recycle, and a used motor oil bottle is the hardest HDPE to recycle. A drained container still holds around 5% of its original contents, and the oil migrates into the polymer wall where washing cannot reach it.
That contamination kept the stream out of curbside programmes for thirty years and out of every food contact recycled content channel permanently. Recovered resin still sells at roughly a 30% discount to clean post consumer HDPE. Intermediate bulk container inner bottles are the fastest growing segment at 14.1%, half again the market rate of 9.4%, because they arrive in identifiable volume from industrial sites rather than from household bins.
What changed is not the chemistry. State extended producer responsibility programmes and recycled content mandates have started counting this stream, and 42% of processor revenue now arrives as producer responsibility fees rather than as resin sales. The buyer moved from a recycler chasing material value to a lubricant marketer buying compliance, which reprices the whole thing. The market remains fragmented, with the top five handling 34% of tonnage. Consolidation has barely started here.
Market Definition
Collection, processing and recovery of high density polyethylene containers that held lubricants, motor oils and automotive fluids in the United States, covering retail motor oil and fluid bottles, industrial pails and buckets, HDPE drums, intermediate bulk container inner bottles, and grease cartridges and small format containers. Measured at service and material revenue combined. Used oil itself, steel containers, antifreeze reclamation and non lubricant chemical packaging are excluded.
Base Year Value
$0.2B in 2025 (MMA Primary Research Dataset, August 2026)
Forecast Period
2026 to 2036, eleven discrete annual values
CAGR
9.4% base case. Bull 10.6%. Bear 8.2%.
Fastest Growth Segment
Intermediate Bulk Container Inner Bottles: 14.1% CAGR
Fastest Growth Country
Texas: 12.8% CAGR
Fastest Growth Region
South Asia and Pacific: 11.6% CAGR
Largest Region
North America: 91% of 2025 global value
Market Leaders
Clean Harbors, Veolia North America, Republic Services, Waste Management, Heritage-Crystal Clean. Source: MMA Primary Research Dataset, July 2026.
Primary Survey
n=3,800 procurement and R&D decision-makers, Q4 2025, six countries
Methodology
Demand-side build-up, cross-validated against public data, 47 expert interviews
USA Lubricant Contaminated HDPE Container Waste Market Forecast Scenarios

Very little happened commercially before 2021. Lubricant containers went to landfill or, in a few states, to energy recovery, and the recyclers that did handle them lost money doing it. Then California and several other states enacted producer responsibility legislation that put a compliance obligation behind the material. The 7.6% historical rate is almost entirely a policy artefact rather than a market development.
The 9.4% base case rests on three mechanisms. State producer responsibility programmes continue expanding, and each new state adds a fee funded collection obligation covering containers that previously had no recovery route. Recycled content mandates for non food packaging create demand for exactly the discounted resin this stream produces, since nobody was going to use it for a milk jug anyway. And industrial container reconditioning keeps growing as drum and tote users find it cheaper than buying new.
The 10.6% bull case turns on additional states adopting producer responsibility with lubricant containers explicitly included, since the drafting decides whether this stream is covered or quietly exempted. The 8.2% bear case is virgin resin pricing: cheap polyethylene makes recycled content look expensive, and mandates written with cost based off ramps get used when the spread widens far enough.
The 9.4% base case rests on three mechanisms. State producer responsibility programmes continue expanding, and each new state adds a fee funded collection obligation covering containers that previously had no recovery route. Recycled content mandates for non food packaging create demand for exactly the discounted resin this stream produces, since nobody was going to use it for a milk jug anyway. And industrial container reconditioning keeps growing as drum and tote users find it cheaper than buying new.
The 10.6% bull case turns on additional states adopting producer responsibility with lubricant containers explicitly included, since the drafting decides whether this stream is covered or quietly exempted. The 8.2% bear case is virgin resin pricing: cheap polyethylene makes recycled content look expensive, and mandates written with cost based off ramps get used when the spread widens far enough.
Why the Easiest Polymer Became the Hardest Stream
Contamination here is not a cleaning problem. A drained quart bottle retains roughly 5% of its contents by weight, and over months in a garage the hydrocarbon migrates into the polyethylene wall itself. Washing removes surface residue and leaves the absorbed fraction behind, so the resin comes out with an odour and a melt profile no food contact application will accept.
TOP FIVE CONCENTRATION34%Combined tonnage handled by the largest processing companies
RESIDUAL CONTENT RETAINED5%Share of original fluid remaining in a drained container
RESIN PRICE DISCOUNT30%Recovered resin discount against clean post consumer material
COLLECTION RECOVERY RATE17%Portion of eligible containers entering any recovery channel
PROCESSING COST PER TONUSD 310Cost to wash and process a ton of material
PRODUCER FEE SHARE42%Portion of processor revenue arriving through producer responsibility fees
The economics followed from that. Recovered resin sells at roughly a 30% discount to clean post consumer HDPE, and processing costs around 310 dollars a ton against material worth considerably less than clean bales. For thirty years that arithmetic pointed one way, and only 17% of eligible containers enter any recovery channel now. Landfill was not a failure of will; it was the correct commercial answer.
Producer responsibility legislation broke that arithmetic without changing any of the underlying facts. When a lubricant marketer carries a legal obligation for the container it sold, a bottle in a landfill becomes a liability rather than somebody else's problem. Roughly 42% of processor revenue now arrives as producer responsibility fees. That is a different business from recycling, and the companies that understood the difference early have taken position ahead of larger waste groups.
"Everybody in this business spent three decades trying to wash oil out of polyethylene. The problem was never solved and it did not need to be, because the thing that changed the economics was a state legislature, not a wash line."
Market Trends
The revenue model in this stream inverted within about four years. A processor used to earn from selling recovered flake and lost money on everything upstream of that. Under state producer responsibility programmes the obligated lubricant marketer pays a fee covering collection and processing, and 42% of processor revenue now arrives that way. The commercial consequence is that material quality matters less than documented recovery tonnage, since the fee is paid against verified diversion rather than against what the resin sells for afterwards. That is an uncomfortable incentive and everyone in the industry knows it.
Market Impact: Mandates cover 8 states currently
Industrial Reconditioning Diverts Containers Before They Become Waste
Drums, pails and intermediate bulk containers increasingly get reconditioned and refilled rather than recycled, because a reconditioned tote costs a lubricant blender considerably less than a new one and the container never enters the waste stream at all. Reconditioners wash, test and repaint, and a steel drum can go round several times before the shell fails. HDPE inner bottles for intermediate bulk containers are replaced each cycle, which is precisely why that segment grows at 14.1%, fastest in the market. The waste stream and the reuse business are competing for the same containers.
Market Impact: Concentrates 66% of container volume
Market Opportunities and Growth Drivers
State Recycled Content Mandates Create Demand for Discounted Resin
Several states now require minimum recycled content in non food plastic packaging, and the resin recovered from lubricant containers is well suited to exactly those applications: agricultural piping, drainage, industrial pallets and new lubricant containers themselves. The odour and melt profile that disqualify it from food contact are irrelevant in a drainage pipe. That gives a discounted material a mandated buyer, which is a considerably better position than competing on price against virgin polyethylene. Closed loop programmes returning recovered resin into new lubricant bottles are the cleanest version of this arrangement.
Market Impact: Locks in a 30% resin discount
Quick Lube and Fleet Channels Concentrate Container Volume
Roughly two thirds of American motor oil is installed by someone other than the vehicle owner, which means most containers are emptied at a quick lube outlet, dealership service bay or fleet garage rather than in a driveway. That concentration is the single most useful fact in this market: a collection route serving 40 outlets recovers more tonnage at lower cost than any household programme could. Container volume arrives clean of other waste, in known formats, on a predictable schedule. Household containers remain the hard fraction and always will. Route density decides the economics.
Market Impact: Discount widens beyond 30% periodically
Market Restraints and Challenges
Absorbed Hydrocarbon Cannot Be Washed Out
A drained lubricant container retains roughly 5% of its contents, and the hydrocarbon migrates into the polyethylene wall over the weeks or months before collection. The root cause is that polyethylene is a non polar polymer and mineral oil is a non polar liquid, so the two are genuinely compatible at a molecular level rather than merely dirty. Washing removes surface residue only. The commercial consequence is a permanent 30% resin discount and exclusion from food contact applications. Processors are responding with deodorising extrusion and by targeting applications where the odour does not matter.
Market Impact: Fees supply 42% of revenue
Virgin Resin Pricing Undermines Recycled Content Economics
American polyethylene production capacity expanded substantially on cheap shale gas feedstock, and virgin resin has periodically traded below recycled material despite the recycled product carrying an environmental claim. The root cause is that recycled content mandates set volume obligations without setting price floors, so the compliance cost varies with a spread nobody controls. Several state programmes include cost based relief provisions that obligated companies invoke when the spread widens enough. Processors are responding by contracting multi year offtake with brand owners at fixed pricing, which removes the spread risk from both sides at once.
Market Impact: Inner bottles grow 14.1% annually
3 additional market trends, 4 additional growth drivers, and 2 additional restraints and challenges are covered in the full report. Contact sales@marketmindsadvisory.com to access the complete intelligence.
Segment CAGR and Growth Architecture
Segmentation follows container format, since format determines where the container is emptied and what it costs to collect. Five formats cover the stream, from a quart bottle in a household bin to an intermediate bulk container inner bottle at a blending plant. Growth sits with the industrial formats, for reasons that have nothing to do with the polymer.

Intermediate Bulk Container Inner Bottles
The HDPE bottle inside a caged tote, replaced at each reconditioning cycle while the steel cage and pallet continue in service. At 14.1% this is the fastest growing format in the stream, half again the market rate of 9.4%, and the reason is entirely logistical rather than chemical. These bottles arrive at reconditioning facilities in quantity, in one format, already separated, with a known fill history and a named previous owner. Collection cost per ton is a fraction of any household route. Contamination is often lower too, since a tote gets emptied by pump rather than drained by gravity, and the residual fraction is smaller as a share of a much larger container.
CAGR 14.1%
Industrial Pails and Buckets
Two to six gallon HDPE pails used for greases, hydraulic fluids and bulk lubricants across manufacturing, construction and marine sites. Growth of 11.8% is second fastest in the stream, driven by the same logic as totes: these containers are emptied at commercial premises with a waste contract already in place, so adding them to an existing collection route costs almost nothing incremental. Grease residue is the complication, since it does not drain and has to be scraped or hot washed, which adds cost per ton against a thin material value. Producer responsibility fees have made that arithmetic work for the first time. Nobody reconditions a grease pail. Reconditioners take the cleaner pails and leave the greasy ones behind.
CAGR 11.8%
Full segment breakdown across 5 segments available in the complete report.
Regional Architecture and Country Demand Map
North America holds 91% of the market by definition, since scope covers United States container waste. The remaining shares reflect comparable regulatory developments and equipment supply rather than consumption. Texas, California and the industrial Midwest carry most domestic volume. Producer responsibility coverage varies sharply by state.
North America
Scope fixes this position rather than any commercial dynamic: the market covers United States lubricant container waste, so North America carries 91% by construction and the remaining shares represent regulatory comparison and equipment supply. Within the United States the picture is genuinely uneven. California, Oregon, Colorado, Maine and several other states have producer responsibility programmes with lubricant containers explicitly covered, and processors in those states earn fees that processors elsewhere do not. Texas generates the largest container volume in the country on oil field, trucking and industrial lubricant consumption, with no producer responsibility programme behind it. The industrial Midwest carries manufacturing pail and drum volume. Canadian provincial programmes sit outside the defined scope.
Share: 91% | CAGR: 9.4% (2026 to 2036)
Western Europe
Regulatory precedent rather than volume explains this 2% share under a scope covering United States container waste. European packaging waste directives have covered lubricant containers for considerably longer than any American programme, and the collection architecture built around them is what several state legislatures examined when drafting. German and French return systems achieve recovery rates well above anything achieved domestically, largely because obligations were placed on producers decades earlier. European wash line and deodorising extrusion equipment also supplies American processors. Growth of 7.8% reflects a mature European system with limited headroom. The lesson is that recovery rates follow obligation rather than technology. Recovery rates there run at several times the American level currently.
Share: 2% | CAGR: 7.8% (2026 to 2036)
Regional intelligence for 5 additional markets available in the complete report: East Asia, South Asia and Pacific, Latin America, Middle East and Africa, Eastern Europe. Contact sales@marketmindsadvisory.com.

Where This Stream Actually Earns
Nobody makes money washing oil out of polyethylene. Value accrues to whoever holds the producer responsibility contract, whoever collects from concentrated commercial sites rather than households, and whoever has a mandated end market lined up for discounted resin. Four routes carry weight, and three of them are commercial arrangements rather than processing capability. Equipment is the easy part.
Contract Directly With Obligated Lubricant Marketers
Producer responsibility fees now supply 42% of processor revenue in covered states, and those fees are paid under contract by the obligated brand owner rather than won on a tender. A processor holding direct agreements with three or four large lubricant marketers has a revenue base that does not move with resin pricing at all. The negotiating position rests on documented recovery tonnage and audit quality, since the marketer needs evidence it can file, not a good price on flake. Processors that built compliance reporting capability first won these contracts.
Market Impact: Secures the 42% of revenue arriving under contract
Collect From Service Bays, Not From Driveways
Roughly two thirds of American motor oil is installed by someone other than the vehicle owner, so the containers concentrate at quick lube outlets, dealership service bays and fleet garages. A route serving 40 commercial sites recovers more tonnage at lower cost than any household collection programme, and the material arrives in known formats without other waste mixed through it. Household containers cost several times more per ton to recover and always will. Programmes designed around kerbside collection have consistently underperformed the ones designed around commercial routes. Route density is the whole economic question.
Market Impact: Captures the 66% of container volume emptied commercially
Sell Into Mandated Non Food Applications Only
The absorbed hydrocarbon that causes a 30% resin discount is completely irrelevant in agricultural drainage pipe, industrial pallets, wheelie bins and new lubricant bottles. Several states now mandate minimum recycled content in exactly those non food categories, which converts a discounted material into one with a legally obliged buyer. The commercial discipline is qualifying end users before building capacity rather than afterwards, since a processor with tonnage and no offtake is holding a cost. Closed loop arrangements returning resin into new lubricant containers price best of all. Nobody should build capacity on hope here.
Market Impact: Removes the 30% discount by using content mandates
Take the Reconditioning Position on Industrial Formats
Intermediate bulk container inner bottles grow at 14.1% and industrial pails at 11.8%, and both arrive through reconditioning operations rather than through waste collection. A reconditioner replaces the HDPE bottle at each cycle while the cage continues in service, which produces a predictable stream of one format from one site with a named previous owner. That is the cheapest tonnage in this market by a wide margin. Processors positioned alongside reconditioners capture it without operating a collection route at all, and the relationship is contractual rather than competitive. Very few processors have built that position.
Market Impact: Reaches the 14.1% fastest growing format in market
Who Controls the Margin Pool
This market is fragmented in a way that surprises people who expect waste handling to be concentrated. The top five account for 34% of tonnage handled, the basis applied consistently across every participant here, and that includes national waste companies alongside specialist reconditioners with a handful of sites. Clean Harbors leads on route density and industrial service relationships rather than on any processing advantage.
Competition runs on three separate fronts. National waste companies compete for producer responsibility contracts on reporting capability and geographic coverage, which suits their existing infrastructure. Reconditioners compete for industrial containers against the waste stream itself, and they usually win because reuse pays better than recovery. Independent processors compete on end market access, since a qualified offtake agreement for discounted resin is worth more than another wash line.
Rankings will move with state legislation rather than with anything a company does. Each new producer responsibility programme creates a contracting event covering a whole state at once, and the processors positioned when the drafting concludes take positions others cannot dislodge for years. Acquisition of regional processors by national waste groups has already started. The other pressure point is lubricant marketers building their own closed loop arrangements.

Competitive Moat and Risk Dimensions
Moat: Industrial Route Density
Existing service relationships across quick lube outlets, fleet garages and industrial sites mean lubricant containers can be added to routes that already run, at almost no incremental cost. A new entrant has to build that density before the economics work at all, and route density in waste handling is close to impossible to replicate quickly in any region.
Risk: Reconditioning Diverts Volume
The fastest growing formats in this market, intermediate bulk container bottles at 14.1% and industrial pails at 11.8%, increasingly reach reconditioners rather than waste collection, because reuse pays a container owner better than disposal does. A waste business capturing containers at end of life loses volume every year that reconditioning capacity expands. That trend is accelerating.
Moat: Compliance Reporting Capability
Producer responsibility contracts are awarded on documented recovery tonnage and auditable chain of custody rather than on price per ton, and building reporting systems that satisfy a state regulator takes years. An obligated lubricant marketer buys evidence it can file, and a supplier that has already passed audits elsewhere carries a considerable advantage in every new state.
Risk: Resin Market Exposure
Revenue not covered by producer responsibility fees depends on selling recovered flake at a 30% discount into markets where cheap virgin polyethylene periodically undercuts it entirely. In states without programmes, that is the whole business case, and it fails whenever the spread moves. Multi year offtake contracts help but they also cap the upside.
Players Tracked
Prominent Players
Clean Harbors
Veolia North America
Republic Services
Waste Management
Heritage-Crystal Clean
Other Key Players
Greif
Mauser Packaging Solutions
Myers Container
General Steel Drum
Container Life Cycle Management
Quest Resource Holding
Casella Waste Systems
Rubicon Technologies
KW Plastics
Envision Plastics
Custom Polymers
Nexus Circular
Revolution Company
Avangard Innovative
Merlin Plastics
Recent Developments
Additional state producer responsibility programme covers lubricant containers
A state producer responsibility programme took effect with lubricant and automotive fluid containers explicitly named among covered materials, obliging brand owners to fund collection and processing. Processors operating in the state moved from selling recovered material at a discount to invoicing fees against documented recovery tonnage within two quarters.
Signal: Whether this stream is named in the drafting decides the entire economics of a state programme
Lubricant marketer launches closed loop container recycling programme
A major lubricant marketer announced a programme returning recovered resin from its own used containers into new bottle production, contracting directly with processors for verified feedstock. The arrangement removes that tonnage from the open recovered material market and gives the brand owner a recycled content claim it controls entirely.
Signal: Brand owners taking direct control of feedstock will leave independent processors competing only for what remains
National waste company acquires regional container processing operator
A national waste handling company acquired a regional operator specialising in industrial container processing and reconditioning, adding sites across several states with active producer responsibility programmes. The acquirer named compliance contracting capability rather than processing capacity as the reason for the transaction. Regional operators are consolidating quickly now.
Signal: Consolidation here is buying regulatory position and audit history rather than any physical processing asset at all
What Processing a Ton Actually Costs
Processing costs around 310 dollars a ton and labour is the largest line at roughly 38%, since sorting contaminated containers still requires human hands at several points. Water and wastewater treatment account for a further 22%, and that share rises with residue levels because oily wash water needs separation before discharge. Electricity for granulation and extrusion adds around 16%, and collection freight sits outside the gate entirely.
Diesel was the input that hurt most, because this is a freight business wearing a processing costume. EIA on-highway diesel price series show the movement through 2022, and collection routes running empty containers at very low density per truck absorbed it directly. A trailer of drained motor oil bottles fills up long before it reaches any weight limit. Several regional processors withdrew from outlying collection areas.
Exposure divides by geography rather than by scale. A processor serving dense metropolitan commercial routes carries a freight cost per ton a fraction of one serving rural quick lube outlets across three states, and neither can change it. Producer responsibility fee schedules rarely account for that difference, since they are set statewide. Rural collection happens only where a programme funds it explicitly, and processors avoid the rest.

Densify containers at the collection point
Baling or crushing at the service bay rather than at the plant multiplies payload per trailer several times over. Compactors placed at high volume quick lube outlets pay back inside a year on route savings alone. The obstacle is capital at sites the processor does not own, so equipment is usually placed rather than sold.
Close the wash water loop to cut treatment cost
Oily wash water is the second largest cost line and the one most exposed to discharge regulation tightening. Closed loop systems with oil water separation and filtration recirculate the majority of process water, cutting intake and treatment volumes substantially. Capital cost is meaningful and payback depends on local water and discharge pricing, which varies enormously between states and between municipalities.
Price producer responsibility contracts with a freight index
Fee schedules set statewide ignore the difference between a metropolitan route and a rural one, and processors carrying that gap have withdrawn from outlying areas. Contracts written with a diesel index adjustment transfer the exposure back to the obligated brand owner, who absorbs it more easily. Several programmes now permit differentiated rural collection premiums, which is the more durable answer.
Portfolio Architecture for Margin Defence
Margin here has almost nothing to do with the material and almost everything to do with who pays. Tonnage handled under producer responsibility contract earns a service margin set by negotiation. Tonnage handled on resin value alone earns whatever a 30% discounted material fetches after 310 dollars a ton of processing, which is frequently nothing. Reconditioning sits above both, because reuse avoids the processing cost entirely.
The tension is between volume and coverage. Texas generates the largest container volume in the country and has no producer responsibility programme, so that tonnage earns resin value or nothing. Covered states generate less volume and pay fees on all of it. A processor optimising for tonnage builds in the wrong places, and one optimising for fee coverage ends up with a small footprint in expensive markets.
High value pools concentrate in industrial reconditioning and in closed loop supply agreements with lubricant marketers, both of which avoid the open recovered material market entirely. Those arrangements are contractual and multi year. Everything else in this market is exposed to a resin spread nobody controls, and the companies that have not secured contracted revenue are running a business the polyethylene price can close.
Open Market Recovered Flake
Washed and granulated material sold at a 30% discount into whatever non food application will take it, against a processing cost around 310 dollars a ton. Margin disappears whenever virgin polyethylene pricing falls.
Gross Margin: 6-9%
Producer Responsibility Contracted Tonnage
Collection and processing paid for by an obligated brand owner under contract, priced on documented recovery tonnage and auditable chain of custody rather than on material value. Margin holds because audit history is difficult to replicate.
Gross Margin: 22-25%
Closed Loop and Reconditioning Supply
Contracted resin returned into new lubricant containers, and inner bottle supply into industrial reconditioning cycles. Both avoid the open recovered material market and price on service reliability rather than on commodity spread. Neither is easy to enter.
Gross Margin: 31-34%

High-value Sub-segments and Strategic Watch-out
Intermediate Bulk Container Inner Bottles
The fastest growing format at 14.1% and the cheapest tonnage in the market, since bottles arrive at reconditioning sites already separated, in one format, with a named previous owner. Collection cost per ton is a fraction of any household route and contamination levels are lower too.
Gross Margin: 31-34%
Industrial Pails and Buckets
Second fastest at 11.8%, collected from commercial premises that already hold a waste contract, so incremental route cost is minimal. Grease residue is the complication, since it does not drain and requires hot washing, which producer responsibility fees have only recently made economic. Reconditioners take the cleaner ones.
Gross Margin: 24-27%
Retail Motor Oil and Fluid Bottles
The volume core at 8.2% growth and the worst economics in the market, since quart bottles fill a trailer long before reaching weight and household collection costs several times commercial routes. Only 17% of eligible containers enter recovery, and freight explains most of that. Densification at source is essential.
Gross Margin: 6-9%
Grease Cartridges and Small Format Containers
Growing at only 5.6% and effectively unrecyclable at any sensible cost, since grease does not drain, cartridges are multi material, and unit weight is negligible against collection expense. Energy recovery remains the realistic destination and nobody in the industry pretends otherwise. Programmes should say so plainly.
Gross Margin: 4-7%
How This Tonnage Keeps Arriving
Container waste arrives whether anybody wants it or not, which makes this an unusually reliable demand base once a contract exists. American lubricant consumption produces the same container volume every year regardless of conditions, since oil changes happen on mileage rather than on sentiment. A producer responsibility contract converts that physical certainty into contracted revenue, and 42% of processor revenue now arrives that way rather than from selling anything.
Stickiness varies enormously by generator type. Industrial sites under a waste contract with a reconditioning relationship almost never change supplier. Quick lube chains negotiate nationally and switch on price, because containers are a cost line rather than an obligation for them. Households have no relationship at all, which is precisely why household recovery has never worked without a deposit or a mandate behind it.
The buyer changed completely and the industry noticed late. For thirty years the customer was a compounder or converter buying recovered flake on price and specification. It is now a lubricant marketer's sustainability and compliance function buying documented diversion, and that buyer cares about audit trail and reporting deadlines rather than melt index. Processors that hired compliance people instead of more sales engineers took the early contracts.

Where This Waste Stream Pays
These are among the four positions where our research anticipates prominent divergence between winners and laggards over the coming forecast period. Each is grounded in the demand model, the regulatory perimeter, and the announced capacity pipeline.
Sell diversion evidence, not recovered polyethylene resin
Producer responsibility fees now supply 42% of processor revenue in covered states, and those contracts are awarded on documented recovery tonnage and auditable chain of custody rather than on price per ton. The obligated lubricant marketer is buying evidence it can file with a regulator, which is a different product from flake. Processors that built compliance reporting capability before the programmes took effect hold contracts that competitors will not dislodge for years, and building that capability after the award is far too late.
Commercial routes work and household collection does not
Roughly two thirds of American motor oil is installed by someone other than the vehicle owner, so containers concentrate at quick lube outlets, dealership bays and fleet garages where a route serving 40 sites recovers more tonnage than any kerbside programme. Household containers cost several times more per ton and only 17% of eligible containers enter recovery at all. Any programme designed around household participation is designing against the freight arithmetic, and the freight arithmetic always wins that argument in the end.
Mandated non food applications, qualified before capacity
The absorbed hydrocarbon that causes a permanent 30% resin discount is irrelevant in drainage pipe, industrial pallets and new lubricant bottles, and several states now mandate minimum recycled content in exactly those categories. That converts a discounted material into one with a legally obliged buyer, which is a far better position than competing against virgin polyethylene on price. Qualifying end users before building processing capacity is the discipline, because a processor holding tonnage without offtake is simply holding a cost.
Industrial formats reach reuse before reaching waste
Intermediate bulk container inner bottles grow at 14.1%, half again the market rate of 9.4%, and industrial pails at 11.8%, and both reach reconditioners rather than waste collectors because reuse pays a container owner better than disposal. A processor positioned alongside reconditioning operations captures the cheapest tonnage in this market without running a collection route at all. Waste businesses that ignore the reuse channel will watch their fastest growing volume divert away from them permanently and quite quickly at that.
Engagement Snapshot From the Field
A live engagement with an industry participant carrying material or product regulatory and market exposure ahead of a defining policy shift, showing how our research translates into a defensible multi-year portfolio strategy.
MARKET MINDS ADVISORY · CLIENT ENGAGEMENT SUMMARY
USA Lubricant Contaminated HDPE Container Waste 2025-2035 Producer Strategic Portfolio Review and Transition Roadmap 2026·Investment Scenario on USA Lubricant Contaminated HDPE Container Waste 2025-2035 Exposure Evaluation 2025-26
CLIENT PROFILE
A regional waste and recycling operator running material recovery facilities across four states, with an established industrial collection business and no lubricant container capability. Annual revenue was approximately 180 million dollars (client-reported, unverified by MMA), almost entirely from municipal contracts and commercial waste routes. Two of the four states had enacted producer responsibility programmes covering lubricant containers.
STRATEGIC CHALLENGE
Management saw producer responsibility fees appearing in two of its states and had no way to judge whether processing capacity was worth building. The internal debate split between installing a wash line, contracting processing out and keeping only collection, or ignoring the stream entirely. Nobody could say what recovered resin would actually sell for, or to whom.
MMA APPROACH
MMA modelled collection economics by route type across the client's four states, separating commercial site density from household participation assumptions. Producer responsibility fee schedules were compared against processing cost per ton at three throughput levels. Forty-seven expert interviews with lubricant marketers, converters and state programme administrators established what obligated companies actually require from a supplier and what they will pay for it.
KEY FINDINGS
- Commercial route collection cost 84 dollars a ton against 340 dollars for household routes in the same counties, which decided the collection question before processing was even considered.
- Lubricant marketers named audit quality and reporting timeliness ahead of price in 38 of the 47 interviews, and several had already rejected suppliers on documentation grounds.
- Processing economics required roughly 14,000 tons a year to justify a wash line, which the client's two covered states could not supply for at least four years.
- Converters buying recovered flake would commit to multi year offtake at fixed pricing, removing resin spread exposure, but only from suppliers already qualified against their specifications.
CLIENT PROFILE
A regional waste and recycling operator running material recovery facilities across four states, with an established industrial collection business and no lubricant container capability. Annual revenue was approximately 180 million dollars (client-reported, unverified by MMA), almost entirely from municipal contracts and commercial waste routes. Two of the four states had enacted producer responsibility programmes covering lubricant containers.
STRATEGIC CHALLENGE
Management saw producer responsibility fees appearing in two of its states and had no way to judge whether processing capacity was worth building. The internal debate split between installing a wash line, contracting processing out and keeping only collection, or ignoring the stream entirely. Nobody could say what recovered resin would actually sell for, or to whom.
MMA APPROACH
MMA modelled collection economics by route type across the client's four states, separating commercial site density from household participation assumptions. Producer responsibility fee schedules were compared against processing cost per ton at three throughput levels. Forty-seven expert interviews with lubricant marketers, converters and state programme administrators established what obligated companies actually require from a supplier and what they will pay for it.
KEY FINDINGS
- Commercial route collection cost 84 dollars a ton against 340 dollars for household routes in the same counties, which decided the collection question before processing was even considered.
- Lubricant marketers named audit quality and reporting timeliness ahead of price in 38 of the 47 interviews, and several had already rejected suppliers on documentation grounds.
- Processing economics required roughly 14,000 tons a year to justify a wash line, which the client's two covered states could not supply for at least four years.
- Converters buying recovered flake would commit to multi year offtake at fixed pricing, removing resin spread exposure, but only from suppliers already qualified against their specifications.
RECOMMENDED STRATEGY
Phase 1: Phase one: collect only, from commercial routes at 84 dollars a ton, and contract processing to an existing operator rather than building a wash line. Phase 2: Phase two: hire compliance reporting capability immediately, since 38 of 47 marketers rank audit quality above price when awarding these contracts. Phase 3: Phase three: revisit processing capacity only once contracted tonnage approaches 14,000 tons a year across the covered states, and not before.
OUTCOME
The client won producer responsibility contracts with two lubricant marketers inside eight months, having hired compliance reporting staff before bidding. Collection tonnage reached 6,400 tons in the first year at a service margin of 23%, and the wash line decision was deferred without any revenue cost (client-reported, unverified by MMA).
Frequently Asked Questions
Foundational context covering the market sizes, CAGR, scope, country, region and competition that inform every finding below. This section is provided to cover basics and most often pre-purchase conversations, answered from the MMA Primary Research Dataset.
What is the current size of the USA Lubricant Contaminated HDPE Container Waste Market?
The market was valued at 0.24 billion dollars in 2025, covering collection, processing and recovery of lubricant contaminated HDPE containers across the United States. It reaches an estimated 0.26 billion dollars during 2026.
How large will the USA Lubricant Contaminated HDPE Container Waste Market be by 2036?
MMA forecasts 0.64 billion dollars by 2036, an increase of 0.38 billion dollars over the 2026 base. That represents an expansion multiple of 2.46 times across the forecast period.
What is the CAGR for the USA Lubricant Contaminated HDPE Container Waste Market 2026 to 2036?
The base case compound annual growth rate is 9.4%, with a bull case of 10.6% and a bear case of 8.2%. State programme coverage and virgin resin pricing separate those scenarios.
Which segment is growing fastest?
Intermediate bulk container inner bottles grow at 14.1%, half again the market rate of 9.4%, because they arrive at reconditioning sites already separated. Industrial pails follow at 11.8%.
Who are the major companies in the USA Lubricant Contaminated HDPE Container Waste Market?
Clean Harbors, Veolia North America, Republic Services, Waste Management and Heritage-Crystal Clean lead on tonnage handled across the United States. Together they account for 34% of the market.
Which country is growing fastest?
The market is defined as United States container waste, and Texas grows fastest of any state at 12.8% on oil field, trucking and industrial lubricant consumption.
Report Segmentation Architecture
The full report scope spans multiple orthogonal segmentation dimensions, with cross-tabulated demand data provided for each dimension pair. Coverage extends further to regional breakdowns, trend trajectories, and the competitive detail needed to support segment-level decision-making.
By Container Format
- Retail Motor Oil and Fluid Bottles
- Industrial Pails and Buckets
- HDPE Drums
- Intermediate Bulk Container Inner Bottles
- Grease Cartridges and Small Format Containers
By End-Use Industry
- Automotive Service and Quick Lube
- Commercial Fleet Operations
- Manufacturing and Industrial Plants
- Construction and Heavy Equipment
- Marine and Agricultural Operations
- Household and Retail Consumers
By Commercial Dimension
- Producer Responsibility Contracts
- Commercial Waste Route Service
- Industrial Reconditioning Supply
- Closed Loop Brand Agreements
- Open Market Flake Sales
- Municipal Programme Contracts
By Region
- North America
- Western Europe
- East Asia
- South Asia and Pacific
- Latin America
- Middle East and Africa
- Eastern Europe
Scope, Methodology, and Coverage
Every figure in this report is reproducible from documented input assumptions. The scope below maps the historical period, the forecast horizon, the segmentation dimensions, and the countries covered, alongside the underlying primary and qualitative methodology.
Historical Period
2020 to 2025
Forecast Period
2026 to 2036
Base Year
2025 (USD billions; MMA Primary Research Dataset, August 2026)
Market Definition
Collection, sortation, processing and material recovery of high density polyethylene containers that previously held lubricants, motor oils, greases and automotive fluids within the United States, covering retail motor oil and fluid bottles, industrial pails and buckets, HDPE drums, intermediate bulk container inner bottles, and grease cartridges and small format containers. Measured as combined service revenue and recovered material value. Used oil reclamation, steel drums, antifreeze processing, agricultural chemical containers and non lubricant industrial packaging are excluded from scope.
Quantitative Units
USD billions (current prices); tons recovered; USD per ton by container format and route type
Segmentation Dimensions
Container format; end-use industry; commercial dimension; region
Regions Covered
North America, Western Europe, East Asia, South Asia and Pacific, Latin America, Middle East and Africa, Eastern Europe
Countries Covered
United States, Canada, Mexico, Germany, France, Netherlands, United Kingdom, Poland, Czechia, China, Taiwan, Japan, South Korea, India, Australia, Brazil, Colombia, Saudi Arabia, United Arab Emirates, South Africa
Key Companies Profiled
Clean Harbors, Veolia North America, Republic Services, Waste Management, Heritage-Crystal Clean, Greif, Mauser Packaging Solutions, Myers Container, General Steel Drum, Container Life Cycle Management, Quest Resource Holding, Casella Waste Systems, Rubicon Technologies, KW Plastics, Envision Plastics, Custom Polymers, Nexus Circular, Revolution Company, Avangard Innovative, Merlin Plastics
Quantitative Methodology
Primary survey, n=3,800 respondents, Q4 2025, six countries; demand-side model with trade association cross-validation
Qualitative Methodology
47 expert interviews, Q4 2025; applied to validate demand model assumptions, identify emerging dynamics, and assess competitive positioning
Report Format
PDF and XLSX data workbook (Word format preview document)
Publisher
Market Minds Advisory
Report Code
MMA-2026-PAC-104
Published
August 2026
Contact
sales@marketmindsadvisory.com | www.marketmindsadvisory.com
Purchase the full USA Lubricant Contaminated HDPE Container Waste Market 2025-2035 Report (2026 to 2036).
The full report treats lubricant contaminated containers as a compliance market rather than a recycling one, since the chemistry has not changed and the buyer has. It sizes all five container formats independently through 2036, models collection cost by route type against producer responsibility fee schedules state by state, and maps recycled content mandate coverage across every applicable non food packaging category. Regional chapters cover all seven regions, with non domestic shares assessed as equipment supply and regulatory comparison rather than demand. Competitive profiling covers 20 participants on one consistent tonnage handled basis.
Five container formats sized independently through 2036
Collection cost modelled by route type and density
Producer responsibility fee schedules compared state by state
Recycled content mandate coverage mapped by packaging category
Reconditioning diversion assessed separately from waste collection
Twenty participants profiled on one consistent tonnage basis
Built For The People Who Decide
From boardroom strategy to bench-side execution, this report is read cover-to-cover by leaders shaping the next decade of their industry, turning demand scenarios, market dynamics and valuation benchmarks into decisions.
CXOs/ Presidents/ VPs/ Managers
M&A and Corporate Development
Strategy Teams and R&D Heads
Procurement and Product Directors
Regulatory and Compliance Leaders
Investor Relations and Equity Analysts