Market Minds Advisory
USA Electronic Health Records Market

USA Electronic Health Records Market: Module Attachment, Ambient Documentation and the Economics of an Installed Base

Adoption passed 96% of American hospitals years ago, so nobody is buying a first record system, and the only open door into these accounts turned out to run through clinical leadership rather than technology.

Lead Analyst

Alice Ballenger

Published

September 2026

Make Smarter Decisions with Customized Research Insights

Request a free sample report and evaluate market opportunities, growth trends, and competitive dynamics relevant to your business needs.

2025 MARKET VALUE$17.4BMarket Size 2025
2036 FORECAST VALUE$38.9BBase Case , 2026 to 2036
CAGR 2026 TO 20367.6 %Bull 8.8% / Bear 6.4%
INCREMENTAL OPPORTUNITY$20.2BNet 10- year value creation
EXPANSION MULTIPLE2.08x2036 value over 2026 base
Strategic Levers
M&A Pipeline
Regional Outlook
Country Rankings
Competitive Intelligence
Segmental Deep-dive
Call-Us : 91 93563 13602

Executive Snapshot and Market Trajectory

Nobody is buying their first electronic health record in the United States any more. Adoption passed 96% of acute care hospitals years ago, and the ranking of vendors was settled by federal incentive money distributed a decade ago. This market grows by selling more to people who already bought.
Module expansion into the installed base carries almost all of the growth. Ambient documentation tools that draft the clinical note from the consultation itself are the fastest growing segment at 11.4%, half again the market rate of 7.6%, and they are the first credible answer to a workload problem physicians have complained about for twenty years. Interoperability modules follow at 9.8% on federal data exchange requirements.
Concentration is high: the top five hold 74% of provider organisations under contract, and the two largest have split the large health system market between them for years. Replacement happens roughly every fourteen years and costs a multiple of the licence value, which deters everyone. The genuinely open door is ambient documentation, because it sells to a chief medical officer worried about burnout rather than to an IT department defending an architecture.
Market Definition
Electronic health record software and associated modules licensed or subscribed by United States healthcare providers, covering core clinical documentation and order entry, interoperability and data exchange, clinical decision support and analytics, ambient documentation and language tools, patient access and portal modules, and specialty clinical workflow modules. Measured at vendor selling value. Standalone revenue cycle management, medical imaging systems, claims clearinghouses and practice financial software are excluded.
Base Year Value
$17.4B in 2025 (MMA Primary Research Dataset, August 2026)
Forecast Period
2026 to 2036, eleven discrete annual values
CAGR
7.6% base case. Bull 8.8%. Bear 6.4%.
Fastest Growth Segment
Ambient Documentation and Language Tools: 11.4% CAGR
Fastest Growth Country
Texas: 9.8% CAGR
Fastest Growth Region
South Asia and Pacific: 9.8% CAGR
Largest Region
North America: 91% of 2025 global value
Market Leaders
Epic Systems, Oracle Health, MEDITECH, Veradigm, eClinicalWorks. Source: MMA Primary Research Dataset, July 2026.
Primary Survey
n=3,800 procurement and R&D decision-makers, Q4 2025, six countries
Methodology
Demand-side build-up, cross-validated against public data, 47 expert interviews

USA Electronic Health Records Market Forecast Scenarios

usa-electronic-health-records-market-size-forecast-scenario-1787641172639
The period from 2020 to 2025 was defined by consolidation among buyers rather than by anything vendors did. Hospital acquisition activity continued at pace, and every acquisition eventually forces a platform decision that the acquiring system's incumbent usually wins by default. Telehealth modules arrived and then settled back into the record. The 6.4% historical rate is mostly module attachment and price escalation on renewal.
The 7.6% base case rests on three mechanisms. Ambient documentation attaches to the installed base at a per physician price with almost no implementation friction, which is a genuinely new revenue line rather than a reallocation. Federal information blocking rules and the TEFCA exchange framework require data sharing capability that most providers buy from their record vendor rather than build. And ambulatory consolidation continues, with independent practices joining health systems and migrating onto the acquiring system's platform.
The 8.8% bull case turns on ambient documentation reaching majority physician adoption faster than expected, since the per seat economics compound quickly across a large medical group. The 6.4% bear case is health system operating margin: providers under financial pressure defer module purchases first, and several large systems have already pushed optional spending out by a year or more.

Selling More to Customers Who Already Bought

The federal incentive programme that drove adoption also decided the competitive outcome, and nothing since has disturbed it. Health systems that selected a platform under those incentives are still on it, because replacement costs roughly 2.4 times the first year licence value. Fourteen years is a typical interval between platform decisions. Sales cycles here look nothing like software sales elsewhere.
TOP FIVE CONCENTRATION74%Share of provider organisations served by leading vendors
HOSPITAL ADOPTION RATE96%Acute care hospitals operating a certified electronic record
DOCUMENTATION TIME RATIO1.8xRecord time spent for every hour of patient contact
REPLACEMENT CYCLE LENGTH14 yearsTypical interval before a health system replaces its platform
SUBSCRIPTION REVENUE SHARE68%Portion of vendor revenue arriving through recurring subscription
IMPLEMENTATION COST MULTIPLE2.4xTotal programme cost against first year licence value
Revenue accordingly comes from the installed base. Roughly 68% of vendor revenue is recurring subscription, and the growth line is module attachment: interoperability, analytics, patient access, specialty workflow and now ambient documentation. Each module sells against a problem the core platform created or failed to solve. That is an uncomfortable description of the business model and it is also an accurate one, as every buyer understands.
The documentation burden is the one problem large enough to change purchasing behaviour. Physicians spend roughly 1.8 hours in the record for every hour of patient contact, and it is the most cited cause of clinical burnout. Ambient tools that draft the note from the conversation itself are the first credible response in two decades. They also sell to a different buyer entirely, which is why incumbents did not see the entrants coming.
"The incumbents did not lose the ambient documentation category to better technology. They lost it because they were selling to the wrong person, and a chief medical officer who has watched physicians quit does not care what the architecture looks like."
Director, Healthcare Technology and Provider Systems Practice · MMA Healthcare Technology Practice · August 2026

Market Trends

Ambient Documentation Enters Through the Clinical Front Door

Tools that listen to the consultation and draft the clinical note arrived commercially in 2023 and reached meaningful physician adoption within two years, which is unheard of in this market. Growth runs at 11.4%, half again the market rate of 7.6%. The commercial mechanism matters more than the technology: these products sell per physician per month to a chief medical officer measuring burnout and turnover, not to an IT function evaluating an architecture. Implementation takes days rather than the eighteen months a platform decision consumes, so the usual switching friction never applies at all.
Market Impact: Addresses 1.8 hours of daily documentation
Federal Exchange Rules Convert Interoperability Into Purchasing

Information blocking provisions and the TEFCA exchange framework turned data sharing from a voluntary capability into a compliance obligation with enforcement behind it. Most providers buy that capability from their record vendor rather than building it, because integration with the existing platform is where the difficulty actually lives. Interoperability modules grow at 9.8% on this mechanism, second fastest in the market. The requirement is unusual in that it applies regardless of whether any individual provider sees clinical value in it, which makes the revenue notably predictable. Compliance deadlines set the purchasing calendar.
Market Impact: Transfers 12,000 physician seats annually

Market Opportunities and Growth Drivers

Physician Burnout Turns Documentation Into a Board Issue

Physicians spend roughly 1.8 hours in the electronic record for every hour of patient contact, and a meaningful share of that happens outside clinic hours. Health systems losing clinicians to burnout face replacement costs running to several hundred thousand dollars per physician, which is a number chief financial officers understand without translation. That reframes documentation software from an IT expense into a retention investment, and it moves the purchase decision to a committee that was previously not involved. Vendors selling on efficiency arguments underperform those selling on turnover. That gap is widening.
Market Impact: Costs 2.4 times licence value

Provider Consolidation Migrates Practices Onto Acquiring Platforms

Health systems continue acquiring physician practices and smaller hospitals, and every acquisition eventually forces a record platform decision that the acquirer's incumbent vendor usually wins without competing. Independent practice numbers have fallen for a decade, and each migration transfers seats from a small ambulatory vendor to a large enterprise one. This is the quiet mechanism behind concentration in a market where nobody is running competitive replacements. Small vendors lose customers they did nothing wrong to lose, and the enterprise vendors gain seats without a sales cycle at all. Consolidation does the selling.
Market Impact: Delays 30% of module purchases

Market Restraints and Challenges

Replacement Economics Freeze the Competitive Ranking

Replacing a health system record platform costs roughly 2.4 times the first year licence value once implementation, training, data migration and lost clinical productivity are counted, and the programme runs eighteen months or more. The root cause is that the record is not a system but a set of configured clinical workflows built over a decade by people who have since left. Boards rarely approve that risk without a failure to point at. The practical response from challengers is to stop attempting replacement entirely and sell modules alongside the incumbent instead.
Market Impact: Grows 11.4% from a standing start

Health System Margins Defer Optional Module Spending

Provider operating margins have been thin since labour costs reset, and record vendors sit in the discretionary half of the technology budget once the core contract is signed. Modules get deferred first, because nothing breaks when they do. The root cause is that most module value is measured in clinician time rather than in cash, and time savings do not appear in an operating statement anybody can point to. Vendors are responding with outcome linked pricing and with per physician monthly terms that avoid a capital approval entirely, which works better than discounting.
Market Impact: Interoperability modules grow 9.8% annually
3 additional market trends, 4 additional growth drivers, and 2 additional restraints and challenges are covered in the full report. Contact sales@marketmindsadvisory.com to access the complete intelligence.

Segment CAGR and Growth Architecture

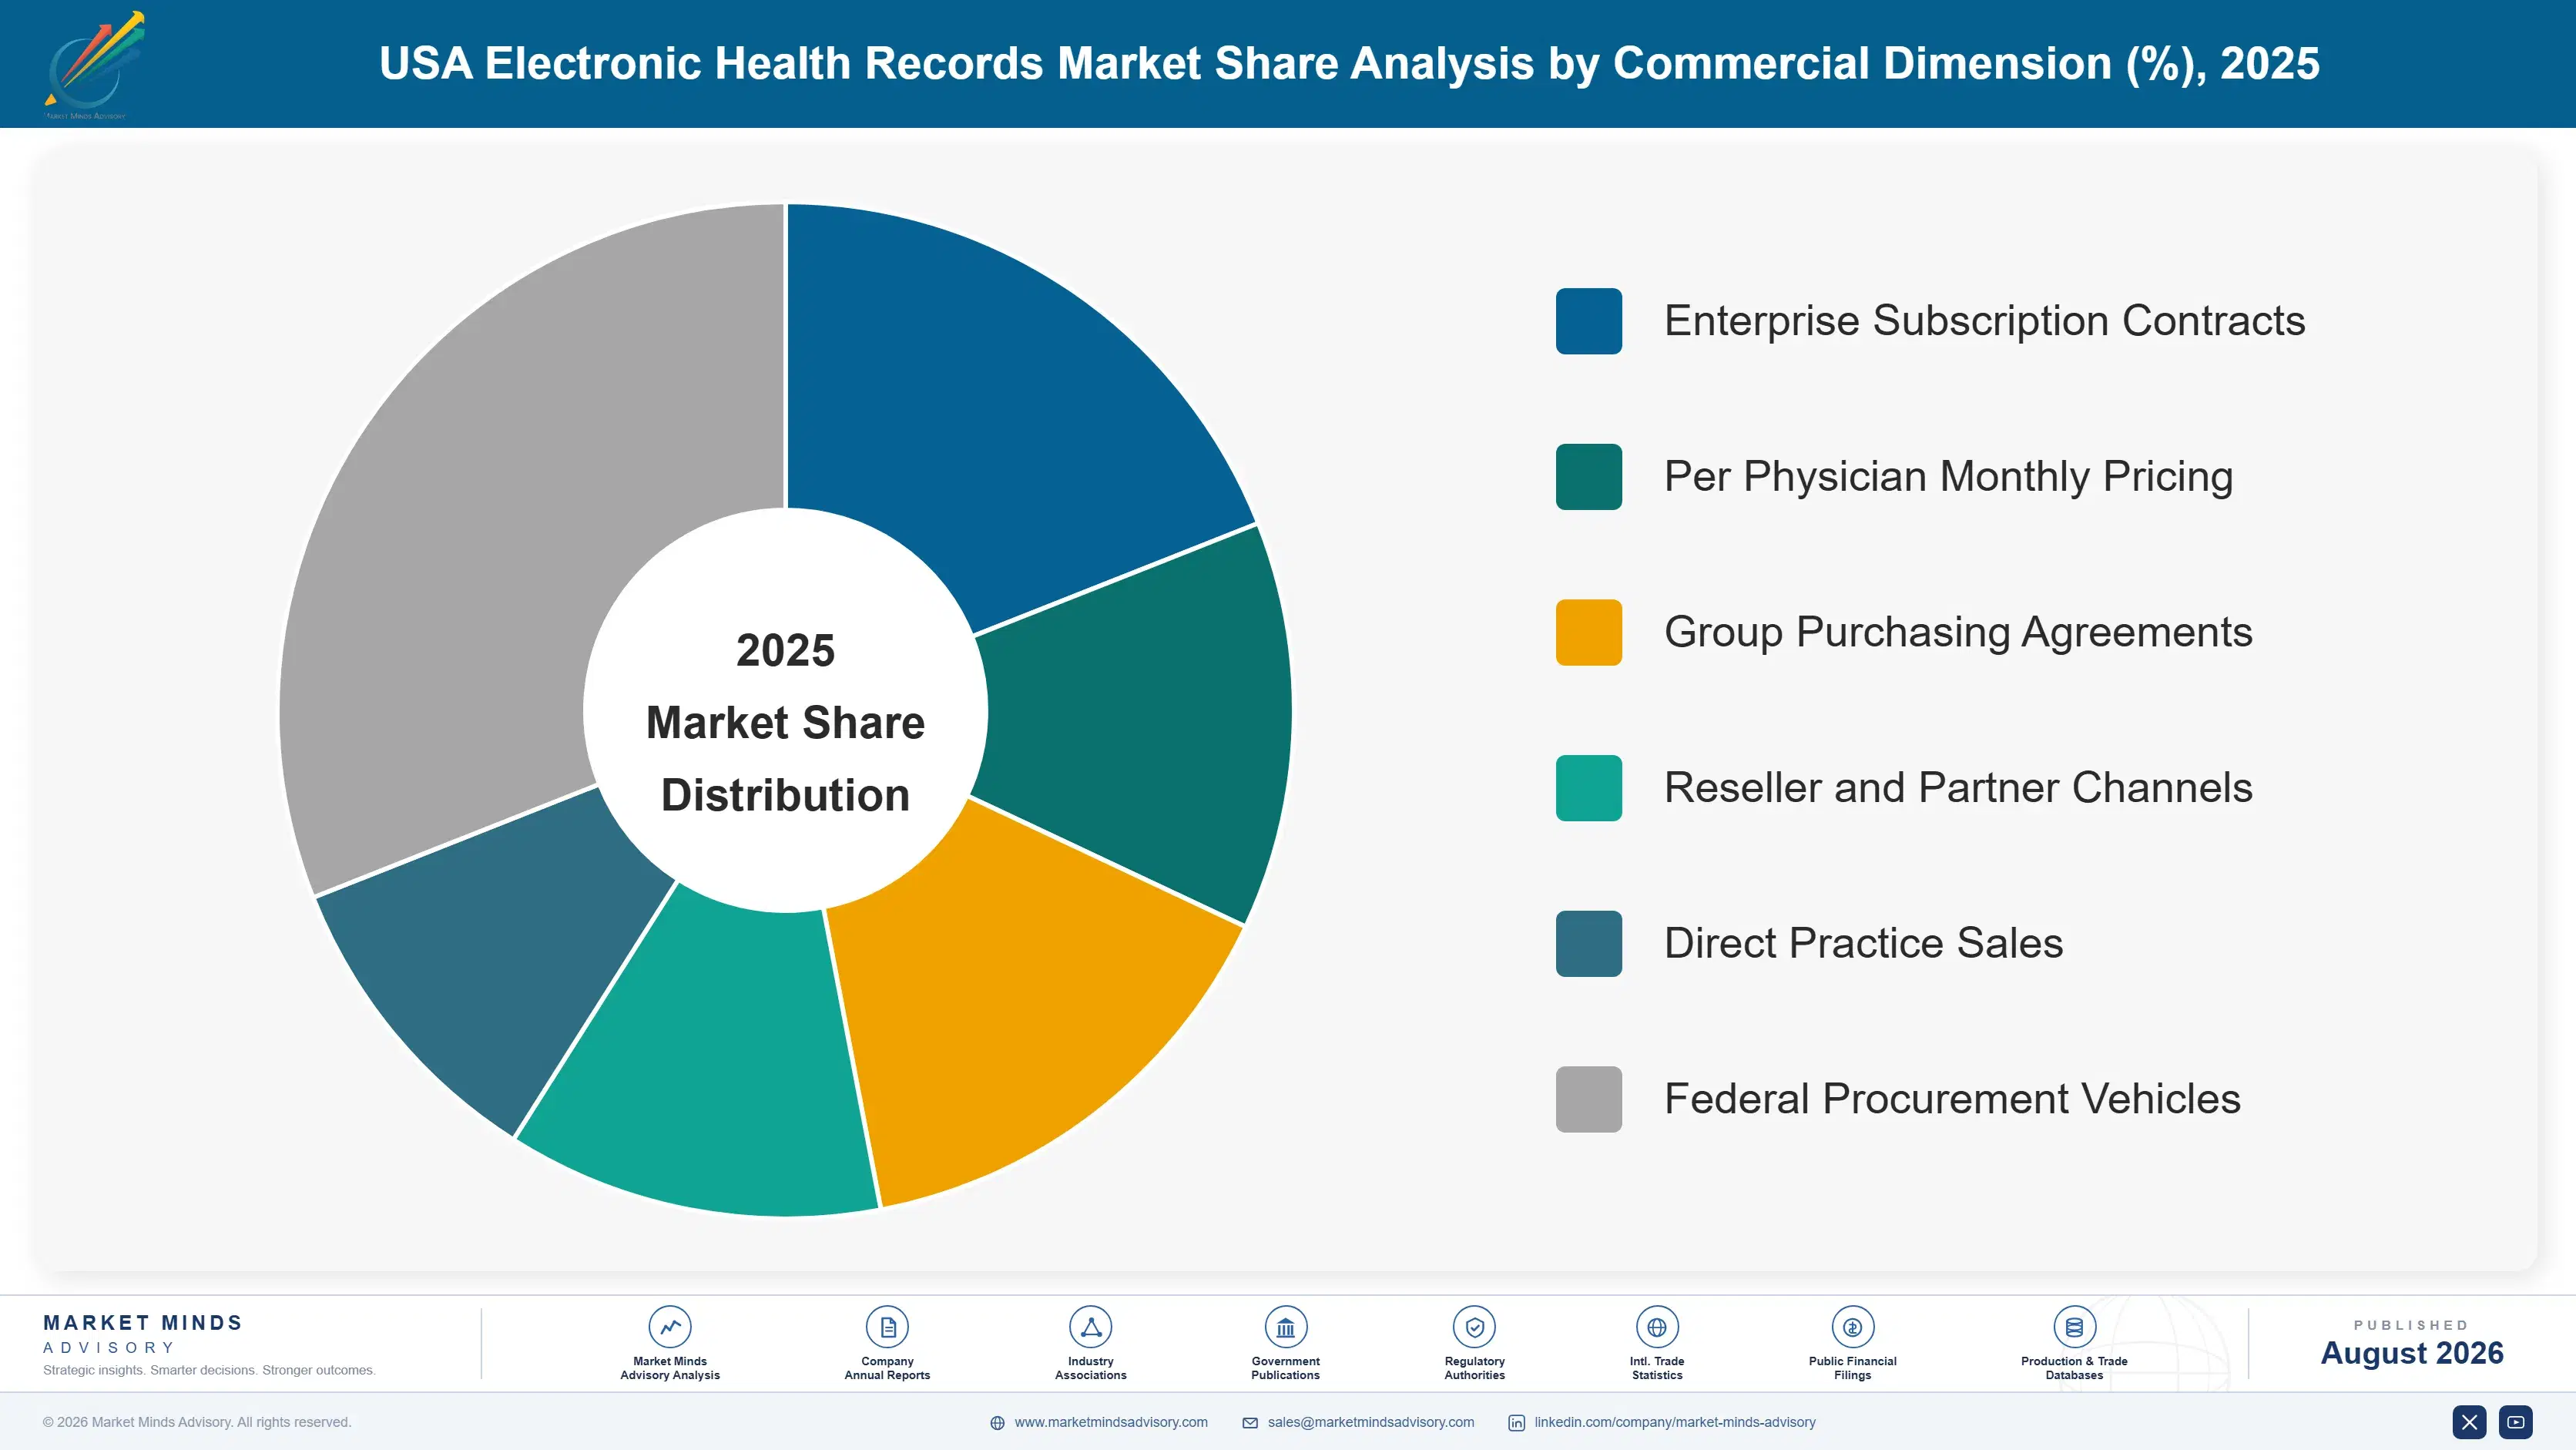
Segmentation follows software module type, since that is how the market is actually bought: a core platform decided once, then capability added to it year after year. Six module types cover the field, from clinical documentation and order entry through to ambient language tools. Growth sits almost entirely outside the core, which is the whole commercial story here.
usa-electronic-health-records-market-market-share-analysis-1787641173292

Ambient Documentation and Language Tools

Software that captures the clinical conversation and produces a draft note, order set and coding suggestion without the physician typing during the encounter. At 11.4% this is the fastest growing module type in the market, half again the market rate of 7.6%, and it went from commercial launch to meaningful adoption inside two years. The reason is commercial rather than technical: it is priced per physician per month, deploys in days, and sells to a chief medical officer measuring turnover instead of to an IT function defending an architecture. Incumbent vendors now bundle competing capability, but the entrants established position first and physician preference is proving unusually sticky. Nobody wants to go back to typing.
CAGR 11.4%

Interoperability and Data Exchange

Modules handling record exchange with outside organisations, participation in national exchange frameworks, and the application programming interfaces federal rules require providers to expose. Growth of 9.8% is second fastest in the market, and it is compliance driven rather than clinically driven, which makes it unusually predictable revenue. Information blocking enforcement and the TEFCA framework converted this from a voluntary capability into an obligation with penalties attached. Providers overwhelmingly buy from their record vendor rather than a specialist, because the integration work is the hard part and the vendor already owns the data model. That dynamic protects incumbents in a category they did not create and initially resisted building. Regulation handed them the revenue.
CAGR 9.8%
Full segment breakdown across 6 segments available in the complete report.

Regional Architecture and Country Demand Map

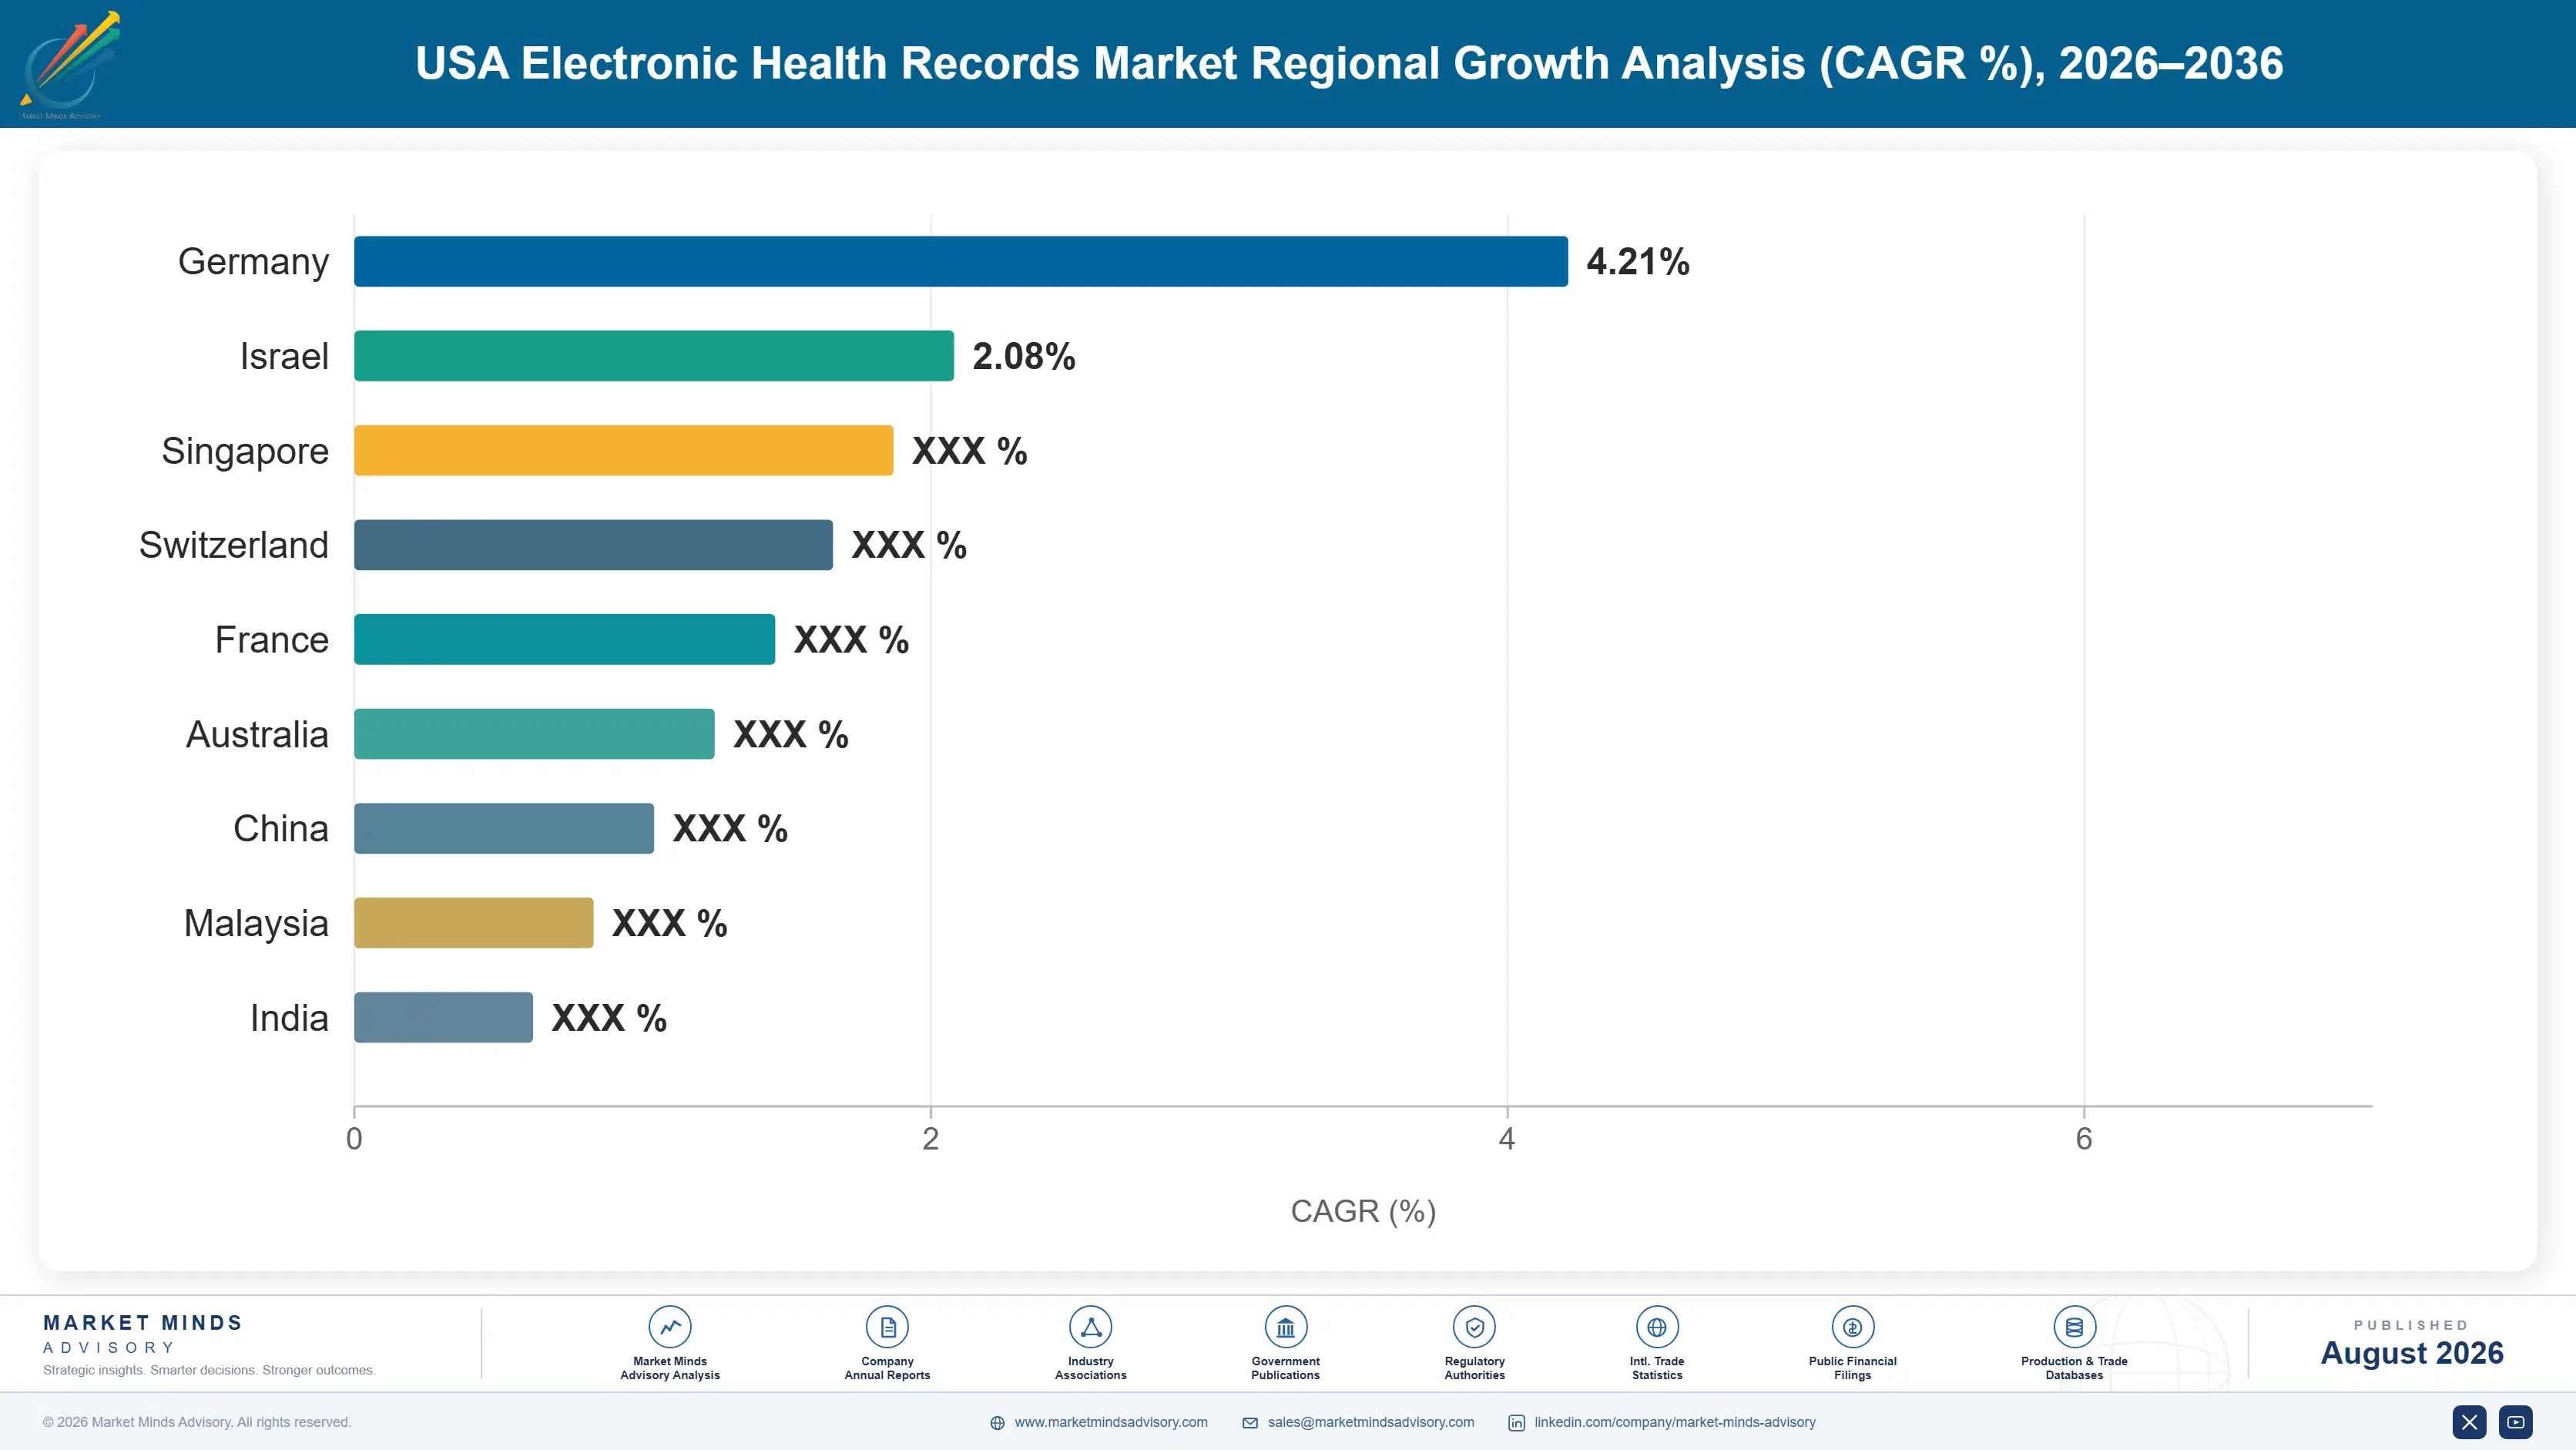
North America holds 91% of the market by definition, since scope covers United States provider spending. The remaining shares reflect vendor operations and comparable regulatory developments abroad rather than consumption. Texas, Florida and the Southeast carry the fastest domestic growth on physician employment. Concentration is highest in the Northeast.

North America

Scope sets this position rather than any commercial dynamic: the market covers United States provider spending, so North America carries 91% by construction and the remaining shares represent vendor operations elsewhere rather than demand. Within the United States, the largest health systems in the Northeast and Midwest were the earliest enterprise platform adopters and now buy modules rather than platforms. Texas, Florida and the Southeast grow fastest, driven by physician employment and by health system expansion into new markets. California carries high volume and unusually strict state privacy requirements that add configuration work. Canadian provincial health authorities buy centrally and sit outside the defined scope entirely. Rural critical access hospitals remain a distinct buying population.
Share: 91% | CAGR: 7.6% (2026 to 2036)

Western Europe

European activity appears here only as vendor operations and as a regulatory comparison, which is why the share sits at 2% against a band that assumes consumption. The largest American enterprise vendors have won substantial hospital contracts across Denmark, the Netherlands, Finland and the United Kingdom, and those programmes have produced public implementation difficulties that American buyers read carefully before signing anything. European data protection requirements also shape product architecture that American providers then inherit. National procurement in Europe moves slowly and awards infrequently. Growth of 6.0% reflects mature European adoption rather than anything happening inside the defined United States scope. Implementation reputation travels back across the Atlantic quickly enough to matter.
Share: 2% | CAGR: 6.0% (2026 to 2036)
Regional intelligence for 5 additional markets available in the complete report: East Asia, South Asia and Pacific, Latin America, Middle East and Africa, Eastern Europe. Contact sales@marketmindsadvisory.com.
usa-electronic-health-records-market-country-cagr-analysis-1787641173838

Where Growth Comes From Now

Nobody wins a new logo in this market, because there are no new buyers left. Value accrues to whoever attaches another module to an installed base, whoever sells to a clinical buyer instead of an IT one, and whoever captures seats that consolidation moves. Four routes carry weight, and none of them involves a competitive replacement.

Sell to the Chief Medical Officer Instead

Ambient documentation grows at 11.4% against a market rate of 7.6%, and the reason is that it bypasses the IT function entirely. Physicians spend roughly 1.8 hours in the record for every hour of patient contact, and a chief medical officer watching clinicians leave will approve a per physician monthly subscription that an IT committee would spend a year evaluating. Deployment takes days. Vendors that built a clinical sales motion have taken position in this category ahead of incumbents with far larger installed bases. The buying centre is the product decision here.
Market Impact: Reaches 11.4% growth without any IT sale involved

Attach Compliance Modules Where Refusal Is Not an Option

Interoperability modules grow at 9.8% because information blocking rules and the TEFCA framework made data exchange an obligation with enforcement behind it, not a capability providers weigh on clinical merit. A module that a customer legally cannot decline has a conversion rate no clinical product matches. Record vendors capture most of this because integration with the existing data model is the difficult part and they already own it. The commercial discipline is timing the release against compliance deadlines rather than against any product roadmap. Regulation effectively writes the annual sales forecast.
Market Impact: Converts the 9.8% growth from a compliance obligation

Follow Provider Consolidation Into Acquired Practices

Health systems acquire practices continuously, and each acquisition transfers roughly 12,000 physician seats a year across the market from small ambulatory vendors to enterprise platforms. The acquiring system's incumbent wins those seats without competing, provided it can migrate a practice quickly and cheaply enough that the system does not consider alternatives. Vendors that industrialised practice migration, with fixed price packages and standard configurations, capture this revenue at a fraction of the usual implementation cost. Those that treat each migration as a project lose money on seats they already won. Migration cost is the entire margin question.
Market Impact: Captures the roughly 12,000 physician seats transferred each year

Price Monthly to Avoid Capital Approval Entirely

Provider operating margins are thin and modules get deferred first, because nothing breaks when they do. Roughly 30% of module purchases slip at least a year in the current environment. A per physician monthly price that sits inside an operating budget avoids the capital approval process that kills deferrable spending, and it converts a deferred decision into a small recurring one. Vendors that restructured commercial terms this way have held attach rates while competitors discounted, and discounting resets the renewal price permanently while monthly terms do not. That difference compounds across a decade.
Market Impact: Recovers the 30% of currently deferred module spending

Who Controls the Margin Pool

Concentration is high and unusually stable. The top five hold 74% of provider organisations under contract, measured with annual subscription and licence revenue, the basis applied consistently here. Epic Systems leads large health systems by a wide margin and Oracle Health holds most of the remainder, with the gap between them determined by decisions taken a decade ago rather than by anything currently happening.
Competition runs almost entirely inside accounts rather than between them. Enterprise vendors compete for module attachment against specialist point solutions that integrate with their platform. Ambulatory vendors compete for independent practices in a customer base that shrinks every year through acquisition. Ambient documentation is the one genuinely contested category, and it is contested by companies that did not exist when the platform decisions were made.

Rankings will not move at the platform level and everyone in the market knows it. Where position shifts is in the module layer, and the question is whether specialists building clinical language products stay independent or get absorbed. Several have already been acquired. The other pressure point is the ambulatory tier, where consolidation removes customers faster than any vendor can win them, and consolidation among small vendors is the predictable response.
usa-electronic-health-records-market-company-positioning-matrix-1787641174375

Competitive Moat and Risk Dimensions

EPIC SYSTEMS

Moat: Configured Workflow Lock-In

What a health system runs is not a product but a decade of configured clinical workflows, order sets and reporting built by staff who have mostly moved on. Replacing that costs roughly 2.4 times the first year licence value and takes eighteen months, which is why competitive replacements are rare enough to be individually newsworthy.
EPIC SYSTEMS

Risk: Clinical Module Displacement

Ambient documentation was taken by companies that did not exist when the platform decisions were made, and they took it by selling to clinical leadership rather than to IT. Growing at 11.4%, that category demonstrates a route into the account that does not require displacing the platform. More such categories will follow the same path.
ORACLE HEALTH

Moat: Federal Contract Position

Large federal health programmes represent contracted commitments running many years and considerable annual value, and they are effectively impossible to displace inside a political cycle. That base funds product development at a scale smaller competitors cannot match, and it provides reference credibility with large public health systems evaluating enterprise platforms elsewhere. The commitment cuts both ways.
ORACLE HEALTH

Risk: Implementation Reputation Damage

Public difficulties on large federal and international programmes have been documented in detail, and health system boards read that material before signing anything. In a market where replacement decisions occur roughly every fourteen years, a reputation formed during one programme can suppress consideration through an entire cycle. Recovery requires visible delivery success rather than product improvement.

Players Tracked

Prominent Players

Epic Systems
Oracle Health
MEDITECH
Veradigm
eClinicalWorks

Other Key Players

athenahealth
NextGen Healthcare
TruBridge
Greenway Health
Netsmart Technologies
PointClickCare
WellSky
Modernizing Medicine
Elation Health
Canvas Medical
Praxis EMR
DrChrono
AdvancedMD
Tebra
Harris Healthcare

Recent Developments

MARCH 2025

Enterprise record vendor bundles ambient documentation into platform

A major enterprise record vendor made ambient clinical documentation available as an integrated platform capability rather than a third party add-on, priced within existing subscription terms for participating health systems. The move responded directly to specialist vendors that had established physician preference in the category over the preceding two years.
Signal: Bundling arrives once a specialist category proves itself, and it usually arrives later than the incumbent intended
JUNE 2025

Federal enforcement action targets information blocking practices

Federal regulators pursued enforcement under information blocking provisions against providers and technology suppliers restricting electronic health information exchange. The action confirmed that data sharing obligations carry practical consequence rather than remaining aspirational, and interoperability module enquiries rose noticeably across the vendor community in the following quarter.
Signal: Enforcement converts a written requirement into a purchase order faster than any product demonstration ever does
SEPTEMBER 2025

Health system consolidation moves large physician group onto enterprise platform

A multi-state health system completed a physician group acquisition and announced migration of the acquired practices onto its existing enterprise record platform, retiring the ambulatory system those practices had used. The incumbent vendor gained several thousand seats without competing for a single one of them.
Signal: Provider consolidation is doing more to redistribute market share than any competitive selling effort currently is

What Delivery Actually Costs a Vendor

This is a labour business almost entirely. Engineering, implementation consulting and customer support headcount account for roughly 62% of cost of goods across the vendor community, mostly domestic for enterprise vendors and offshore for the ambulatory tier. Cloud infrastructure adds a further 18% as hosting shifts from customer data centres to vendor managed environments, and that share is rising every year.
Health technology wage inflation was the defining cost event of the period. Competition for clinical informatics and healthcare software engineering talent pushed compensation up sharply through 2021 and 2022, and company annual reports documented the margin effect. Implementation consultants proved hardest to hold, because the skills transfer directly to health system employment at higher pay. Cloud infrastructure costs moved the other way, falling per unit while total consumption rose faster.

Exposure divides by delivery model rather than by size. Vendors delivering implementation with domestic consultants carry the full wage bill and cannot price it away, since implementation is quoted as a fixed programme cost against a licence value the customer already knows. Those that industrialised delivery through offshore centres and standard configurations carry a materially lower cost per programme. Ambulatory vendors selling to small practices have the thinnest room.
usa-electronic-health-records-market-cost-volatility-analysis-1787641174583

Industrialise implementation with standard configurations

Vendors that replaced bespoke implementation with fixed price packages and pre-built clinical configurations cut delivery cost per programme substantially, and they deliver faster. The constraint is that health systems believe their workflows are unique, and persuading them otherwise is a commercial exercise rather than a technical one. It works better with acquired practices than with flagship accounts.

Move delivery capacity offshore and nearshore

Indian technology centres now carry a large share of configuration, testing and support work for American record vendors, and nearshore centres in Mexico and Colombia handle work requiring time zone overlap with clinical operations. The saving is substantial and the risk is that health system customers increasingly ask where their implementation team sits. Contractual transparency has become standard practice.

Shift hosting to vendor managed cloud environments

Moving customers from on-premises deployment to vendor managed hosting removes the support burden of maintaining thousands of individually configured environments, where a disproportionate share of engineering cost has always gone. Customers accept because their own infrastructure staffing is under equal pressure. Unit infrastructure costs fall while consumption rises, so the saving comes from support headcount, not infrastructure spend.

Portfolio Architecture for Margin Defence

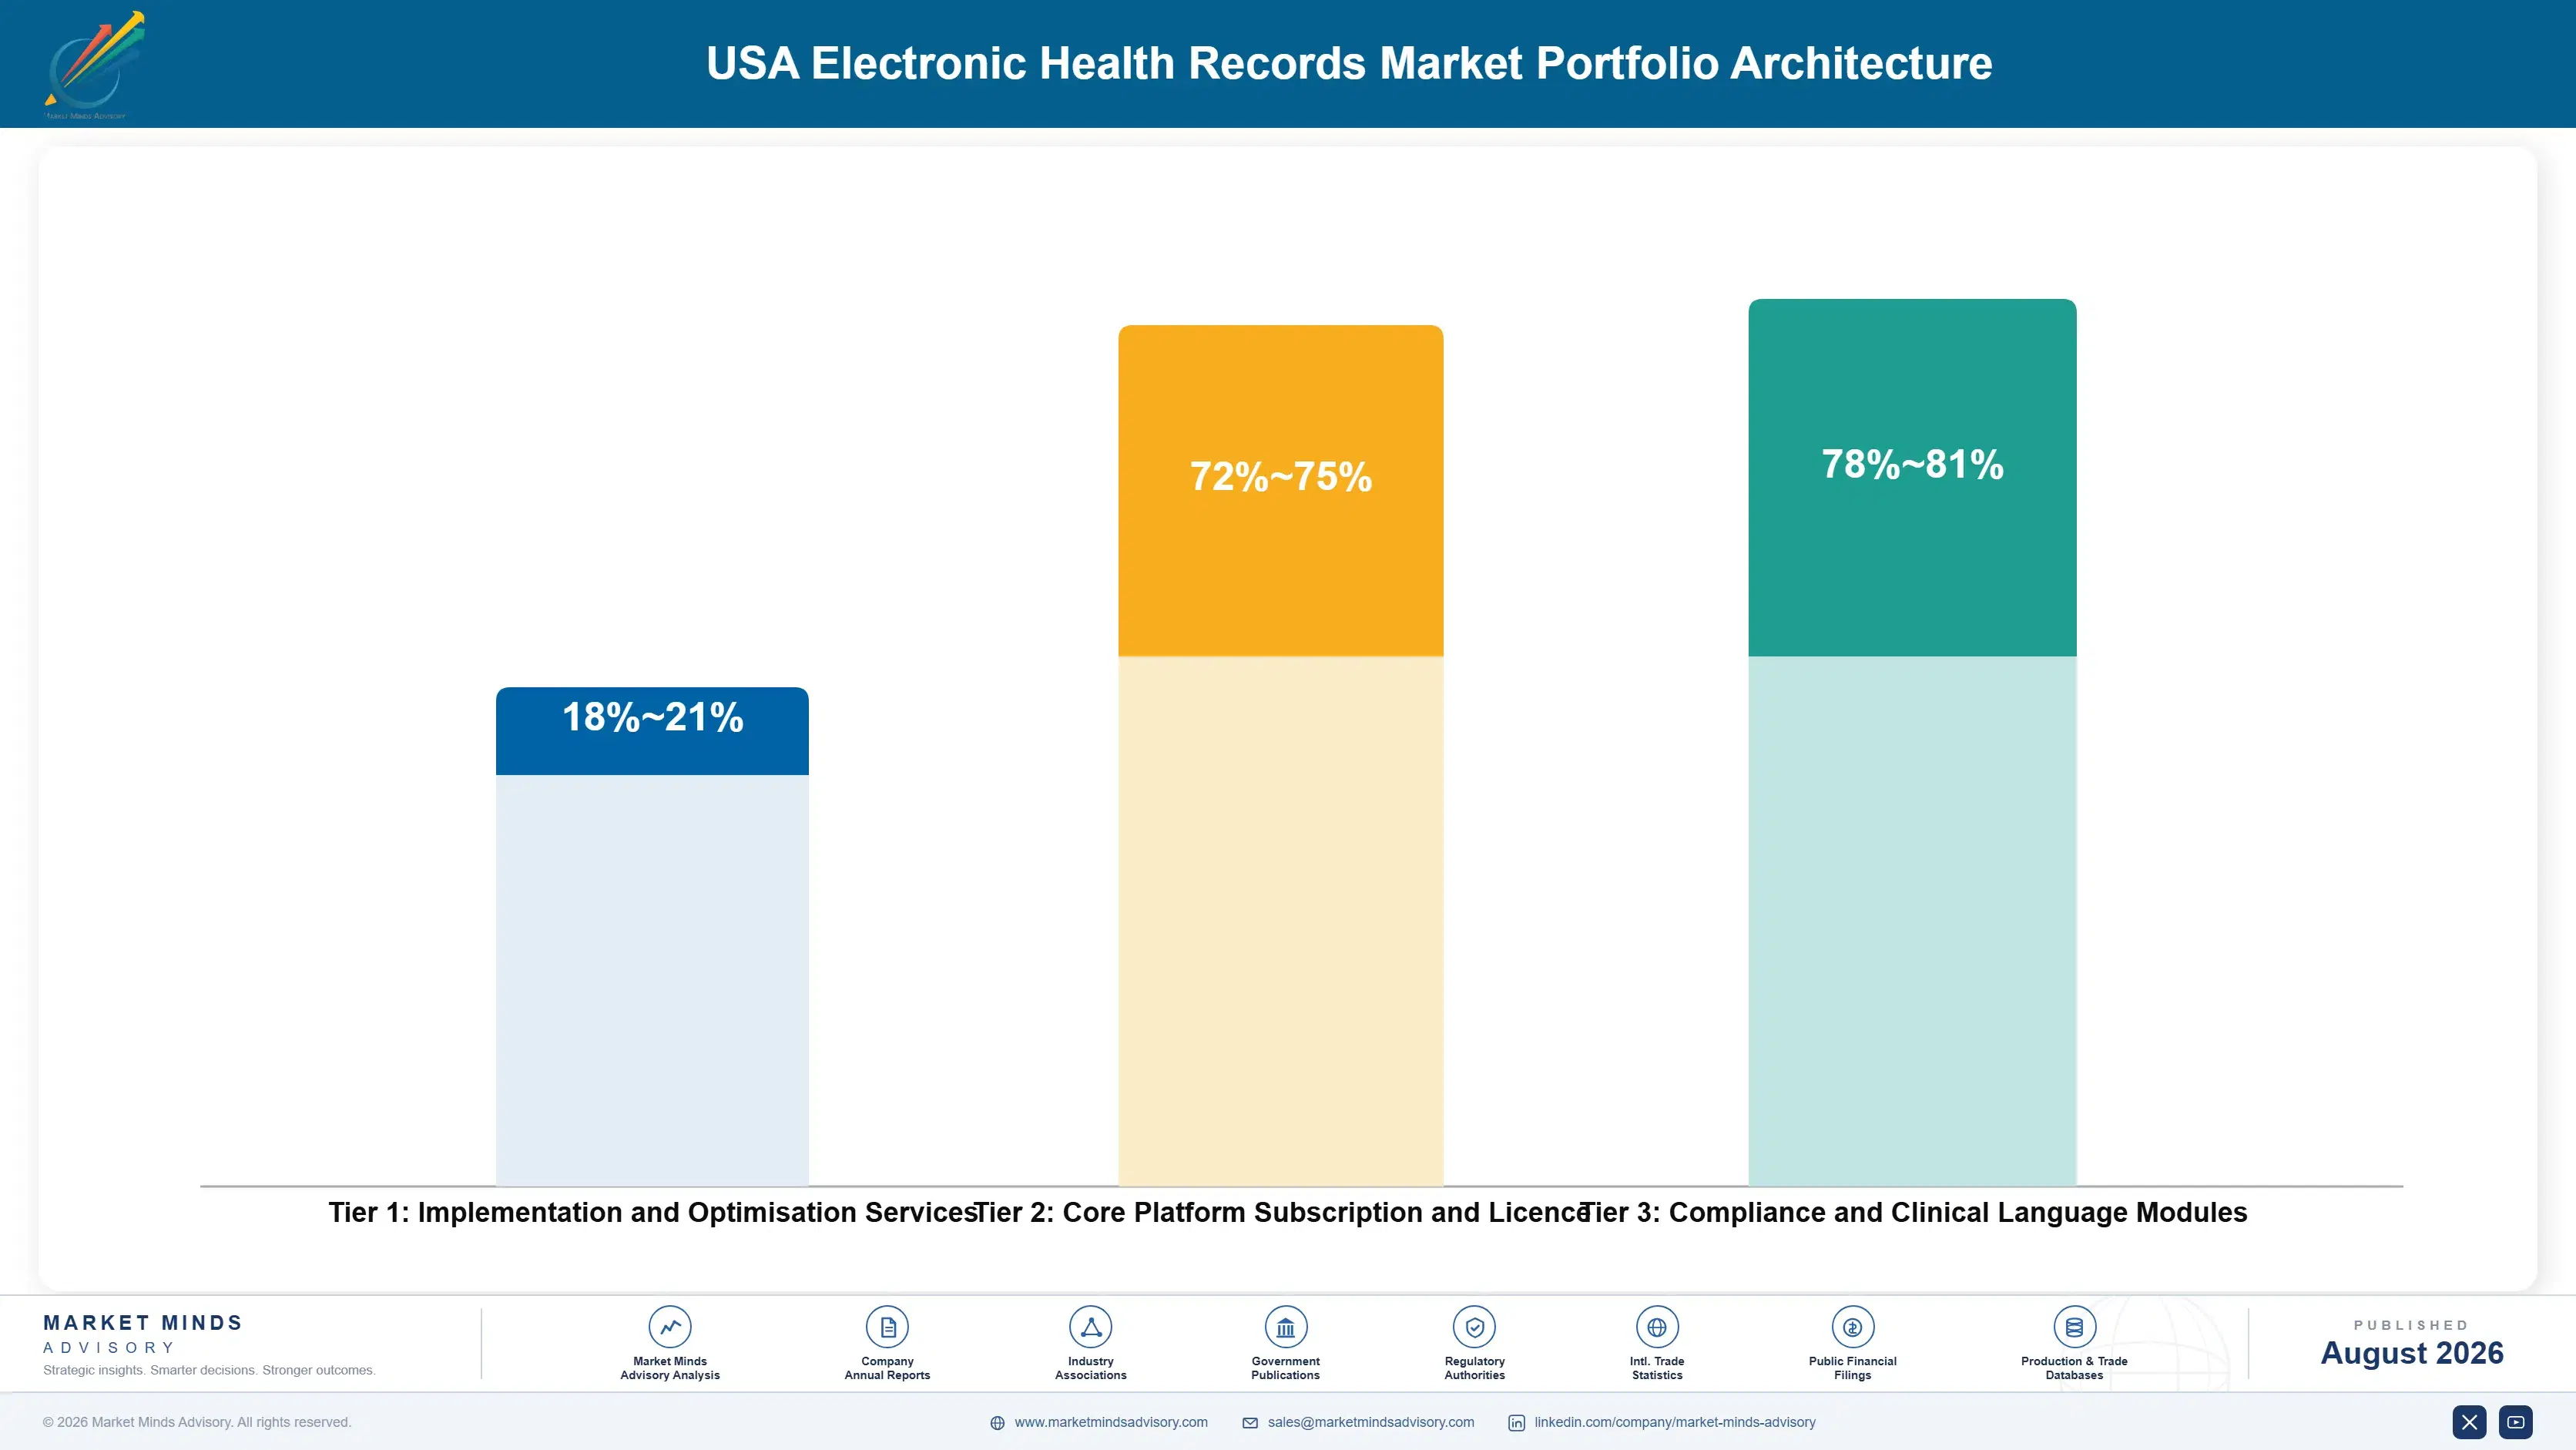
Margin architecture here follows how much human delivery a product requires. Core platform licence and subscription carries excellent gross margin once implemented, but the implementation itself is close to break even. Modules that deploy without configuration earn the best economics in the market, which is exactly why ambient documentation attracted so many entrants. Implementation and optimisation services sit at the bottom, sold to keep the relationship rather than to earn.
The tension is that the highest margin products are the easiest to attack. A module that deploys in days and prices per physician per month has no switching cost protecting it, which is what let entrants take ambient documentation from vendors with vastly larger installed bases. The core platform has the opposite profile: mediocre incremental economics and an almost impregnable position. Nobody gets both at once.

High value pools concentrate in compliance driven modules, where the customer cannot decline and the vendor already owns the integration, and in clinical modules that reach a buyer the IT function does not control. Everything else is either commodity infrastructure or delivery labour. A portfolio weighted toward implementation services is a portfolio weighted toward wage inflation, which is not a position anyone chose deliberately.

Implementation and Optimisation Services

Consulting delivery quoted as a fixed programme cost against a licence value the customer already knows, staffed by people whose skills transfer directly to health system employment. Margin depends entirely on how far delivery has been industrialised.
Gross Margin: 18-21%

Core Platform Subscription and Licence

Recurring platform revenue from an installed base with a fourteen year replacement interval and switching costs at 2.4 times first year licence value. Economics are excellent once implemented and the position is close to unassailable.
Gross Margin: 72-75%

Compliance and Clinical Language Modules

Interoperability capability the customer legally cannot decline, and ambient documentation priced per physician per month with no configuration required. Best economics in the market and the least protected, since neither carries meaningful switching friction.
Gross Margin: 78-81%
usa-electronic-health-records-market-portfolio-architecture-1787641175117

High-value Sub-segments and Strategic Watch-out

Ambient Documentation and Language Tools

The fastest growing module at 11.4% and the only category where a non-incumbent has taken meaningful position in a decade. It sells to clinical leadership rather than IT, deploys in days, and consolidation is already underway among the specialists that built it. Physician preference is proving sticky.
Gross Margin: 78-81%

Interoperability and Data Exchange

Second fastest at 9.8%, and the only module in this market a customer legally cannot decline once enforcement applies. Record vendors capture nearly all of it because integration with the existing data model is the difficult part and they already own that. Compliance deadlines set the calendar.
Gross Margin: 76-79%

Core Clinical Documentation and Order Entry

The revenue core, growing at only 4.2% because every hospital already has one and replacement happens roughly every fourteen years. Defending it requires nothing more than avoiding a visible failure, which is a peculiar competitive position to occupy for a decade. Growth has to come from elsewhere entirely.
Gross Margin: 72-75%

Patient Access and Portal Modules

Growing at 6.2% and increasingly contested by consumer health technology companies that build better interfaces and have no clinical data to integrate. Providers buy from their record vendor for integration reasons alone, which is a defence that erodes as exchange standards improve. That erosion has already started.
Gross Margin: 68-71%

How Provider Spending Repeats Annually

Almost all revenue here recurs by design. A platform decision made once produces subscription, hosting, support and module revenue every year for roughly fourteen years, and 68% of vendor revenue is recurring subscription. The initial licence is close to irrelevant against what follows. That structure makes vendor revenue unusually predictable and makes the customer relationship almost impossible to disturb from outside.
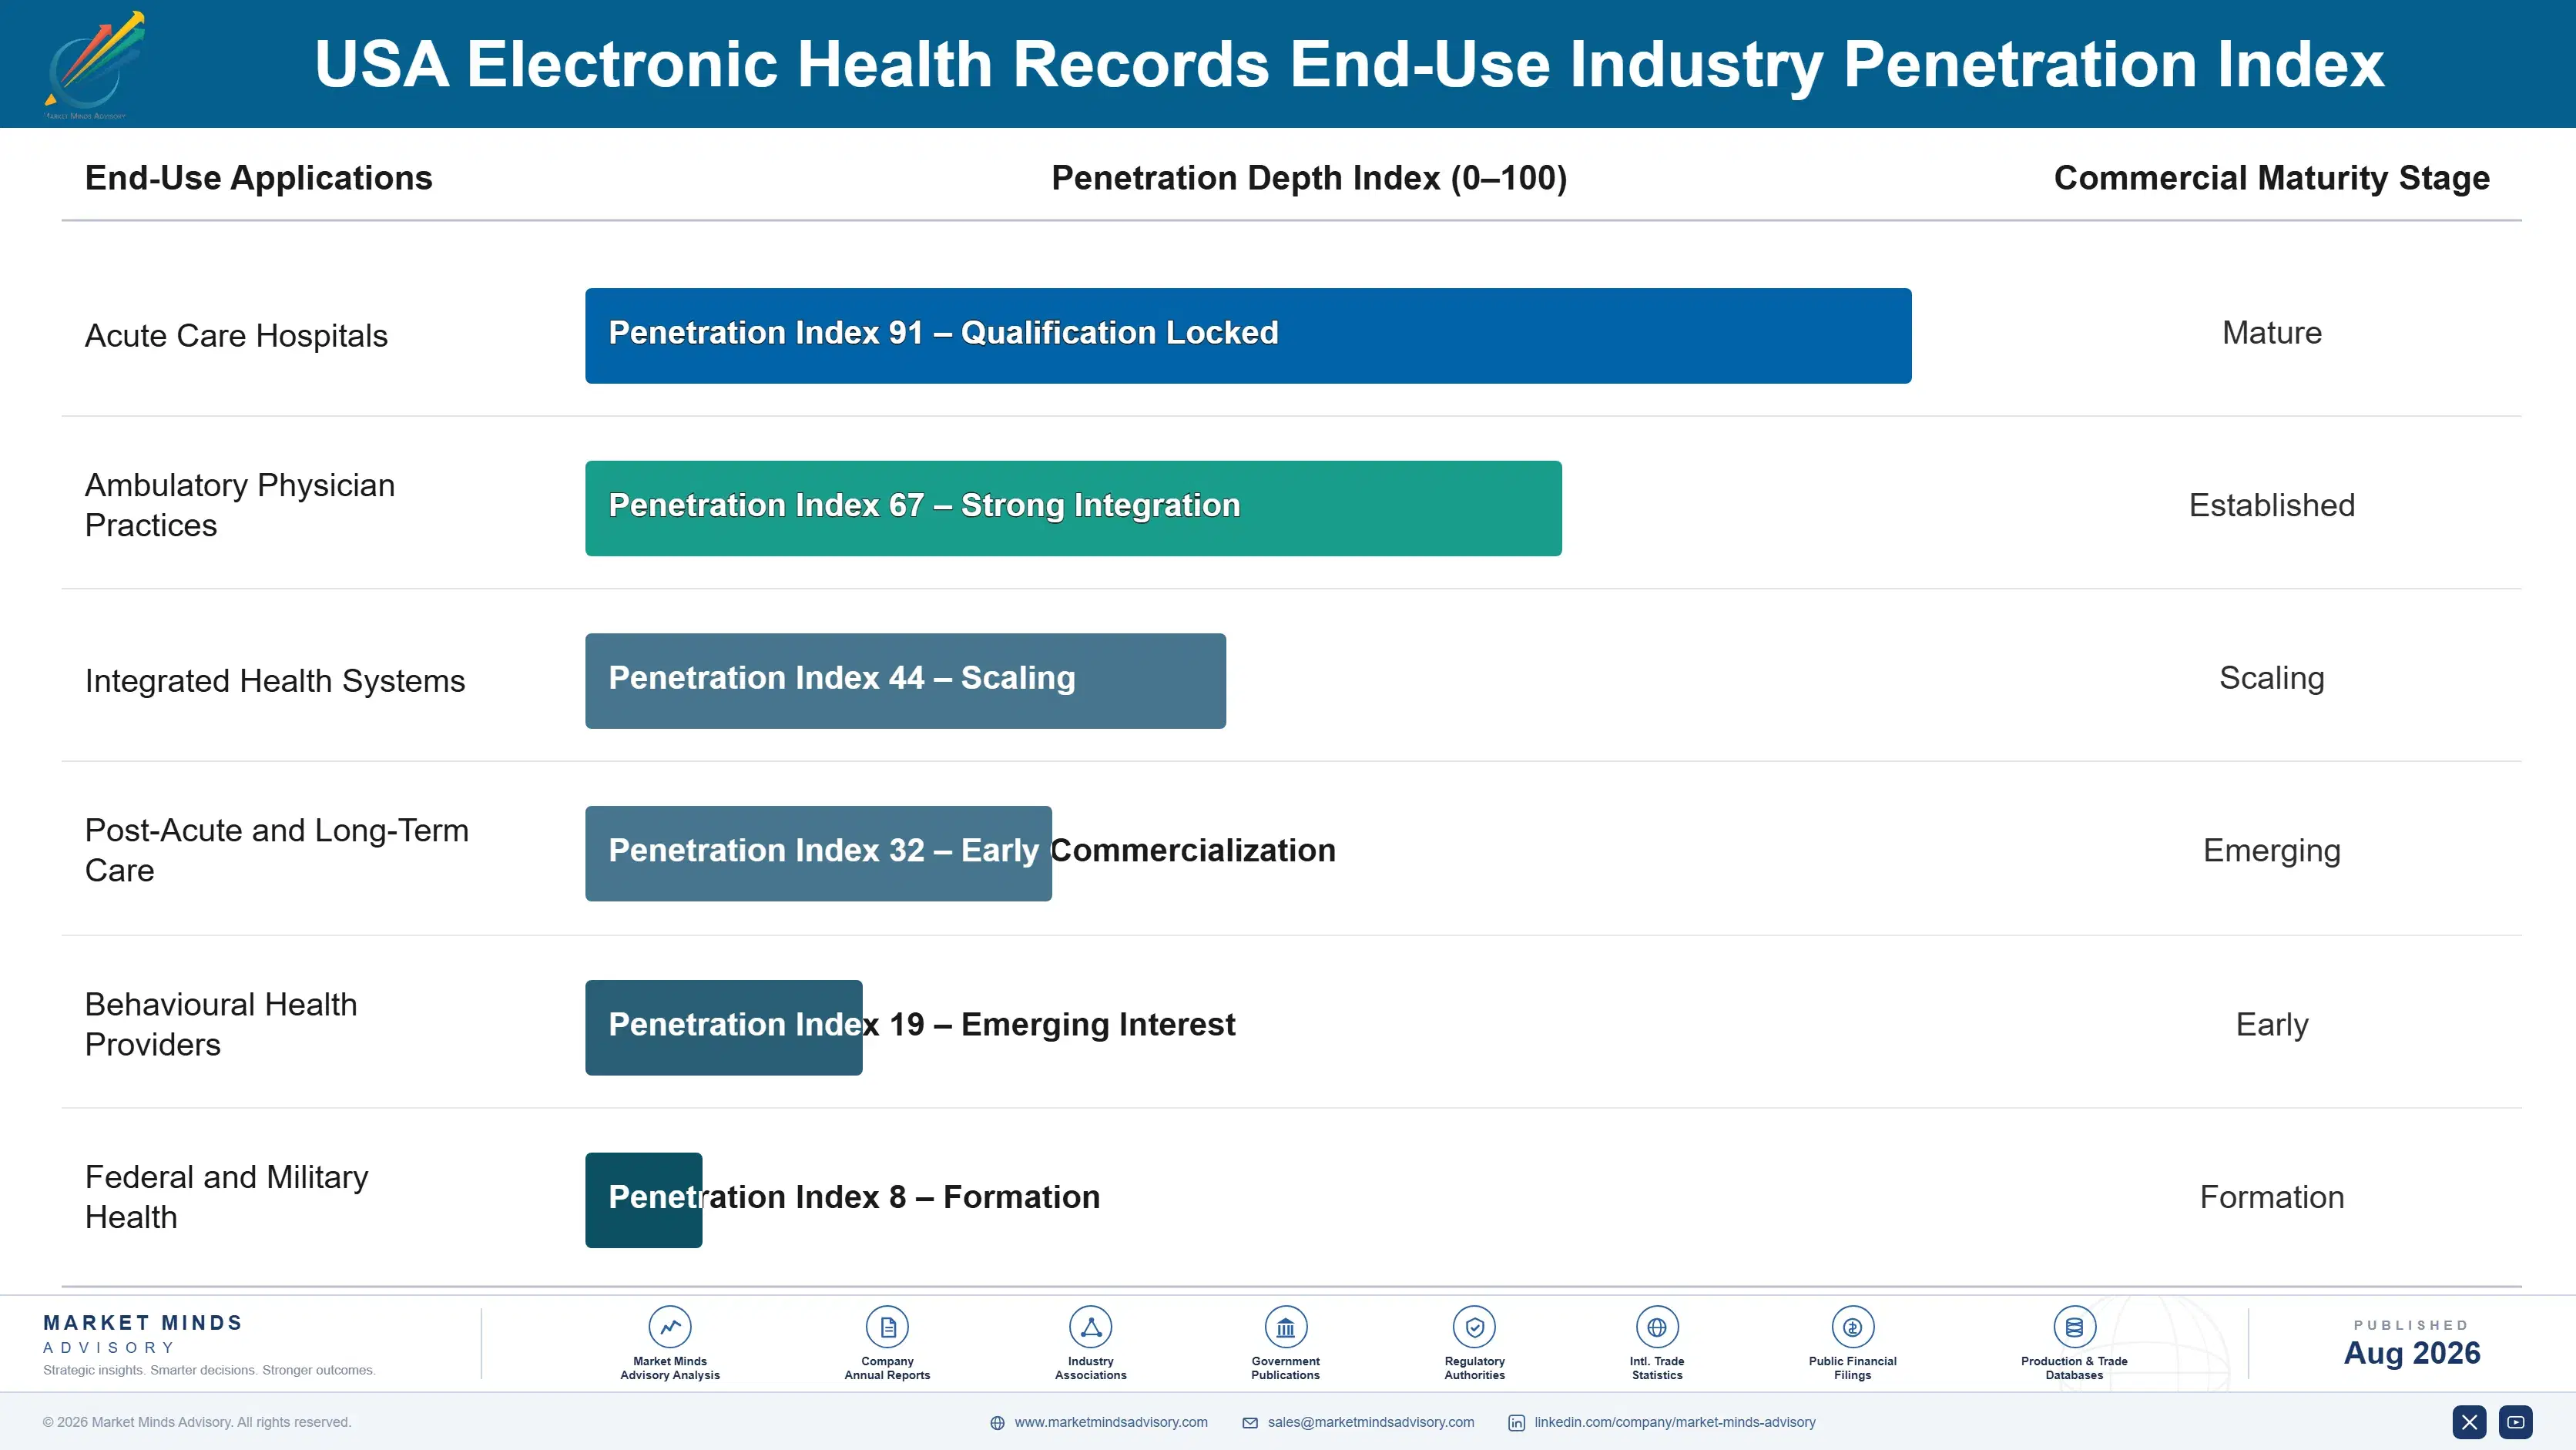
Stickiness varies by buyer type more than vendors admit. Large integrated health systems are the deepest hold, since a decade of configured workflows and reporting sits on top of the platform. Independent physician practices are far looser, switching ambulatory systems when pricing or support disappoints, though there are fewer of them every year. Post-acute and behavioural health providers sit somewhere between, constrained mostly by the cost of retraining staff who are already stretched.

The buyer has changed twice in this market. Platform selection once sat with a chief information officer and a technology committee. It now involves clinical leadership throughout, because the failures that matter are clinical rather than technical. And a newer generation of physicians arrives expecting the record to behave like consumer software, which is not a standard any of these platforms were designed against.
usa-electronic-health-records-market-end-use-penetration-index-1787641175628

Where Growth Is Still Available

These are among the four positions where our research anticipates prominent divergence between winners and laggards over the coming forecast period. Each is grounded in the demand model, the regulatory perimeter, and the announced capacity pipeline.
01 / INSTALLED BASE FARMING

There are no new customers, only new modules

Adoption passed 96% of acute care hospitals years ago and replacement happens roughly every fourteen years at a cost around 2.4 times the first year licence value, which means competitive wins are rare enough to be individually newsworthy. Every dollar of growth comes from selling additional capability into an installed base that already signed. Commercial organisations built around new logo acquisition are pointed at a market that stopped existing more than a decade ago, and no amount of sales effort changes that.
02 / CLINICAL BUYER ACCESS

The route into the account runs through medicine

Ambient documentation grows at 11.4%, half again the market rate of 7.6%, and entrants took that category from vendors with vastly larger installed bases by selling to chief medical officers rather than to IT committees. Physicians spend roughly 1.8 hours in the record for every hour of patient contact, and a leader watching clinicians resign will approve a monthly per physician subscription without a technology evaluation. Any vendor without a clinical sales motion is competing for the wrong signature entirely.
03 / COMPLIANCE REVENUE TIMING

Regulation sells modules no product demonstration could

Interoperability modules grow at 9.8% because information blocking enforcement and the TEFCA framework made data exchange an obligation with penalties attached rather than a capability weighed on clinical merit. A module a customer legally cannot decline converts at a rate no clinical product will ever match, and record vendors capture nearly all of it because they own the integration. The commercial discipline is timing releases against compliance deadlines instead of against an internal product roadmap that nobody outside the company follows.
04 / CONSOLIDATION SEAT CAPTURE

Acquisition moves more seats than selling does

Health systems acquiring physician practices transfer roughly 12,000 seats a year from small ambulatory vendors to enterprise platforms, and the acquiring system's incumbent wins them without competing for a single one. The commercial question is not how to win those seats but how cheaply they can be migrated, since a bespoke project on each practice destroys the margin on revenue already secured. Vendors with industrialised migration packages earn on this and the rest do not, which shows up plainly in services margin.

Engagement Snapshot From the Field

A live engagement with an industry participant carrying material or product regulatory and market exposure ahead of a defining policy shift, showing how our research translates into a defensible multi-year portfolio strategy.
MARKET MINDS ADVISORY · CLIENT ENGAGEMENT SUMMARY
USA Electronic Health Records Producer Strategic Portfolio Review and Transition Roadmap 2026·Investment Scenario on USA Electronic Health Records Exposure Evaluation 2025-26
CLIENT PROFILE
An ambulatory electronic health record vendor serving independent physician practices and small specialty groups across the United States, with roughly 9,000 practice customers. Annual recurring revenue was approximately 310 million dollars (client-reported, unverified by MMA), almost entirely subscription with modest module attachment. No ambient documentation capability existed and no enterprise health system relationships had been built.
STRATEGIC CHALLENGE
Customer count had fallen for four consecutive years as independent practices were acquired by health systems and migrated onto enterprise platforms, and no amount of selling replaced them. The board wanted to know whether to build ambient documentation, partner for it, or accept decline and optimise for cash. Nobody could quantify how fast the customer base would shrink.
MMA APPROACH
MMA modelled practice acquisition rates by state and specialty against the client's customer roster, producing an attrition forecast by cohort rather than a single average. Ambient documentation build, buy and partner options were costed against time to market. Forty-seven expert interviews with practice administrators, physicians and health system corporate development teams established what actually triggers a platform migration decision.
KEY FINDINGS
  1. Cohort modelling projected 31% customer attrition over five years, concentrated in primary care and cardiology practices in three states where health system acquisition activity was heaviest.
  2. Building ambient documentation internally required an estimated 26 months against a category already consolidating, while partnering delivered capability in 4 months at a revenue share.
  3. Practices with ambient documentation deployed reported physician satisfaction improvements that made them 3 times less likely to consider switching vendors within two years.
  4. Health system corporate development teams confirmed that platform migration follows acquisition automatically in 41 of the 47 cases discussed, with no vendor evaluation at all.
CLIENT PROFILE
An ambulatory electronic health record vendor serving independent physician practices and small specialty groups across the United States, with roughly 9,000 practice customers. Annual recurring revenue was approximately 310 million dollars (client-reported, unverified by MMA), almost entirely subscription with modest module attachment. No ambient documentation capability existed and no enterprise health system relationships had been built.
STRATEGIC CHALLENGE
Customer count had fallen for four consecutive years as independent practices were acquired by health systems and migrated onto enterprise platforms, and no amount of selling replaced them. The board wanted to know whether to build ambient documentation, partner for it, or accept decline and optimise for cash. Nobody could quantify how fast the customer base would shrink.
MMA APPROACH
MMA modelled practice acquisition rates by state and specialty against the client's customer roster, producing an attrition forecast by cohort rather than a single average. Ambient documentation build, buy and partner options were costed against time to market. Forty-seven expert interviews with practice administrators, physicians and health system corporate development teams established what actually triggers a platform migration decision.
KEY FINDINGS
  1. Cohort modelling projected 31% customer attrition over five years, concentrated in primary care and cardiology practices in three states where health system acquisition activity was heaviest.
  2. Building ambient documentation internally required an estimated 26 months against a category already consolidating, while partnering delivered capability in 4 months at a revenue share.
  3. Practices with ambient documentation deployed reported physician satisfaction improvements that made them 3 times less likely to consider switching vendors within two years.
  4. Health system corporate development teams confirmed that platform migration follows acquisition automatically in 41 of the 47 cases discussed, with no vendor evaluation at all.
RECOMMENDED STRATEGY
Phase 1: Phase one: partner for ambient documentation immediately rather than building, since 26 months of development against a consolidating category delivers nothing useful. Phase 2: Phase two: deploy it first into the three highest attrition state cohorts, where retention value against 31% projected loss is greatest. Phase 3: Phase three: stop pursuing enterprise health systems entirely and reinvest that commercial spend into specialty workflow depth the enterprise platforms handle poorly.
OUTCOME
The client signed an ambient documentation partnership within a quarter and deployed across the highest attrition cohorts first. Projected five year attrition fell from 31% to 22% in the revised model, and specialty workflow investment produced the first net customer addition in five years (client-reported, unverified by MMA).

Frequently Asked Questions

Foundational context covering the market sizes, CAGR, scope, country, region and competition that inform every finding below. This section is provided to cover basics and most often pre-purchase conversations, answered from the MMA Primary Research Dataset.

What is the current size of the USA Electronic Health Records Market?

The market was valued at 17.4 billion dollars in 2025, covering electronic health record software and associated modules sold to United States healthcare providers. It reaches an estimated 18.72 billion dollars during 2026.

How large will the USA Electronic Health Records Market be by 2036?

MMA forecasts 38.94 billion dollars by 2036, an increase of 20.22 billion dollars over the 2026 base. That represents an expansion multiple of 2.08 times across the forecast period.

What is the CAGR for the USA Electronic Health Records Market 2026 to 2036?

The base case compound annual growth rate is 7.6%, with a bull case of 8.8% and a bear case of 6.4%. Ambient documentation adoption and provider operating margin separate those scenarios.

Which segment is growing fastest?

Ambient documentation and language tools grow at 11.4%, half again the market rate of 7.6%, driven by physician workload and clinical retention concerns. Interoperability modules follow at 9.8%.

Who are the major companies in the USA Electronic Health Records Market?

Epic Systems, Oracle Health, MEDITECH, Veradigm and eClinicalWorks lead on provider organisations under contract and annual subscription revenue. Together they account for 74% of the market.

Which country is growing fastest?

The market is defined as United States provider spending, and Texas grows fastest of any state at 9.8% on physician employment and health system expansion into new markets.

Report Segmentation Architecture

The full report scope spans multiple orthogonal segmentation dimensions, with cross-tabulated demand data provided for each dimension pair. Coverage extends further to regional breakdowns, trend trajectories, and the competitive detail needed to support segment-level decision-making.

By Software Module Type

  • Core Clinical Documentation and Order Entry
  • Interoperability and Data Exchange
  • Clinical Decision Support and Analytics
  • Ambient Documentation and Language Tools
  • Patient Access and Portal Modules
  • Specialty Clinical Workflow Modules

By End-Use Industry

  • Acute Care Hospitals
  • Ambulatory Physician Practices
  • Integrated Health Systems
  • Post-Acute and Long-Term Care
  • Behavioural Health Providers
  • Federal and Military Health

By Commercial Dimension

  • Enterprise Subscription Contracts
  • Per Physician Monthly Pricing
  • Group Purchasing Agreements
  • Reseller and Partner Channels
  • Direct Practice Sales
  • Federal Procurement Vehicles

By Region

  • North America
  • Western Europe
  • East Asia
  • South Asia and Pacific
  • Latin America
  • Middle East and Africa
  • Eastern Europe

Scope, Methodology, and Coverage

Every figure in this report is reproducible from documented input assumptions. The scope below maps the historical period, the forecast horizon, the segmentation dimensions, and the countries covered, alongside the underlying primary and qualitative methodology.
Historical Period
2020 to 2025
Forecast Period
2026 to 2036
Base Year
2025 (USD billions; MMA Primary Research Dataset, August 2026)
Market Definition
Electronic health record software and associated clinical modules licensed or subscribed by United States healthcare providers, covering core clinical documentation and order entry, interoperability and data exchange, clinical decision support and analytics, ambient documentation and language tools, patient access and portal modules, and specialty clinical workflow modules. Measured at vendor selling value including implementation and support revenue. Standalone revenue cycle management, medical imaging systems, claims clearinghouses, pharmacy dispensing systems and practice financial software are excluded from scope.
Quantitative Units
USD billions (current prices); provider organisations under contract; USD per physician per month by module
Segmentation Dimensions
Software module type; end-use industry; commercial dimension; region
Regions Covered
North America, Western Europe, East Asia, South Asia and Pacific, Latin America, Middle East and Africa, Eastern Europe
Countries Covered
United States, Canada, United Kingdom, Denmark, Netherlands, Finland, Germany, Japan, South Korea, China, India, Australia, Mexico, Costa Rica, Colombia, Brazil, Saudi Arabia, United Arab Emirates, Israel, Poland
Key Companies Profiled
Epic Systems, Oracle Health, MEDITECH, Veradigm, eClinicalWorks, athenahealth, NextGen Healthcare, TruBridge, Greenway Health, Netsmart Technologies, PointClickCare, WellSky, Modernizing Medicine, Elation Health, Canvas Medical, Praxis EMR, DrChrono, AdvancedMD, Tebra, Harris Healthcare
Quantitative Methodology
Primary survey, n=3,800 respondents, Q4 2025, six countries; demand-side model with trade association cross-validation
Qualitative Methodology
47 expert interviews, Q4 2025; applied to validate demand model assumptions, identify emerging dynamics, and assess competitive positioning
Report Format
PDF and XLSX data workbook (Word format preview document)
Publisher
Market Minds Advisory
Report Code
MMA-2026-TEC-121
Published
August 2026
Contact
sales@marketmindsadvisory.com | www.marketmindsadvisory.com

Purchase the full USA Electronic Health Records Market Report (2026 to 2036).

The full report treats the United States record market as a farming business rather than a hunting one, since adoption passed 96% of hospitals years ago and every dollar of growth now comes from an installed base that already signed. It sizes all six module types independently through 2036, quantifies replacement economics against a fourteen year platform interval, and models practice acquisition attrition by state and specialty. Regional chapters cover all seven regions, with non domestic shares assessed as vendor delivery capacity rather than demand. Competitive profiling covers 20 participants on one consistent provider organisation and subscription revenue basis.
Six module types sized independently through 2036
Replacement economics quantified against a fourteen year interval
Practice acquisition attrition modelled by state and specialty
Ambient documentation adoption tracked by specialty and setting
Interoperability compliance deadlines mapped against module release timing
Twenty participants profiled on one consistent evaluation basis

Built For The People Who Decide

From boardroom strategy to bench-side execution, this report is read cover-to-cover by leaders shaping the next decade of their industry, turning demand scenarios, market dynamics and valuation benchmarks into decisions.
CXOs/ Presidents/ VPs/ Managers
M&A and Corporate Development
Strategy Teams and R&D Heads
Procurement and Product Directors
Regulatory and Compliance Leaders
Investor Relations and Equity Analysts