

Market Minds Advisory
USA Connected TV Market

USA Connected TV Market: USA Connected TV Market: Streaming Advertising Inventory, Platform Supply and Measurement, 2026 to 2036

Impression supply has grown far faster than advertiser demand, so effective prices keep falling while every seller reports audience growth. Almost nobody publishes what they actually realise per thousand impressions.

Lead Analyst

Published

September 2026

Make Smarter Decisions with Customized Research Insights

Request a free sample report and evaluate market opportunities, growth trends, and competitive dynamics relevant to your business needs.

2025 MARKET VALUE$31.4BMarket Size 2025
2036 FORECAST VALUE$103.0BBase Case , 2026 to 2036
CAGR 2026 TO 203611.4 %Bull 12.7% / Bear 10.2%
INCREMENTAL OPPORTUNITY$68.0BNet 10- year value creation
EXPANSION MULTIPLE2.94x2036 value over 2026 base
Strategic Levers
M&A Pipeline
Regional Outlook
Country Rankings
Competitive Intelligence
Segmental Deep-dive
Call-Us : 91 93563 13602

Executive Snapshot and Market Trajectory.

Every seller in this market reports audience growth and almost none report realised price. Effective cost per thousand impressions is falling about 9.4% a year while inventory expands faster than that, which is why revenue growth is a fraction of impression growth. Only one of the two gets reported.
Subscription streaming ad tiers grow at 17.1%, half again the market rate of 11.4%, as services that resisted advertising for a decade discovered the subscriber economics did not work without it, and 42% of streaming subscriptions now sit on an advertising supported plan. Live sports inventory follows, and it is the only supply in this market with genuine scarcity behind it. Scarcity there is genuine. Audience and revenue parted company here.
Five sellers hold 68% of advertising revenue, and the platforms owning the home screen sit alongside the services producing the content, which makes the competitive picture unusually tangled. Around 31% of available inventory clears no demand in a given month. Advertisers paying for reach across five applications are frequently buying frequency against the same household instead. Deduplicated measurement would settle it, and nobody wants to publish the smaller number first. Everyone waits. Nobody moves first.
Market Definition
This market covers advertising revenue generated on connected television inventory in the United States, including subscription streaming ad tiers, free ad-supported streaming channels, device platform and home screen inventory, virtual pay television distributor inventory, broadcaster owned streaming applications, and live sports streaming inventory. It excludes linear broadcast and cable television advertising, subscription fees paid by consumers, television hardware sales, and advertising on desktop or mobile devices.
Base Year Value
$31.4B in 2025 (MMA Primary Research Dataset, September 2026)
Forecast Period
2026 to 2036, eleven discrete annual values
CAGR
11.4% base case. Bull 12.7%. Bear 10.2%.
Fastest Growth Segment
Subscription Streaming Ad Tiers: 17.1% CAGR
Fastest Growth Country
Texas: 14.6% CAGR
Fastest Growth Region
South Asia and Pacific: 13.6% CAGR
Largest Region
North America: 32% of 2025 global value
Market Leaders
Amazon, Google, Disney, Netflix, and Roku lead the field. Source: MMA Primary Research Dataset, July 2026.
Primary Survey
n=3,800 procurement and R&D decision-makers, Q4 2025, six countries
Methodology
Demand-side build-up, cross-validated against public data, 47 expert interviews

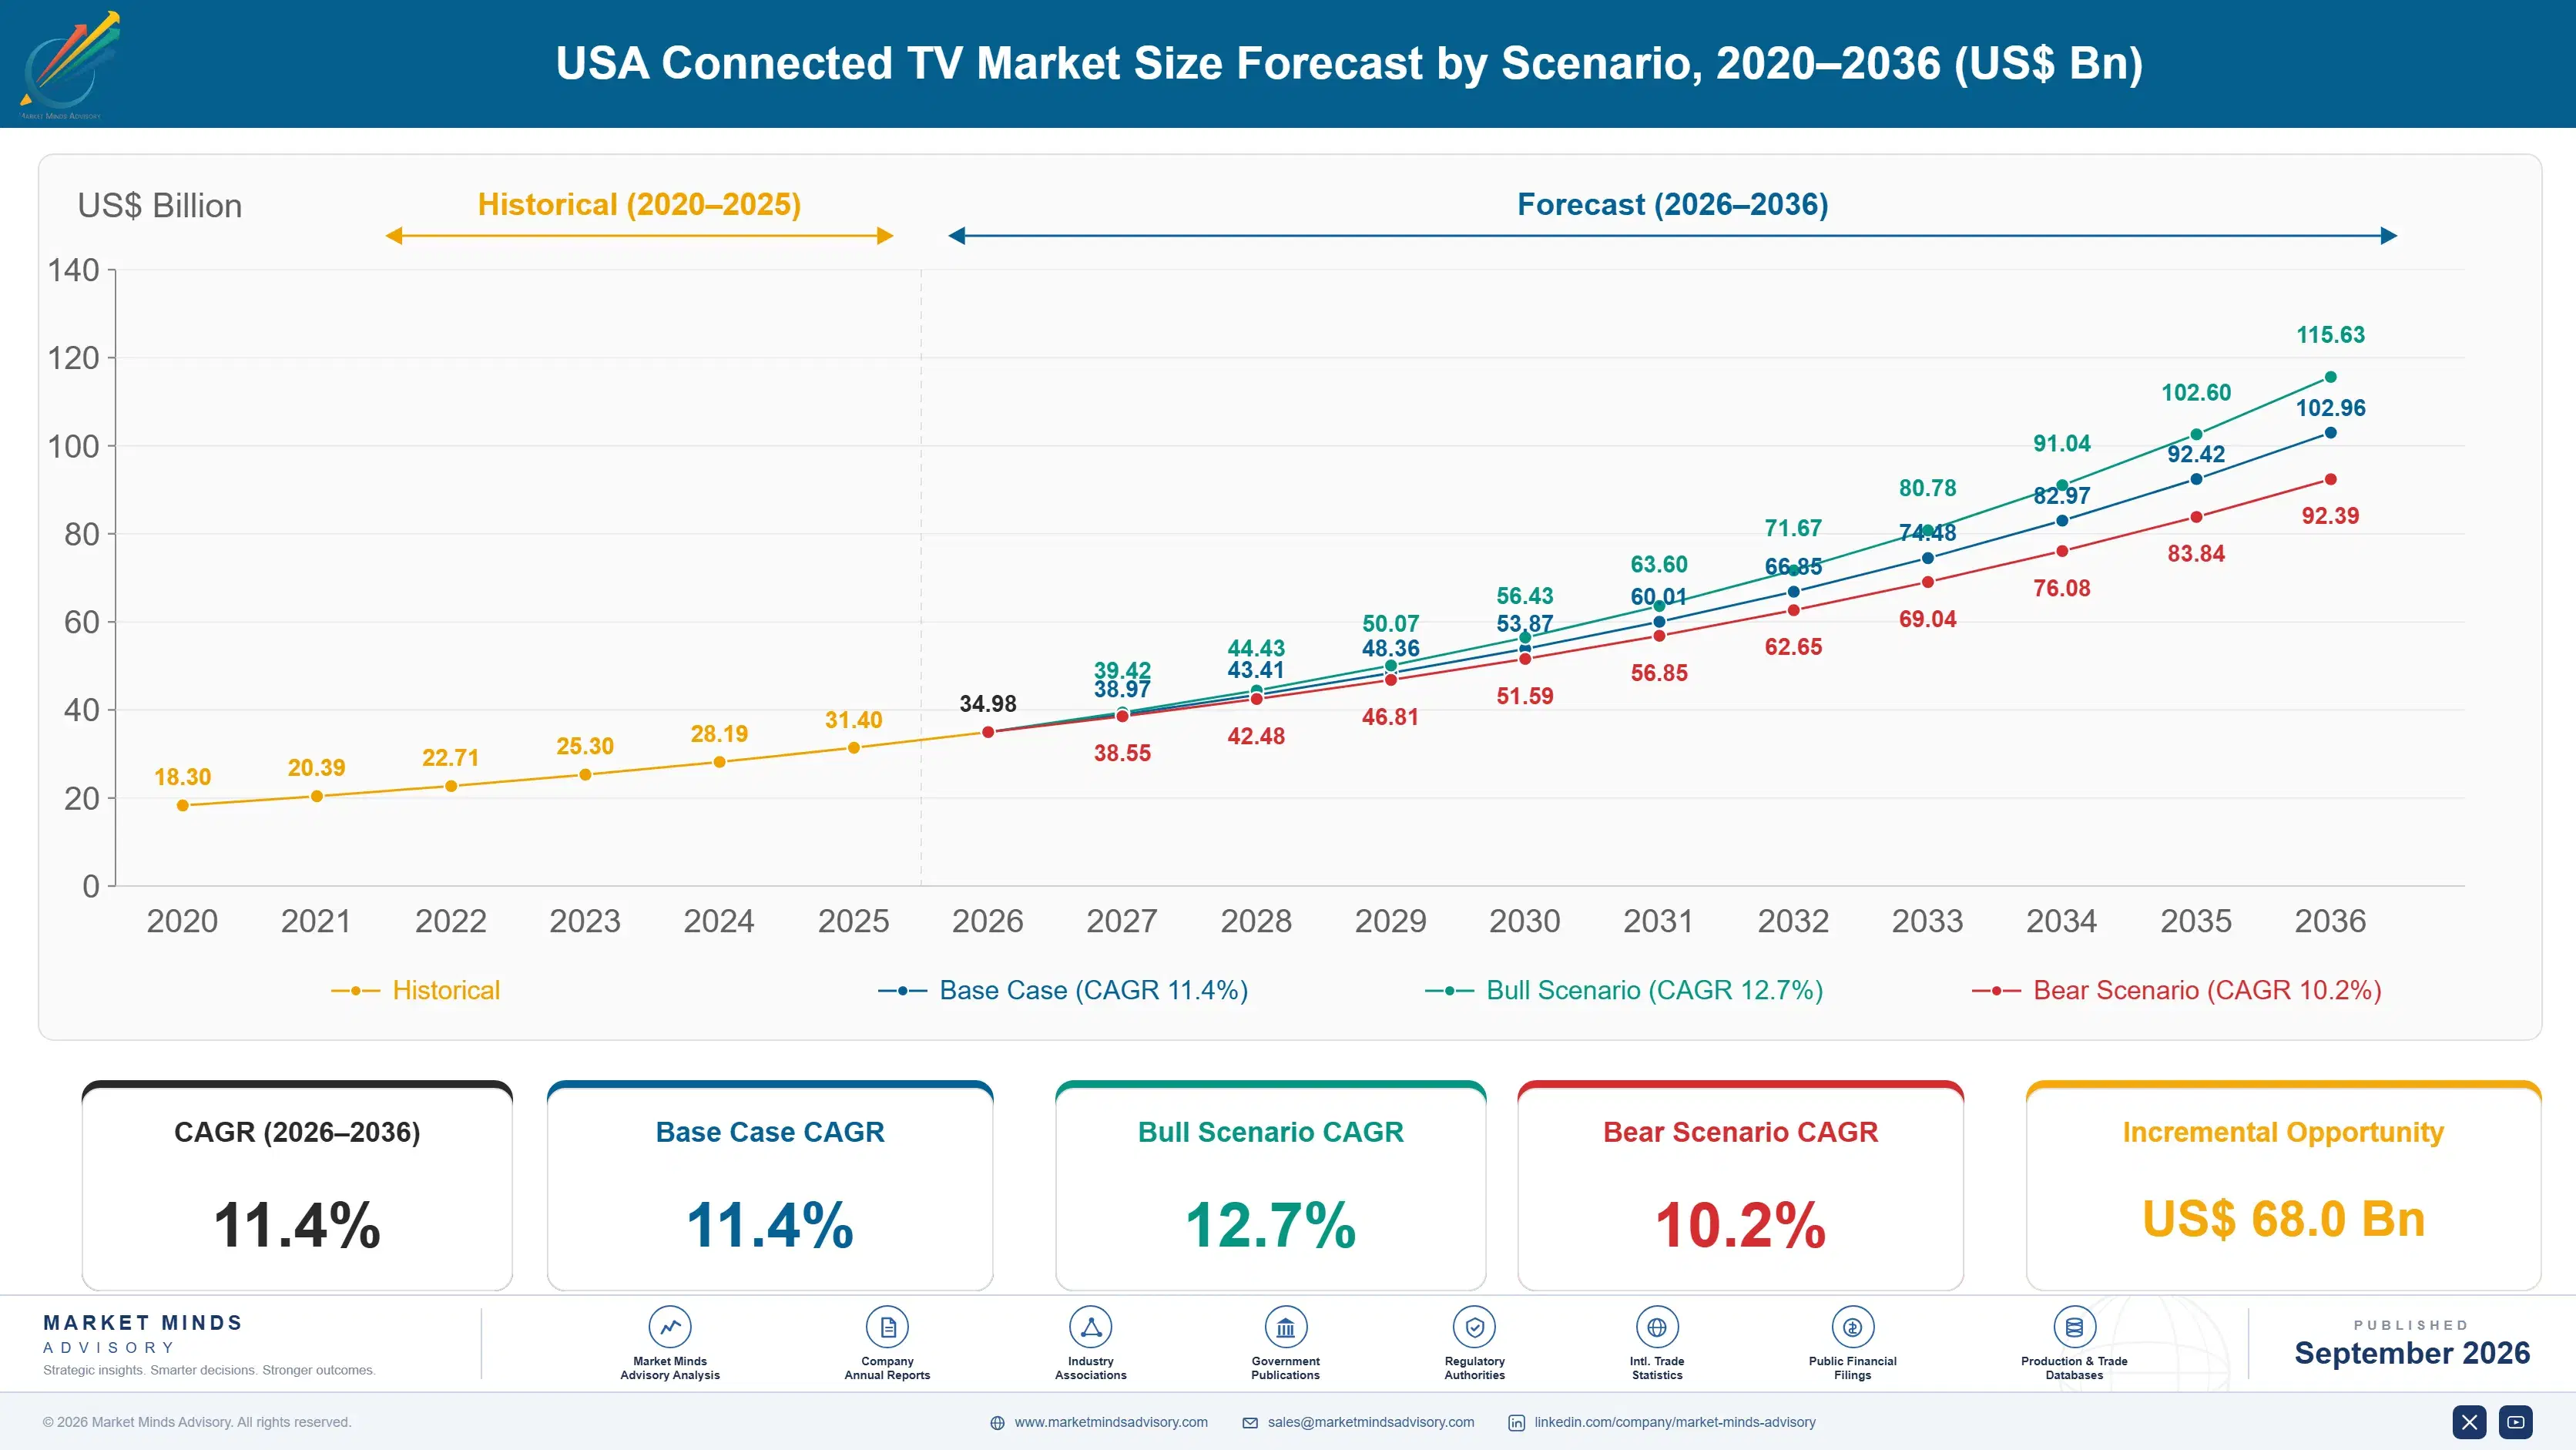
USA Connected TV Market Forecast Scenarios

usa-connected-tv-market-size-forecast-scenario-1790006636276
Growth between 2020 and 2025 was violently uneven and the compound figure hides it. Advertising revenue expanded very quickly through 2021 and 2022 as budgets followed audiences off linear television, then flattened through 2024 and 2025 as advertising tier launches flooded the market with impressions nobody had budgeted for. Historical growth of 10.1% is the average of a boom and a stall rather than any steady progression.
The base case at 11.4% rests on three mechanisms. Advertising tier adoption continues as services price the ad-free option high enough to push subscribers across, expanding both audience and inventory. Live sports rights migrate to streaming platforms, bringing the only genuinely scarce inventory in the medium with them. And local and mid-market advertisers, historically absent, enter through self-serve buying tools that removed the minimum spends which previously excluded them entirely.
The bull case at 12.7% depends on measurement consolidating enough that advertisers trust cross-application reach figures, which would release brand budgets currently held back by duplication concerns. The bear case at 10.2% is continued supply expansion without matching demand: if impression volume keeps outgrowing budgets, effective prices fall faster than 9.4% annually and revenue growth compresses toward nothing despite rising audiences.

Supply Outran Demand And Prices Fell

The arithmetic that governs this market is simple and rarely stated. Every major service launching an advertising tier adds impressions, advertiser budgets have not grown at the same rate, and effective prices fall about 9.4% a year as a result. Roughly 31% of available inventory clears no demand at all in a given month, which is what oversupply looks like in practice. Nobody planned for that outcome.
TOP FIVE CONCENTRATION68%Share of advertising revenue held by the leading sellers
AVERAGE REALISED CPMUSD 22Effective price per thousand impressions after all discounting
CPM DECLINE RATE9.4%Annual erosion in effective price per thousand impressions
UNSOLD IMPRESSION SHARE31%Available inventory that clears no advertiser demand monthly
HOUSEHOLD DUPLICATION FACTOR4.8Applications reaching the same household within one campaign
AD TIER SUBSCRIBER SHARE42%Streaming subscriptions now taking an advertising supported plan
Sellers respond by reporting audience rather than price. Monthly active accounts, hours viewed, and household reach all rise convincingly, and none of them describe what a thousand impressions actually earn after discounting, make-goods, and volume commitments. Realised prices near USD 22 sit well below the rate cards, and the gap widens each year without appearing in any public disclosure. The gap widens each year and appears in no public disclosure.
Duplication compounds the problem for buyers. A household reached across 4.8 applications during a campaign counts five times in aggregate reporting, so an advertiser paying for incremental reach is frequently paying for frequency against people already reached. Until measurement resolves that credibly, brand budgets that would justify higher prices stay where they are. Brand money waits for a number it can believe.
"Ask a connected television seller about audience growth and you get a deck. Ask about realised price per thousand and the conversation becomes philosophical. The sellers who will still matter in five years are the ones building scarcity into their inventory rather than adding more of it."
Practice Director, Media and Advertising Platforms · MMA Technology Practice · September 2026

Market Trends

Ad Tiers Convert Subscribers Into Inventory At Scale

Services that spent a decade refusing advertising now price the ad-free option high enough that switching is the rational choice, and 42% of streaming subscriptions sit on an advertising supported plan as a result. Each conversion adds a viewer, adds impressions, and lowers the subscription revenue per account, which the advertising is supposed to replace. The segment grows at 17.1%. Whether that replacement works depends entirely on realised price, and with effective prices falling 9.4% annually the arithmetic is tighter than the subscriber figures suggest. Subscriber counts flatter the story considerably.
Market Impact: Adds 19% of impressions

Live Sports Brings The Only Genuinely Scarce Inventory

Streaming inventory is otherwise abundant and getting more so, which is precisely why live sports commands prices nothing else in the medium approaches. A championship game cannot be produced on demand, cannot be watched later at the same value, and reaches an audience that will not assemble for anything else. Live sports streaming grows at 15.4%. The economics for the seller are less comfortable than the price implies, since rights costs have risen faster than the advertising revenue they support at several platforms. Scarcity and profitability are not the same thing here.
Market Impact: Clears about 40% above average

Market Opportunities and Growth Drivers

Self-Serve Buying Tools Admit Mid-Market Advertisers

Connected television was effectively closed to local and mid-market advertisers by minimum spends and insertion order processes designed for national brands. Self-serve platforms removed both, and a regional retailer can now buy a targeted campaign at a few thousand dollars. Around 19% of impressions now clear against advertisers who had never bought television in any form. This is the clearest source of genuinely new demand in the market, and it partly offsets an oversupply problem that national budgets alone would not absorb. National budgets alone would never have absorbed the supply.
Market Impact: Prices fall 9.4% annually

Retail Media Data Attaches Purchase Outcomes To Impressions

Platforms holding retail purchase data can connect a television impression to a subsequent transaction in a way linear television never could, and advertisers pay a premium for that connection because it answers the measurement question directly. Campaigns bought with retail data attached clear at effective prices roughly 40% above comparable untargeted inventory. That advantage sits with a small number of sellers who own both the retail relationship and the streaming audience, which is a large part of why concentration reaches 68%. Everyone else licenses the signal on terms that share the premium.
Market Impact: Duplicates 4.8 times per household

Market Restraints and Challenges

Effective Prices Fall Nine Percent Every Year

Realised cost per thousand impressions declines about 9.4% annually, and the root cause is straightforward oversupply: every advertising tier launch adds inventory faster than advertiser budgets grow. Around 31% of available impressions clear no demand monthly. Commercially this means audience growth and revenue growth have separated, and sellers reporting the former are describing something that does not translate. Participants respond by building scarcity through live rights, by attaching outcome data that justifies premium pricing, and by withholding inventory rather than clearing it at any price. Reporting audience instead is the industry habit.
Market Impact: Covers 42% of subscriptions

Household Duplication Quietly Undermines Reach Buying

A campaign running across several applications reaches the same household an average of 4.8 times while aggregate reporting counts it separately each time, and the root cause is that no measurement currency spans the platforms credibly. Advertisers paying for incremental reach receive frequency instead. Commercially this holds back brand budgets that would support higher prices, since buyers discount claimed reach heavily. Mitigation runs through cross-platform identity resolution, third-party measurement adoption, and buying through consolidated supply arrangements that can deduplicate before delivery rather than afterward. No currency spans the platforms credibly yet.
Market Impact: Segment grows at 15.4%
4 additional market trends, 3 additional growth drivers, and 2 additional restraints and challenges are covered in the full report. Contact sales@marketmindsadvisory.com to access the complete intelligence.

Segment CAGR and Growth Architecture

Segmentation follows where the monetised impression originates. Six supply sources cover the market: subscription streaming ad tiers, free ad-supported streaming channels, device platform and home screen inventory, virtual pay television distributor inventory, broadcaster owned streaming applications, and live sports streaming inventory. Ad tiers and live sports carry nearly all the growth. Everything else is being repriced downward.
usa-connected-tv-market-market-share-analysis-1790006636812

Subscription Streaming Ad Tiers

Advertising tiers grow at 17.1%, half again the market rate of 11.4%, driven by services pricing the ad-free option high enough that most subscribers move across rather than pay the difference. Some 42% of streaming subscriptions now sit on an advertising plan. Each conversion trades subscription revenue for advertising revenue, and whether that trade works depends on realised price rather than on subscriber counts, which is where the reporting emphasis stubbornly remains. With effective prices falling 9.4% a year, several services are running to stand still while presenting the migration as a growth story to investors. Combined revenue per account is the number that matters, and it is rarely the one presented.
CAGR 17.1%

Live Sports Streaming Inventory

Live sports grows at 15.4% and is the only inventory in connected television with real scarcity behind it. A match cannot be produced on demand, holds almost no value on delay, and assembles an audience nothing else in the medium can gather, which is why it clears at multiples of general streaming inventory. The seller economics are less comfortable than those prices suggest. Rights costs have risen faster than the advertising revenue they support at several platforms, so the inventory is scarce, expensive to buy, and frequently unprofitable for whoever holds it at current price levels. Rights obligations are fixed while the advertising revenue supporting them is not. Scarcity does not guarantee profit.
CAGR 15.4%
Full segment breakdown across 6 segments available in the complete report.

Regional Architecture and Country Demand Map

Scope is limited to United States advertising revenue, so this table records where the technology, devices, content production, and engineering behind that inventory originate rather than where the impressions are served. It is a supply map, and it is flagged for operator ruling. Read it as a supply chain map.

North America

Platform software, advertising technology, measurement systems, and the great majority of content production originate here, which accounts for a 32% share concentrated at the high value end of the supply chain. Streaming operating systems, demand and supply platforms, and identity resolution services are all domestic. Growth of 10.6% tracks the market rate closely, moderating as engineering work migrates to lower-cost locations and as content production expands internationally. What is notably absent is hardware, since almost no connected television device consumed in the United States is manufactured domestically at any meaningful volume. Engineering work is migrating steadily toward lower-cost locations. Hardware manufacture is essentially absent domestically. Value concentrates at the high end.
Share: 32% | CAGR: 10.6% (2026 to 2036)

East Asia

Television hardware and the semiconductor content inside it originate overwhelmingly here, which makes this the largest equipment origin at 23%. Korean manufacturers supply both devices and the operating systems running on a substantial share of American screens, giving them a home screen advertising position that hardware alone would not confer. Chinese manufacture covers most of the value tier. Growth of 12.4% runs above the market rate because device replacement and smart television penetration both continue, and because platform advertising revenue attaches to devices already installed in American homes. Korean operating systems confer an advertising position that hardware alone would never provide. Chinese manufacture covers most of the value tier. Replacement cycles continue.
Share: 23% | CAGR: 12.4% (2026 to 2036)
Regional intelligence for 5 additional markets available in the complete report: Western Europe, South Asia and Pacific, Latin America, Eastern Europe, Middle East and Africa. Contact sales@marketmindsadvisory.com.
usa-connected-tv-market-country-cagr-analysis-1790006637363

How Sellers Defend Realised Price

Four commercial moves separate sellers holding price from those watching audience growth translate into nothing. Each attacks the same condition: impressions are abundant and getting more so, and abundance destroys pricing unless a seller builds something the buyer cannot obtain elsewhere. Adding impressions to an oversupplied market makes a seller poorer rather than larger.

Withhold Inventory Rather Than Clear It Cheaply

Roughly 31% of available impressions clear no demand monthly, and sellers who drop floor prices to move them teach buyers to wait. Holding floors and accepting unsold inventory preserves realised price across the whole book, and sellers maintaining discipline report effective prices 14% to 22% above comparable competitors with similar audiences. The cost is visible unsold volume that looks like failure in an internal review, which is exactly why the discipline is rare and why it keeps working for those who hold it. Patience is the whole strategy. Nobody enjoys the internal review.
Market Impact: Holds realised prices 14% to 22% higher overall

Attach Purchase Outcome Data To Impressions

Advertisers pay for connection between an impression and a transaction because it answers the question television never could, and campaigns bought with retail purchase data attached clear at effective prices roughly 40% above untargeted inventory. Sellers without their own retail relationship can obtain comparable effect through data partnerships, though on terms that share the premium. The alternative is competing on audience size in a market where audience is abundant and getting cheaper by roughly a tenth every year. Audience alone gets cheaper every year. Partnership terms share the premium away, and it remains worth taking.
Market Impact: Clears roughly 40% above comparable untargeted streaming inventory

Open Self-Serve Access To Mid-Market Buyers

Minimum spends and insertion order processes designed for national brands excluded local and regional advertisers entirely, and removing them brought genuinely new demand rather than reallocated budget. Around 19% of impressions now clear against buyers who had never purchased television in any form. Sellers with credible self-serve tooling absorb oversupply that national budgets would never have covered, and the effective prices are lower per impression while the incremental margin on otherwise unsold inventory is considerably better. Incremental margin on otherwise unsold inventory is considerably better than the headline price implies.
Market Impact: Absorbs 19% of the total available impression supply

Fund Cross-Platform Deduplication Before Buyers Demand It

A campaign reaching the same household across 4.8 applications is sold as reach and delivered as frequency, and buyers have started discounting claimed reach accordingly. Sellers participating in credible cross-platform measurement lose some flattering audience numbers and gain access to brand budgets held back by duplication concerns. Those who moved early report brand advertiser share of revenue rising 8 to 13 points. The uncomfortable part is that honest measurement makes a seller look smaller before it makes them more valuable. Brand budgets follow numbers buyers believe. Looking smaller first is the entry price.
Market Impact: Raises brand revenue share 8 to 13 points

Who Controls the Margin Pool

Concentration is high and the structure is unusual. Five sellers hold 68% of advertising revenue, measured consistently on that basis across all participants, and they occupy quite different positions: device platforms owning the home screen, streaming services owning the content, and one participant owning retail purchase data alongside a very large audience. The gap between the leader and the fifth is wide and has widened as data advantages compound. Data advantages compound rather than erode.
Competition currently turns on three things: purchase outcome data that justifies premium pricing, live rights that create genuine scarcity, and self-serve tooling that reaches advertisers national sales teams cannot economically serve. Audience size differentiates far less than it did, because audience is abundant and the price of reaching it falls every year. Reaching an audience gets cheaper every single year.

Pressure comes from two directions. Sellers holding retail data are taking budget from those selling audience alone. Meanwhile free ad-supported channels keep adding inventory that pushes general pricing down for everybody. Rankings will shift toward participants who own an outcome signal, since that is the only attribute abundance does not erode. Abundance erodes everything except a scarce signal.
usa-connected-tv-market-company-positioning-matrix-1790006637887

Competitive Moat and Risk Dimensions

AMAZON

Moat: Retail Data And Audience Together

Holding purchase history alongside a very large streaming audience allows an impression to be connected to a subsequent transaction directly, which is the measurement answer advertisers have wanted from television for fifty years. Competitors can approximate it through data partnerships only by sharing the premium, and none can replicate the completeness of first-party purchase records.
AMAZON

Risk: Inventory Expansion Depresses Pricing

Converting a very large subscriber base onto advertising tiers adds impressions at a scale that pushes market pricing down, including for the company's own inventory. The data premium offsets this but does not eliminate it, and the more inventory the platform creates the harder that premium has to work to hold realised price steady.
ROKU

Moat: Home Screen And Operating System

Owning the operating system on a large installed base of American televisions confers a position independent of any content investment, since the home screen is seen by every viewer regardless of which service they eventually open. That inventory carries no content cost at all, which is a margin structure content-owning competitors cannot match.
ROKU

Risk: No Outcome Signal Owned

Competition is moving toward sellers who can connect impressions to purchases, and a device platform without retail or transaction data must obtain that signal through partnerships on terms that share the premium away. Meanwhile device manufacturers with their own operating systems continue expanding their share of American screens.

Players Tracked

Prominent Players

Amazon
Google
Disney
Netflix
Roku

Other Key Players

Warner Bros. Discovery
Paramount Global
NBCUniversal
Fox Corporation
Samsung
LG Electronics
Vizio
The Trade Desk
Magnite
PubMatic
Comcast
DirecTV
Philo
Crackle
Plex

Recent Developments

FEBRUARY 2026

Amazon Signs Cross-Platform Measurement Agreement With Independent Provider

Amazon entered a measurement agreement with an independent provider covering deduplicated household reach across its streaming inventory, addressing the duplication concerns that have held brand budgets back from connected television for several years. Reporting covers reach and frequency across the platform's whole streaming footprint. Results are published quarterly.
Signal: Honest deduplication makes a seller look smaller before it makes them more valuable to brand buyers.
SEPTEMBER 2025

Roku Signs Supply Agreement With Major Demand Side Platform

Roku entered a supply agreement giving a major demand side platform direct programmatic access to home screen and platform inventory, with floor pricing maintained rather than opened to unrestricted bidding across the whole available supply. Curated packages are offered alongside the general programmatic supply. Terms run several years.
Signal: Floor discipline is being written into supply agreements because clearing cheaply teaches buyers to wait indefinitely.
MAY 2025

Magnite Acquires Connected Television Supply Technology Specialist

Magnite completed an acquisition of a connected television supply technology company, adding capability in inventory curation and floor management for sellers trying to hold realised prices against continuing oversupply across the medium. The acquired technology handles curation, floor management, and packaging for sellers. Integration completed quickly.
Signal: Supply side technology is consolidating around price defence rather than around reach or raw impression volume.

What This Inventory Costs Sellers

Three inputs dominate seller cost. Content licensing and production amortisation runs 38% to 46% of cost of goods sold across services that own programming. Streaming delivery, encoding, and content distribution capacity takes 14% to 20%. Advertising serving, measurement, and identity technology adds a further 9% to 14%. Sports rights sit inside the first line and behave differently, arriving as fixed multi-year obligations.
Live sports rights costs rose materially through 2024 and 2025 as streaming platforms bid against incumbent broadcasters, and several participants described the resulting margin pressure in their annual reports for those years. The rights are fixed obligations while the advertising revenue supporting them is not, and with effective prices falling 9.4% annually that mismatch has become uncomfortable at more than one platform. Several platforms have begun renegotiating those terms.

The competitive disadvantage mechanism runs through content cost rather than through delivery. A seller carrying programming amortisation competes for the same impressions as a device platform whose home screen inventory carries no content cost at all, and cannot match that margin structure at any price level. Exposure varies by participant type. Platform owners monetise attention they did not pay to create. Content owners fund every impression they sell.
usa-connected-tv-market-cost-volatility-analysis-1790006638085

Structure Sports Rights With Revenue Participation

Fixed multi-year rights obligations against advertising revenue that falls 9.4% a year is an exposure nobody should carry willingly. Agreements including revenue participation or performance-linked components shift some of that risk back toward the rights holder, and several recent renewals have moved this way as platforms declined to bid on purely fixed terms. Platforms have declined purely fixed terms.

Withhold Unsold Inventory Rather Than Discount It

Clearing surplus impressions at reduced floors trains buyers to wait for the discount and depresses realised price across the entire book. Accepting visible unsold volume protects the rate structure, and sellers holding that discipline report effective prices materially above competitors with comparable audiences and less patience. Visible unsold volume is the cost of holding the rate structure intact.

Amortise Advertising Technology Across Owned Properties

Serving, measurement, and identity infrastructure is largely fixed cost, so sellers running it across several owned services spread it across far more impressions. This favours consolidated portfolios and is a genuine reason single-service participants have moved toward outsourced advertising technology despite the margin it hands away. Single-service participants hand margin away to outsourced providers instead.

Portfolio Architecture for Margin Defence

Margin follows whether the seller paid to create the attention being sold. Home screen and platform inventory carries no content cost whatsoever and earns accordingly. Free ad-supported channels sit in the middle, licensing library programming cheaply. Content-owning services fund every impression through programming amortisation, and live sports funds them through rights obligations that do not flex when advertising prices fall. Who paid for the attention sets the ladder.
The tension between volume and premium runs through oversupply directly. Adding advertising tiers expands audience and depresses realised price simultaneously, so volume growth in the general inventory pool destroys value for everybody including the seller creating it. Premium positions built on outcome data or genuine scarcity hold price, and both scale far more slowly than inventory does. Scarcity scales slowly and supply does not.

High-value pools concentrate where buyers cannot substitute: retail data attached impressions that connect to transactions, live rights that cannot be produced on demand, and deduplicated reach that brand budgets require before they will move. These share a property the rest of the market lacks, which is that more supply does not appear tomorrow. Everywhere else, it does, and pricing reflects it.

Volume / Commodity-Adjacent

General streaming inventory on content-owning services, competing against abundant substitutes while carrying programming amortisation. Effective prices fall each year as supply expands. The twelve-point range reflects wide variation in content cost between original programming and licensed library material.
Gross Margin: 34% to 46%

Premium / Certified

Device platform and home screen inventory carrying no content cost, plus free ad-supported channels licensing library programming cheaply. Attention is monetised rather than created. The ten-point range separates operating system owners from channel operators paying licence fees for their programming.
Gross Margin: 58% to 68%

Sustainability / Regulatory / Next-Generation

Impressions carrying purchase outcome data and deduplicated cross-platform reach that brand budgets require. Buyers cannot obtain the signal elsewhere at comparable completeness. The twelve-point range reflects the difference between owning first-party transaction data and licensing it through partnership arrangements.
Gross Margin: 64% to 76%
usa-connected-tv-market-portfolio-architecture-1790006638592

High-value Sub-segments and Strategic Watch-out

Retail Data Attached Impressions

Highest value in the market, clearing roughly 40% above untargeted inventory because the impression connects to a subsequent transaction. Only sellers owning both retail relationships and streaming audience hold it completely. The twelve-point range separates first-party data ownership from licensed partnership arrangements. Completeness is the moat.
Gross Margin: 66% to 78%

Live Sports Streaming Inventory

The only genuinely scarce supply, growing at 15.4% and clearing at multiples of general inventory. Seller economics are worse than the prices suggest, since rights obligations are fixed while advertising revenue is not. The fourteen-point range reflects enormous variation in what platforms paid for rights.
Gross Margin: 38% to 52%

Home Screen Platform Inventory

Inherently advantaged supply carrying no content cost at all, seen by every viewer regardless of which service they open. Growth follows device installed base rather than content investment. Competition comes from television manufacturers expanding their own operating system share of American screens. Content cost is entirely absent.
Gross Margin: 60% to 70%

General Ad Tier Streaming Supply

The strategic watch-out. Every tier launch adds impressions faster than budgets grow, roughly 31% clears no demand monthly, and effective prices fall 9.4% annually against fixed programming cost. The fourteen-point range reflects the gap between original programming amortisation and licensed library economics. Supply keeps arriving anyway.
Gross Margin: 30% to 44%

How Advertiser Spending Recurs

Advertiser commitment in this market is far weaker than the revenue figures imply. Upfront commitments cover a declining share of connected television spending, and the remainder moves programmatically on decisions taken weeks or days ahead. That gives sellers very little forward visibility, and it means a soft quarter for advertiser budgets translates into unsold inventory almost immediately rather than after any contractual lag.
Stickiness varies sharply by buyer type. Performance advertisers using retail data return continuously because the measured outcome justifies it, and they are the most durable demand in the medium. Brand advertisers are the least committed, holding budgets back over duplication concerns and returning only for live events where reach is unambiguous. Mid-market self-serve buyers behave differently again, spending small amounts frequently with almost no negotiation.

The buyer profile has broadened rather than shifted. National brand teams still buy the largest campaigns, but performance marketing functions now control a growing share, and roughly 19% of impressions clear against advertisers who never bought television at all before self-serve tools existed. Sellers organised around national upfront selling are structured for the part of the market that is shrinking.
usa-connected-tv-market-end-use-penetration-index-1790006639083

Where This Market Rewards

These are among the four positions where our research anticipates prominent divergence between winners and laggards over the coming forecast period. Each is grounded in the demand model, the regulatory perimeter, and the announced capacity pipeline.
01 / PRICE DISCIPLINE PRACTICE

Clearing cheap teaches every buyer to wait

Roughly 31% of available impressions clear no demand in a given month, and sellers who cut floors to move them establish an expectation that depresses realised price across the entire book afterwards. Those maintaining floor discipline and accepting visible unsold volume report effective prices 14% to 22% above competitors with comparable audiences. The cost is looking wasteful in an internal review, which is precisely why the discipline stays rare and keeps working, and why buyers reward the sellers who never blinked.
02 / OUTCOME SIGNAL OWNERSHIP

Audience is abundant, purchase data is not

Effective prices fall about 9.4% a year because impressions are plentiful and getting more so, while campaigns carrying retail purchase data clear roughly 40% above untargeted inventory because they answer a question television never could. Sellers without a first-party transaction signal must license one on terms that hand away most of the premium. Owning an outcome signal is the only attribute in this market that abundance does not steadily erode, which is why concentration among sellers keeps rising rather than falling.
03 / MID-MARKET DEMAND CREATION

Self-serve brought genuinely new money in

Minimum spends and insertion order processes built for national brands excluded local and regional advertisers from television entirely, and removing them produced demand that had never existed rather than budget moved from somewhere else. Around 19% of impressions now clear against buyers new to the medium altogether. Effective prices are lower per impression while incremental margin on otherwise unsold inventory is considerably better, which changes the calculation completely, because these impressions would otherwise have cleared nothing at all in any given month.
04 / MEASUREMENT HONESTY DISCIPLINE

Deduplication shrinks you before it pays you

Campaigns reach the same household across 4.8 applications on average while aggregate reporting counts each separately, so advertisers buying incremental reach receive frequency and have started discounting claimed figures accordingly. Sellers joining credible cross-platform measurement lose flattering audience numbers and gain brand budgets currently withheld, with early movers reporting brand share of revenue rising 8 to 13 points. Looking smaller first is the entry price, and very few sellers have been willing to pay it so far, and the advantage goes to whoever moves before the rest.

Engagement Snapshot From the Field

A live engagement with an industry participant carrying material or product regulatory and market exposure ahead of a defining policy shift, showing how our research translates into a defensible multi-year portfolio strategy.
MARKET MINDS ADVISORY · CLIENT ENGAGEMENT SUMMARY
USA Connected TV Producer Strategic Portfolio Review and Transition Roadmap 2026·Investment Scenario on USA Connected TV Exposure Evaluation 2025-26
CLIENT PROFILE
A national streaming service with approximately 34 million United States subscribers, of whom around 40% had moved onto an advertising supported tier following a price increase on the ad-free plan. Annual advertising revenue stood near USD 780 million (client-reported, unverified by MMA). Impression supply had roughly doubled in eighteen months while advertising revenue had grown far more slowly.
STRATEGIC CHALLENGE
Management had presented ad tier migration as a growth story while realised price per thousand impressions fell in every quarter since launch, and the combined revenue per subscriber across both tiers was now below the pre-migration figure. Nobody internally had modelled whether continued migration improved or worsened total revenue. The migration had been presented externally as growth.
MMA APPROACH
MMA modelled combined subscription and advertising revenue per account across migration scenarios, measured realised price against rate card by demand source, and tested whether floor discipline, outcome data partnerships, or self-serve access offered the strongest available response to the oversupply the service had created for itself. Rate card variance was decomposed by demand source.
KEY FINDINGS
  1. Combined revenue per account fell 11% across the migration period, because advertising revenue per ad tier subscriber recovered only part of the subscription revenue given up.
  2. Realised price sat 38% below the published rate card once make-goods, volume discounts, and unsold inventory clearing were all properly accounted for.
  3. Roughly 34% of available impressions cleared no demand monthly, and floor reductions introduced to move them had measurably depressed pricing on previously stable demand.
  4. A retail data partnership would raise effective prices on roughly a quarter of inventory by an estimated 33%, at the cost of sharing a substantial share of that premium.
CLIENT PROFILE
A national streaming service with approximately 34 million United States subscribers, of whom around 40% had moved onto an advertising supported tier following a price increase on the ad-free plan. Annual advertising revenue stood near USD 780 million (client-reported, unverified by MMA). Impression supply had roughly doubled in eighteen months while advertising revenue had grown far more slowly.
STRATEGIC CHALLENGE
Management had presented ad tier migration as a growth story while realised price per thousand impressions fell in every quarter since launch, and the combined revenue per subscriber across both tiers was now below the pre-migration figure. Nobody internally had modelled whether continued migration improved or worsened total revenue. The migration had been presented externally as growth.
MMA APPROACH
MMA modelled combined subscription and advertising revenue per account across migration scenarios, measured realised price against rate card by demand source, and tested whether floor discipline, outcome data partnerships, or self-serve access offered the strongest available response to the oversupply the service had created for itself. Rate card variance was decomposed by demand source.
KEY FINDINGS
  1. Combined revenue per account fell 11% across the migration period, because advertising revenue per ad tier subscriber recovered only part of the subscription revenue given up.
  2. Realised price sat 38% below the published rate card once make-goods, volume discounts, and unsold inventory clearing were all properly accounted for.
  3. Roughly 34% of available impressions cleared no demand monthly, and floor reductions introduced to move them had measurably depressed pricing on previously stable demand.
  4. A retail data partnership would raise effective prices on roughly a quarter of inventory by an estimated 33%, at the cost of sharing a substantial share of that premium.
RECOMMENDED STRATEGY
Phase 1: Phase one: restore floor pricing and accept the resulting unsold volume, halting the discount expectation that reduced floors had established among programmatic buyers. Phase 2: Phase two: enter a retail data partnership for targeted inventory, accepting shared premium as preferable to competing on audience size in an oversupplied market. Phase 3: Phase three: launch self-serve buying access for regional advertisers, absorbing surplus impressions with demand that national budgets were never going to cover.
OUTCOME
Realised price per thousand impressions rose 17% over the following three quarters while unsold inventory increased as expected (client-reported, unverified by MMA). Total advertising revenue grew 9% despite lower delivered impression volume. Self-serve buyers reached 14% of cleared impressions within a year of launch. Combined revenue per account stabilised for the first time since the tier launched.

Frequently Asked Questions

Foundational context covering the market sizes, CAGR, scope, country, region and competition that inform every finding below. This section is provided to cover basics and most often pre-purchase conversations, answered from the MMA Primary Research Dataset.

What is the current size of the USA Connected TV Market?

The market was worth USD 31.4 billion in 2025 and reaches USD 35.0 billion in 2026. Value covers advertising revenue on connected television inventory only.

How large will the USA Connected TV Market be by 2036?

MMA forecasts USD 103.0 billion by 2036, an increase of USD 68.0 billion across the forecast period. That represents 2.94 times the 2026 base of USD 35.0 billion.

What is the CAGR for the USA Connected TV Market 2026 to 2036?

The base case compound annual growth rate is 11.4%, with a bull case at 12.7% and a bear case at 10.2%. Historical growth from 2020 to 2025 ran at 10.1%.

Which segment is growing fastest?

Subscription streaming ad tiers grow at 17.1%, half again the market rate of 11.4%. Some 42% of streaming subscriptions now sit on an advertising supported plan.

Who are the major companies in the USA Connected TV Market?

Amazon, Google, Disney, Netflix, and Roku lead, holding 68% of advertising revenue between them. They occupy quite different positions across platforms, content, and retail data.

Which country is growing fastest?

Scope is limited to the United States, so growth is compared within it. Texas leads at 14.6%, on population growth and rapid mid-market advertiser adoption.

Report Segmentation Architecture

The full report scope spans multiple orthogonal segmentation dimensions, with cross-tabulated demand data provided for each dimension pair. Coverage extends further to regional breakdowns, trend trajectories, and the competitive detail needed to support segment-level decision-making.

By Inventory Source

  • Subscription Streaming Ad Tiers
  • Free Ad-Supported Streaming Channels
  • Device Platform and Home Screen Inventory
  • Virtual Pay Television Distributor Inventory
  • Broadcaster Owned Streaming Applications
  • Live Sports Streaming Inventory

By End-Use Industry

  • Retail and Consumer Packaged Goods
  • Automotive and Transportation
  • Financial Services and Insurance
  • Pharmaceutical and Healthcare
  • Technology and Telecommunications
  • Local and Regional Advertisers

By Commercial Dimension

  • Upfront Commitment Buying
  • Programmatic Guaranteed Deals
  • Private Marketplace Transactions
  • Open Exchange Biddable Supply
  • Self-Serve Direct Purchase
  • Retail Data Attached Campaigns

By Region

  • North America
  • East Asia
  • Western Europe
  • South Asia and Pacific
  • Latin America
  • Eastern Europe
  • Middle East and Africa

Scope, Methodology, and Coverage

Every figure in this report is reproducible from documented input assumptions. The scope below maps the historical period, the forecast horizon, the segmentation dimensions, and the countries covered, alongside the underlying primary and qualitative methodology.
Historical Period
2020 to 2025
Forecast Period
2026 to 2036
Base Year
2025 (USD billions; MMA Primary Research Dataset, September 2026)
Market Definition
This market covers advertising revenue generated on connected television inventory in the United States, including subscription streaming ad tiers, free ad-supported streaming channels, device platform and home screen inventory, virtual pay television distributor inventory, broadcaster owned streaming applications, and live sports streaming inventory. It excludes linear broadcast and cable advertising, consumer subscription fees, television hardware sales, and advertising on desktop or mobile devices.
Quantitative Units
USD billions, connected television advertising revenue
Segmentation Dimensions
Inventory source, end-use industry, commercial dimension, supply origin
Regions Covered
North America, East Asia, Western Europe, South Asia and Pacific, Latin America, Eastern Europe, Middle East and Africa
Countries Covered
United States; supply origin analysis covers Canada, Mexico, Colombia, Brazil, South Korea, China, Japan, Taiwan, Vietnam, India, Australia, United Kingdom, Ireland, Spain, France, Germany, Netherlands, Sweden, Poland, Romania, Ukraine, Israel, United Arab Emirates
Key Companies Profiled
Amazon, Google, Disney, Netflix, Roku, Warner Bros. Discovery, Paramount Global, NBCUniversal, Fox Corporation, Samsung, LG Electronics, Vizio, The Trade Desk, Magnite, PubMatic, Comcast, DirecTV, Philo, Crackle, Plex
Quantitative Methodology
Primary survey, n=3,800 respondents, Q4 2025, six countries; demand-side model with trade association cross-validation
Qualitative Methodology
47 expert interviews, Q4 2025; applied to validate demand model assumptions, identify emerging dynamics, and assess competitive positioning
Report Format
PDF and XLSX data workbook (Word format preview document)
Publisher
Market Minds Advisory
Report Code
MMA-2026-TEC-491
Published
September 2026
Contact
sales@marketmindsadvisory.com | www.marketmindsadvisory.com

Purchase the full USA Connected TV Market Report (2026 to 2036).

The full report sizes United States connected television advertising revenue across six inventory sources with forecasts to 2036 under base, bull, and bear cases. It examines why impression supply has outrun advertiser demand, what that does to realised pricing, and which positions hold value as abundance spreads. Competitive analysis covers twenty participants evaluated consistently on advertising revenue, with detailed treatment of retail data advantage, live rights economics, and home screen inventory margin structure. Cost structure, margin architecture by inventory source, and the supply origin map behind American connected television are analysed in full. Primary research includes 3,800 survey responses and 47 expert interviews.
Six inventory sources sized and forecast separately
Twenty participants evaluated on advertising revenue consistently
Supply origin mapping across seven global geographies
Margin architecture by inventory source and content cost
Realised price analysis against rate card by demand source
Household duplication and deduplicated reach benchmarks

Built For The People Who Decide

From boardroom strategy to bench-side execution, this report is read cover-to-cover by leaders shaping the next decade of their industry, turning demand scenarios, market dynamics and valuation benchmarks into decisions.
CXOs/ Presidents/ VPs/ Managers
M&A and Corporate Development
Strategy Teams and R&D Heads
Procurement and Product Directors
Regulatory and Compliance Leaders
Investor Relations and Equity Analysts