Market Minds Advisory
USA Compounding Pharmacies Market

USA Compounding Pharmacies Market: An Industry Built On A List

Copying a commercial drug is lawful only while that drug sits on the shortage list, so entire product categories here are created and extinguished by an administrative entry nobody in the industry controls.

Lead Analyst

Published

September 2026

Make Smarter Decisions with Customized Research Insights

Request a free sample report and evaluate market opportunities, growth trends, and competitive dynamics relevant to your business needs.

2025 MARKET VALUE$14.2BMarket Size 2025
2036 FORECAST VALUE$35.2BBase Case , 2026 to 2036
CAGR 2026 TO 20368.6 %Bull 9.8% / Bear 7.4%
INCREMENTAL OPPORTUNITY$19.8BNet 10- year value creation
EXPANSION MULTIPLE2.28x2036 value over 2026 base
Strategic Levers
M&A Pipeline
Regional Outlook
Country Rankings
Competitive Intelligence
Segmental Deep-dive
Call-Us : 91 93563 13602

Executive Snapshot and Market Trajectory

Roughly 27% of preparation volume is permitted only while a commercial product remains on the shortage list. When a listing is resolved, that revenue becomes unlawful overnight rather than declining. No other regulated industry has its addressable market defined this way. Nothing else works this way.
North America takes 44% of value, well above the usual band, because compounding exists as a distinct regulated commercial category largely under American law rather than as a global phenomenon. Ready-to-administer syringes and bags grow at 12.9%, half again the market rate of 8.6%, on a nursing labour argument rather than any pharmacological one, saving roughly nine minutes per dose. Nursing shortages drive it. Workforce pressure decides adoption.
Concentration is low at 22% and the risk profile is unlike anything in adjacent sectors. A sterility failure here is a mass casualty event rather than a recall, which the 2012 fungal meningitis outbreak established permanently and which still shapes inspection, insurance and customer diligence throughout the industry today. Outsourcing facilities therefore carry pharmaceutical manufacturing compliance obligations while selling at preparation prices with no exclusivity protecting anything they produce. Nothing protects the output.
Market Definition
The market covers pharmaceutical compounding by registered pharmacies and outsourcing facilities, including sterile injectable preparations, ready-to-administer syringes and bags, non-sterile oral and topical preparations, hormone and bioidentical preparations, ophthalmic and intrathecal preparations, and veterinary and animal health preparations. Commercial pharmaceutical manufacturing under approved applications, retail dispensing of finished products, clinical trial supply, and medical device reprocessing are excluded from scope.
Base Year Value
$14.2B in 2025 (MMA Primary Research Dataset, August 2026)
Forecast Period
2026 to 2036, eleven discrete annual values
CAGR
8.6% base case. Bull 9.8%. Bear 7.4%.
Fastest Growth Segment
Ready-to-Administer Syringes and Bags: 12.9% CAGR
Fastest Growth Country
India: 10.7% CAGR
Fastest Growth Region
South Asia and Pacific: 10.8% CAGR
Largest Region
North America: 44% of 2025 global value
Market Leaders
QuVa Pharma, SCA Pharmaceuticals, Fagron, Leiters Health, Nephron Pharmaceuticals. Source: MMA Analysis based on disclosed compounding and outsourcing facility revenue, company annual reports 2025.
Primary Survey
n=3,800 procurement and R&D decision-makers, Q4 2025, six countries
Methodology
Demand-side build-up, cross-validated against public data, 47 expert interviews

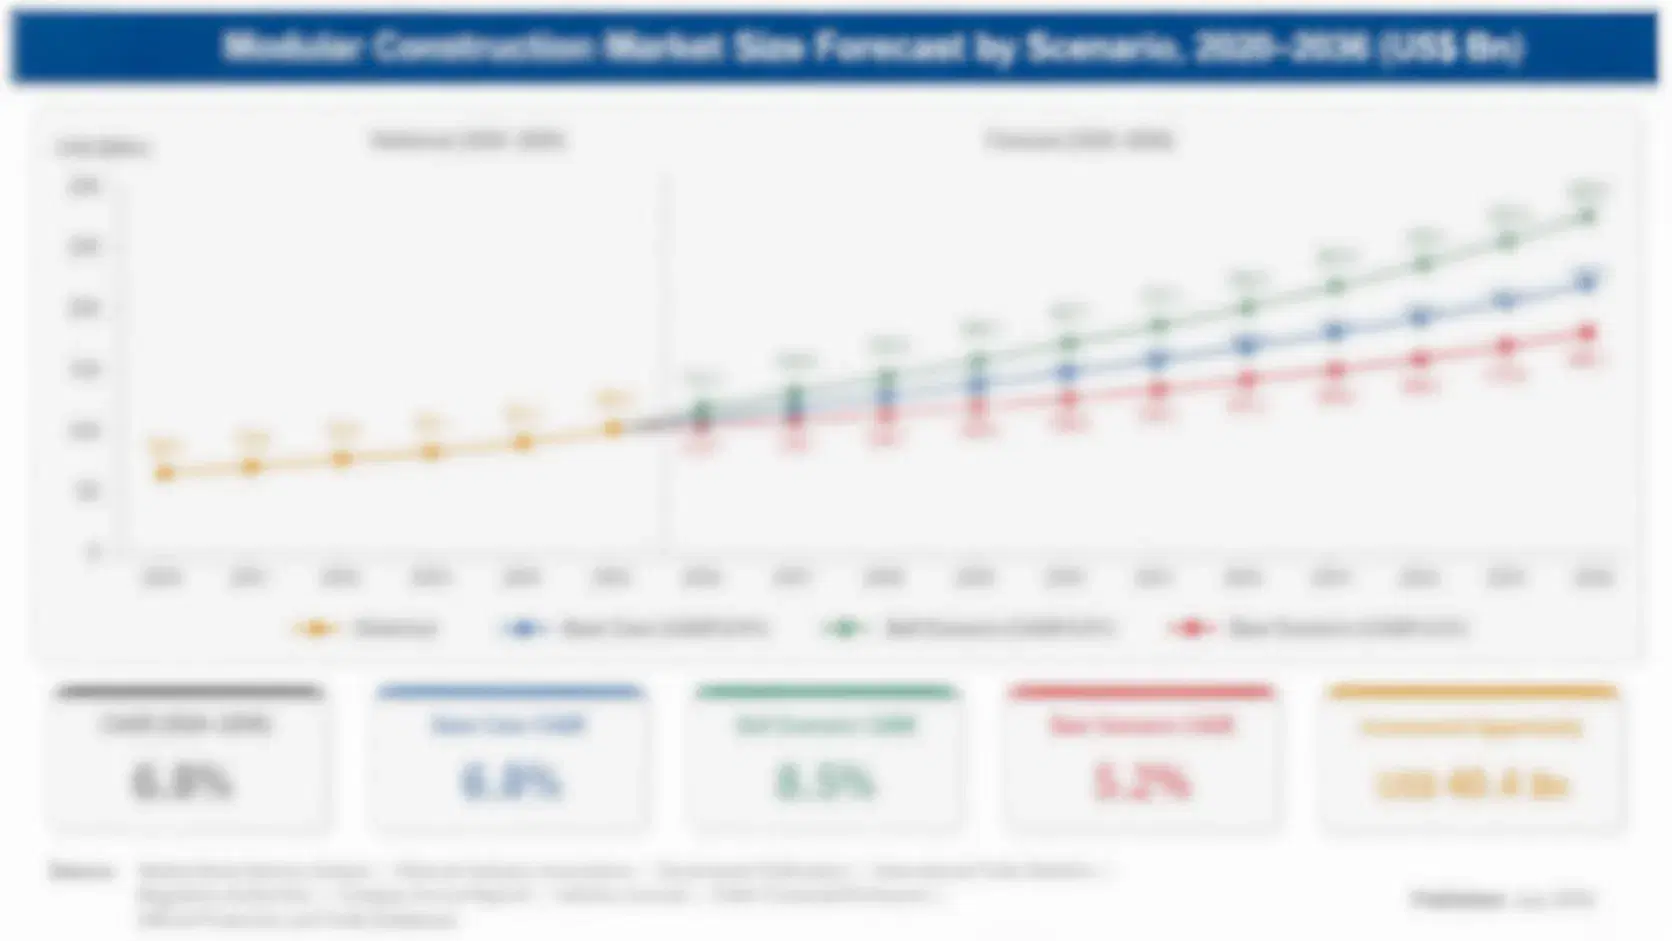
USA Compounding Pharmacies Market Forecast Scenarios

usa-compounding-pharmacies-market-size-forecast-scenario-1787702378434
Growth from 2020 to 2025 ran at 7.4% and shortage-driven volume made the period considerably more volatile than that figure suggests. Injectable shortages during and after the pandemic pushed hospital demand toward outsourcing facilities heavily. A large weight-management product category appeared and then closed entirely when the underlying shortage listings were resolved, which demonstrated to everybody how fast an addressable market here can disappear.
The 8.6% base case rests on three mechanisms. Ready-to-administer presentations keep displacing bedside preparation because they remove nursing time and dosing error rather than because they change any therapy. Ophthalmic and intrathecal preparations keep growing where no commercial equivalent exists at the concentration clinicians need. And unmet formulation demand keeps expanding across paediatric dosing, allergen-free excipients and discontinued products nobody will manufacture commercially. None of the three depends on any shortage listing standing.
The bull case at 9.8% assumes persistent injectable shortages keep hospital demand elevated and ready-to-administer adoption accelerates on nursing workforce pressure. The bear case at 7.4% is shortage listings resolving broadly while regulatory scrutiny of copies tightens, which would remove a substantial share of permitted volume without any corresponding fall in the fixed compliance cost these facilities carry.

When The Listing Resolves

Copying a commercially available drug is lawful here only while that product sits on the shortage list, which makes an administrative entry the single largest determinant of what this industry may sell. Roughly 27% of preparation volume depends on such listings. When one resolves, the revenue does not decline gradually; it becomes unlawful. A recent weight-management category appeared, scaled rapidly and closed entirely on exactly that mechanism.
FIVE-FIRM CONCENTRATION22%Share of compounding revenue held by the largest registered operators
READY-TO-ADMINISTER UNIT PRICE$38Typical hospital price for a prepared single dose presentation
TOP MARKET COUNTRYUS 64%American share of global regulated compounding preparation revenue
SHORTAGE LIST DEPENDENCY27%Preparation volume permitted only while a shortage listing stands
NURSING TIME SAVED9 minutesTime removed per dose by ready to administer presentation
INSPECTION INTERVAL18 monthsTypical interval between regulatory inspections of registered facilities
The growth that does not depend on shortages rests on nursing time rather than on medicine. A ready-to-administer syringe removes roughly nine minutes of preparation per dose and eliminates a step where dosing errors occur, which is a workforce and safety argument that hospital pharmacy directors accept immediately. It costs more per unit than a vial and less per administration once nursing time is counted, and that arithmetic is what actually sells it.
Risk here is asymmetric in a way that shapes everything. A sterility failure is not a recall but a mass casualty event, as the 2012 fungal meningitis outbreak established at terrible cost and as the regulatory framework built afterwards reflects. Facilities therefore carry manufacturing compliance obligations while selling at preparation prices.
"An entire billion-dollar category existed because of a line on a shortage list, and stopped existing when that line was removed. Try building a five-year plan around that."
Director, Pharmacy Services and Compounding Practice · MMA Healthcare Practice · August 2026

Market Trends

Shortage Listings Create And Extinguish Entire Categories

Compounders may prepare copies of commercially available drugs only while those products are listed as in shortage, which means an administrative decision defines what is lawful to sell. Roughly 27% of volume depends on that condition. A large weight-management category appeared and closed entirely when the relevant listings resolved, which is not a demand event but a legal one. Operators building capacity against shortage volume are constructing fixed cost against revenue that can disappear with a published notice. Fixed compliance cost continues afterwards regardless of whether the permitted volume still exists at all.
Market Impact: Serves 3 genuinely unmet formulation needs

Ready-To-Administer Presentations Sell Nursing Labour Instead

A prepared syringe or bag removes roughly nine minutes of bedside preparation per dose and eliminates the step where most dosing errors occur, which is a workforce and safety argument rather than a therapeutic one. Growth at 12.9% follows nursing shortages more closely than it follows clinical practice. Unit cost exceeds a vial and total cost per administration falls once nursing time is properly counted, and hospital pharmacy directors do that arithmetic readily when it is put in front of them. Adoption tracks workforce pressure rather than clinical practice, which places the decision with operations rather than with pharmaceutical purchasing.
Market Impact: Serves 2 routes without alternatives

Market Opportunities and Growth Drivers

Unmet Formulation Demand Has No Commercial Alternative

Paediatric liquid presentations, allergen-free excipient formulations and discontinued products serve patients for whom no commercial manufacturer will ever produce anything, because the volumes cannot justify an approved application. That demand is stable, independent of shortage listings and largely immune to competitive displacement. It also carries better pricing than shortage-driven copies, since the comparison is against nothing at all rather than against a commercial product that will eventually return to supply. Formulation capability rather than preparation capacity is what serves it, and that takes years to build rather than months. Competitive displacement is rare.
Market Impact: Carries 2 cost bases at once

Ophthalmic And Intrathecal Preparations Lack Commercial Equivalents

Intravitreal, intracameral and intrathecal administration frequently requires concentrations, volumes or preservative-free presentations that no approved product provides, which makes compounding the only route rather than an alternative to one. Growth at 9.6% follows procedure volumes in ophthalmology and pain medicine. Sterility requirements are the most demanding in the sector, since these routes bypass every natural barrier, and that limits how many facilities can credibly serve the work at all. Credible participation is limited to facilities with genuine investment in environmental monitoring and testing programmes across their operations. Sterility requirements are the sector's most demanding.
Market Impact: Inspects every 18 months typically

Market Restraints and Challenges

Compliance Costs Match Manufacturing Without Manufacturing Prices

Registered outsourcing facilities carry current good manufacturing practice obligations covering environmental monitoring, sterility testing and stability data at costs comparable to approved drug manufacture. Root cause is that the regulatory framework applied pharmaceutical standards to a sector selling at preparation prices. The commercial impact is thin margins on high fixed cost with no exclusivity protecting anything produced. Mitigation runs through scale and toward preparations where no commercial alternative exists, which few operators have executed properly. Scale alone has not solved it for anybody. Specialty preparation is the practical route out of it.
Market Impact: Governs 27% of permitted volume

Sterility Failure Carries Catastrophic Rather Than Commercial Consequence

A contamination event in sterile injectable preparation causes patient deaths rather than a product recall, which the 2012 fungal meningitis outbreak established and which the entire regulatory framework was built in response to. Root cause is that these preparations bypass every natural barrier and reach patients without further processing. The commercial impact is inspection intensity, insurance cost and customer diligence unlike any adjacent sector. Mitigation is capital investment in facilities and monitoring rather than anything procedural. Findings are published and customers read them. Capital rather than procedure addresses it properly.
Market Impact: Saves 9 minutes per dose
3 additional market trends, 4 additional growth drivers, and 2 additional restraints and challenges are covered in the full report. Contact sales@marketmindsadvisory.com to access the complete intelligence.

Segment CAGR and Growth Architecture

Segmentation follows preparation category: what is compounded and how it is presented, rather than which facility registration prepares it or which patient receives it. Six categories cover the market without overlap, spanning sterile and non-sterile work. Facility registration type and customer setting are treated as separate commercial dimensions throughout. Legal basis for preparation cuts across every category here.
usa-compounding-pharmacies-market-market-share-analysis-1787702378790

Ready-to-Administer Syringes and Bags

Growth at 12.9%, half again the market rate of 8.6%, rests on removing roughly nine minutes of nursing preparation per dose and eliminating the step where most dosing errors occur, which is a workforce and safety argument rather than a clinical one. Adoption tracks nursing shortages more closely than it tracks any change in therapy. Unit cost exceeds a vial while total cost per administration falls once nursing time is counted properly, and hospital pharmacy directors accept that arithmetic readily when somebody actually presents it. Contracts are sticky because changing supplier means requalification and workflow revalidation nobody schedules willingly. Operations rather than pharmacy purchasing makes the call, which changes who has to be persuaded and with what evidence.
CAGR 12.9%

Ophthalmic and Intrathecal Preparations

Intravitreal, intracameral and intrathecal routes frequently require concentrations, volumes or preservative-free presentations that no approved commercial product provides, which makes compounding the only available route rather than a substitute for one. Growth at 9.6% follows ophthalmology and pain medicine procedure volumes directly. Sterility requirements are the most demanding anywhere in the sector because these routes bypass every natural barrier the body has, and that limits credible participation to facilities with genuine investment in monitoring and testing. Nothing else serves these patients, which means pricing here is set against no alternative at all rather than against a commercial product that will eventually return to supply. Procedure volumes drive it directly. Facilities are few.
CAGR 9.6%
Full segment breakdown across 6 segments available in the complete report.

Regional Architecture and Country Demand Map

Geography follows regulatory structure rather than clinical need, because compounding exists as a distinct commercial category chiefly under American law. North America dominates, and India grows fastest across the forecast period. Two regions sit outside the standard bands for that same reason, and both are flagged in this analysis.

North America

The 44% share sits far above the standard band because the outsourcing facility framework created after 2013 established compounding as a distinct regulated commercial category that has no direct equivalent elsewhere. Roughly 64% of global preparation revenue is American. Shortage listings determine what may lawfully be copied, which makes an administrative decision the largest single variable in the sector. Ready-to-administer adoption is furthest advanced here, driven by nursing workforce pressure that hospital pharmacy directors experience directly and continuously. Sterility assurance history functions as a commercial gate at the largest accounts, eliminating suppliers from consideration well before any pricing discussion begins. Nothing else opens those accounts. Audit history opens every account, and pricing follows rather than leading the conversation.
Share: 44% | CAGR: 7.8% (2026 to 2036)

Western Europe

Hospital pharmacy aseptic units perform much of this work in-house under national pharmacy law rather than through a separate commercial outsourcing sector, which limits the size of the addressable commercial category considerably. Fagron holds a strong European position in compounding pharmaceuticals and raw materials. Ready-to-administer preparations are growing where hospital aseptic capacity is constrained. Regulatory frameworks differ substantially between countries, so a pan-European commercial model is considerably harder to build than an American one. Unmet formulation demand for paediatric and allergen-free preparations is substantial and served largely through hospital pharmacy rather than commercially. Commercial models are harder to build across fragmented national frameworks, and no operator has assembled a genuinely pan-European position.
Share: 18% | CAGR: 7.0% (2026 to 2036)
Regional intelligence for 5 additional markets available in the complete report: East Asia, South Asia and Pacific, Latin America, Middle East and Africa, Eastern Europe. Contact sales@marketmindsadvisory.com.
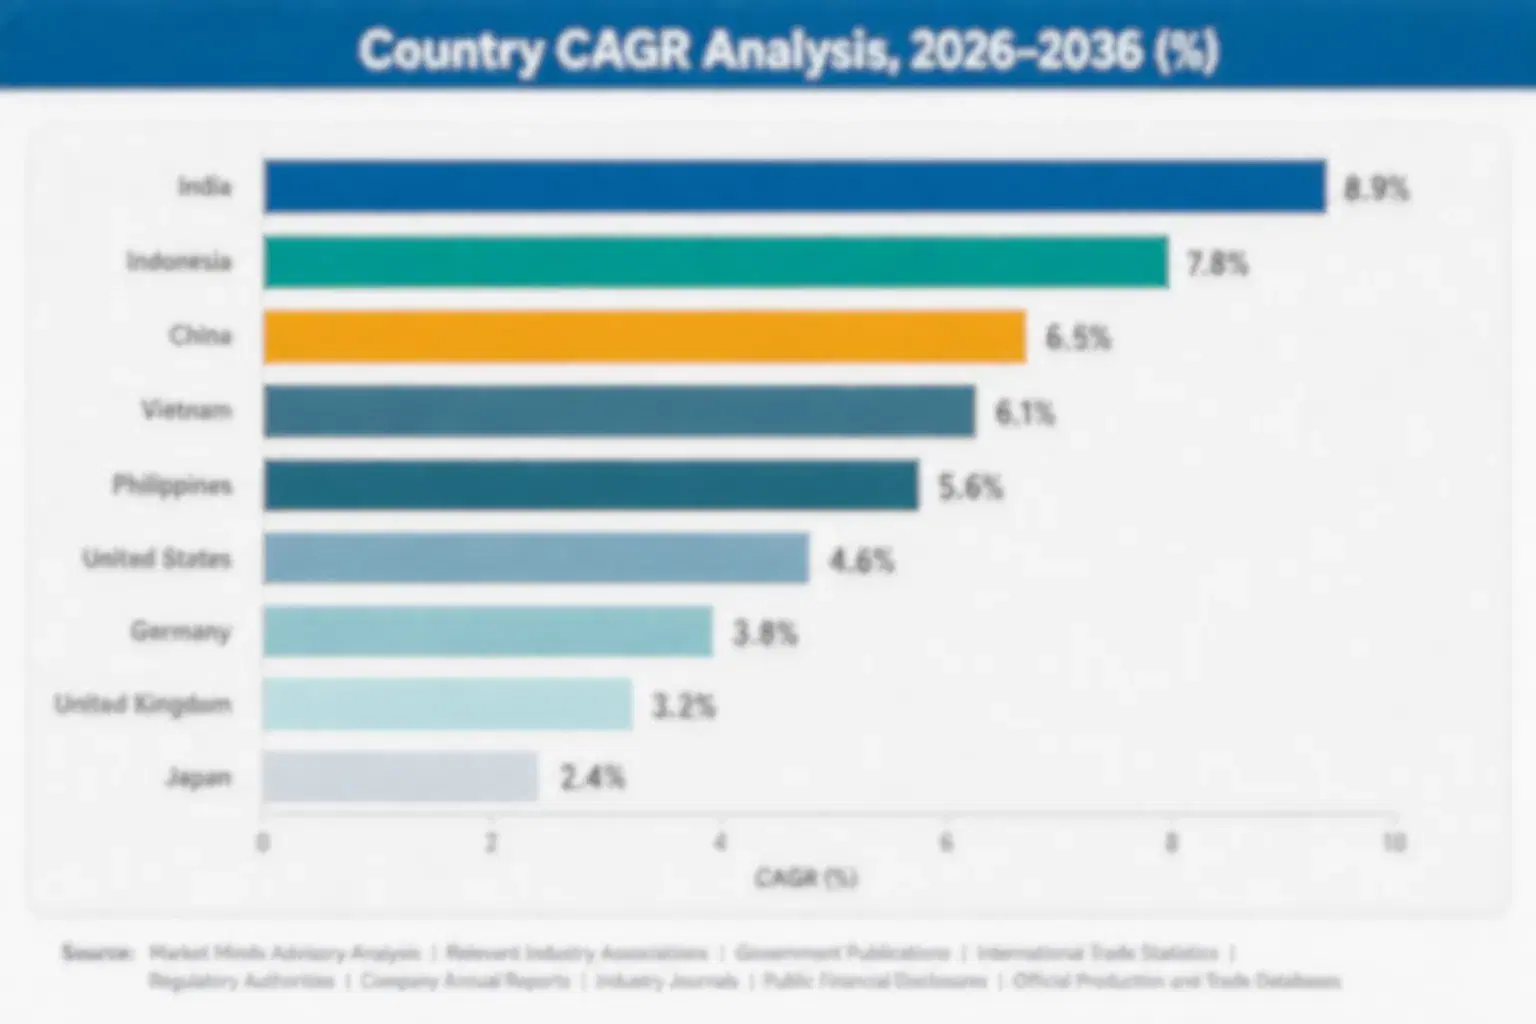
usa-compounding-pharmacies-market-country-cagr-analysis-1787702379063

Building Beyond The Shortage List

Roughly 27% of volume depends on shortage listings that can resolve without warning, ready-to-administer saves about nine minutes of nursing time per dose, compliance costs match manufacturing, and sterility failure is catastrophic. Four levers work on revenue durability, labour economics, unmet need and facility investment rather than on price. Growth and durability pull in opposite directions.

Shift Revenue Weight Away From Shortage Dependence

Around 27% of preparation volume is lawful only while a commercial product remains listed as in shortage, and when a listing resolves that revenue becomes unlawful rather than declining gradually. Operators who built capacity against shortage volume carry fixed cost against revenue that a published notice can remove entirely. Deliberately weighting the portfolio toward preparations with no commercial equivalent produces slower growth and revenue that cannot be legislated away overnight. Growth slows and the revenue survives. A published notice removes it otherwise, and no amount of capacity or pricing changes that outcome at all.
Market Impact: Reduces exposure below the whole 27% listing dependence

Sell Ready-To-Administer On Nursing Labour Economics

A prepared syringe costs more than a vial and removes roughly 9 minutes of nursing preparation per dose while eliminating the step where most dosing errors occur. Operators quoting unit price against vial price lose an argument they should win comfortably. Presenting total cost per administration including nursing time reaches hospital pharmacy directors managing genuine workforce shortages, and that is a conversation about staffing rather than about pharmaceutical purchasing at all. Nursing time data from the customer's own wards is what makes that case, and almost nobody collects it. Staffing decides it.
Market Impact: Removes 9 nursing minutes from every single dose

Build Positions Where No Commercial Product Exists

Paediatric liquid presentations, allergen-free formulations, preservative-free ophthalmic preparations and discontinued products serve patients no commercial manufacturer will ever supply, because the volumes cannot justify an approved application anywhere. That demand is stable, independent of any shortage listing and priced against nothing rather than against a returning commercial product. It requires formulation capability rather than capacity, and 3 of these categories are materially underserved today. Formulation capability takes years to build and cannot be purchased quickly, which is exactly why the position holds once established. Nothing displaces a preparation that has no alternative.
Market Impact: Serves 3 of the most underserved formulation categories

Invest In Sterility Assurance As Commercial Differentiation

A contamination event here causes patient deaths rather than a recall, and customer diligence reflects that history directly. Facilities with genuine investment in environmental monitoring, isolator technology and stability programmes pass hospital audits that eliminate competitors from consideration entirely. Inspection runs roughly every 18 months and findings are public. Treating sterility assurance as a commercial asset rather than a compliance cost changes which accounts are reachable at all. Facilities without that investment are simply not considered by the largest accounts, whatever they quote. Inspection findings are published and prospective customers read them before quoting begins.
Market Impact: Withstands the whole 18 month inspection cycle properly

Who Controls the Margin Pool

Measured on disclosed compounding and outsourcing facility revenue, the five largest operators hold a CR5 of just 22%, which reflects a sector where facility registration and regional hospital relationships matter more than national scale. QuVa, SCA Pharmaceuticals and Leiters hold substantial outsourcing facility positions, Nephron combines compounding with generic manufacturing, and Fagron leads in compounding pharmaceuticals and raw material supply internationally. Facility registration and inspection history matter more than national footprint.
Three contests define activity. Shortage substitution competes on speed to prepare and on capacity, and it disappears when listings resolve. Ready-to-administer supply competes on hospital contracting and on demonstrating nursing time savings. And specialty preparation for routes with no commercial equivalent competes on sterility assurance and formulation capability, which is the most defensible position available. An operator organised for one of those contests is rarely equipped for the others, and the capability each requires overlaps very little with the rest.

Pressure builds as shortage-dependent revenue proves unreliable and as compliance costs rise without corresponding pricing power. Rankings shift toward operators weighted to unmet formulation need and toward those whose facilities pass hospital audits others fail. Scale matters less here than the inspection record does. The audit record decides it.
usa-compounding-pharmacies-market-company-positioning-matrix-1787702379366

Competitive Moat and Risk Dimensions

QUVA PHARMA

Moat: Outsourcing Facility Scale Compliance

QuVa operates registered outsourcing facilities at a scale that supports the environmental monitoring, stability programmes and quality systems hospital audits demand, which eliminates many smaller competitors from consideration before price is ever discussed. That infrastructure requires capital and sustained inspection history rather than clinical capability. A hospital pharmacy director choosing a supplier is buying an audit outcome first.
QUVA PHARMA

Risk: Shortage Listing Revenue Exposure

A meaningful share of outsourcing facility volume depends on commercial products remaining listed as in shortage, and resolution removes that revenue by law rather than by competition. Scale in preparation capacity provides no protection whatever against an administrative decision. Fixed compliance cost continues regardless of whether the permitted volume still exists.
FAGRON

Moat: Raw Material And Formulation Depth

Fagron supplies compounding pharmaceuticals and raw materials internationally alongside its own preparation activity, which gives it a position across multiple regulatory frameworks rather than dependence on any single one. Formulation expertise and material supply travel between jurisdictions in a way that facility registration does not. That breadth is difficult for a nationally focused operator to replicate at all.
FAGRON

Risk: Fragmented Regulatory Framework Exposure

Operating across many jurisdictions means complying with materially different rules in each, and a favourable framework in one country provides nothing in another. Compounding regulation differs so substantially between markets that scale delivers less than it would in an approved pharmaceutical business. Breadth spreads risk without producing corresponding operating advantage.

Players Tracked

Prominent Players

QuVa Pharma
SCA Pharmaceuticals
Fagron
Leiters Health
Nephron Pharmaceuticals

Other Key Players

Empower Pharmacy
Olympia Pharmaceuticals
Central Admixture Pharmacy Services
Wells Pharma
STAQ Pharma
Long Grove Pharmaceuticals
Medisca
PCCA
Baxter International
ICU Medical
Hikma Pharmaceuticals
Harrow
Edge Pharma
Asteria Health
Belcher Pharmaceuticals

Recent Developments

JANUARY 2025

Shortage listing resolution closes a large compounded product category

Resolution of shortage listings for a widely compounded product category removed the legal basis for preparing copies of it, a regulatory determination rather than any corporate transaction. Operators who had built capacity against that volume carried the fixed cost afterwards with no permitted revenue against it at all.
Signal: An administrative listing decision removes revenue by law rather than through any competitive process. Nothing else does.
JUNE 2025

Hospital network standardises on ready-to-administer sterile preparations

A hospital network moved a substantial portion of bedside preparation to ready-to-administer presentations supplied by an outsourcing facility, a procurement decision rather than any corporate event. Nursing workforce shortages and dosing error reduction carried the business case rather than any pharmaceutical or therapeutic consideration. Pharmacy purchasing was not the decider.
Signal: Ready-to-administer sells on staffing economics, which places the decision with operations rather than pharmacy purchasing. Operations decides it.
SEPTEMBER 2025

Inspection findings remove a facility from hospital approved supplier lists

Published inspection findings at a registered facility led several hospital systems to suspend it from approved supplier lists, a customer diligence response rather than any regulatory enforcement action. Sterility assurance history rather than pricing had determined which suppliers remained eligible for consideration at those institutions.
Signal: Inspection record functions as a commercial gate here, eliminating suppliers before price is ever discussed. Findings are public immediately.

What Preparation Actually Costs

Quality infrastructure dominates in a way that surprises people coming from adjacent sectors. Cleanroom operation, environmental monitoring, sterility and endotoxin testing, and stability programmes account for 34 to 43% of sterile preparation cost, before any active ingredient is considered. Active pharmaceutical ingredients and containers add substantially more. Non-sterile preparation carries a fraction of that overhead, which is why the two businesses behave nothing alike commercially.
The volatility that mattered was active ingredient availability and skilled labour cost together. Ingredient supply interruptions during shortage periods raised input costs precisely when demand peaked, which is the worst possible sequence. Compounding pharmacist and technician wages rose sharply through 2022 and 2023 across American markets. Energy costs for continuously operating cleanroom environments also rose, which IEA industrial energy price data records across the same period.

Exposure divides by preparation mix rather than by scale. Operators weighted toward sterile injectable work carry the full quality infrastructure cost against pricing that carries no exclusivity at all. Those with non-sterile and formulation-led portfolios carry far lower overhead and better pricing against products that do not otherwise exist. Shortage-dependent operators carry fixed cost against revenue that a regulatory listing decision can remove entirely.
usa-compounding-pharmacies-market-cost-volatility-analysis-1787702379721

Weight the portfolio toward unmet formulation demand

Preparations serving patients no commercial manufacturer will supply are priced against nothing at all rather than against a product that returns to supply when a shortage resolves. That revenue is stable, independent of listings and defensible on formulation capability. It grows more slowly than shortage substitution and it does not vanish when an administrative notice is published somewhere.

Price ready-to-administer on total administration cost

A prepared syringe costs more than a vial and removes roughly nine minutes of nursing preparation while eliminating the step where most dosing errors occur. Quoting unit price against vial price loses an argument that total cost per administration wins comfortably. It requires nursing time data from the customer's own wards, which most operators never bother to collect.

Treat sterility investment as commercial qualification

Hospital audits eliminate suppliers on inspection history and quality systems before pricing is ever discussed, which makes environmental monitoring and isolator investment a route to market rather than a compliance overhead. Facilities without it are simply not considered by the largest accounts. Published inspection findings are visible to every prospective customer immediately. Investment therefore buys access rather than merely compliance.

Portfolio Architecture for Margin Defence

Margin follows whether a commercial alternative exists, which is a cleaner rule than in most healthcare categories. Shortage substitution earns well while a listing stands and nothing at all afterwards. Non-sterile oral and topical work earns modestly on low overhead. Hormone preparations earn steadily through repeat patient demand. Ready-to-administer earns well on hospital contracts. Ophthalmic, intrathecal and unmet formulation work earns most, because nothing else serves those patients at all.
The tension is between revenue that grows fast and revenue that persists. Shortage substitution scales quickly, requires capacity rather than capability and can be removed by a published notice. Unmet formulation work grows slowly, requires genuine formulation expertise and cannot be legislated away because no commercial product exists to displace it. Operators optimising for growth build the first, and several have discovered exactly what that means.

High-value pools sit in three places. Preparations for routes and populations with no commercial equivalent, which are priced against nothing. Ready-to-administer supply sold on nursing economics rather than unit price. And sterility assurance investment, which functions as a commercial gate at the largest hospital accounts rather than as a compliance cost.

Volume / Commodity-Adjacent

Shortage substitution copies of commercial products and standard non-sterile oral and topical preparations. The 9-point range is wide because shortage volume prices well while a listing stands and collapses to nothing once it is resolved.
Gross Margin: 17-26%

Premium / Certified

Ready-to-administer syringes and bags together with hormone and veterinary preparations supplied under hospital or clinic contracts. The 10-point spread separates operators demonstrating nursing time savings from those quoting unit price against vial cost.
Gross Margin: 33-43%

Sustainability / Regulatory / Next-Generation

Ophthalmic and intrathecal preparations, paediatric and allergen-free formulations, and discontinued product supply. The 24-point range is wide because sterility requirements and formulation difficulty vary enormously across these categories. Formulation difficulty separates them further still.
Gross Margin: 44-68%
usa-compounding-pharmacies-market-portfolio-architecture-1787702380015

High-value Sub-segments and Strategic Watch-out

Preparations Without Commercial Equivalents

Highest margin and most defensible, because these serve patients no manufacturer will ever supply and are priced against nothing rather than any returning product. The risk is that formulation capability rather than capacity is required, which takes years to build and cannot be purchased quickly.
Gross Margin: 58-68%

Ready-To-Administer Hospital Supply

Fastest growth at 12.9% on nursing workforce economics rather than any clinical change. The risk is that adoption depends on operators actually presenting total administration cost, and most continue quoting unit price against vial cost and losing arguments they should win. Data collection is the barrier.
Gross Margin: 37-44%

Standard Sterile Preparation

The volume core, carrying quality infrastructure cost against pricing with no exclusivity of any kind. Operators hold it because it supports facility utilisation and because hospital relationships begin here before extending into higher value specialty work. Utilisation depends on it, and relationships start there before extending anywhere.
Gross Margin: 22-29%

Shortage Listing Dependence

The strategic watch-out. Roughly 27% of volume is lawful only while a listing stands, and resolution removes that revenue by law rather than through competition. The risk is fixed compliance cost continuing against permitted volume that has simply ceased to exist. Nothing replaces it afterwards.
Gross Margin: 24-31%

Revenue That Can Be Withdrawn

Two demand patterns coexist and only one of them is dependable. Shortage-driven volume arrives quickly, scales with capacity and can be removed by a published administrative notice at any point, which is a risk no other pharmaceutical business carries in quite this form. Unmet formulation demand arrives slowly, grows with clinical relationships and persists because no commercial product exists to displace it. Most operators are weighted toward the first.
Stickiness follows the same division precisely. A hospital using ready-to-administer preparations under contract continues because changing supplier means requalifying a supplier and revalidating a workflow. A clinic depending on a preservative-free ophthalmic preparation has no alternative source at all. Shortage substitution is not sticky in any respect, since the commercial product returns and the compounded copy becomes unlawful the same week.

The decision maker varies by category and most operators address only one. Hospital sterile supply is decided by pharmacy directors weighing audit history, price and nursing time together. Specialty preparations are decided by ophthalmologists, oncologists and pain specialists who need something that does not otherwise exist. Unmet formulation demand reaches paediatricians and allergy specialists directly. Three quite different conversations, and audit history opens all of them.
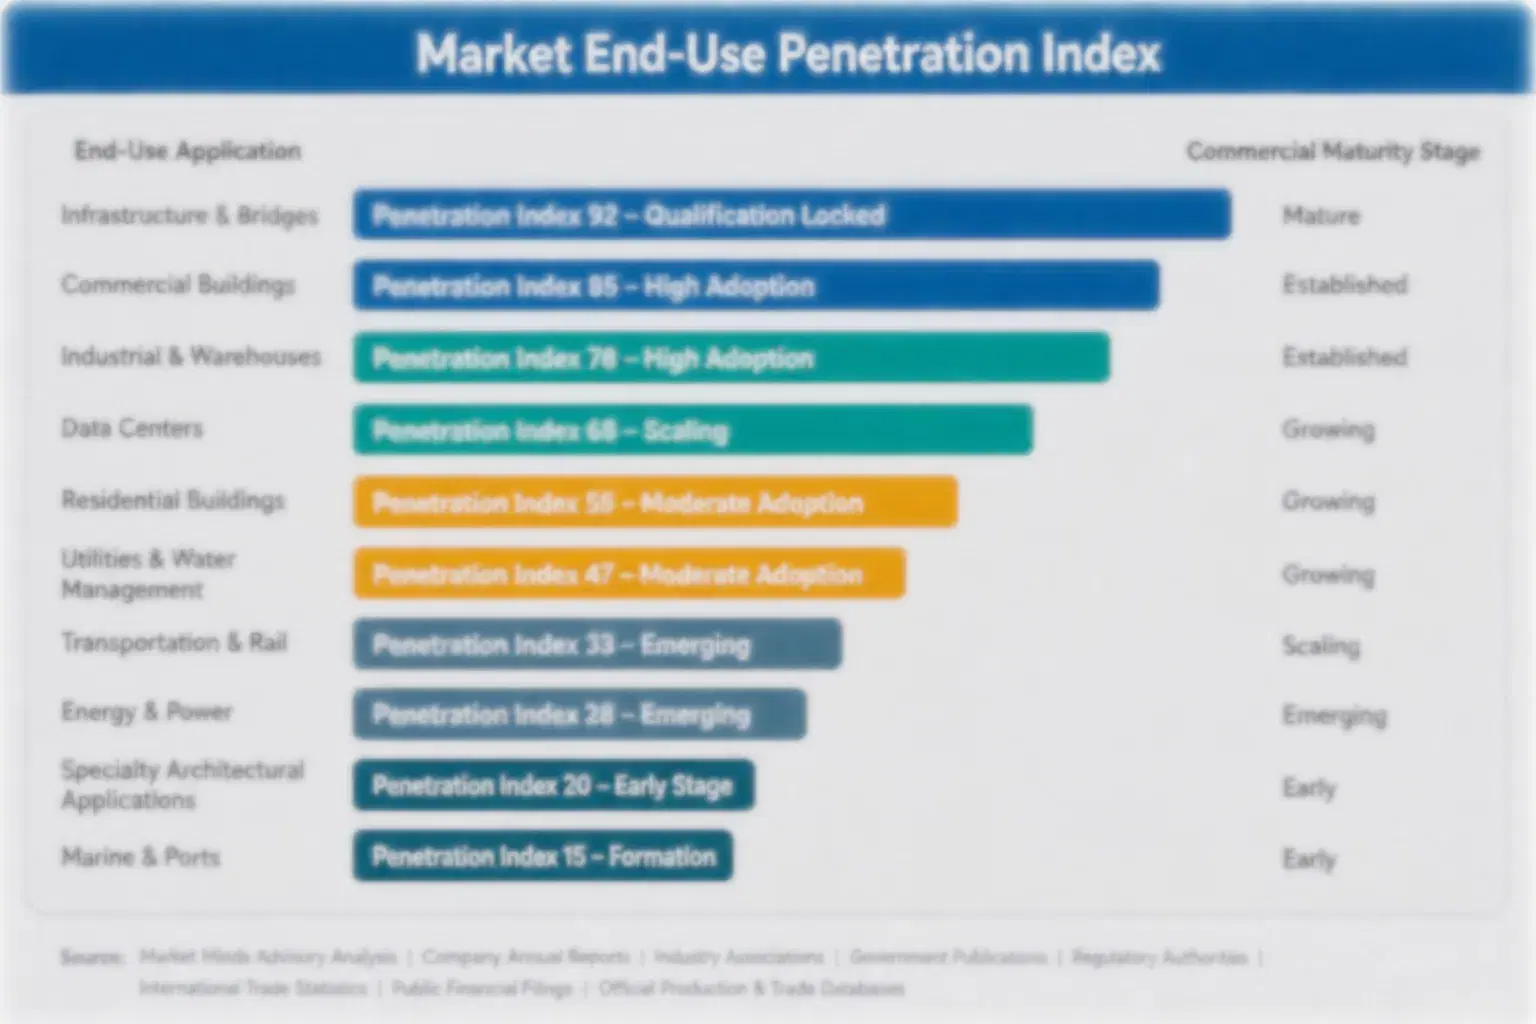
usa-compounding-pharmacies-market-end-use-penetration-index-1787702380332

Building Revenue That Persists

These are among the four positions where our research anticipates prominent divergence between winners and laggards over the coming forecast period. Each is grounded in the demand model, the regulatory perimeter, and the announced capacity pipeline.
01 / LISTING DEPENDENCE REDUCTION

A notice can end the category overnight

Roughly 27% of all preparation volume is lawful only while a commercial product remains listed as being in shortage, and when a listing resolves, that revenue becomes unlawful rather than simply declining away over time. Operators who have built capacity against shortage volume then carry the full fixed compliance cost, with no permitted revenue at all standing against it. Deliberately weighting a portfolio toward preparations that have no commercial equivalent produces slower growth, and revenue that cannot simply disappear overnight.
02 / NURSING ECONOMICS SELLING

Compare administrations rather than comparing vials

A ready-to-administer syringe costs more than a vial does and removes roughly nine minutes of bedside preparation per dose, while also eliminating the step at which most dosing errors actually occur in practice. Operators who quote unit price against vial price are losing an argument that they should be winning comfortably every single time. Presenting total cost per administration including nursing time reaches hospital pharmacy directors who are managing genuine workforce shortages right now, and it changes the conversation entirely.
03 / UNSERVED POPULATION FOCUS

Price against nothing rather than against something

Paediatric liquid presentations, allergen-free formulations and preservative-free ophthalmic preparations all serve patients whom no commercial manufacturer will ever choose to supply, because the volumes involved cannot justify an approved application anywhere at all. That demand is stable, entirely independent of any shortage listing, and priced against nothing at all rather than against a product that returns to supply. It requires genuine formulation capability rather than preparation capacity, and that takes years to build and cannot be purchased quickly by anybody.
04 / AUDIT HISTORY INVESTMENT

Inspection record decides who gets quoted

A contamination event in sterile preparation work causes patient deaths rather than a product recall, which the 2012 fungal meningitis outbreak established at terrible human cost, and which the entire regulatory framework in this sector was subsequently built around. Hospital audits therefore eliminate suppliers on inspection history and on quality systems long before any pricing is ever discussed with anybody. Treating sterility assurance as a commercial gate rather than as a mere compliance overhead changes which accounts are reachable at all.

Engagement Snapshot From the Field

A live engagement with an industry participant carrying material or product regulatory and market exposure ahead of a defining policy shift, showing how our research translates into a defensible multi-year portfolio strategy.
MARKET MINDS ADVISORY · CLIENT ENGAGEMENT SUMMARY
USA Compounding Pharmacies Producer Strategic Portfolio Review and Transition Roadmap 2026·Investment Scenario on USA Compounding Pharmacies Exposure Evaluation 2025-26
CLIENT PROFILE
A registered outsourcing facility operating two sterile preparation sites and supplying hospital and clinic customers across several states, with reported revenue of 96 million dollars (client-reported, unverified by MMA). Roughly 58% of revenue depended on preparations permitted only while commercial products remained on shortage listings. Specialty ophthalmic work existed at small scale and unmet formulation demand had never been assessed.
STRATEGIC CHALLENGE
Resolution of two shortage listings had removed a substantial share of permitted volume within a single quarter while the facility's fixed compliance costs continued unchanged. Management was pursuing additional shortage categories and a capacity expansion. Neither addressed the underlying fragility of building fixed cost against revenue an administrative notice could remove.
MMA APPROACH
MMA analysed revenue by legal basis rather than by product, separating listing-dependent volume from preparations with no commercial equivalent, which the company had never distinguished internally. Eighteen expert interviews with hospital pharmacy directors, ophthalmologists and paediatric specialists established where unmet demand actually sat. The analysis treated legal durability of revenue, rather than capacity or pricing, as the central question.
KEY FINDINGS
  1. Revenue had never been segmented by legal basis, so the proportion exposed to listing resolution was not known internally until this analysis was completed.
  2. Ready-to-administer preparations were being quoted on unit price against vial cost, and no nursing time data had ever been collected from any customer ward.
  3. Paediatric liquid and allergen-free formulation demand was substantial across the customer base and had never been assessed, quoted or served in any form.
  4. The facility's inspection history was strong and was not being used commercially, despite hospital audits eliminating competitors before pricing discussions began. Nobody had used it commercially.
CLIENT PROFILE
A registered outsourcing facility operating two sterile preparation sites and supplying hospital and clinic customers across several states, with reported revenue of 96 million dollars (client-reported, unverified by MMA). Roughly 58% of revenue depended on preparations permitted only while commercial products remained on shortage listings. Specialty ophthalmic work existed at small scale and unmet formulation demand had never been assessed.
STRATEGIC CHALLENGE
Resolution of two shortage listings had removed a substantial share of permitted volume within a single quarter while the facility's fixed compliance costs continued unchanged. Management was pursuing additional shortage categories and a capacity expansion. Neither addressed the underlying fragility of building fixed cost against revenue an administrative notice could remove.
MMA APPROACH
MMA analysed revenue by legal basis rather than by product, separating listing-dependent volume from preparations with no commercial equivalent, which the company had never distinguished internally. Eighteen expert interviews with hospital pharmacy directors, ophthalmologists and paediatric specialists established where unmet demand actually sat. The analysis treated legal durability of revenue, rather than capacity or pricing, as the central question.
KEY FINDINGS
  1. Revenue had never been segmented by legal basis, so the proportion exposed to listing resolution was not known internally until this analysis was completed.
  2. Ready-to-administer preparations were being quoted on unit price against vial cost, and no nursing time data had ever been collected from any customer ward.
  3. Paediatric liquid and allergen-free formulation demand was substantial across the customer base and had never been assessed, quoted or served in any form.
  4. The facility's inspection history was strong and was not being used commercially, despite hospital audits eliminating competitors before pricing discussions began. Nobody had used it commercially.
RECOMMENDED STRATEGY
Phase 1: Phase one: segment all revenue by legal basis and set an explicit ceiling on the share permitted to depend on shortage listings. Phase 2: Phase two: rebuild ready-to-administer quoting around total administration cost using nursing time data collected from customer wards directly. Ward data makes the case. Phase 3: Phase three: develop paediatric and allergen-free formulation capability, serving demand no commercial manufacturer will ever supply at all. Nothing else serves them.
OUTCOME
Revenue was segmented by legal basis and a ceiling on listing-dependent volume was adopted by the board within a quarter. Ready-to-administer quoting was rebuilt around administration cost and two contracts previously lost on unit price were recovered (client-reported, unverified by MMA). A paediatric formulation programme was funded, and inspection history was incorporated into commercial materials for the first time.

Frequently Asked Questions

Foundational context covering the market sizes, CAGR, scope, country, region and competition that inform every finding below. This section is provided to cover basics and most often pre-purchase conversations, answered from the MMA Primary Research Dataset.

What is the current size of the USA Compounding Pharmacies Market?

The market was worth 14.2 billion dollars in 2025, covering sterile injectables, ready-to-administer presentations, non-sterile preparations, hormones, specialty routes and veterinary work. It reaches 15.42 billion dollars in 2026.

How large will the USA Compounding Pharmacies Market be by 2036?

MMA forecasts 35.19 billion dollars by 2036, an increase of 19.77 billion dollars over the 2026 base. That represents an expansion multiple of 2.28 times across the forecast period.

What is the CAGR for the USA Compounding Pharmacies Market 2026 to 2036?

The base case compounds at 8.6% annually. The bull case reaches 9.8% if injectable shortages persist and ready-to-administer adoption accelerates, while the bear case sits at 7.4% on broad listing resolution.

Which segment is growing fastest?

Ready-to-administer syringes and bags, at 12.9%, half again the market rate of 8.6%. Growth rests on removing roughly nine minutes of nursing preparation per dose rather than on any clinical change.

Who are the major companies in the USA Compounding Pharmacies Market?

QuVa Pharma, SCA Pharmaceuticals, Fagron, Leiters Health and Nephron Pharmaceuticals lead on disclosed compounding and outsourcing revenue. Empower Pharmacy, Harrow and Medisca hold notable segment positions.

Which country is growing fastest?

India at 10.7%, as private hospital capacity and specialty preparation demand expand together across the country. The United States accounts for roughly 64% of global preparation revenue.

Report Segmentation Architecture

The full report scope spans multiple orthogonal segmentation dimensions, with cross-tabulated demand data provided for each dimension pair. Coverage extends further to regional breakdowns, trend trajectories, and the competitive detail needed to support segment-level decision-making.

By Preparation Category

  • Sterile Injectable Preparations
  • Ready-to-Administer Syringes and Bags
  • Non-Sterile Oral and Topical Preparations
  • Hormone and Bioidentical Preparations
  • Ophthalmic and Intrathecal Preparations
  • Veterinary and Animal Health Preparations

By End-Use Setting

  • Hospital Pharmacy Departments
  • Ambulatory Surgery Centres
  • Ophthalmology and Specialty Clinics
  • Oncology Infusion Centres
  • Physician Office Practices
  • Veterinary Clinics and Hospitals

By Commercial Dimension

  • Patient-Specific Prescription Compounding
  • Outsourcing Facility Batch Supply
  • Shortage Substitution Supply
  • Hospital Contract Supply Agreement
  • Specialty Route Preparation Supply
  • Direct Clinic and Practice Supply

By Region

  • North America
  • Western Europe
  • East Asia
  • South Asia and Pacific
  • Latin America
  • Middle East and Africa
  • Eastern Europe

Scope, Methodology, and Coverage

Every figure in this report is reproducible from documented input assumptions. The scope below maps the historical period, the forecast horizon, the segmentation dimensions, and the countries covered, alongside the underlying primary and qualitative methodology.
Historical Period
2020 to 2025
Forecast Period
2026 to 2036
Base Year
2025 (USD billions; MMA Primary Research Dataset, August 2026)
Market Definition
Scope covers pharmaceutical compounding performed by registered pharmacies and outsourcing facilities, spanning sterile injectable preparations, ready-to-administer syringes and bags, non-sterile oral and topical preparations, hormone and bioidentical preparations, ophthalmic and intrathecal preparations, and veterinary and animal health preparations. Commercial pharmaceutical manufacturing under approved applications, retail dispensing of finished commercial products, clinical trial supply and investigational product preparation, medical device reprocessing, and radiopharmaceutical preparation are excluded from the market size and all derived figures. United States dynamics are examined as the analytical focus within the global category.
Quantitative Units
USD billions (current prices); preparations dispensed; doses supplied; shortage-dependent volume share; facility inspection outcomes
Segmentation Dimensions
By Preparation Category; By End-Use Setting; By Commercial Dimension; By Region
Regions Covered
North America, Western Europe, East Asia, South Asia and Pacific, Latin America, Middle East and Africa, Eastern Europe
Countries Covered
USA, Canada, Germany, UK, Netherlands, China, Japan, India, Brazil, Australia, Spain, Mexico, South Korea, Poland, Saudi Arabia
Key Companies Profiled
QuVa Pharma, SCA Pharmaceuticals, Fagron, Leiters Health, Nephron Pharmaceuticals, Empower Pharmacy, Olympia Pharmaceuticals, Central Admixture Pharmacy Services, Wells Pharma, STAQ Pharma, Long Grove Pharmaceuticals, Medisca, PCCA, Baxter International, ICU Medical, Hikma Pharmaceuticals, Harrow, Edge Pharma, Asteria Health, Belcher Pharmaceuticals
Quantitative Methodology
Primary survey, n=3,800 respondents, Q4 2025, six countries; demand-side model with trade association cross-validation
Qualitative Methodology
47 expert interviews, Q4 2025; applied to validate demand model assumptions, identify emerging dynamics, and assess competitive positioning
Report Format
PDF and XLSX data workbook (Word format preview document)
Publisher
Market Minds Advisory
Report Code
MMA-2026-HLT-124
Published
August 2026
Contact
sales@marketmindsadvisory.com | www.marketmindsadvisory.com

Purchase the full USA Compounding Pharmacies Market Report (2026 to 2036).

The full report runs to 172 pages and covers all six preparation category segments, seven regions and 20 profiled operators in detail. It includes the complete segment CAGR set, regional regulatory framework comparison, and analysis of revenue durability by legal basis across shortage-dependent and unmet demand categories. Company profiles carry evaluation on disclosed compounding and outsourcing facility revenue, with moat and risk assessment for the top five operators. The competitive section extends to 15 tracked regulatory, corporate and procurement developments across 2024 and 2025. Primary research inputs include a quantitative survey of 3,800 respondents and 47 expert interviews conducted in Q4 2025.
Six preparation category segments with individual CAGR forecasts
Seven regional markets with regulatory framework and practice comparison
Twenty operator profiles on consistent revenue evaluation basis
Fifteen tracked regulatory and procurement developments with commercial interpretation
Revenue durability analysis segmented by legal basis and listing dependence
Ready-to-administer economics modelled against nursing time and error rates

Built For The People Who Decide

From boardroom strategy to bench-side execution, this report is read cover-to-cover by leaders shaping the next decade of their industry, turning demand scenarios, market dynamics and valuation benchmarks into decisions.
CXOs/ Presidents/ VPs/ Managers
M&A and Corporate Development
Strategy Teams and R&D Heads
Procurement and Product Directors
Regulatory and Compliance Leaders
Investor Relations and Equity Analysts