Market Minds Advisory
USA Beauty and Personal Care (BPC) Retail Vending Machine Market

USA Beauty and Personal Care (BPC) Retail Vending Machine Market: USA Beauty and Personal Care Retail Vending: Site Rent Economics, Route Density and Assortment Limits

Site rent takes about 31% of machine revenue before a single product is bought, and operators keep signing airport placements at fees no plausible sales density could ever support. Route density decides the rest.

Lead Analyst

Published

September 2026

Make Smarter Decisions with Customized Research Insights

Request a free sample report and evaluate market opportunities, growth trends, and competitive dynamics relevant to your business needs.

2025 MARKET VALUE$0.4BMarket Size 2025
2036 FORECAST VALUE$1.1BBase Case , 2026 to 2036
CAGR 2026 TO 203610.6 %Bull 11.9% / Bear 9.3%
INCREMENTAL OPPORTUNITY$0.7BNet 10- year value creation
EXPANSION MULTIPLE2.75x2036 value over 2026 base
Strategic Levers
M&A Pipeline
Regional Outlook
Country Rankings
Competitive Intelligence
Segmental Deep-dive
Call-Us : 91 93563 13602

Executive Snapshot and Market Trajectory.

The machine is not what decides whether this business works. Site rent takes roughly 31% of gross revenue before anything is sold, and an airport placement signed at a prestige fee loses money at any realistic sales density. Location economics govern everything else, and route density decides the remainder.
Fitness and gym placements grow at 15.9%, half again the market rate of 10.6%, because the footfall is captive, repeating and predictable at rents far below airside airport rates. Hotel and resort placements follow at 13.4%. Office and coworking placements grow slowest at 8.2%, since occupancy never recovered to a level that supports a dedicated machine. Route density rather than installed base is what predicts profit here.
Assortment is narrower than the category suggests and the constraints are physical. Liquids above 100 millilitres do not sell airside, glass breaks in spiral mechanisms, and anything under roughly USD 8 cannot cover the vend and restocking cost. What remains is travel-size, high-value and unbreakable, which is a far smaller catalogue than beauty retail assumes. Expiry dating then turns any slow mover into a write-off, because no clearance mechanism exists inside a spiral.
Market Definition
This market covers automated retail machines dispensing beauty and personal care products to consumers across the United States, spanning airport terminal, hotel and resort, university campus, fitness, office and transit concourse placements. Sizing reflects retail sales transacted through those machines together with hardware and servicing revenue attributable to them. Food and beverage vending, general merchandise and electronics automated retail, staffed micro-markets, and in-store beauty testers without payment capability are excluded.
Base Year Value
$0.4B in 2025 (MMA Primary Research Dataset, September 2026)
Forecast Period
2026 to 2036, eleven discrete annual values
CAGR
10.6% base case. Bull 11.9%. Bear 9.3%.
Fastest Growth Segment
Fitness And Gym Placements: 15.9% CAGR
Fastest Growth Country
Las Vegas: 14.6% CAGR
Fastest Growth Region
South Asia and Pacific: 12.5% CAGR
Largest Region
East Asia: 44% of 2025 global value
Market Leaders
Swyft, Vengo Labs, LVMH, Crane NXT, Nayax. Source: MMA Primary Research Dataset, July 2026.
Primary Survey
n=3,800 procurement and R&D decision-makers, Q4 2025, six countries
Methodology
Demand-side build-up, cross-validated against public data, 47 expert interviews

USA Beauty and Personal Care (BPC) Retail Vending Machine Market Forecast Scenarios

usa-bpc-retail-vending-machine-market-size-forecast-scenario-1790022821144
Growth of 9.2% between 2020 and 2025 hides a collapse and a rebuild that landed in the same five years. Airport and office placements lost almost all footfall through 2020 and 2021, and a substantial share of the installed base was removed rather than idled. Recovery since has come from fitness, hotel and campus placements where footfall returned sooner and rents were negotiable.
Three mechanisms carry the base case. Fitness placements grow at 15.9% on captive repeat footfall at rents airports cannot match. Hotel placements expand as properties reduce staffed sundry shops and replace them with automated units that run overnight. Cosmetic facility registration requirements raise the barrier for informal operators. Cashless acceptance also removed the friction coin mechanisms imposed on transaction values near USD 21, which changed what could be sold at all.
The bull case is route density. Operators reaching roughly eight machines per service cluster cross the point where servicing labour stops consuming the margin, and disciplined geographic expansion improves economics faster than any sales increase would. The bear case is airport rent. A return to pre-2020 concession fee expectations would strand a category of placements that only became viable while landlords were willing to negotiate.

Where The Money Actually Goes

Operators in this business talk about machines and lose money on leases. Site rent consumes roughly 31% of gross revenue before any product cost is counted, and airport concessions in particular are priced against a prestige value the sales density does not support. A placement that looks impressive in a deck is frequently the one dragging the route into loss. Very few operators build a contribution statement for an individual placement.
TOP FIVE CONCENTRATION29%Combined share held by the five largest operators and suppliers
SITE RENT SHARE31%Location fee as a proportion of machine gross revenue
AVERAGE TRANSACTION VALUEUSD 21Mean value of a single purchase across all placement types
MINIMUM VIABLE PRICEUSD 8Unit price below which a vend cannot cover servicing
MACHINES PER SERVICE ROUTE8Placements required in a cluster before servicing pays
EXPIRY WRITE-OFF RATE6%Stock value discarded for date expiry each year
The second cost nobody models properly is servicing. Every machine needs a physical visit to restock, clear faults and rotate stock before expiry, and that visit costs roughly the same whether the machine is full or empty. Operators running fewer than about eight placements in a geographic cluster spend more on driving between them than the incremental sales justify. Route density, not machine count, is the number that matters.
Assortment constraints are physical rather than commercial and they narrow the catalogue sharply. Airside placements cannot sell liquids above 100 millilitres, glass shatters in spiral mechanisms, and expiry dating means slow movers become write-offs at roughly 6% of stock value annually. The viable list is travel-size, unbreakable and above USD 8.
"Everybody in automated beauty retail wants the airport placement and almost nobody has run the rent against the vends per day. The operators quietly making money are in gyms, paying a fraction of the fee for footfall that comes back four times a week."
Director, Automated Retail and Consumer Technology Practice · MMA Technology Practice · September 2026

Market Trends

Fitness Placements Deliver Repeat Footfall At Negotiable Rent

A gym member arrives three or four times a week, arrives sweaty and frequently arrives having forgotten something, which is close to an ideal profile for automated beauty retail. Fitness placements grow at 15.9% against a category rate of 10.6% for exactly that reason. Site rents are also negotiable in a way airside airport concessions are not, because the operator is offering the gym an amenity rather than competing for a retail concession. Dry shampoo, deodorant, face wipes and hair ties dominate the assortment and all of them clear the viable price threshold comfortably.
Market Impact: Top five hold 29% share

Hotels Replace Staffed Sundry Shops With Overnight Machines

Hotel operators have been reducing staffed sundry and gift shop hours for a decade, and automated units solve the overnight gap where guest demand for forgotten personal care is concentrated. Hotel and resort placements grow at 13.4%. The property gains a service without payroll, and the operator gains a location where the alternative is a closed shop rather than a competing store. Average transaction values run above the category figure because the guest is replacing something they need rather than browsing, and price sensitivity in that moment is genuinely low.
Market Impact: Las Vegas grows at 14.6%

Market Opportunities and Growth Drivers

Cosmetic Facility Registration Raises The Operating Barrier

Federal cosmetic regulation now requires facility registration and product listing, with adverse event reporting obligations attached, and an operator holding inventory across hundreds of placements sits inside that framework rather than outside it. Informal operators buying assortment through unofficial channels face a compliance burden they are poorly equipped to carry. That favours participants with existing regulatory capability and brand supply relationships. Roughly 29% of the market already sits with the five largest participants, and the requirement pushes that figure upward rather than down. Brand supply relationships matter for the same reason.
Market Impact: Rent consumes 31% of revenue

Las Vegas Hospitality Density Concentrates Placement Economics

Route density decides servicing cost, and no American market concentrates hospitality footfall the way Las Vegas does: hotel rooms, casino floors, gyms, convention centres and an airport within a small geographic radius. That density lets an operator run a cluster well above the eight machine threshold where servicing stops consuming margin. Las Vegas grows at 14.6%, the fastest metropolitan market covered here. Twenty-four hour demand also flattens the sales curve in a way daytime-only locations never manage. No other American market concentrates that footfall inside so small a radius, which is why servicing economics work here.
Market Impact: Excludes units below USD 8

Market Restraints and Challenges

Airport Concession Fees Exceed Achievable Sales Density

Site rent takes about 31% of gross revenue across the category and considerably more at airside airport placements, where concession fees are set against a prestige value rather than against vends per day. The root cause is that airport retail rent is benchmarked on staffed store performance, and a machine cannot generate comparable revenue per square foot no matter how well it is merchandised. Commercially these placements frequently drag an otherwise profitable route into loss. Operators are responding by negotiating percentage-of-sales terms rather than fixed fees, which very few airports accept.
Market Impact: Grows 5.3 points above category

Physical Constraints Narrow The Sellable Assortment Sharply

Liquids above 100 millilitres cannot be sold airside, glass containers break in spiral dispensing mechanisms, and any unit priced below roughly USD 8 fails to cover the vend and restocking cost attached to it. The root cause is that beauty assortment was designed for shelves and hands rather than for a mechanical dispenser and a security screening rule. The commercial impact is a catalogue far smaller than the category implies. Operators are working with brands on vending-specific pack formats, though very few brands have committed to dedicated production. Dedicated production runs are the unresolved obstacle.
Market Impact: Placements grow at 13.4%
4 additional market trends, 3 additional growth drivers, and 2 additional restraints and challenges are covered in the full report. Contact sales@marketmindsadvisory.com to access the complete intelligence.

Segment CAGR and Growth Architecture

Segmentation follows placement environment, the dimension on which site rent, footfall pattern, assortment and servicing route all divide together in this business. Six environments are assessed at attributable retail and servicing revenue. Food and beverage vending, general merchandise automated retail and staffed micro-markets sit outside the defined scope. Beauty testers without payment capability are excluded throughout.
usa-bpc-retail-vending-machine-market-market-share-analysis-1790022821735

Fitness And Gym Placements

Fitness placements grow at 15.9%, half again the market rate of 10.6%, and the member behaviour behind it is close to ideal for this format. A gym member attends three or four times a week, arrives needing personal care rather than browsing for it, and regularly discovers they have forgotten something. Site rent is also negotiable in a way airside concessions are not, because the operator is offering a property amenity rather than bidding for a retail concession against staffed alternatives. Assortment suits the constraints well: dry shampoo, deodorant, face wipes, hair ties and travel-size body care are all unbreakable, compact and comfortably above the viable price threshold. Write-offs are also lower where turnover is fast.
CAGR 15.9%

Hotel And Resort Placements

Hotel and resort placements grow at 13.4% and they exist because properties have spent a decade reducing staffed sundry shop hours. The machine fills an overnight gap where guest demand for forgotten personal care concentrates, and the property gains a service without adding payroll to a department that rarely justifies it. Average transaction values run above the category figure, since a guest replacing a forgotten item at eleven at night is not price sensitive in any meaningful sense. Route economics also work well in hospitality clusters where several properties sit within a few minutes of each other, which is why resort markets outperform dispersed urban ones. Properties gain a service without adding payroll to a department that rarely justified it.
CAGR 13.4%
Full segment breakdown across 6 segments available in the complete report.

Regional Architecture and Country Demand Map

This report is scoped to the United States, so the regional table records where the machines, payment systems and retail technology serving American placements are manufactured. Six origins consequently sit outside their standard share bands. The deviation is flagged here for operator ruling, since supply origin is not consumption.

East Asia

East Asian manufacture supplies 44% of the hardware serving American placements, far outside the standard band, and the concentration is straightforward: vending machine production has been consolidated in China and Japan for two decades. Chinese manufacturers supply the cabinet, spiral and refrigeration assemblies that American operators specify and rebrand, while Fuji Electric and Sanden hold the higher specification positions where reliability matters more than unit cost. Japanese vending engineering also informs the mechanical standards American operators expect. Growth of 11.6% tracks the installed base expansion rather than any change in sourcing pattern. American operators specify and rebrand rather than manufacture, which keeps the hardware relationship transactional and price-led. Nothing about that pattern looks likely to change.
Share: 44% | CAGR: 11.6% (2026 to 2036)

North America

Domestic supply reaches 33%, marginally above the standard band, and it is concentrated in software, payment and telemetry rather than in cabinets. Swyft and Vengo Labs build the retail experience and merchandising logic on hardware sourced elsewhere, while Crane NXT and Nayax supply payment acceptance and connectivity that make cashless vending viable at the transaction values this category needs. Servicing operations are entirely domestic by definition. Growth of 9.8% reflects a mature supply position where software capability rather than manufacturing determines competitive standing across the market. Software and merchandising logic rather than manufacturing determine competitive standing here, and the servicing operation is domestic by definition since somebody has to physically visit each machine.
Share: 33% | CAGR: 9.8% (2026 to 2036)
Regional intelligence for 5 additional markets available in the complete report: Western Europe, South Asia and Pacific, Latin America, Eastern Europe, Middle East and Africa. Contact sales@marketmindsadvisory.com.
usa-bpc-retail-vending-machine-market-country-cagr-analysis-1790022822282

Four Moves That Change Economics

These four address the two costs that decide whether an automated beauty placement earns anything: the rent agreed before a single vend, and the servicing visit that costs the same whether the machine sold out or sold nothing. Each has been executed by an operator in this market, and two of the four reduce the estate rather than grow it.

Refuse Fixed Fee Airport Concessions Entirely

Site rent takes about 31% of gross revenue across the category and considerably more airside, where fees are benchmarked against staffed store performance a machine cannot match at any merchandising quality. Walking away from fixed-fee terms and accepting only percentage-of-sales arrangements removes the placements that drag routes into loss. Operators applying that discipline report route-level contribution improving by roughly 38% while machine count falls. The uncomfortable part is that the abandoned locations are the ones that look best in a presentation. Machine count falls while contribution rises, which is an uncomfortable outcome to present internally.
Market Impact: Lifts route level contribution by roughly 38% overall

Build Clusters To Eight Machines Before Expanding

A service visit costs roughly the same whether a machine is full or empty, and operators running fewer than about eight placements in a geographic cluster spend more on driving than the incremental sales justify. Filling a cluster before opening a new city inverts the usual expansion instinct and is worth considerably more. Operators applying density-first expansion report servicing cost per machine falling by around 44%. Route density rather than installed base is the number that predicts profitability in this business. Planting a flag in a new market is the most expensive habit here.
Market Impact: Cuts servicing cost per machine by roughly 44%

Commission Vending Specific Pack Formats From Brands

Liquids over 100 millilitres cannot sell airside, glass breaks in spiral mechanisms and anything under roughly USD 8 fails to cover its own vend, which leaves a catalogue far smaller than beauty retail assumes. Working with brands on dedicated formats that are compact, unbreakable and priced above the threshold expands what a machine can actually carry. Operators who secured dedicated formats report assortment breadth rising by around 60% at unchanged planogram size, with slow-mover write-offs falling alongside it. Very few brands have committed to dedicated production runs for a channel this small.
Market Impact: Widens usable assortment breadth by roughly 60% overall

Rotate Planograms Against Expiry Rather Than Sales

Beauty products carry expiry dating and a slow-moving unit in a machine becomes a write-off rather than a markdown, since there is no clearance mechanism inside a spiral. Write-offs currently run near 6% of stock value annually. Managing planograms on remaining shelf life rather than only on sales velocity, and rotating slow movers between placements before they date, addresses it directly. Operators doing this report write-offs falling to roughly 2%, which flows entirely to contribution on a high-value assortment. Rotating slow movers between placements before they date is the mechanism.
Market Impact: Cuts annual expiry write-offs to roughly 2% overall

Who Controls the Margin Pool

Concentration is moderate at 29% held by the top five, measured consistently on attributable retail and servicing revenue through automated beauty placements rather than on machine count, which rewards unprofitable installations. The leader to challenger gap is wide in brand supply relationships and in route infrastructure, both of which take years to assemble, and narrow in hardware, where Asian manufacturers supply comparable cabinets to anyone placing an order.
Competition runs on three dimensions currently. Location portfolio decides the cost base, since the rent is agreed before anything is sold. Brand supply access decides assortment, and beauty brands are selective about which operators may carry them in a channel they cannot merchandise directly. Servicing route density decides whether any of it converts into contribution, and it is the dimension least visible from outside.

Pressure is building on operators holding prestige locations at fixed fees and on those expanding machine count ahead of route density, and both are where positions will move. Federal cosmetic facility registration and product listing requirements add a further filter, since informal operators buying assortment through unofficial supply channels now carry obligations they are not structured to meet.
usa-bpc-retail-vending-machine-market-company-positioning-matrix-1790022822813

Competitive Moat and Risk Dimensions

SWYFT

Moat: Brand Relationships And Placement Portfolio

Long-established automated retail operation across airports, malls and hospitality gives the company brand supply relationships that beauty houses grant selectively, because those brands cannot merchandise the channel themselves and rely on the operator to represent them properly. That access is considerably harder to replicate than any hardware or software capability.
SWYFT

Risk: Exposure To Airport Concession Terms

A placement portfolio weighted toward airports and malls carries the highest fixed site fees in the category, benchmarked against staffed store performance no machine can match. As landlords restore pre-2020 concession expectations, those locations move from marginal to loss-making without any change in how well the machines are merchandised or stocked.
VENGO LABS

Moat: Small Footprint Placement Flexibility

Compact wall-mounted units fit locations where a full cabinet cannot, particularly gyms, hotel corridors and campus buildings, which opens placement types competitors cannot physically serve. That form factor also commands lower site fees because it consumes no floor area the property could otherwise monetise. Property negotiations start from a different place entirely.
VENGO LABS

Risk: Limited Capacity Per Placement

A smaller cabinet holds fewer facings, which raises restocking frequency per unit of sales and pushes servicing cost up on exactly the metric that decides profitability. Achieving route density becomes more important rather than less, and assortment breadth per placement is constrained in a category where write-offs punish slow movers.

Players Tracked

Prominent Players

Swyft
Vengo Labs
LVMH
Crane NXT
Nayax

Other Key Players

Cantaloupe
365 Retail Markets
Fuji Electric
Sanden Retail Systems
Azkoyen
Selecta Group
Aramark
Compass Group
Coty
L'Oreal
Unilever
Procter and Gamble
PayRange
Byte Technology
Apex Supply Chain Technologies

Recent Developments

JUNE 2025

365 Retail Markets agrees to acquire Cantaloupe

The company agreed to acquire Cantaloupe, combining unattended retail payment and telemetry capability with micro-market operations. This was an acquisition rather than a joint venture or partnership, and it consolidates two of the payment infrastructure positions the category depends on. Both businesses continue operating under common ownership.
Signal: Payment and telemetry infrastructure is consolidating faster than the operator base above it. Scale is consolidating below the operators.
OCTOBER 2024

Swyft expands automated retail placements across airport terminals

The company added placements across additional American airport terminals under concession agreements negotiated during the period. This was organic expansion of an existing operating footprint, involving no acquisition, joint venture or external capacity partner at any stage. Existing mall and hotel placements were unaffected by the expansion.
Signal: Airport placement expansion continues despite concession fees the sales density struggles to support. Prestige locations still attract capital.
JANUARY 2025

Benefit Cosmetics extends vending placements into fitness locations

The LVMH brand widened its automated retail footprint beyond airports and malls into gym and studio placements. This was an internal channel decision taken by the brand with its operating partner, involving no acquisition or new joint venture arrangement. Airport and mall placements continue alongside the new locations.
Signal: Beauty brands are following operators toward the placement types that actually generate repeat purchase. Brands are following repeat purchase.

What A Placement Really Costs

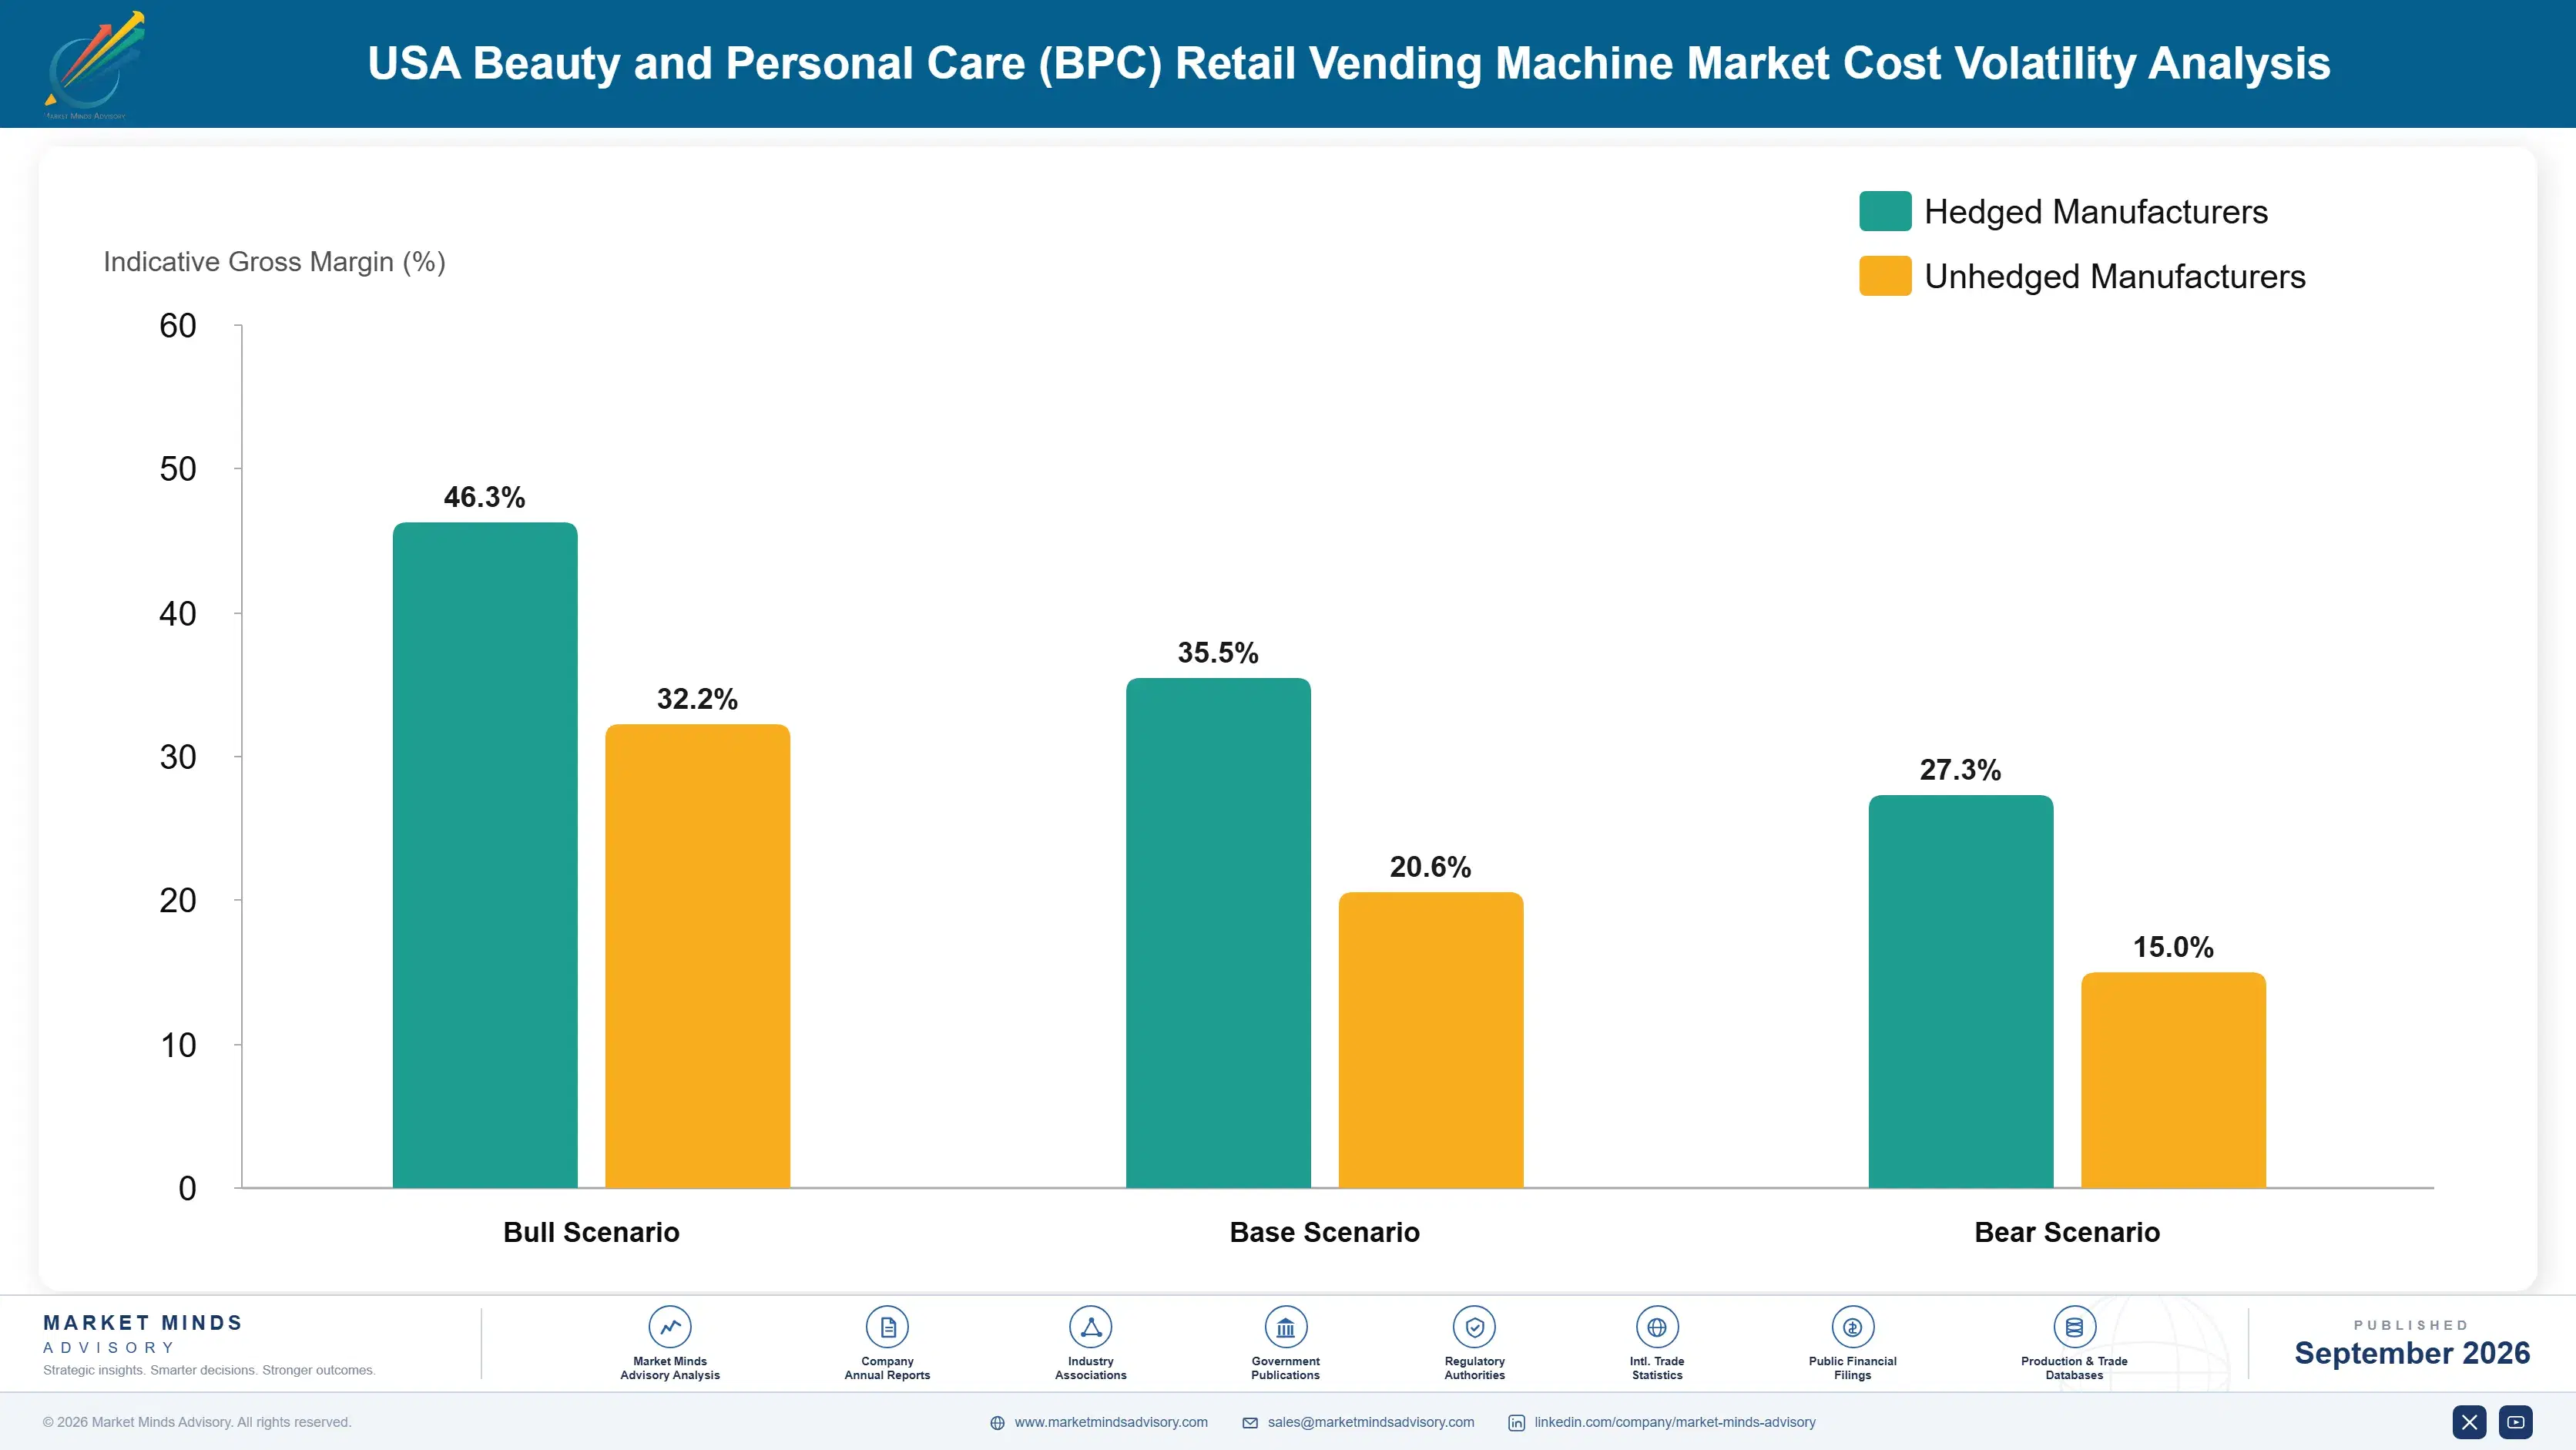
Cost of goods takes roughly 38% of machine revenue, which is favourable against staffed beauty retail because there is no markdown mechanism and no shrink from handling. Site rent takes about 31% and is agreed before any product moves. Servicing labour and route cost account for around 14%, machine depreciation about 7%, and payment processing roughly 3% on transaction values that make card acceptance unavoidable rather than optional.
The 2022 and 2023 period reset the rent line permanently. Airport and mall landlords who had accepted reduced or percentage-based terms through the footfall collapse moved back toward pre-2020 concession expectations as passenger volumes recovered, and operators who had expanded during the negotiable years found renewals repriced sharply. Crane NXT reporting for that period identifies unattended retail demand recovering unevenly by location type, which matches what operators experienced directly.

Exposure varies almost entirely by placement mix, which decides who survives a rent cycle. Operators weighted toward airside airport concessions carry the highest fixed cost against the least negotiable terms. Fitness and campus placements carry lower fees and, in many cases, percentage arrangements that flex with performance. Small-footprint operators consuming no monetisable floor area negotiate from a different position entirely.
usa-bpc-retail-vending-machine-market-cost-volatility-analysis-1790022823008

Negotiate percentage of sales rather than fixed concession fees

A fixed fee transfers all volume risk to the operator in a channel where sales density is difficult to forecast before installation. Percentage arrangements align the landlord with performance and remove the placements that would have failed anyway. Very few airports accept them, which is itself useful information about which locations to pursue. That refusal itself filters the estate usefully.

Fill geographic clusters before entering any new market

Servicing cost per machine falls sharply once a cluster passes roughly eight placements, because the driving between them stops dominating the visit. Expanding into a new city before the current cluster is dense inverts that economics deliberately. The instinct to plant a flag in a new market is the single most expensive habit in this business.

Specify cabinets around the assortment rather than the reverse

Standard spiral mechanisms were designed for snacks and they break glass, jam on irregular packs and waste facings on small units. Specifying cabinet mechanics against an actual beauty planogram costs more per machine and reduces both jam rate and write-off. Most operators buy the cabinet first and then discover what it can reliably dispense.

Portfolio Architecture for Margin Defence

Margin architecture divides by placement type far more than by assortment, which is not how most operators organise their reporting. High-rent airport and mall placements run at contribution margins in the low to high twenties after site fees, and several sit below that once servicing is allocated honestly rather than spread evenly across a route. Reporting that spreads servicing evenly hides which placements pay for themselves.
Fitness, campus and hotel placements hold contribution margins in the high thirties to mid forties. The spread reflects rent terms rather than sales density, since a percentage arrangement in a gym and a fixed fee in a hotel lobby produce very different outcomes on similar revenue. These are also the placements where route clustering is easiest, which compounds the advantage.

The highest-value pool sits where a dense cluster meets a percentage rent and a disciplined planogram, at contribution margins in the mid forties to mid fifties. Those placements earn because three separate cost lines are controlled at once rather than because they sell more. Prestige locations generate photographs and brand relationships. They rarely generate contribution. Nobody has built a profitable estate out of prestige alone.

Volume / Commodity-Adjacent

High-rent airport and mall placements carrying fixed concession fees benchmarked against staffed retail. Several fall below this range once servicing is allocated honestly rather than spread evenly across the route.
Gross Margin: 22 to 30%

Premium / Certified

Fitness, campus and hotel placements with negotiable or percentage-based site terms. The eight-point range reflects rent structure rather than sales density, since similar revenue produces very different outcomes. Route clustering is also easiest in these environments.
Gross Margin: 36 to 44%

Sustainability / Regulatory / Next-Generation

Dense clusters combining percentage rent with disciplined expiry-managed planograms. These earn by controlling three cost lines simultaneously rather than by achieving any higher sales density per machine. Sales density per machine is not what separates them.
Gross Margin: 46 to 54%
usa-bpc-retail-vending-machine-market-portfolio-architecture-1790022823504

High-value Sub-segments and Strategic Watch-out

Clustered Fitness Placement Networks

High value and high growth at 15.9%. Members attend three or four times weekly, arrive needing personal care and negotiate rent as an amenity rather than a concession. Clustering to eight machines cuts servicing cost by roughly 44%. Assortment suits the physical constraints unusually well.
Gross Margin: 48 to 54%

Hotel And Resort Overnight Placements

High value and high growth at 13.4%. Guests replacing a forgotten item at night show almost no price sensitivity, and transaction values run above category average. Resort clusters make route density unusually easy to achieve. Staffed sundry shops have been closing steadily for a decade now.
Gross Margin: 42 to 48%

Airport Terminal Concessions

Volume core in revenue terms and frequently loss-making after honest servicing allocation. Concession fees are benchmarked against staffed store performance that no machine can reach at any merchandising standard. They generate photographs, brand relationships and very little contribution, which is a trade several operators keep making deliberately.
Gross Margin: 22 to 29%

Office And Coworking Placements

Strategic watch-out. Growing slowest at 8.2% because occupancy never returned to a level supporting a dedicated machine. The ten-point range reflects how differently operators have renegotiated terms since 2021. Terms negotiated during the footfall collapse are now coming up for renewal at considerably less favourable rates.
Gross Margin: 24 to 34%

What Brings Buyers Back

Demand here is occasion-driven rather than habit-driven, and the occasion is almost always a forgotten item. Nobody plans to buy deodorant from a machine. They buy it because they are about to board a flight, have arrived at a gym without it, or are in a hotel at eleven at night with a closed sundry shop. That means placement adjacency to the moment of realisation matters more than anything on the planogram.
Repeat behaviour varies sharply by location type. Gym members return three or four times weekly and learn the machine is there, which converts an emergency purchase into an occasional planned one. Airport travellers are a genuinely new audience on almost every vend, so no relationship accumulates at all. Campus placements sit between the two, with a resident population that learns the location within a term.

Buyer expectations shifted after cashless acceptance became universal. Transaction values in this category run near USD 21, far above what coin mechanisms were designed for, and the removal of that friction changed which products could be sold at all. Buyers now expect contactless payment, receipts and a refund route when a vend fails.
usa-bpc-retail-vending-machine-market-end-use-penetration-index-1790022824000

Where Placements Actually Earn

These are among the four positions where our research anticipates prominent divergence between winners and laggards over the coming forecast period. Each is grounded in the demand model, the regulatory perimeter, and the announced capacity pipeline.
01 / SITE RENT DISCIPLINE

Walk away from the locations that photograph well

Site rent consumes about 31% of gross revenue across the category and considerably more at airside airport placements, where concession fees are benchmarked against staffed store performance no machine can reach. Those locations frequently drag an otherwise profitable route into loss while looking impressive in a presentation. Operators refusing fixed fees and accepting only percentage-of-sales terms report route-level contribution improving by roughly 38%, with machine count falling rather than rising, which is an uncomfortable result to present to anyone who signed those leases.
02 / ROUTE DENSITY PRIORITY

Fill the cluster before entering a new city

A service visit costs roughly the same whether a machine is full or empty, so operators running fewer than about eight placements in a geographic cluster spend more driving between them than the incremental sales justify. Expanding into a new market before the existing cluster is dense inverts the economics deliberately. Operators applying density-first expansion report servicing cost per machine falling by around 44%, which is the single largest controllable line in this business, and planting a flag in a new market remains the most expensive habit in it.
03 / ASSORTMENT FORMAT DEVELOPMENT

Commission packs built for a spiral mechanism

Liquids above 100 millilitres cannot sell airside, glass containers break in spiral dispensers, and anything below roughly USD 8 fails to cover its own vend and restocking cost. Beauty assortment was designed for shelves and hands rather than for mechanical dispensing and security screening rules. Operators securing dedicated compact and unbreakable formats from brands report usable assortment breadth rising by around 60% at unchanged planogram size, with slow-mover write-offs falling alongside it, though very few brands have yet committed to dedicated production runs for the channel.
04 / EXPIRY PLANOGRAM MANAGEMENT

Rotate on shelf life, not on sales velocity

Beauty products carry expiry dating and a slow-moving unit inside a machine becomes a write-off rather than a markdown, because no clearance mechanism exists inside a spiral. Write-offs currently run near 6% of stock value each year on a high-value assortment. Managing planograms against remaining shelf life and rotating slow movers between placements before they date brings that figure to roughly 2%, and the recovery flows directly to route contribution, and rotating slow movers between placements before they date is all the mechanism requires.

Engagement Snapshot From the Field

A live engagement with an industry participant carrying material or product regulatory and market exposure ahead of a defining policy shift, showing how our research translates into a defensible multi-year portfolio strategy.
MARKET MINDS ADVISORY · CLIENT ENGAGEMENT SUMMARY
USA Beauty and Personal Care (BPC) Retail Vending Machine Producer Strategic Portfolio Review and Transition Roadmap 2026·Investment Scenario on USA Beauty and Personal Care (BPC) Retail Vending Machine Exposure Evaluation 2025-26
CLIENT PROFILE
An American automated retail operator running 340 beauty and personal care placements across airports, malls, hotels and gyms, with attributable revenue near USD 52 million (client-reported, unverified by MMA). Airport and mall placements accounted for 61% of the estate. Servicing was organised by technician availability rather than by geography, and site fees were recorded centrally without allocation to individual placements.
STRATEGIC CHALLENGE
Revenue had grown for three consecutive years while operating profit fell, and management attributed the gap to product cost inflation. A supplier renegotiation programme had been approved. Nobody had built a contribution statement for an individual placement, so no location had ever been identified as loss-making at the unit level.
MMA APPROACH
MMA constructed placement-level contribution statements allocating site rent, cost of goods, servicing labour, route driving time and depreciation to each of the 340 machines. Servicing routes were remapped geographically against the existing schedule. Expiry write-offs were traced by product and placement, and concession terms were compared across location types. Nothing had been allocated this way before.
KEY FINDINGS
  1. Ninety-four placements were loss-making at contribution level once site rent and servicing were allocated, and 71 of those were airside airport or mall locations on fixed fees.
  2. Servicing routes averaged 4.2 machines per geographic cluster, well below the eight required before driving time stops dominating the visit cost. Driving time dominated most visits.
  3. Expiry write-offs ran at 9% of stock value against a category figure of 6%, concentrated in slow-moving premium skincare that no clearance mechanism could move.
  4. Gym placements delivered the highest contribution per machine in the estate at the lowest site fees, and represented only 11% of the installed base.
CLIENT PROFILE
An American automated retail operator running 340 beauty and personal care placements across airports, malls, hotels and gyms, with attributable revenue near USD 52 million (client-reported, unverified by MMA). Airport and mall placements accounted for 61% of the estate. Servicing was organised by technician availability rather than by geography, and site fees were recorded centrally without allocation to individual placements.
STRATEGIC CHALLENGE
Revenue had grown for three consecutive years while operating profit fell, and management attributed the gap to product cost inflation. A supplier renegotiation programme had been approved. Nobody had built a contribution statement for an individual placement, so no location had ever been identified as loss-making at the unit level.
MMA APPROACH
MMA constructed placement-level contribution statements allocating site rent, cost of goods, servicing labour, route driving time and depreciation to each of the 340 machines. Servicing routes were remapped geographically against the existing schedule. Expiry write-offs were traced by product and placement, and concession terms were compared across location types. Nothing had been allocated this way before.
KEY FINDINGS
  1. Ninety-four placements were loss-making at contribution level once site rent and servicing were allocated, and 71 of those were airside airport or mall locations on fixed fees.
  2. Servicing routes averaged 4.2 machines per geographic cluster, well below the eight required before driving time stops dominating the visit cost. Driving time dominated most visits.
  3. Expiry write-offs ran at 9% of stock value against a category figure of 6%, concentrated in slow-moving premium skincare that no clearance mechanism could move.
  4. Gym placements delivered the highest contribution per machine in the estate at the lowest site fees, and represented only 11% of the installed base.
RECOMMENDED STRATEGY
Phase 1: Phase one: exit the 71 fixed-fee airport and mall placements at renewal rather than renegotiating them individually. Renegotiation individually would not have worked. Phase 2: Phase two: remap servicing geographically and redeploy exited machines into existing clusters to reach eight placements each. Existing machines cover the redeployment. Phase 3: Phase three: expand fitness placements aggressively and manage planograms against remaining shelf life rather than sales velocity. Gyms delivered the highest contribution per machine.
OUTCOME
Operating profit rose by roughly 62% across four quarters while the installed base fell by 58 machines (client-reported, unverified by MMA). The supplier renegotiation programme was abandoned once placement-level contribution showed cost of goods was the healthiest line in the business rather than the problem.

Frequently Asked Questions

Foundational context covering the market sizes, CAGR, scope, country, region and competition that inform every finding below. This section is provided to cover basics and most often pre-purchase conversations, answered from the MMA Primary Research Dataset.

What is the current size of the USA Beauty and Personal Care Retail Vending Machine Market?

The market was valued at USD 0.4 billion in 2025, holding near USD 0.4 billion in 2026. Sizing covers attributable retail sales plus hardware and servicing revenue.

How large will the USA Beauty and Personal Care Retail Vending Machine Market be by 2036?

MMA forecasts USD 1.1 billion by 2036, an increase of USD 0.7 billion over the 2026 base. That represents expansion of 2.75 times across the forecast period.

What is the CAGR for this market 2026 to 2036?

The base case CAGR is 10.6%, with a bull case of 11.9% and a bear case of 9.3%. Historical growth between 2020 and 2025 ran at 9.2%.

Which segment is growing fastest?

Fitness and gym placements grow at 15.9%, half again the market rate, because footfall repeats several times weekly at rents airports cannot match. Hotel placements follow at 13.4%.

Who are the major companies in this market?

Swyft, Vengo Labs, LVMH, Crane NXT and Nayax lead on attributable revenue, holding a combined 29%. Payment and telemetry infrastructure is consolidating faster than the operator base above it.

Which country is growing fastest?

This report is scoped to the United States, so comparison runs between metropolitan markets. Las Vegas grows fastest at 14.6%, on hospitality density and twenty-four hour demand.

Report Segmentation Architecture

The full report scope spans multiple orthogonal segmentation dimensions, with cross-tabulated demand data provided for each dimension pair. Coverage extends further to regional breakdowns, trend trajectories, and the competitive detail needed to support segment-level decision-making.

By Placement Environment

  • Airport Terminal Placements
  • Hotel and Resort Placements
  • University and Campus Placements
  • Fitness and Gym Placements
  • Office and Coworking Placements
  • Transit Hub and Retail Concourse Placements

By Product Category Dispensed

  • Travel-Size Skincare
  • Deodorant and Body Care
  • Hair Care and Styling
  • Colour Cosmetics
  • Oral and Personal Hygiene
  • Grooming Accessories

By Commercial Model

  • Operator Owned and Stocked
  • Brand Owned Placements
  • Property Managed Concessions
  • Franchise and Licensed Routes
  • Hardware and Software Supply
  • Payment and Telemetry Services

By Region

  • East Asia
  • North America
  • Western Europe
  • South Asia and Pacific
  • Latin America
  • Eastern Europe
  • Middle East and Africa

Scope, Methodology, and Coverage

Every figure in this report is reproducible from documented input assumptions. The scope below maps the historical period, the forecast horizon, the segmentation dimensions, and the countries covered, alongside the underlying primary and qualitative methodology.
Historical Period
2020 to 2025
Forecast Period
2026 to 2036
Base Year
2025 (USD billions; MMA Primary Research Dataset, September 2026)
Market Definition
This market covers automated retail machines dispensing beauty and personal care products to consumers across the United States, spanning airport terminal, hotel and resort, university campus, fitness and gym, office and coworking, and transit concourse placements. Sizing reflects retail sales transacted through those machines together with hardware, software and servicing revenue attributable to them. Food and beverage vending, general merchandise and electronics automated retail, staffed micro-markets, and in-store beauty testers without payment capability are excluded throughout.
Quantitative Units
USD billions at attributable revenue; placements in thousands of machines; site rent as percentage of gross revenue.
Segmentation Dimensions
Placement environment, product category dispensed, commercial model, and supply origin region.
Regions Covered
East Asia, North America, Western Europe, South Asia and Pacific, Latin America, Eastern Europe, Middle East and Africa
Countries Covered
United States, with metropolitan analysis across Las Vegas, New York, Los Angeles, Miami, Chicago and Dallas
Key Companies Profiled
Swyft, Vengo Labs, LVMH, Crane NXT, Nayax, Cantaloupe, 365 Retail Markets, Fuji Electric, Sanden Retail Systems, Azkoyen, Selecta Group, Aramark, Compass Group, Coty, L'Oreal, Unilever, Procter and Gamble, PayRange, Byte Technology, Apex Supply Chain Technologies
Quantitative Methodology
Primary survey, n=3,800 respondents, Q4 2025, six countries; demand-side model with trade association cross-validation
Qualitative Methodology
47 expert interviews, Q4 2025; applied to validate demand model assumptions, identify emerging dynamics, and assess competitive positioning
Report Format
PDF and XLSX data workbook (Word format preview document)
Publisher
Market Minds Advisory
Report Code
MMA-2026-TEC-778
Published
September 2026
Contact
sales@marketmindsadvisory.com | www.marketmindsadvisory.com

Purchase the full USA Beauty and Personal Care (BPC) Retail Vending Machine Market Report (2026 to 2036).

The full report sizes the American beauty and personal care vending market across six placement environments, six dispensed categories and six commercial models, with supply-origin analysis covering all seven global regions. It includes placement-level contribution modelling allocating site rent, cost of goods, servicing labour and route driving time to individual machines. Concession terms are compared across location types and landlord categories. Expiry write-offs are traced by product and placement, and servicing route density is mapped against contribution to establish the cluster threshold. Competitive assessment covers 20 participants on a consistent attributable revenue basis.
Placement level contribution modelled machine by machine
Concession terms compared across location and landlord types
Expiry write-offs traced by product and placement
Route density mapped against contribution per machine
Six placement environments sized through 2036
Twenty participants assessed on attributable revenue

Built For The People Who Decide

From boardroom strategy to bench-side execution, this report is read cover-to-cover by leaders shaping the next decade of their industry, turning demand scenarios, market dynamics and valuation benchmarks into decisions.
CXOs/ Presidents/ VPs/ Managers
M&A and Corporate Development
Strategy Teams and R&D Heads
Procurement and Product Directors
Regulatory and Compliance Leaders
Investor Relations and Equity Analysts