Market Minds Advisory
USA and Canada Pet Care Products Market

USA and Canada Pet Care Products Market: USA and Canada Pet Care Products: Flat Pet Populations, Claim Definitions and Where Margin Concentrates

The companion animal population has stopped growing and spend per pet is doing all the work, which makes premiumisation the only growth mechanism this market currently has. Premiumisation is the only lever left.

Lead Analyst

Published

September 2026

Make Smarter Decisions with Customized Research Insights

Request a free sample report and evaluate market opportunities, growth trends, and competitive dynamics relevant to your business needs.

2025 MARKET VALUE$72.0BMarket Size 2025
2036 FORECAST VALUE$118.1BBase Case , 2026 to 2036
CAGR 2026 TO 20364.6 %Bull 5.8% / Bear 3.4%
INCREMENTAL OPPORTUNITY$42.8BNet 10- year value creation
EXPANSION MULTIPLE1.57x2036 value over 2026 base
Strategic Levers
M&A Pipeline
Regional Outlook
Country Rankings
Competitive Intelligence
Segmental Deep-dive
Call-Us : 91 93563 13602

Executive Snapshot and Market Trajectory.

There are not meaningfully more pets than there were three years ago. The regional companion animal population is growing at roughly 0.4% annually after the 2020 acquisition surge reversed, and every point of category growth above that comes from spending more on the same animals. Premiumisation is the only lever.
Wet and fresh pet food grows at 6.9%, half again the market rate of 4.6%, as refrigerated and gently cooked formats move from a niche into mainstream grocery and online distribution. Treats and chews follow closely behind at 5.8%. Dry food grows slowest at 3.2%, holding the volume and losing the value as owners trade part of the bowl rather than all of it.
Claim language is where buyers are most confidently wrong. Human grade has a narrow definition covering ingredients and the facility together, and roughly 3% of products meet it, while premium and natural mean nothing defined. Complete and balanced is the claim that matters nutritionally and attracts the least attention. Retailer own brands hold about 21% of retail value and take the middle tier fastest. Autoship already carries roughly 39% of online purchases.
Market Definition
This market covers pet care products sold to households across the United States and Canada, spanning dry pet food, wet and fresh pet food, treats and chews, litter and waste management, grooming and hygiene products, and health, supplements and parasite control. Sizing is at retail value. Durable pet hardware including collars, leads, beds, crates, carriers and toys, veterinary services and diagnostics, pet insurance, boarding and grooming services, and live animal sales are excluded.
Base Year Value
$72.0B in 2025 (MMA Primary Research Dataset, September 2026)
Forecast Period
2026 to 2036, eleven discrete annual values
CAGR
4.6% base case. Bull 5.8%. Bear 3.4%.
Fastest Growth Segment
Wet And Fresh Pet Food: 6.9% CAGR
Fastest Growth Country
Texas: 6.4% CAGR
Fastest Growth Region
South Asia and Pacific: 6.4% CAGR
Largest Region
North America: 72% of 2025 global value
Market Leaders
Mars, Nestle, General Mills, Colgate-Palmolive, Freshpet. Source: MMA Primary Research Dataset, July 2026.
Primary Survey
n=3,800 procurement and R&D decision-makers, Q4 2025, six countries
Methodology
Demand-side build-up, cross-validated against public data, 47 expert interviews

USA and Canada Pet Care Products Market Forecast Scenarios

usa-and-canada-pet-care-products-market-size-forecast-scenario-1790022802498
Growth of 3.5% between 2020 and 2025 divides into an acquisition phase and a premiumisation phase that barely overlapped. Household pet acquisition surged through 2020 and 2021, adding animals that immediately needed feeding, then fell below replacement as returns rose and adoption normalised. Spending per animal carried the category from 2023, and food inflation flattered the reported numbers.
Three mechanisms carry the base case. Fresh and refrigerated formats keep taking share at 6.9% as cold chain reaches mainstream grocery and as owners substitute part of the bowl rather than all of it. Autoship subscription now carries roughly 39% of online purchases and is turning heavy low-value categories into predictable annuities. Texas and the wider Sun Belt grow at 6.4% on household formation that the rest of the region no longer delivers.
The bull case is veterinary channel expansion. If retail participants secure genuine clinical distribution, therapeutic and veterinary diets carry the highest margin in the category and the strongest loyalty attached to it. The bear case is trade-down. Private label already holds around 21% of retail value, and a sustained consumer squeeze moves premiumisation into reverse in a market where premiumisation is the only growth mechanism available.

Growth Without More Animals

A category that grew on new pets is now growing on the same pets, and the two look nothing alike commercially. Regional companion animal populations expand at roughly 0.4% annually while the market grows at 4.6%, which means almost all of it is spend per animal rising. That makes premiumisation the growth mechanism rather than one option among several, and it makes any consumer squeeze considerably more dangerous than it looks. Nobody in this market says so plainly.
TOP FIVE CONCENTRATION44%Combined retail value share held by the five largest participants
PET POPULATION GROWTH0.4%Annual change in the regional companion animal population
SPEND PER PET ANNUALLYUSD 612Average household outlay per companion animal each year
HUMAN GRADE PRODUCTS3%Products meeting the full human grade production definition
PRIVATE LABEL SHARE21%Retail value carried by retailer own brand products
AUTOSHIP SUBSCRIPTION SHARE39%Online pet purchases arriving on a recurring schedule
Claim definitions separate the informed buyer from everyone else. Human grade is a narrow production standard requiring every ingredient and the manufacturing facility itself to meet human food requirements, and around 3% of products actually satisfy it. Premium and natural carry no defined meaning. Complete and balanced is the claim with nutritional substance behind it, and it attracts the least shelf attention of any of them.
Autoship has quietly changed which categories are worth owning. Litter is heavy, low in value and miserable to ship as a one-off, which made it a poor e-commerce product and an excellent subscription anchor. Roughly 39% of online pet purchases now arrive on a recurring schedule.
"This market stopped adding animals three years ago and nobody wants to say so, because the whole growth story now depends on persuading the same households to spend more on the same dog. That works until it does not."
Director, Pet Care and Companion Animal Practice · MMA Consumer and Industrial Goods Practice · September 2026

Market Trends

Fresh Formats Move From Supplement To Substitution

Refrigerated and gently cooked pet food began as a topper added to dry kibble and is increasingly replacing a share of the bowl outright, which changes the volume mathematics completely. Wet and fresh formats grow at 6.9% against a category rate of 4.6% as cold chain reaches mainstream grocery and as subscription delivery removes the storage objection. Cost per feeding remains several times dry, so most households substitute partially rather than fully. Manufacturers with refrigerated distribution hold an advantage that ambient competitors cannot assemble quickly at any price. Subscription delivery removed the storage objection that held the format back.
Market Impact: Texas grows 1.8 points faster
Autoship Turns Heavy Categories Into Predictable Annuities

Litter, large-format dry food and waste bags are heavy, low in value and poor one-off e-commerce purchases, which is precisely why recurring delivery suits them. Roughly 39% of online pet purchases now arrive on a schedule, and those customers churn far less than one-off buyers while carrying a substantially higher basket. The model also favours manufacturers able to supply consistently rather than those relying on promotional retail activity. Participants without subscription distribution are competing for the discretionary half of a market whose reliable half has moved elsewhere. The reliable half has moved to recurring delivery; the discretionary half has not.
Market Impact: Adds roughly 18 margin points

Market Opportunities and Growth Drivers

Sun Belt Household Formation Adds The Pets Elsewhere Lost

Regional pet populations are flat overall while distribution across states is shifting substantially, and household formation across Texas, Arizona, the Carolinas and Florida is where new pet ownership actually occurs. Texas grows at 6.4%, the fastest geography covered here. Those households skew younger, form pet ownership earlier and buy more through online subscription than established households in older regions. Retailers and manufacturers organised around legacy regional distribution are serving a base that is not growing while the growth relocates. Manufacturers organised around legacy distribution are serving a base that is not growing.
Market Impact: Only 3% meet the definition

Veterinary Channel Carries Authority Retail Cannot Purchase

A therapeutic or veterinary diet recommended in a consulting room converts at rates no retail merchandising achieves, and the resulting loyalty persists for the life of the condition being managed. Those products also carry the highest gross margins in the category by a clear margin. Access requires clinical evidence, regulatory documentation and a sales organisation calling on practices, which is why very few participants hold a position there. Colgate-Palmolive and Mars dominate it, and the barrier is capability rather than shelf space. Colgate-Palmolive and Mars dominate that channel, and the barrier is clinical capability.
Market Impact: Populations grow just 0.4%

Market Restraints and Challenges

Premium Claim Language Carries Almost No Definition

Human grade requires every ingredient and the production facility itself to meet human food standards, and roughly 3% of products meet that bar, while premium and natural carry no defined meaning whatever. The root cause is that feed regulation governs safety and nutritional adequacy rather than marketing vocabulary. Commercially this lets undifferentiated products claim what genuinely differentiated ones claim, which suppresses willingness to pay across the whole premium tier. Participants meeting the actual definition now state it explicitly, which works while most competitors cannot. Buyers currently discount the entire tier equally.
Market Impact: Grows 2.3 points above category

Flat Pet Populations Make Premiumisation The Only Lever

The regional companion animal population grows at roughly 0.4% annually after the 2020 acquisition surge reversed, so nearly all category growth comes from spend per animal. The root cause is demographic rather than commercial: household formation slowed and the pandemic cohort was pulled forward rather than added. Commercially this leaves the whole market dependent on trading households upward, with no volume growth underneath to absorb a consumer squeeze. Private label at around 21% of retail value is where that squeeze expresses itself first. There is no volume growth underneath to absorb a squeeze.
Market Impact: Autoship carries 39% of online
3 additional market trends, 4 additional growth drivers, and 2 additional restraints and challenges are covered in the full report. Contact sales@marketmindsadvisory.com to access the complete intelligence.

Segment CAGR and Growth Architecture

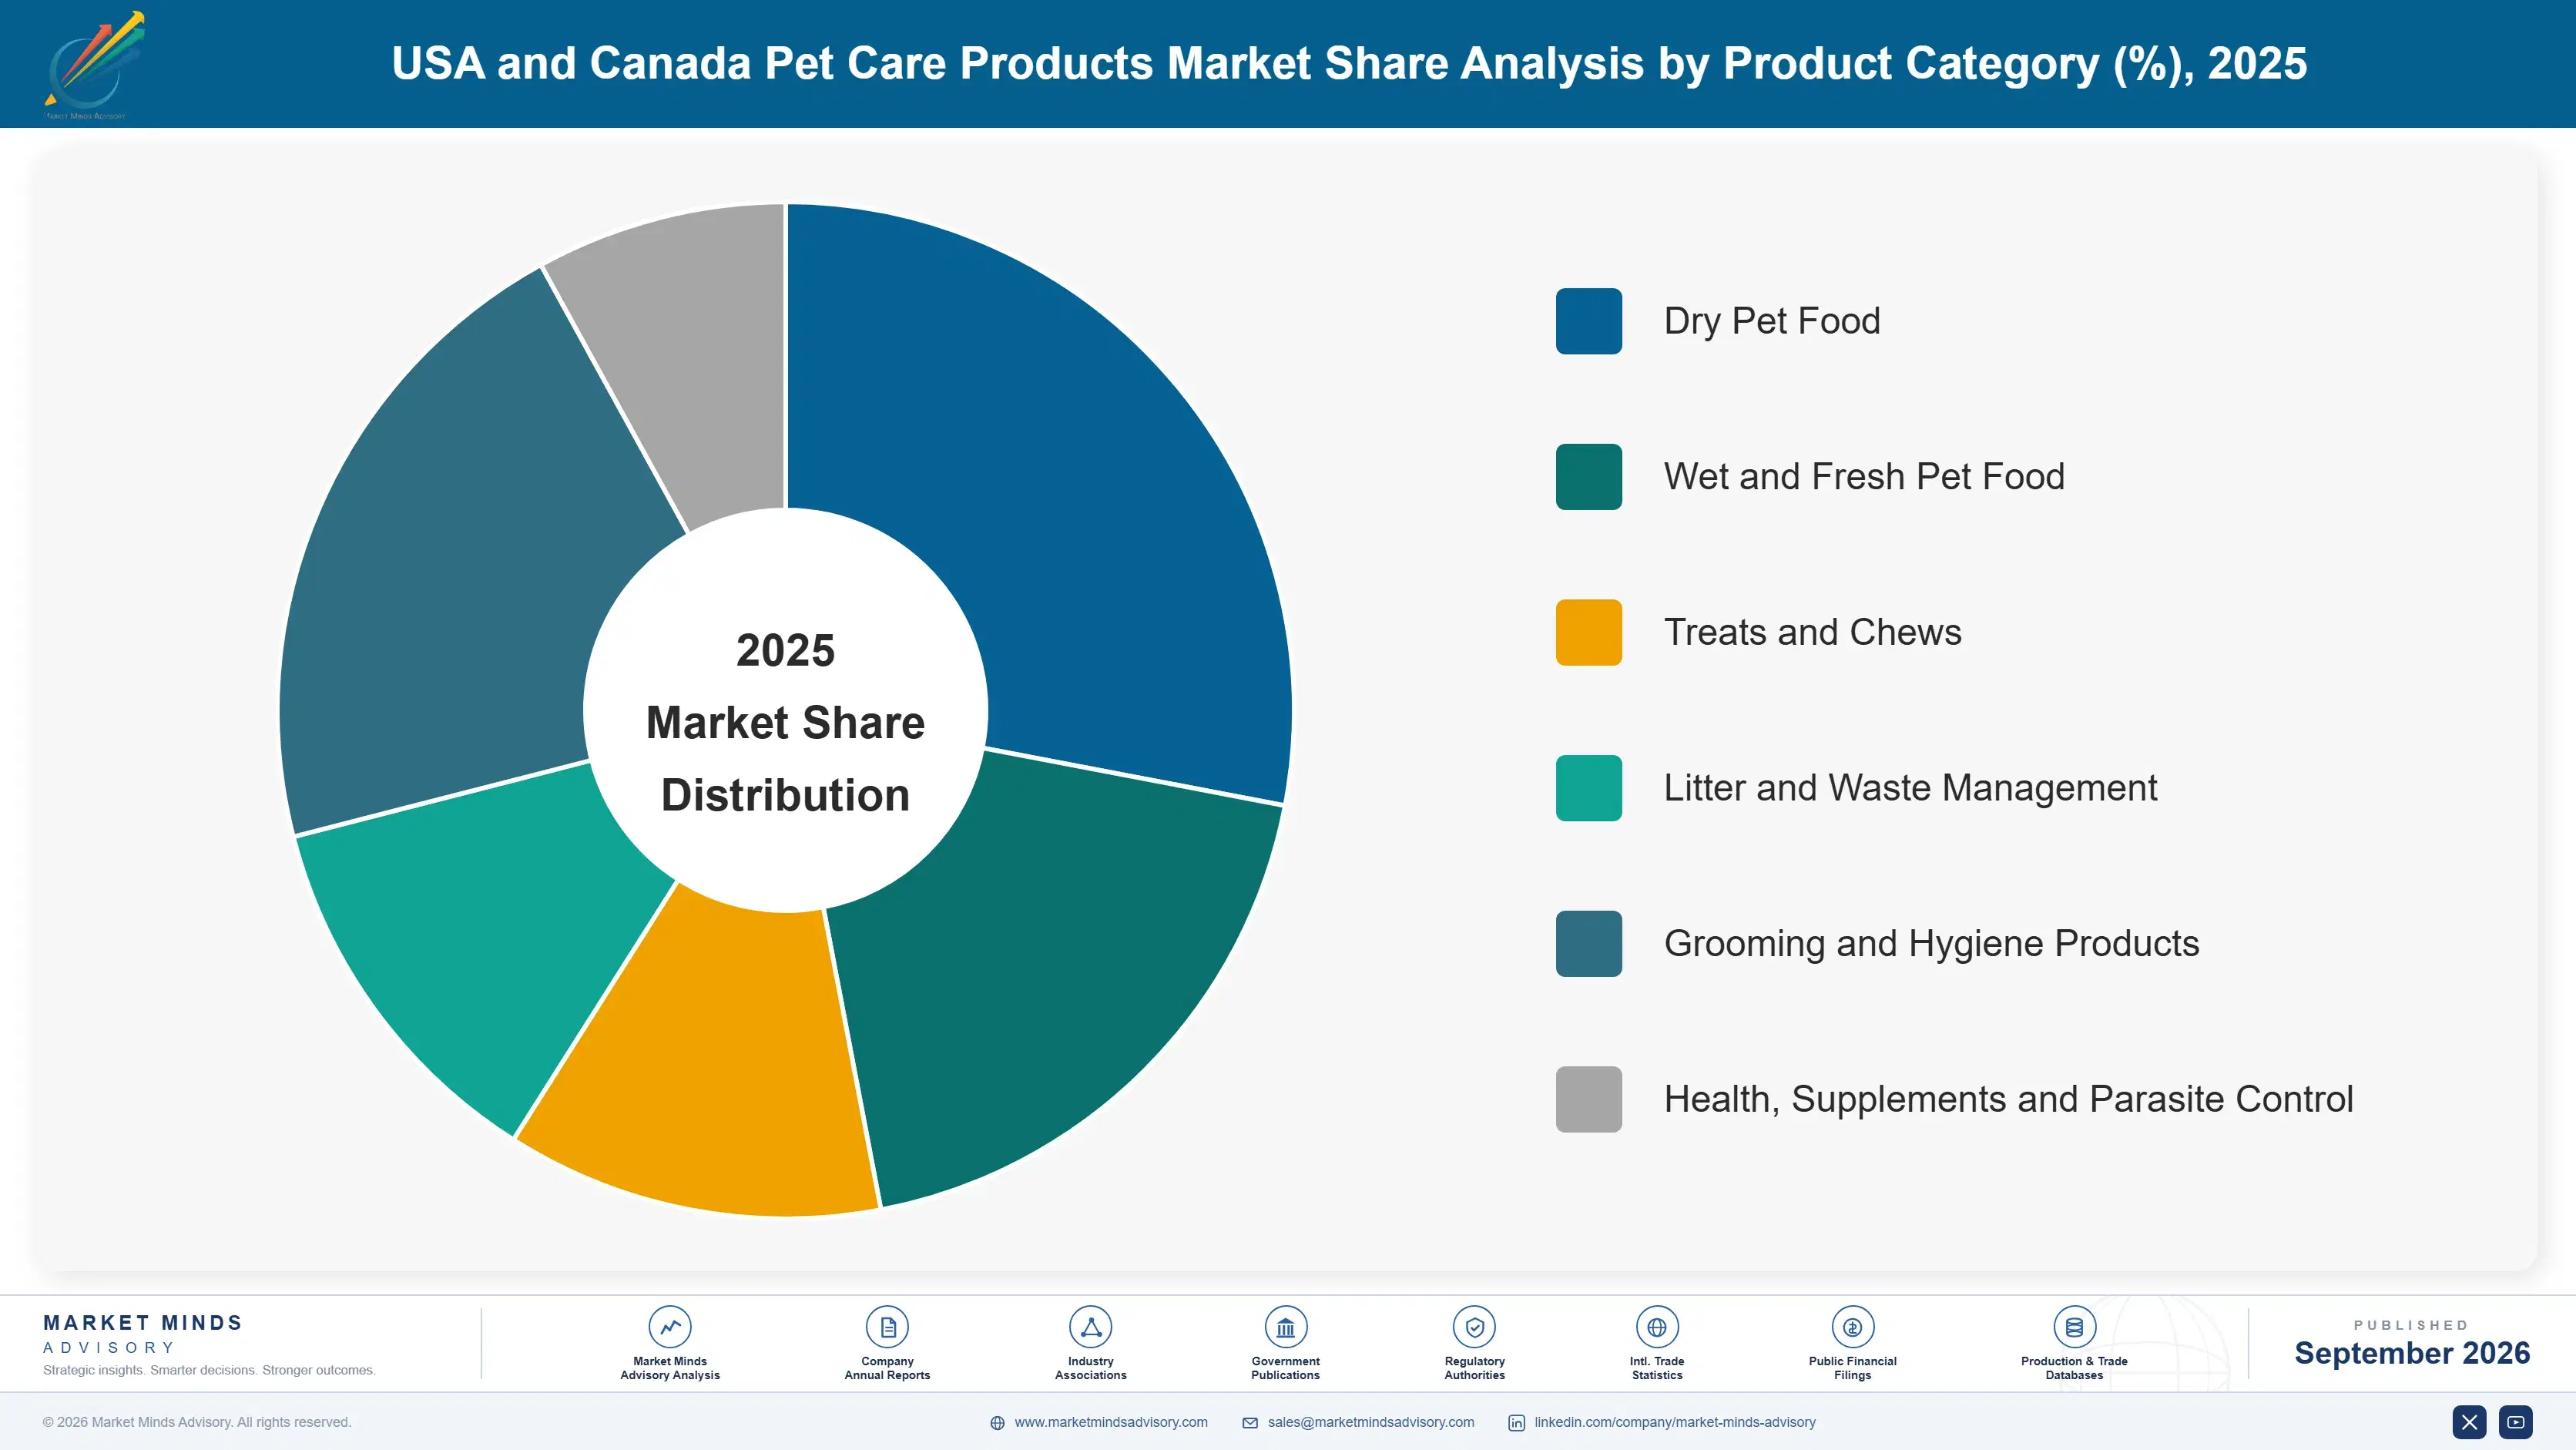
Segmentation follows product category, the dimension on which manufacturing, distribution, regulatory treatment and margin all divide together in this market. Six categories are assessed at retail value across the United States and Canada. Durable pet hardware, veterinary services, insurance, boarding and live animal sales sit outside scope. Both United States and Canadian demand are sized together.
usa-and-canada-pet-care-products-market-market-share-analysis-1790022803043

Wet And Fresh Pet Food

Wet and fresh formats grow at 6.9%, half again the market rate of 4.6%, and the change is that they have moved from supplementing a bowl to replacing part of it. Refrigerated and gently cooked products began as toppers added to kibble and are now substituting a meaningful share of daily feeding, which alters the volume mathematics rather than simply adding an accessory purchase. Cold chain reaching mainstream grocery and subscription delivery removing the storage objection both enabled it. Cost per feeding remains several times dry food, so partial substitution rather than full conversion is the normal pattern. Refrigerated distribution is an advantage ambient competitors cannot assemble quickly. Cold chain is the real barrier to entry.
CAGR 6.9%

Treats And Chews

Treats and chews grow at 5.8% and they behave commercially like a confectionery category attached to a nutrition one. Purchase is emotional, frequent and almost entirely uninfluenced by nutritional claims, which is why functional positioning around dental health, joints or calming has grown faster than the segment overall. Margins run well above dry food because the portions are small, the price per pound is high and nobody compares cost per feeding on a treat. Dental chews in particular occupy an unusual position, since veterinary endorsement of specific products gives them a credibility that ordinary treats cannot claim. Nobody compares cost per feeding on a treat, which is why price per pound here sits far above anything in the food aisle.
CAGR 5.8%
Full segment breakdown across 6 segments available in the complete report.

Regional Architecture and Country Demand Map

This report is scoped to the United States and Canada, so the regional table records where products serving those households are manufactured. Five origins consequently sit outside their standard share bands, which is flagged for operator ruling. Freight economics rather than capability explain the concentration.

North America

Domestic manufacture holds 72%, far outside the standard band, and pet food economics explain most of it. Kibble and wet food are dense, low-value products that do not travel economically, so plants sit close to the households they serve and close to the protein meal supply feeding them. Mars, Nestle, General Mills and Colgate-Palmolive all operate substantial North American manufacturing networks, and Freshpet's refrigerated capacity is domestic by definition. Litter is even more local, since clay is quarried and shipped short distances. Growth of 4.2% tracks the category rather than any sourcing shift. Plants sit close to both the households and the protein meal supply, which is not a strategic choice so much as an arithmetic one.
Share: 72% | CAGR: 4.2% (2026 to 2036)

South Asia and Pacific

At 9% this origin sits inside the standard band and its contribution is concentrated in treats, chews and rawhide alternatives rather than in complete foods. Vietnamese, Thai and Indian manufacture supplies a large share of the chew and dental treat category, where labour content is high and the products travel well relative to value. Growth of 6.4% is the fastest of any supply origin covered, tracking treat demand that grows faster than food. Regulatory scrutiny of imported treats has tightened repeatedly, which has consolidated supply toward larger facilities able to document their processes. Labour content is high in chew manufacture and the products travel well relative to their value, which is the combination that keeps this origin competitive.
Share: 9% | CAGR: 6.4% (2026 to 2036)
Regional intelligence for 5 additional markets available in the complete report: East Asia, Latin America, Western Europe, Eastern Europe, Middle East and Africa. Contact sales@marketmindsadvisory.com.
usa-and-canada-pet-care-products-market-country-cagr-analysis-1790022803570

Four Moves For This Market

These four follow from one uncomfortable fact: the animal population has stopped growing, so every point of growth must come from the same households spending more. Each has been executed by at least one participant with measurable results, and none requires new manufacturing capacity in either country. Two of the four are reallocations rather than investments.

State The Human Grade Definition Where It Applies

Human grade requires every ingredient and the production facility to meet human food standards, and roughly 3% of products actually satisfy that, while premium and natural carry no definition at all. Participants meeting the real bar and stating it explicitly report price realisation around 1.6 times comparable products using undefined premium language. The claim is checkable, which is precisely why competitors cannot match it, and it separates genuine differentiation from vocabulary in a tier where buyers currently discount everything equally. Two facilities in four already qualify at a typical manufacturer without anyone having checked.
Market Impact: Lifts price realisation to roughly 1.6 times higher

Build Subscription Distribution For Heavy Categories

Litter, large-format dry food and waste bags ship badly as one-off e-commerce purchases and suit recurring delivery precisely because of that weight and predictability. Around 39% of online pet purchases already arrive on a schedule, and those customers carry higher baskets and churn considerably less than one-off buyers. Participants with subscription distribution report customer retention roughly 2.4 times that of retail-only equivalents. The reliable half of this market has moved to recurring delivery and the discretionary half has not. Weight and predictability are what make recurring delivery work here, and the discretionary half does not follow.
Market Impact: Raises customer retention to roughly 2.4 times higher

Invest In Clinical Evidence For Veterinary Access

A diet recommended in a consulting room converts at rates no retail merchandising achieves and holds for the life of the condition being managed, and veterinary products carry the highest gross margins in this category. Access requires published feeding studies, regulatory documentation and a sales organisation calling on practices, which is why so few participants hold a position. Building that capability costs several years and a clinical programme rather than shelf negotiation. Participants entering report gross margins roughly 18 points above their retail ranges. It changes the economics of an entire portfolio rather than one line.
Market Impact: Adds roughly 18 points of gross margin overall

Follow Household Formation Rather Than Legacy Distribution

Regional pet populations are flat while their distribution shifts, and household formation across Texas, Arizona, the Carolinas and Florida is where new ownership actually occurs. Texas grows at 6.4% against 4.6% for the region. Those households form pet ownership earlier and buy through subscription more readily than established ones. Participants reweighting distribution and marketing toward growth geographies report volume growth roughly 1.7 times their regional average, on a reallocation rather than any increase in total spend. Legacy distribution maps were drawn against a population that has since moved. Reweighting costs nothing beyond the decision to stop defending the old map.
Market Impact: Delivers roughly 1.7 times the regional growth rate

Who Controls the Margin Pool

Concentration is high at 44% held by the top five, measured consistently on retail sales value across the United States and Canada rather than on tonnage, which would overweight dry food enormously. The leader to challenger gap is wide in manufacturing scale and in veterinary clinical access, both requiring years and capital to build, and narrower in formulation, where contract manufacturers including Alphia and Diamond produce competent product for anyone with a specification.
Competition runs on three dimensions currently. Retail shelf and online placement decides volume, and Chewy, Walmart, Costco and the specialty chains now hold substantial own-brand positions of their own. Clinical evidence decides veterinary access, which is where margin concentrates and where only a handful of participants can play. Manufacturing footprint decides cost, because dense low-value products do not travel and regional plant placement determines freight.

Pressure is building from retailer private label and from subscription platforms, and both are where positions will move. Private label at roughly 21% of retail value is taking the middle tier where brand premium is least defensible. Meanwhile subscription platforms are accumulating consumption data and customer relationships that manufacturers historically owned, which changes who knows what about the household.
usa-and-canada-pet-care-products-market-company-positioning-matrix-1790022804116

Competitive Moat and Risk Dimensions

MARS

Moat: Scale Across Food And Veterinary

Ownership of both the largest pet food portfolio and an extensive veterinary practice network places the company on both sides of the recommendation that drives the highest-margin purchases in this category. Manufacturing scale across North America also delivers freight and cost advantages in products that travel badly by their nature.
MARS

Risk: Channel Ownership Draws Scrutiny

Owning veterinary practices that recommend diets the same group manufactures invites regulatory and competitive attention, and any restriction on that arrangement would remove a genuine commercial advantage. Practice ownership also carries labour cost and clinical staffing pressures unrelated to the pet food business it supports.
NESTLE

Moat: Manufacturing Network And Brands

Purina brand depth across value, mainstream and premium tiers, supported by one of the largest North American manufacturing networks, gives the company both shelf breadth and the freight economics that dense low-value products demand. That combination is difficult for any challenger to replicate without comparable capital investment.
NESTLE

Risk: Mainstream Tier Under Private Label

Portfolio weighting toward mainstream and value tiers places substantial revenue exactly where retailer own brands at around 21% of retail value are taking share most effectively. Defending that tier on price erodes margin, while trading buyers upward competes against premium specialists whose positioning was built for it.

Players Tracked

Prominent Players

Mars
Nestle
General Mills
Colgate-Palmolive
Freshpet

Other Key Players

Post Holdings
Chewy
Central Garden and Pet
Spectrum Brands
Church and Dwight
Clorox
Elanco Animal Health
Zoetis
Diamond Pet Foods
Champion Petfoods
Wellness Pet Company
The Farmer's Dog
Oil-Dri Corporation
PetIQ
Alphia

Recent Developments

SEPTEMBER 2024

Freshpet expands refrigerated manufacturing capacity in Texas

The company added refrigerated production capacity at its Ennis facility to serve growing fresh pet food demand across the southern United States. This was organic capital investment funded internally, with no joint venture, acquisition or contract manufacturing partner involved anywhere. Existing ambient product lines were unaffected by the investment.
Signal: Cold chain capacity is being built ahead of demand rather than following it into the market.
JANUARY 2025

Colgate-Palmolive expands Hill's manufacturing capacity

The company added production capacity for therapeutic and wellness pet nutrition across its North American network. This was organic capital investment funded internally, involving no acquisition, divestiture or external manufacturing partner in any part of the programme. Retail and veterinary ranges were both covered by the expansion.
Signal: Veterinary nutrition capacity is now expanding where clinical access already exists rather than being actively contested.
JUNE 2025

Chewy expands veterinary practice network across additional states

The company opened further veterinary clinics, extending a network that connects clinical recommendation to its subscription retail platform. This was organic expansion funded internally, with no acquisition of an existing practice group or joint venture arrangement involved. Existing retail and pharmacy operations continued unchanged alongside.
Signal: Retail platforms are now buying into the recommendation channel rather than continuing to compete against it.

What Feeding A Pet Costs

Protein meals and fresh meat dominate pet food cost at roughly 38%, sourced from rendering operations and meat processors across North America and increasingly from Latin American suppliers. Grains, pulses and other carbohydrate sources add about 16%, fats and palatants around 9%, and vitamin and mineral premixes a further 6%. Packaging takes roughly 12%, since multiwall bags and retort pouches both cost more than expected.
The 2022 period demonstrated how exposed this structure is to agricultural markets rather than to anything pet-specific. Grain and protein meal prices rose sharply following supply disruption in Eastern European exporting regions, and USDA price series document the scale of movement across feed ingredient categories. General Mills and Freshpet reporting for that period both identify raw material and freight inflation across pet nutrition as requiring repeated pricing action.

Exposure varies sharply by formulation and by format. Fresh and refrigerated producers carry cold chain cost alongside ingredient exposure, which conventional manufacturers avoid entirely. Grain-free formulations carry pulse and potato exposure that moves on different agricultural cycles than grain. Litter producers face an entirely separate structure dominated by clay quarrying and short-haul freight on a product where transport regularly exceeds the material cost itself.
usa-and-canada-pet-care-products-market-cost-volatility-analysis-1790022804311

Contract protein meal supply across multiple rendering regions

Protein meal is the largest single cost line and it prices on livestock and rendering cycles that have nothing to do with pet demand. Contracting across several regional rendering operations smooths that exposure and protects formulation consistency, which matters because palatability shifts with meal source. Smaller manufacturers buy spot and absorb the whole movement.

Qualify alternative carbohydrate sources before formulation lock

Grain-free formulations concentrate exposure in pulses and potatoes that move on separate agricultural cycles and have attracted regulatory attention around cardiac outcomes. Qualifying alternatives at formulation stage costs a palatability and digestibility study. Doing it after a supply or regulatory event costs a reformulation and a relaunch. Cardiac outcome scrutiny has already raised the stakes on pulse-heavy formulations considerably.

Place litter production close to the clay and the customer

Litter transport regularly exceeds the material cost, since clay is heavy, low in value and quarried in specific geological regions. Production sited between the quarry and the consuming region minimises total freight rather than optimising either leg. Most litter footprints were established decades ago and no longer match where the households actually are. Households have moved since those decisions.

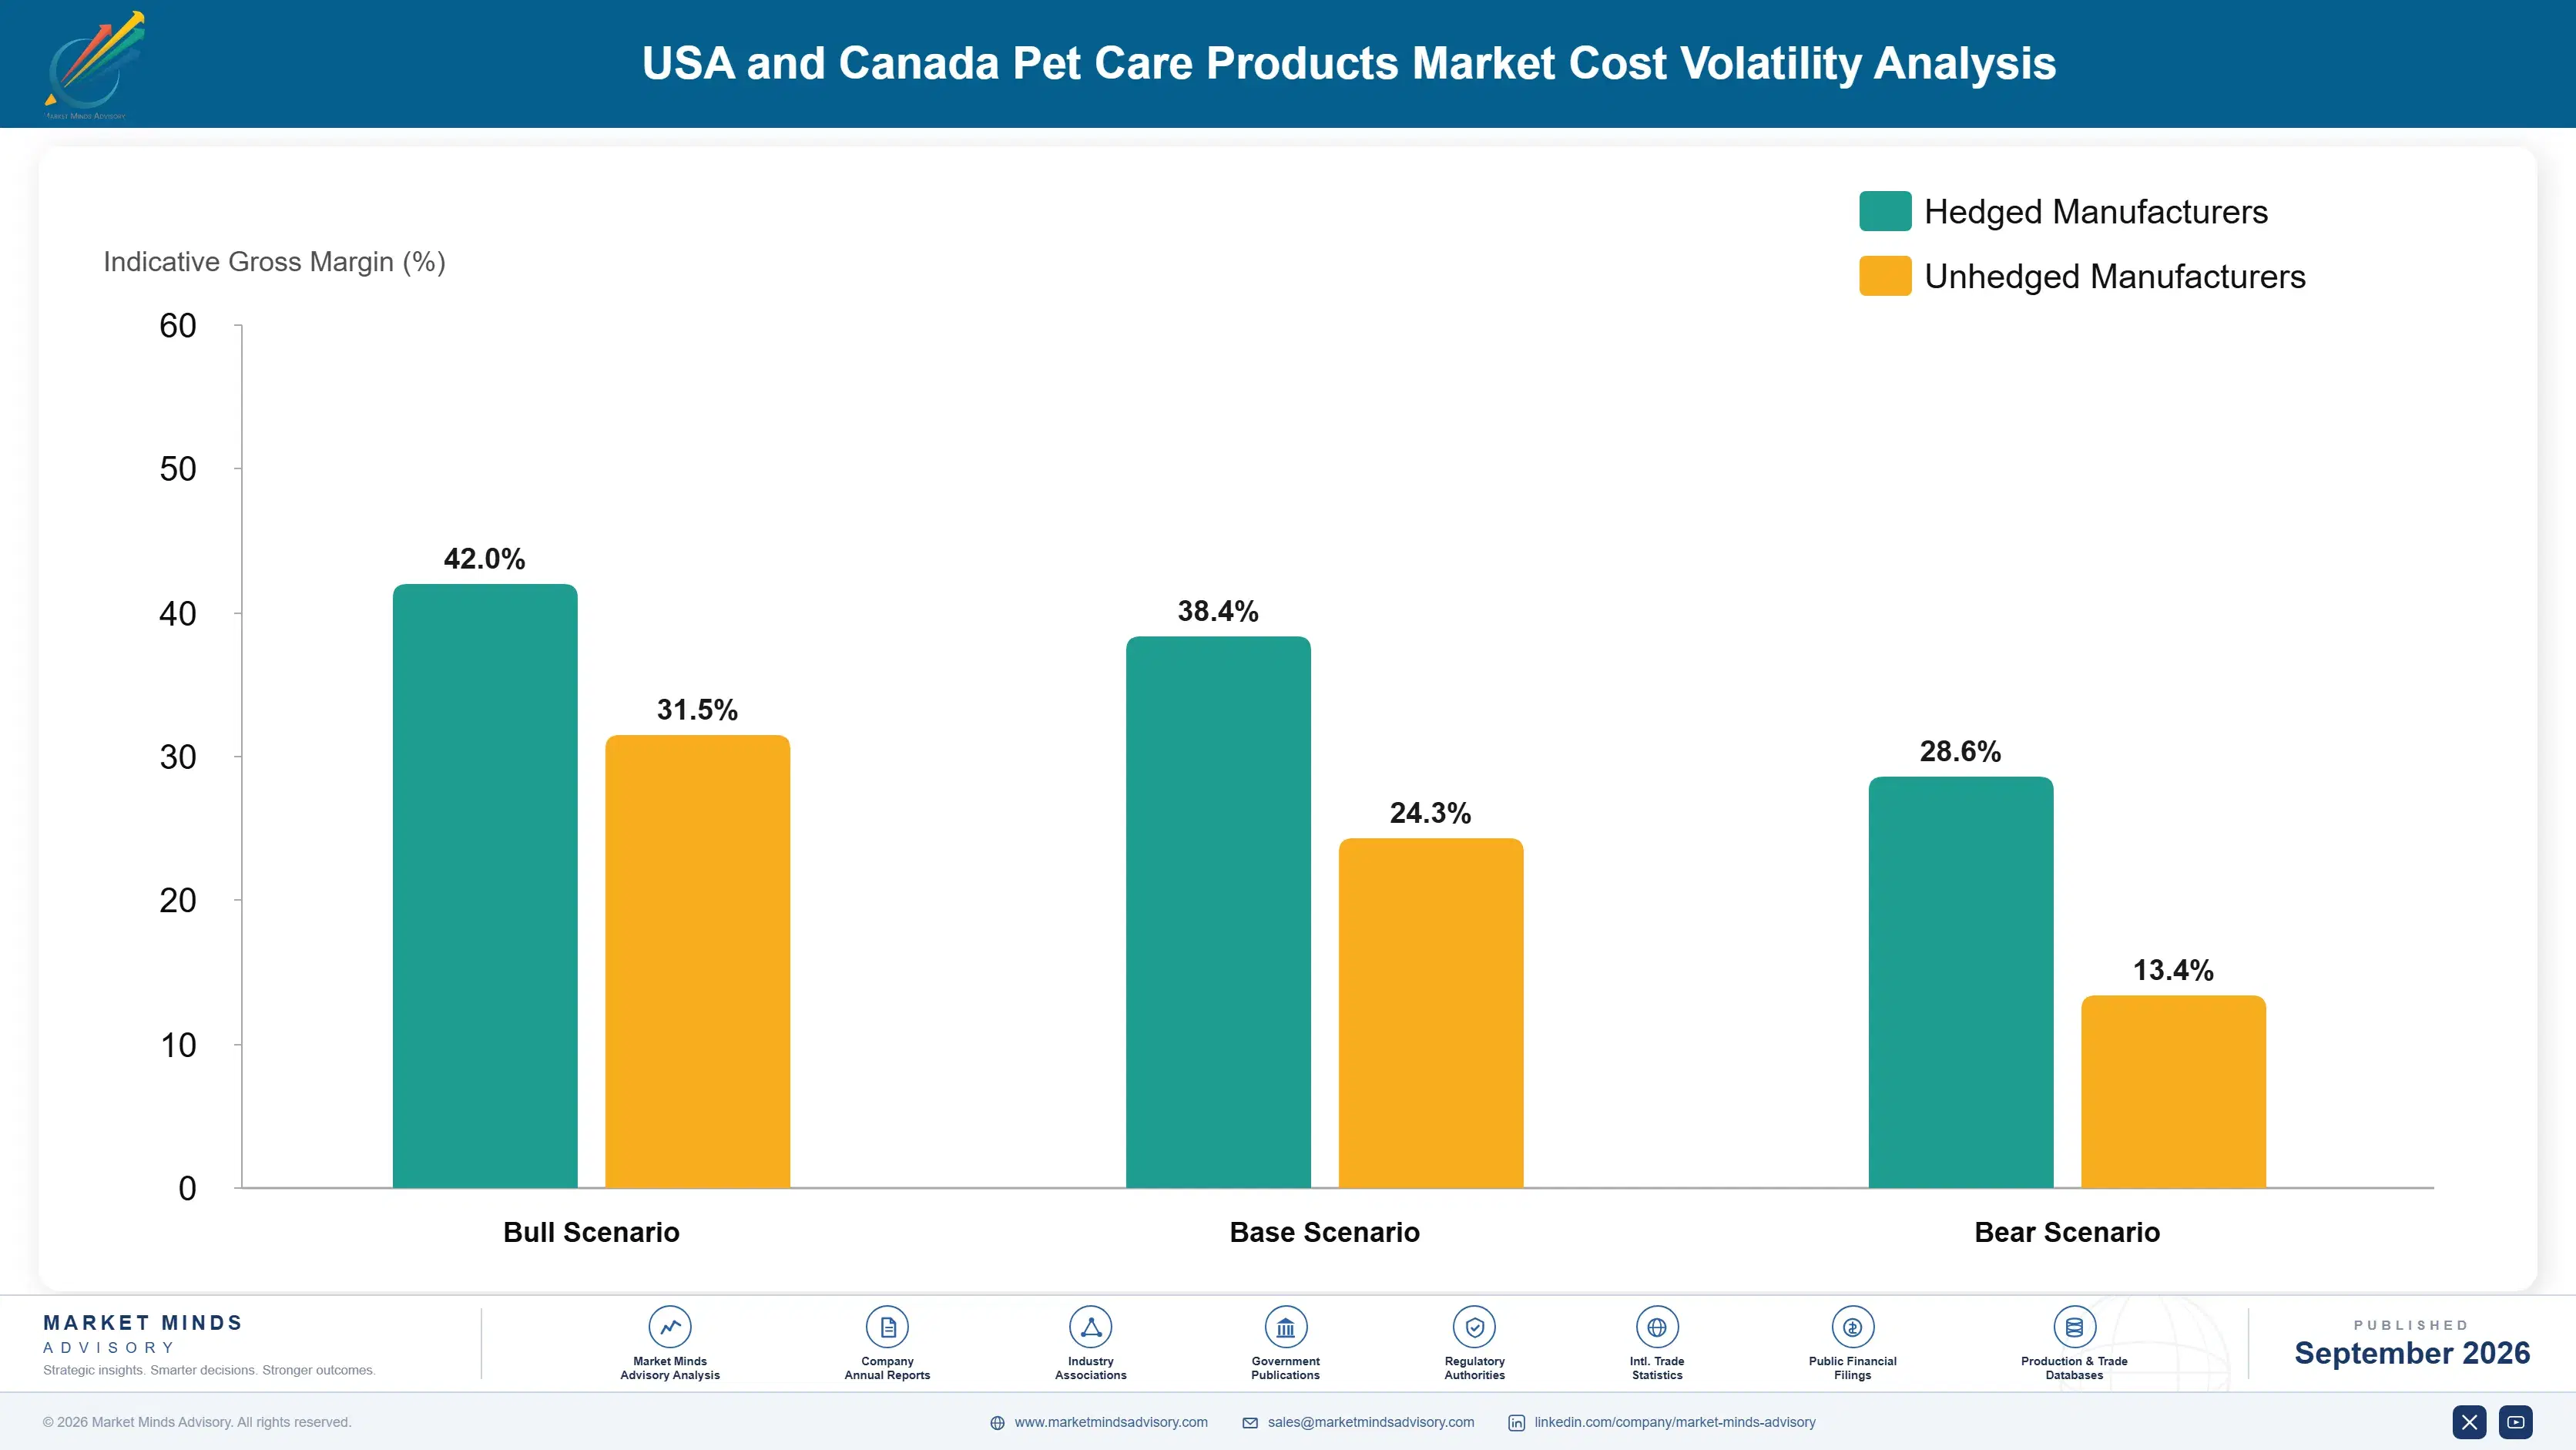
Portfolio Architecture for Margin Defence

Margin architecture divides by channel authority and by whether a claim can be substantiated, rather than by ingredient cost, which a formulation model would not predict. Mainstream dry food sold through mass and grocery runs at gross margins in the mid twenties to mid thirties, competing directly against retailer own brands that now hold roughly 21% of retail value and are taking the middle tier fastest.
Premium and fresh formats sold through specialty, subscription and online channels hold gross margins in the low to high forties. The spread reflects claim substantiation and distribution rather than ingredients, since two products with similar formulations can price far apart depending on whether anything behind the claim is checkable. Fresh formats carry cold chain cost that partly offsets the premium.

The highest-value pool sits in therapeutic and veterinary nutrition, at margins in the mid fifties to low sixties. A diet recommended in a consulting room converts at rates no merchandising achieves and holds for the duration of the condition. Mainstream volume keeps the plants running and funds the freight network. It does not fund the clinical programmes that open the tier above it.

Volume / Commodity-Adjacent

Mainstream dry food and litter sold through mass and grocery channels. Retailer own brands at roughly a fifth of retail value compete directly here, and brand premium is least defensible in exactly this tier.
Gross Margin: 26 to 34%

Premium / Certified

Premium and fresh formats sold through specialty, subscription and online channels. The eight-point range reflects claim substantiation and distribution rather than ingredients, with cold chain cost offsetting part of the premium.
Gross Margin: 40 to 48%

Sustainability / Regulatory / Next-Generation

Therapeutic and veterinary nutrition recommended in consulting rooms. Conversion and retention both exceed anything retail merchandising achieves, and access requires clinical evidence rather than shelf negotiation. Loyalty persists for the life of the condition.
Gross Margin: 54 to 62%
usa-and-canada-pet-care-products-market-portfolio-architecture-1790022804809

High-value Sub-segments and Strategic Watch-out

Therapeutic And Veterinary Nutrition

High value and steady growth. A diet recommended in a consulting room holds for the life of the condition managed, and access requires clinical evidence and a practice sales force rather than shelf space. Very few participants can play. Gross margins run roughly 18 points above retail ranges.
Gross Margin: 56 to 62%

Fresh And Refrigerated Formats

High value and high growth at 6.9%. Partial substitution rather than full conversion is the normal pattern, since cost per feeding runs several times dry. Refrigerated distribution cannot be assembled quickly by ambient competitors. Cold chain cost partly offsets the premium that these formats command at shelf.
Gross Margin: 42 to 48%

Mainstream Dry Food

Volume core, growing slowest at 3.2% and holding the tonnage while losing the value. Retailer own brands take this tier fastest, and defending it on price erodes the margin that funds everything above it. Tonnage without value is hard to defend when the retailer owns the alternative.
Gross Margin: 26 to 33%

Undefined Premium Claim Products

Strategic watch-out. Premium and natural carry no defined meaning, so genuinely differentiated products compete against vocabulary. The twelve-point range reflects how differently participants price a claim nobody can check. Genuinely differentiated products compete against vocabulary here, which suppresses willingness to pay across the whole tier.
Gross Margin: 34 to 46%

What Holds A Household

Demand here is animal-anchored rather than household-anchored, which gives the category a lifespan-shaped structure most consumer markets lack. A household feeds a specific animal for ten to fifteen years, and that relationship ends absolutely when the animal does. With populations growing at only 0.4% annually, replacement of animals leaving the population is doing more work than new ownership, and the moment of replacement is when brand choices reset entirely.
Stickiness varies sharply by how the product was chosen. Households on a veterinary diet for a managed condition are the most loyal by a wide margin, because switching requires a clinical conversation nobody initiates casually. Subscription customers hold well through inertia rather than preference, and cancel when the schedule stops matching consumption. Retail buyers switch on promotion readily, particularly in the mainstream tier where private label sits beside them.

Owner behaviour shifted in one direction since 2020. The cohort that acquired animals during the surge is now four or five years into ownership, past the intensive early spending phase and into a steadier pattern, and it has learned which claims mean something. That group asks about complete and balanced status and production standards now.
usa-and-canada-pet-care-products-market-end-use-penetration-index-1790022805302

Where The Growth Actually Is

These are among the four positions where our research anticipates prominent divergence between winners and laggards over the coming forecast period. Each is grounded in the demand model, the regulatory perimeter, and the announced capacity pipeline.
01 / CLAIM DEFINITION DISCIPLINE

Say human grade only where it actually applies

Human grade requires every ingredient and the production facility itself to meet human food standards, and roughly 3% of products satisfy that, while premium and natural carry no defined meaning at all. That lets undifferentiated products claim what genuinely differentiated ones claim and suppresses willingness to pay across the whole tier. Participants meeting the real bar and stating it explicitly report price realisation around 1.6 times comparable products relying on undefined vocabulary, and the claim is checkable, which is precisely why competitors cannot simply match it.
02 / SUBSCRIPTION DISTRIBUTION BUILDING

Own the recurring half of this market

Litter, large-format dry food and waste bags ship badly as one-off purchases and suit recurring delivery exactly because of that weight and predictability, and around 39% of online pet purchases already arrive on a schedule. Those customers carry higher baskets and churn considerably less than one-off buyers do. Participants with subscription distribution report retention roughly 2.4 times that of retail-only equivalents, which matters most in a market where the discretionary half is the vulnerable one, and the discretionary half of this market is the vulnerable one when spending tightens.
03 / CLINICAL EVIDENCE INVESTMENT

Buy the consulting room, not the shelf

A therapeutic diet recommended in a consulting room converts at rates no retail merchandising reaches and holds for the duration of the condition being managed, and veterinary products carry the highest gross margins in this category. Access requires published feeding studies, regulatory documentation and a sales organisation calling on practices, which takes several years to assemble. Participants who have entered report gross margins roughly 18 points above their retail ranges, which changes the economics of the whole portfolio, which changes portfolio economics rather than one line.
04 / GEOGRAPHIC REWEIGHTING DISCIPLINE

Sell where the households are actually forming

Regional companion animal populations grow at roughly 0.4% annually while their geographic distribution shifts substantially, and household formation across Texas, Arizona, the Carolinas and Florida is where new pet ownership actually happens. Texas grows at 6.4% against 4.6% for the region overall. Those households form ownership earlier and buy through subscription more readily, and participants reweighting distribution toward them report volume growth roughly 1.7 times their regional average, on a reallocation of existing spend rather than any increase in total investment.

Engagement Snapshot From the Field

A live engagement with an industry participant carrying material or product regulatory and market exposure ahead of a defining policy shift, showing how our research translates into a defensible multi-year portfolio strategy.
MARKET MINDS ADVISORY · CLIENT ENGAGEMENT SUMMARY
USA and Canada Pet Care Products Producer Strategic Portfolio Review and Transition Roadmap 2026·Investment Scenario on USA and Canada Pet Care Products Exposure Evaluation 2025-26
CLIENT PROFILE
A mid-sized North American pet food manufacturer selling premium dry and wet formats through specialty retail and grocery across the United States and Canada, with revenue near USD 480 million (client-reported, unverified by MMA). Premium positioning relied on natural and wholesome language with no substantiated claim behind it. Subscription channels accounted for 9% of revenue and no veterinary position existed anywhere in the portfolio.
STRATEGIC CHALLENGE
Volume had been flat for three years while the category grew, and management attributed it to retailer own brand expansion in specialty channels. A promotional investment programme had been approved to defend shelf position. Nobody had examined where category growth was actually occurring geographically, or whether the premium claims were doing any commercial work.
MMA APPROACH
MMA mapped category growth by state and province against the client's distribution weighting, then tested premium claim influence on purchase across 1,100 households. Production facilities were audited against the human grade production definition. Subscription and retail customer cohorts were compared on retention, basket value and lifetime contribution over three years.
KEY FINDINGS
  1. Regional pet populations grew at 0.4% while the client's distribution weighting matched a 2015 population map, leaving it underweight in every state where growth was occurring.
  2. Natural and wholesome claims showed no measurable influence on purchase intent among surveyed households, while human grade and complete and balanced both did.
  3. Two of the client's four facilities already met the human grade production definition without the claim being made, because nobody had checked against the standard.
  4. Subscription customers delivered 2.6 times the three-year contribution of retail customers at comparable acquisition cost, and the channel held 9% of revenue.
CLIENT PROFILE
A mid-sized North American pet food manufacturer selling premium dry and wet formats through specialty retail and grocery across the United States and Canada, with revenue near USD 480 million (client-reported, unverified by MMA). Premium positioning relied on natural and wholesome language with no substantiated claim behind it. Subscription channels accounted for 9% of revenue and no veterinary position existed anywhere in the portfolio.
STRATEGIC CHALLENGE
Volume had been flat for three years while the category grew, and management attributed it to retailer own brand expansion in specialty channels. A promotional investment programme had been approved to defend shelf position. Nobody had examined where category growth was actually occurring geographically, or whether the premium claims were doing any commercial work.
MMA APPROACH
MMA mapped category growth by state and province against the client's distribution weighting, then tested premium claim influence on purchase across 1,100 households. Production facilities were audited against the human grade production definition. Subscription and retail customer cohorts were compared on retention, basket value and lifetime contribution over three years.
KEY FINDINGS
  1. Regional pet populations grew at 0.4% while the client's distribution weighting matched a 2015 population map, leaving it underweight in every state where growth was occurring.
  2. Natural and wholesome claims showed no measurable influence on purchase intent among surveyed households, while human grade and complete and balanced both did.
  3. Two of the client's four facilities already met the human grade production definition without the claim being made, because nobody had checked against the standard.
  4. Subscription customers delivered 2.6 times the three-year contribution of retail customers at comparable acquisition cost, and the channel held 9% of revenue.
RECOMMENDED STRATEGY
Phase 1: Phase one: cancel the promotional programme and certify the two qualifying facilities so the human grade claim can be stated properly. Phase 2: Phase two: reweight trade and marketing investment toward Sun Belt growth geographies away from the legacy distribution map. The old map matched a population that moved. Phase 3: Phase three: build direct subscription distribution for the heavy formats where recurring delivery suits the product. Weight and predictability make the format work.
OUTCOME
Volume grew by roughly 11% across four quarters after three flat years (client-reported, unverified by MMA), with the human grade claim driving price realisation above the premium tier average. The promotional programme was abandoned, and subscription revenue reached 19% of the total within the first year of dedicated investment.

Frequently Asked Questions

Foundational context covering the market sizes, CAGR, scope, country, region and competition that inform every finding below. This section is provided to cover basics and most often pre-purchase conversations, answered from the MMA Primary Research Dataset.

What is the current size of the USA and Canada Pet Care Products Market?

The market was valued at USD 72.0 billion in 2025, rising to USD 75.3 billion in 2026. Sizing is at retail value across six product categories.

How large will the USA and Canada Pet Care Products Market be by 2036?

MMA forecasts USD 118.1 billion by 2036, an increase of USD 42.8 billion over the 2026 base. That represents expansion of 1.57 times across the forecast period.

What is the CAGR for this market 2026 to 2036?

The base case CAGR is 4.6%, with a bull case of 5.8% and a bear case of 3.4%. Historical growth between 2020 and 2025 ran at 3.5%.

Which segment is growing fastest?

Wet and fresh pet food grows at 6.9%, half again the market rate, as refrigerated formats move from supplementing a bowl to replacing part of it. Treats and chews follow at 5.8%.

Who are the major companies in this market?

Mars, Nestle, General Mills, Colgate-Palmolive and Freshpet lead on retail value, holding a combined 44%. Retailer own brands now carry roughly a fifth of retail value across the region.

Which country is growing fastest?

This report is scoped to the United States and Canada, so comparison runs between states and provinces. Texas grows fastest at 6.4%, on household formation the rest of the region no longer delivers.

Report Segmentation Architecture

The full report scope spans multiple orthogonal segmentation dimensions, with cross-tabulated demand data provided for each dimension pair. Coverage extends further to regional breakdowns, trend trajectories, and the competitive detail needed to support segment-level decision-making.

By Product Category

  • Dry Pet Food
  • Wet and Fresh Pet Food
  • Treats and Chews
  • Litter and Waste Management
  • Grooming and Hygiene Products
  • Health, Supplements and Parasite Control

By End-Use Animal

  • Dogs
  • Cats
  • Small Mammals
  • Birds
  • Fish and Aquatics
  • Reptiles and Exotics

By Distribution Channel

  • Pet Specialty Retail
  • Mass and Grocery Retail
  • Online Subscription Platforms
  • Veterinary Practices
  • Club and Warehouse Retail
  • Independent Pet Retail

By Region

  • North America
  • South Asia and Pacific
  • East Asia
  • Latin America
  • Western Europe
  • Eastern Europe
  • Middle East and Africa

Scope, Methodology, and Coverage

Every figure in this report is reproducible from documented input assumptions. The scope below maps the historical period, the forecast horizon, the segmentation dimensions, and the countries covered, alongside the underlying primary and qualitative methodology.
Historical Period
2020 to 2025
Forecast Period
2026 to 2036
Base Year
2025 (USD billions; MMA Primary Research Dataset, September 2026)
Market Definition
This market covers pet care products sold to households across the United States and Canada, spanning dry pet food, wet and fresh pet food, treats and chews, litter and waste management, grooming and hygiene products, and health, supplements and parasite control. Sizing is at retail value across pet specialty, mass, grocery, online subscription, veterinary, club and independent channels. Durable pet hardware including collars, leads, beds, crates, carriers and toys, veterinary services and diagnostics, pet insurance, boarding and grooming services, and live animal sales are excluded throughout.
Quantitative Units
USD billions at retail value; volume in millions of tons; spend per companion animal in dollars annually.
Segmentation Dimensions
Product category, end-use animal, distribution channel, and supply origin region.
Regions Covered
North America, South Asia and Pacific, East Asia, Latin America, Western Europe, Eastern Europe, Middle East and Africa
Countries Covered
United States and Canada, with analysis across Texas, California, Florida, New York, Ontario and Alberta
Key Companies Profiled
Mars, Nestle, General Mills, Colgate-Palmolive, Freshpet, Post Holdings, Chewy, Central Garden and Pet, Spectrum Brands, Church and Dwight, Clorox, Elanco Animal Health, Zoetis, Diamond Pet Foods, Champion Petfoods, Wellness Pet Company, The Farmer's Dog, Oil-Dri Corporation, PetIQ, Alphia
Quantitative Methodology
Primary survey, n=3,800 respondents, Q4 2025, six countries; demand-side model with trade association cross-validation
Qualitative Methodology
47 expert interviews, Q4 2025; applied to validate demand model assumptions, identify emerging dynamics, and assess competitive positioning
Report Format
PDF and XLSX data workbook (Word format preview document)
Publisher
Market Minds Advisory
Report Code
MMA-2026-CON-784
Published
September 2026
Contact
sales@marketmindsadvisory.com | www.marketmindsadvisory.com

Purchase the full USA and Canada Pet Care Products Market Report (2026 to 2036).

The full report sizes the American and Canadian pet care products market across six product categories, six end-use animals and six distribution channels, with supply-origin analysis covering all seven global manufacturing regions. It includes category growth mapped by state and province against participant distribution weighting. Premium claim influence on purchase intent is tested directly across surveyed households, and production facilities are audited against the human grade definition. Subscription and retail customer cohorts are compared on retention, basket value and lifetime contribution. Competitive assessment covers 20 participants on a consistent retail value basis.
Category growth mapped by state and province
Premium claim influence tested across surveyed households
Production audited against the human grade definition
Subscription and retail cohorts compared on lifetime contribution
Six product categories sized through 2036
Twenty participants assessed on retail sales value

Built For The People Who Decide

From boardroom strategy to bench-side execution, this report is read cover-to-cover by leaders shaping the next decade of their industry, turning demand scenarios, market dynamics and valuation benchmarks into decisions.
CXOs/ Presidents/ VPs/ Managers
M&A and Corporate Development
Strategy Teams and R&D Heads
Procurement and Product Directors
Regulatory and Compliance Leaders
Investor Relations and Equity Analysts