Market Minds Advisory
USA and Canada Copper Market

USA and Canada Copper Market: Electrification Demand Reshaping North American Copper Supply Chains

Grid modernization, electric vehicle manufacturing, and data center construction are driving electrification-linked copper demand across the United States and Canada even as domestic mine output struggles to keep pace with rising regional consumption.

Lead Analyst

Bilal Shaikh

Published

September 2026

Make Smarter Decisions with Customized Research Insights

Request a free sample report and evaluate market opportunities, growth trends, and competitive dynamics relevant to your business needs.

2025 MARKET VALUE$42.5BMarket Size 2025
2036 FORECAST VALUE$66.1BBase Case , 2026 to 2036
CAGR 2026 TO 20364.1 %Bull 5.4% / Bear 2.8%
INCREMENTAL OPPORTUNITY$21.9BNet 10- year value creation
EXPANSION MULTIPLE1.49x2036 value over 2026 base
Strategic Levers
M&A Pipeline
Regional Outlook
Country Rankings
Competitive Intelligence
Segmental Deep-dive
Call-Us : 91 93563 13602

Executive Snapshot and Market Trajectory

Electrification demand from grid modernization, electric vehicle assembly, and data center construction is outpacing domestic mine output growth across the United States and Canada, widening the region's reliance on imported refined copper and concentrate feedstock needed to meet rising annual consumption levels.
Wire rod producers serving utility and EV harness manufacturers are capturing the fastest volume growth, while permitting delays continue to slow new domestic mine and smelter capacity additions across both countries. Import dependence on Chilean and Peruvian concentrate, together with recycled scrap supply, increasingly determines how much of this incremental demand domestic refiners can actually serve without further price-driven rationing across downstream fabricators serving utility, automotive, and data center customers across most markets. every quarter.
Competitive dynamics increasingly favor integrated producers with domestic mining, smelting, and fabrication capability, since tariff policy and critical minerals incentives under recent US legislation reward vertically integrated North American supply chains over import-dependent fabricators. Consolidation among mid-tier wire rod and tube producers is accelerating as scale becomes a stronger determinant of contract wins. Buyers increasingly weigh documented sourcing resilience alongside price when awarding large multi-year contracts to competing suppliers.
Market Definition
This market covers copper cathode, copper wire rod, copper tube and pipe, copper sheet and strip, copper alloy products, and secondary refined copper produced for consumption within the United States and Canada. It excludes copper mining exploration services and copper trading or hedging activity conducted independently of physical product sales.
Base Year Value
$42.5B in 2025 (MMA Primary Research Dataset, August 2026)
Forecast Period
2026 to 2036, eleven discrete annual values
CAGR
4.1% base case. Bull 5.4%. Bear 2.8%.
Fastest Growth Segment
Copper Wire Rod: 5.6% CAGR
Fastest Growth Country
United States: 4.4% CAGR
Fastest Growth Region
South Asia and Pacific: 6.0% CAGR
Largest Region
North America: 90% of 2025 global value
Market Leaders
Freeport-McMoRan, Southern Copper Corporation, Wieland Group, Mueller Industries, and Teck Resources. Source: MMA Analysis based on company annual reports.
Primary Survey
n=3,800 procurement and R&D decision-makers, Q4 2025, six countries
Methodology
Demand-side build-up, cross-validated against public data, 47 expert interviews

USA and Canada Copper Market Forecast Scenarios

usa-and-canada-copper-market-trends-size-forecast-scenario-1787310953726
Between 2020 and 2025 demand grew unevenly as pandemic-era manufacturing disruption gave way to a sharp recovery in construction and electrical equipment output, with growth accelerating further from 2023 as data center and grid investment announcements multiplied across both countries, implying roughly 3.4% historical annual growth over the full period studied through year-end 2025. US Census Bureau data confirms this acceleration pattern.
The base case assumes continued growth anchored in three commercial mechanisms: utility grid modernization programmes replacing aging transmission and distribution infrastructure, electric vehicle and battery plant construction requiring large wire rod and busbar volumes, and data center construction consuming substantial copper for power distribution and cooling systems. Together these mechanisms sustain above-trend demand even as higher interest rates periodically slow residential construction activity across parts of both countries through the decade.
A bull scenario centers on accelerated grid investment tied to renewable interconnection queues clearing faster than expected, lifting wire rod demand sharply across utility contracts. The bear case involves a prolonged manufacturing slowdown that delays planned EV and battery plant construction, pushing several announced facilities beyond their original commissioning timelines and softening near-term fabricated product demand.

Electrification Demand Meets Constrained Domestic Supply

Electrification is reshaping who buys copper and how much they need, with utilities, EV assemblers, and data center developers now competing for wire rod tonnage that previously flowed mainly to construction and general manufacturing buyers across the region, forcing fabricators to reprioritize which customer segments receive allocation during periods of tight supply and elevated exchange pricing. This reallocation is already visible in how mills structure their order books.
MARKET CONCENTRATION (CR5)36%moderately concentrated production and fabrication base overall today
AVERAGE SELLING PRICE TREND+4.2% p.a.prices tracking global exchange benchmarks with regional premiums
IMPORT DEPENDENCE SHARE44%refined copper and concentrate imported to meet total demand
SMELTER CAPACITY UTILISATION81%domestic smelters running near practical maximum output levels
SCRAP FEEDSTOCK SHARE33%recycled copper increasingly substituting for primary mine output
ELECTRICAL DEMAND SHARE52%wiring and grid uses dominate total consumption volume today
Commercial activity increasingly rewards producers who can guarantee delivery reliability over producers competing purely on price, since utilities and EV manufacturers building multi-year capital projects cannot tolerate supply interruptions that would delay commissioning schedules already under public and investor scrutiny across both countries. Suppliers without documented reliability track records increasingly struggle to win the largest, most valuable contracts.
Over the next decade, permitting reform for domestic mining projects, recycled scrap recovery rates, and the pace of grid interconnection approvals will determine how much of this incremental electrification demand can be met domestically rather than through continued import dependence on South American concentrate suppliers. Producers positioned ahead of these shifts stand to capture outsized share of the incremental volume.
"Every utility procurement officer we talk to now asks about delivery certainty before price. Nobody wants to be the reason a substation upgrade slips a year."
Director, Industrial Materials and Metals Practice · MMA Chemicals and Materials

Market Trends

Grid Modernization Programmes Lifting Wire Rod Demand

Utility-led transmission and distribution upgrade programmes across the United States, supported by federal infrastructure funding and state-level grid resilience mandates, are driving sustained wire rod and cable demand well above historical replacement cycles. Utilities have announced capital plans exceeding $180 billion in grid infrastructure spending through the early 2030s, with copper wire and cable representing a meaningful share of total materials procurement across new substation, transmission line, and distribution network projects planned across most major regional utility service territories nationwide currently. Utilities without secured wire rod contracts risk falling behind schedule on public commitments.
Market Impact: Adds $120 billion committed EV inve
Data Center Construction Consuming Rising Copper Volumes

Hyperscale data center construction tied to cloud computing and AI infrastructure buildout is consuming substantial copper volumes for power distribution, busbars, and cooling systems, with individual large facilities requiring several thousand tonnes of copper products each. Announced data center capacity additions across the United States and Canada exceed 15 gigawatts of planned power capacity through 2030, and each new facility typically breaks ground with copper procurement contracts locked in well ahead of construction completion across most major projects. Developers without pre-secured supply increasingly face longer lead times as demand concentrates among qualified producers.
Market Impact: Adds 400,000 tonnes planned capacit

Market Opportunities and Growth Drivers

Electric Vehicle and Battery Plant Construction Across Both Countries

Electric vehicle assembly and battery manufacturing plant construction across the United States and Canada, supported by federal manufacturing incentives, is creating substantial new copper wire rod and busbar demand as each facility requires large volumes for motor windings, battery interconnects, and charging infrastructure. Announced EV and battery plant investments across both countries exceed $120 billion in committed capital since 2021, with several dozen facilities under construction or newly commissioned across multiple states and provinces currently ramping toward full production volume over the coming several years. Early plant relationships position suppliers to capture repeat volume as facilities scale.
Market Impact: Delays 400,000 tonnes potential out

Federal Critical Minerals Incentives Favoring Domestic Supply Chains

Recent US federal legislation extending critical minerals production incentives is encouraging new domestic copper mining, smelting, and recycling investment, reducing longer-term import dependence even as near-term supply remains constrained. Several announced domestic smelter expansion and recycling facility projects together represent more than 400,000 tonnes of planned incremental annual refined copper capacity, though most of these projects will not reach full commercial production until the early 2030s given lengthy permitting and construction timelines typical of large-scale metallurgical facility projects. Producers investing early in these projects secure favorable positioning well ahead of slower-moving competitors.
Market Impact: Exposes 44% to volatility

Market Restraints and Challenges

Permitting Delays Slowing Domestic Mine Capacity Additions

New domestic copper mine development in the United States routinely faces permitting timelines exceeding ten years, far longer than comparable projects in other major producing countries. The root cause is a multi-agency federal and state environmental review process with extensive public comment and litigation exposure that developers cannot easily accelerate. Some mining companies are pursuing brownfield expansions at existing permitted sites and partnering with recycling operators to supplement primary output while newer greenfield projects work through review, reducing near-term reliance on lengthy new permit approvals. Full commercial resolution of the permitting backlog remains years away for most greenfield projects.
Market Impact: Adds $180 billion grid capital spen

Import Price Exposure to Global Exchange Benchmark Volatility

Domestic fabricators remain exposed to global copper exchange pricing volatility since roughly 44% of regional refined copper and concentrate supply is imported, leaving buyers unable to fully insulate contract pricing from swings driven by Chinese demand shifts and South American production disruptions. The root cause is thin domestic mine and smelter capacity relative to consumption. Several large fabricators are now negotiating longer-term supply contracts with fixed price collars and expanding scrap procurement relationships to reduce reliance on spot market purchases during periods of elevated exchange price volatility. This dynamic increasingly separates integrated domestic producers from import-reliant fabricators lacking comparable hedges.
Market Impact: Adds 15 GW capacity
3 additional market trends, 4 additional growth drivers, and 3 additional restraints and challenges are covered in the full report. Contact sales@marketmindsadvisory.com to access the complete intelligence.

Segment CAGR and Growth Architecture

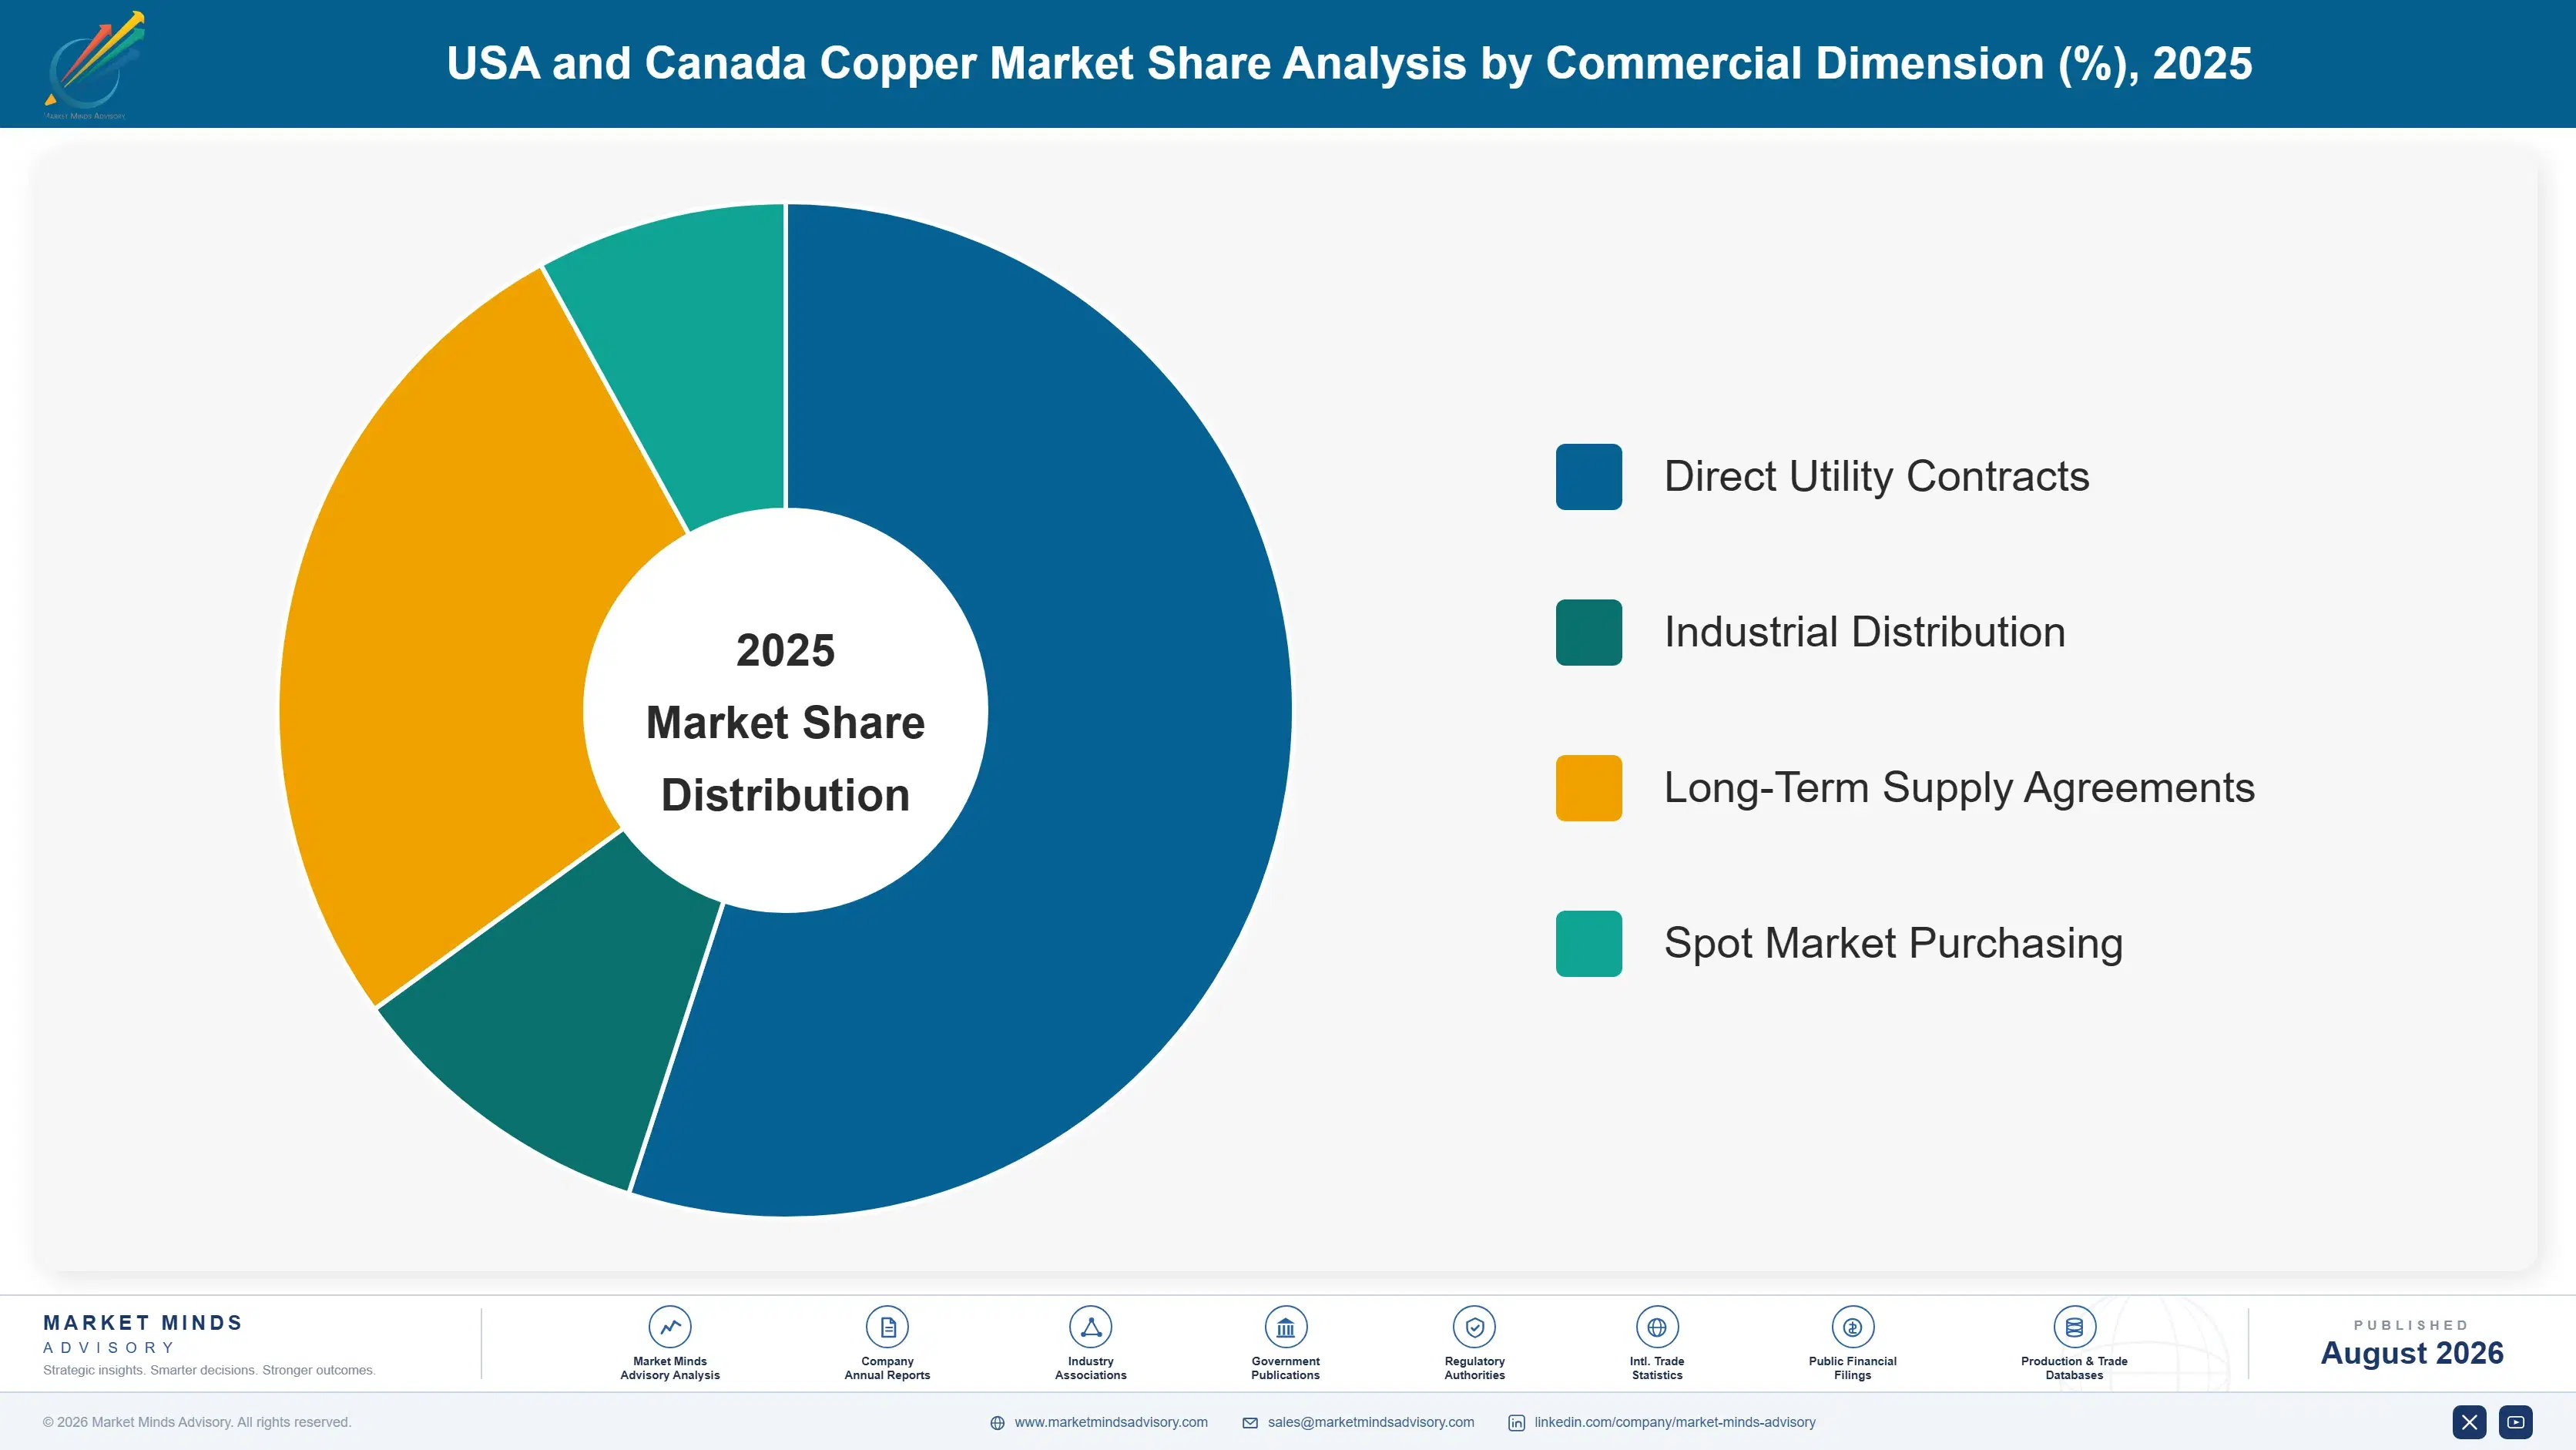
The market is segmented by product form, the classification that best reflects how buyers actually specify and procure copper products, since wire rod, tube, sheet, and alloy buyers each serve distinct downstream industries with different technical specifications, procurement cycles, and pricing structures across the value chain. Each dimension carries distinct qualification cycles that materially affect switching costs.
usa-and-canada-copper-market-trends-market-share-analysis-1787310954265

Copper Wire Rod

Copper wire rod is the fastest-growing product category as utility grid modernization, electric vehicle motor and harness manufacturing, and data center power distribution all compete for the same base material. Wire rod producers increasingly qualify their output against specific conductivity and purity standards required by utility and automotive buyers, creating switching costs that favor established suppliers with long qualification histories. Demand growth here consistently outpaces general construction-linked copper consumption, since electrification projects require substantially more copper per unit of economic activity than the residential and commercial construction that historically drove wire rod demand. Producers with domestic rod mill capacity are capturing disproportionate share of new utility and EV supply contracts as buyers increasingly prioritize delivery reliability over marginal price differences.
CAGR 5.6%

Secondary and Recycled Copper

Secondary and recycled copper is growing meaningfully faster than primary refined output as fabricators seek to reduce exposure to import-dependent primary supply and capture sustainability-linked procurement preferences from utility and automotive customers. Scrap collection and processing infrastructure has expanded substantially across both countries, though feedstock availability still varies regionally depending on local industrial and construction demolition activity. Recyclers with advanced sorting and refining technology are capturing premium pricing for higher-purity recycled cathode suitable for direct substitution in wire rod production, a capability that lower-technology scrap processors cannot match. This segment increasingly functions as a buffer supply source that fabricators lean on more heavily whenever primary import costs rise sharply. Buyers increasingly ask for documented recycled content disclosure alongside standard purity.
CAGR 4.9%
Full segment breakdown across 6 segments available in the complete report.

Regional Architecture and Country Demand Map

This report's scope is explicitly confined to the United States and Canada. North America therefore accounts for the overwhelming majority of market value by definition, with the small remainder reflecting cross-border trade linkage to other producing and consuming regions worldwide. Trade linkage explains the remaining share attributed to the.

North America

[Out-of-band justification: this report's scope is explicitly the United States and Canada, so North America captures the overwhelming majority of market value by definition rather than by competitive dominance alone.] The United States accounts for the large majority of regional demand, anchored in grid modernization spending, electric vehicle and battery plant construction, and hyperscale data center buildout concentrated in Texas, Arizona, Georgia, and the Midwest. Canada contributes a smaller but growing share, tied to its own grid infrastructure renewal programmes and mining sector investment in Ontario and Quebec. Both countries increasingly compete for the same import-dependent concentrate and refined copper supply, since domestic mine and smelter capacity has not kept pace with electrification-driven consumption growth across either country's manufacturing and.
Share: 90% | CAGR: 4.3% (2026 to 2036)

Western Europe

[Out-of-band justification: Western Europe's share sits below the standard band because this report's scope is confined to the United States and Canada; its listed share instead reflects trade and pricing linkage rather than domestic consumption.] European copper fabricators, particularly in Germany and Italy, compete with North American buyers for the same globally traded refined copper and concentrate supply, meaning price movements in European exchange markets influence North American contract negotiations even though physical volumes rarely cross the Atlantic in either direction at meaningful scale. Some specialty European copper alloy producers do export finished components into North American electrical equipment manufacturing supply chains, representing the modest trade linkage captured in this regional figure.
Share: 3% | CAGR: 2.5% (2026 to 2036)
Regional intelligence for 5 additional markets available in the complete report: East Asia, South Asia and Pacific, Latin America, Middle East and Africa, Eastern Europe. Contact sales@marketmindsadvisory.com.
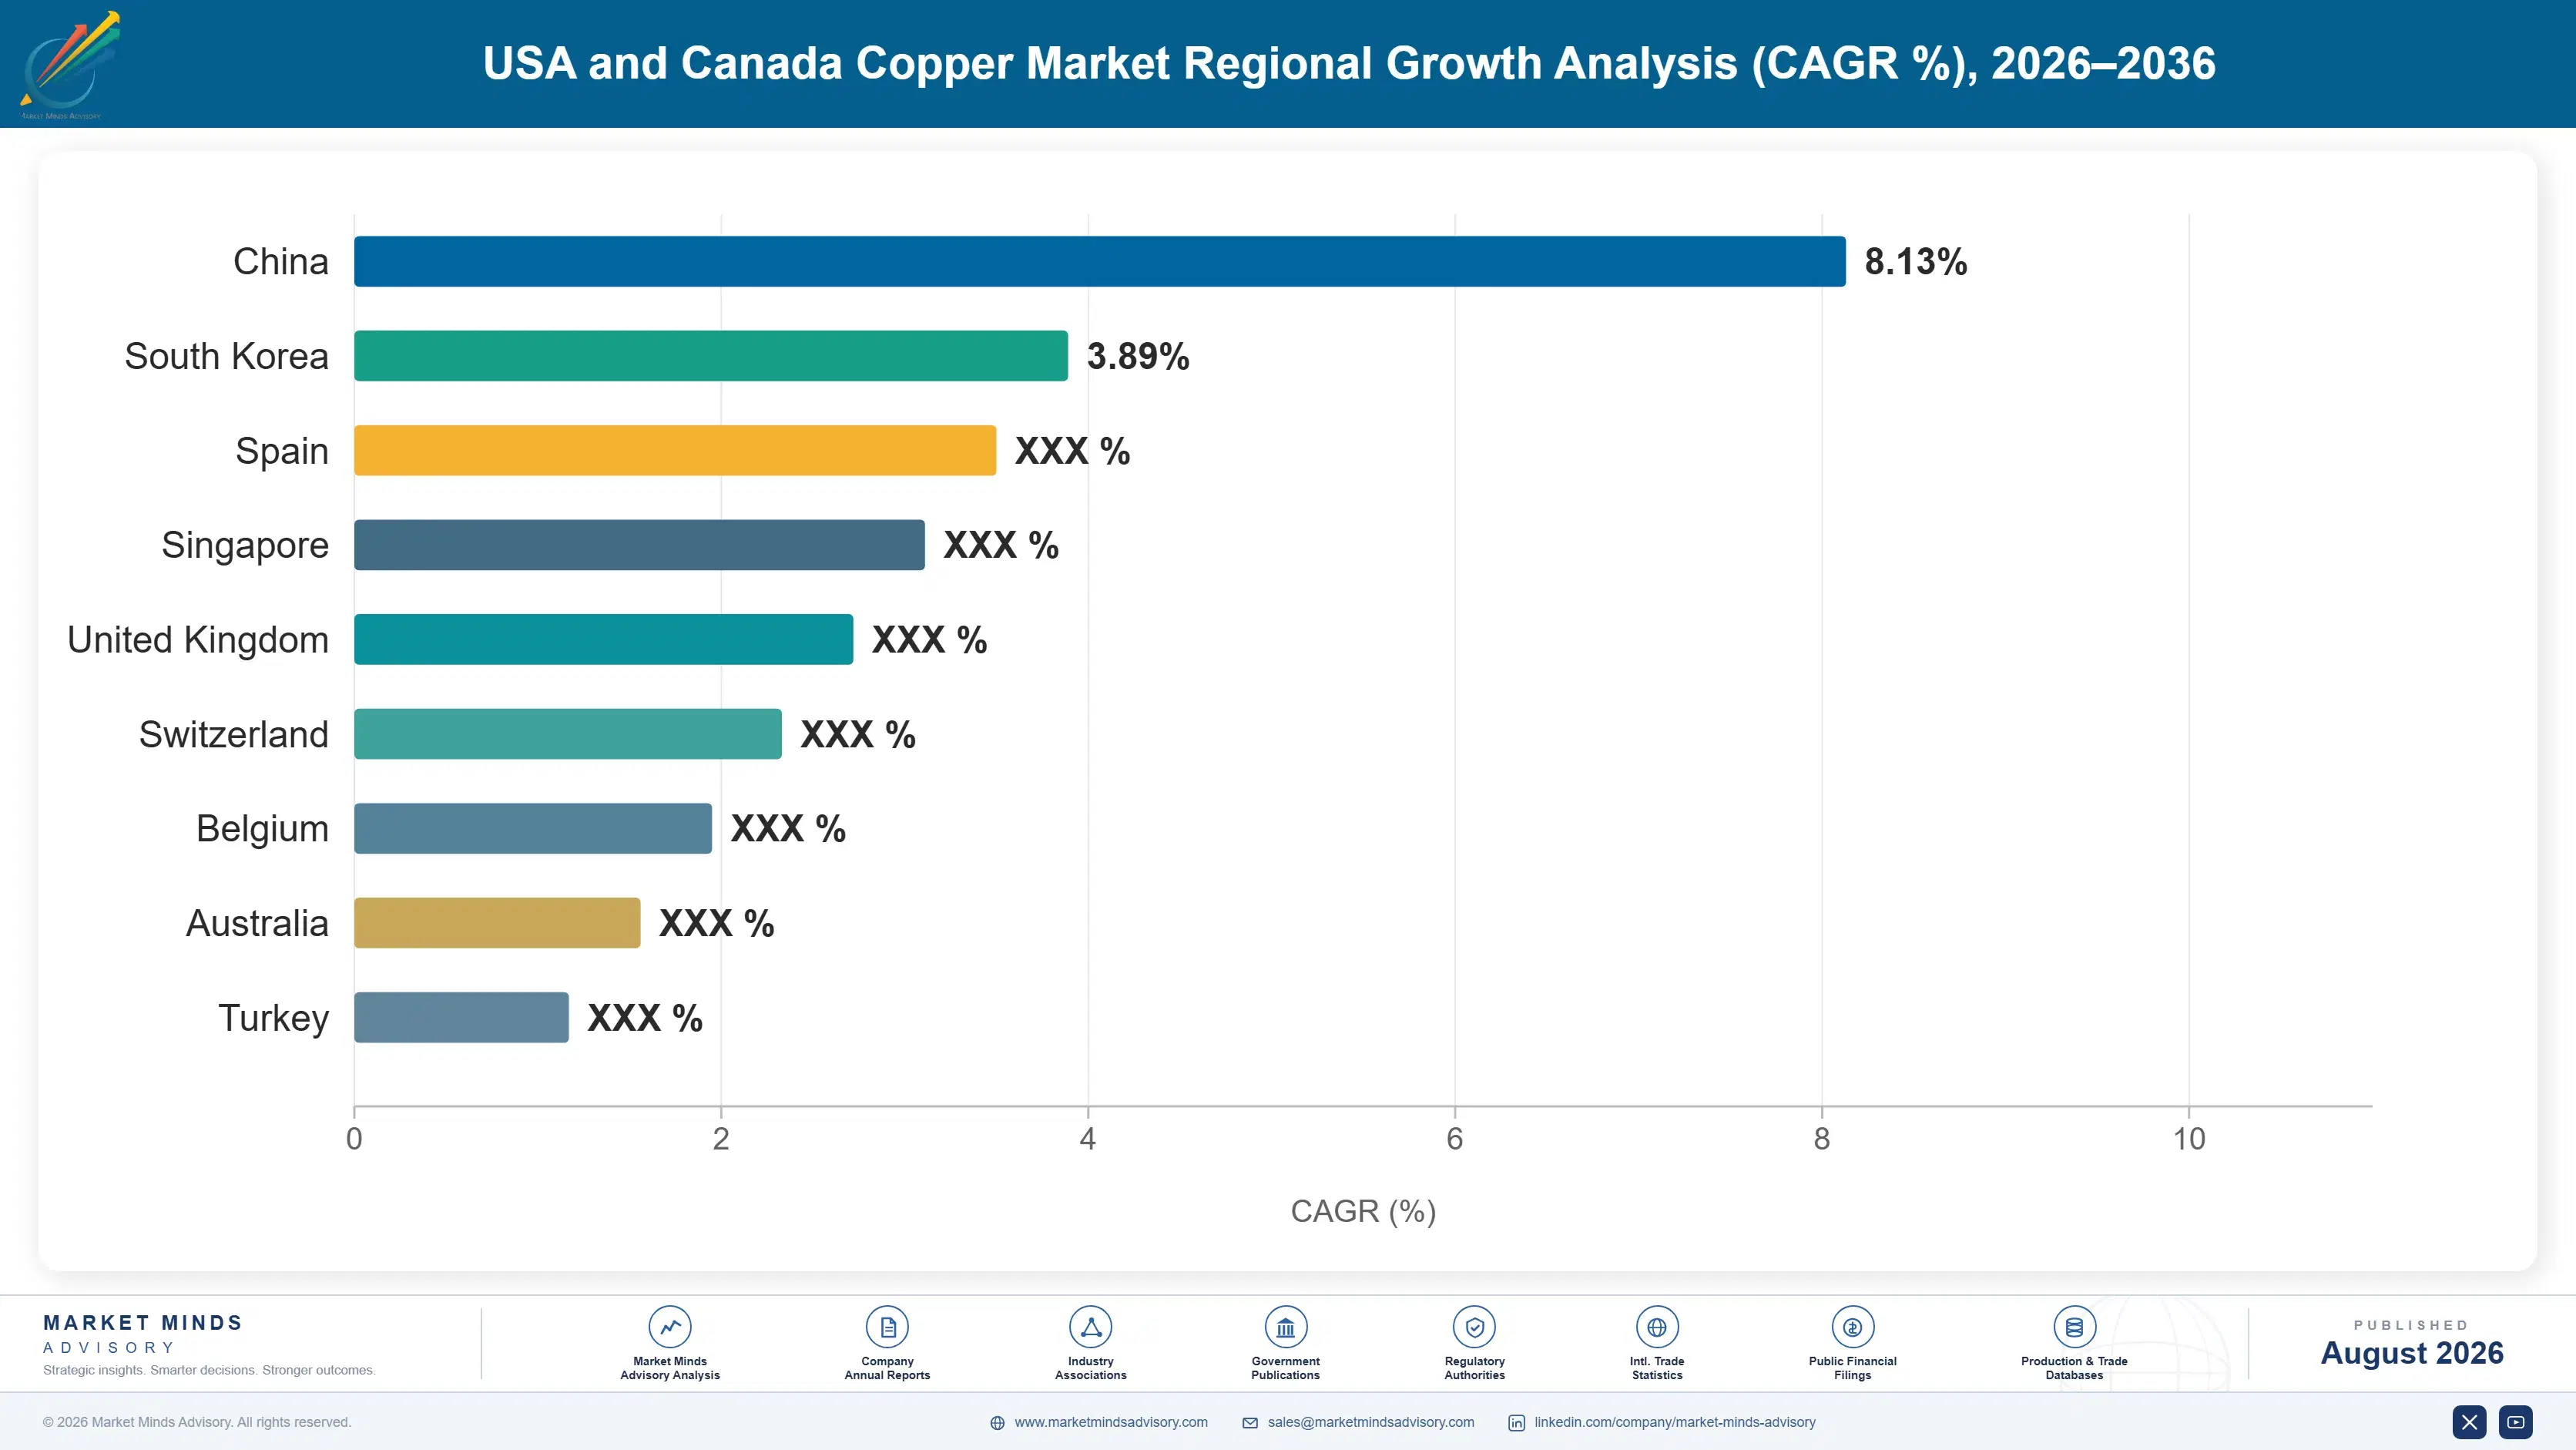
usa-and-canada-copper-market-trends-country-cagr-analysis-1787310954770

Converting Supply Reliability Into Premium Contracts

Producers who can guarantee delivery reliability to utilities, EV manufacturers, and data center developers are capturing premium long-term contracts that price-only competitors cannot win. The levers below outline where vertical integration and domestic capacity translate most directly into durable commercial advantage overall. Producers who ignore this shift risk ceding their best long-term contracts to faster-moving rivals.

Securing Multi-Year Utility Supply Contracts Early

Wire rod producers who lock in multi-year supply agreements with utilities planning large grid modernization projects secure predictable volume well ahead of competitors still selling primarily into spot markets. These long-term agreements typically carry price premiums of 5 to 9% above prevailing spot pricing, reflecting the delivery certainty utilities value highly given the reputational and regulatory cost of construction delays tied to material shortages across large capital infrastructure projects planned over several years. Utilities increasingly write reliability performance clauses directly into these long-term agreements. This premium alone can offset roughly two-thirds of a mid-sized producer's annual technical service investment.
Market Impact: Adds 5 to 9% premium on long-term c

Expanding Scrap Recycling Capacity to Buffer Import Exposure

Fabricators investing in advanced scrap sorting and refining capacity reduce their dependence on volatile import-priced primary copper, improving margin stability during periods of exchange price volatility. Producers with expanded recycling capacity report quarterly margins roughly 3 to 5 percentage points steadier than primary-import-dependent competitors, particularly during periods of sharp global exchange price movement tied to Chinese demand shifts. This margin advantage compounds meaningfully over multiple contract cycles as recycling scale increases and feedstock costs stabilize relative to imported primary cathode. Fabricators without this capacity remain fully exposed to the sharpest swings each cycle.
Market Impact: Improves margin stability by 3 to 5

Pursuing Brownfield Mine Expansion Over Greenfield Permitting

Mining companies expanding output at existing permitted brownfield sites avoid the decade-long permitting timelines facing new greenfield projects, allowing faster incremental capacity additions. Announced brownfield expansion projects across the United States represent roughly 180,000 tonnes of planned incremental annual capacity reaching production well before comparable greenfield projects still working through initial environmental review processes across multiple agencies. This approach also reduces exposure to lengthy federal environmental review processes facing entirely new mine sites, cutting years off typical project timelines. Early movers in this approach have already secured multiple long-term offtake agreements ahead of slower competitors.
Market Impact: Adds roughly 180,000 tonnes of new

Building Dedicated EV and Battery Plant Supply Relationships

Wire rod and busbar producers establishing dedicated supply relationships with EV and battery plant developers ahead of facility commissioning secure multi-year volume commitments tied to production ramp schedules. Producers with early EV sector relationships have captured supply contracts covering more than 40 announced battery and assembly facilities since 2021, positioning themselves ahead of competitors still pursuing these relationships as facilities approach completion. Early relationships also position suppliers for follow-on expansion volume as facilities scale toward full production capacity over subsequent years. Producers slower to establish these relationships face a narrowing window as remaining facilities finalize supplier lists.
Market Impact: Secures long-term supply contracts

Who Controls the Margin Pool

This market carries moderate concentration, with the top five producers holding roughly 36% combined share on a production volume basis, leaving substantial share held by mid-tier fabricators and importers competing mainly on delivery reliability and price across regional accounts. That gap has widened as domestic supply security becomes a harder qualification barrier to replicate quickly. Mid-tier fabricators increasingly pursue acquisition or partnership rather than compete alone for the large
Current competitive activity centers on three dimensions: securing long-term supply contracts with utilities and EV manufacturers ahead of competitors, expanding domestic recycling and brownfield mining capacity to reduce import dependence, and pursuing vertical integration from mining through fabrication to capture margin across the full value chain rather than a single processing stage. Several producers are also expanding brownfield mine capacity to reduce reliance on volatile concentrate imports.

Emerging pressure comes from mid-tier wire rod and tube producers investing in dedicated recycling capacity to compete on price against import-exposed larger fabricators, gradually eroding share in commodity wire categories while integrated leaders retreat toward higher-margin specialty alloy and grid-grade products where technical qualification barriers remain highest. Rankings among mid-tier producers are shifting fastest as recycling scale becomes a stronger competitive differentiator.
usa-and-canada-copper-market-trends-company-positioning-matrix-1787310955287

Competitive Moat and Risk Dimensions

FREEPORT-MCMORAN

Moat: Integrated Mine-to-Metal Scale

Freeport-McMoRan's integrated domestic mining and smelting operations give it cost and supply security advantages that import-dependent fabricators cannot match, particularly valuable during periods of concentrate price volatility. Its scale allows it to absorb capital-intensive brownfield expansion projects that smaller competitors cannot fund, positioning it to capture a growing share of domestic primary copper supply as electrification demand accelerates industry-wide.
FREEPORT-MCMORAN

Risk: Concentrated Domestic Asset Base

Freeport-McMoRan's heavy reliance on a relatively small number of large domestic mining operations leaves it more exposed to localized permitting, labor, or operational disruptions than more geographically diversified global competitors. This concentration risk means any single-site disruption can meaningfully affect near-term output, a vulnerability competitors with broader multi-country asset portfolios are comparatively better positioned to absorb without similar impact.
SOUTHERN COPPER CORPORATION

Moat: Low-Cost Latin American Assets

Southern Copper Corporation's low-cost mining assets in Peru and Mexico give it a cost advantage that supports competitive pricing into North American markets even after accounting for transport and import costs. Its established logistics relationships give it reliable supply access that newer import competitors have not yet built at comparable scale.
SOUTHERN COPPER CORPORATION

Risk: Cross-Border Trade Policy Exposure

Southern Copper Corporation's dependence on cross-border concentrate and refined metal flows leaves it more exposed than domestically integrated competitors to shifts in tariff policy or trade agreement renegotiation affecting Mexican and Peruvian imports into the United States. Any meaningful tariff escalation could compress margins or force costly supply chain reconfiguration on relatively short notice.

Players Tracked

Prominent Players

Freeport-McMoRan
Southern Copper Corporation
Wieland Group
Mueller Industries
Teck Resources

Other Key Players

Rio Tinto Kennecott
Hudbay Minerals
First Quantum Minerals
Ivanhoe Electric
Global Brass and Copper
Encore Wire
Cerro Wire
Southwire Company
Luvata
KME Group
Aurubis
Materion Corporation
Wolverine Tube
Mersen
Nexans Canada

Recent Developments

FEBRUARY 2026

Freeport-McMoRan Expands Arizona Smelter Capacity

Freeport-McMoRan commissioned an expansion of its Arizona smelting operations, adding meaningful incremental refined copper capacity aimed at reducing import dependence for domestic wire rod producers. The expansion follows several years of permitting and represents one of the largest domestic smelter capacity additions completed in the region.
Signal: Domestic smelter expansion is becoming a s
OCTOBER 2025

Mueller Industries Signs Multi-Year Supply Agreement With Utility Consortium

Mueller Industries signed a multi-year wire rod and cable supply agreement with a consortium of United States utilities planning large-scale grid modernization projects. The agreement was a long-term supply contract, not an acquisition or joint venture, and includes volume commitments tied to specific project schedules.
Signal: Long-term utility supply contracts are rep
MAY 2025

Wieland Group Acquires Scrap Recycling Facility in Ohio

Wieland Group completed the acquisition of a mid-sized Ohio-based copper scrap recycling and refining facility, expanding its secondary copper processing capacity to serve growing wire rod and alloy demand. The transaction was structured as a full acquisition rather than a joint venture or minority equity stake in the target company.
Signal: Recycling capacity acquisitions are accele

Concentrate and Energy Input Exposure

Copper concentrate and cathode purchases together represent roughly 68% of production cost of goods sold for domestic fabricators, with energy, primarily electricity for smelting and refining operations, representing a further meaningful share of remaining cost. Concentrate supply originates heavily from Chile, Peru, and Mexico, concentrating import exposure among a small number of source countries for most domestic refiners and fabricators currently operating.
Chilean copper export disruptions tied to labor strikes and water permitting delays at major mines during 2024 drove a sustained spike in global concentrate pricing, a volatility event documented in EIA commodity market commentary. Several North American smelters reported reduced treatment charge revenue during the disruption as concentrate became scarcer and more expensive to secure, compressing smelting margins for several consecutive quarters across multiple domestic refining operations before Chilean output stabilized later that year.

This cost exposure disadvantages smaller fabricators lacking long-term concentrate supply agreements or scrap recycling capacity, since they must purchase primary cathode at spot pricing during periods of tight global supply. Larger integrated producers with domestic mining assets and diversified recycling operations weather these disruptions more smoothly, widening the competitive gap between vertically integrated players and import-dependent fabricators.
usa-and-canada-copper-market-trends-cost-volatility-analysis-1787310955482

Diversifying Concentrate Sourcing Beyond Chile and Peru

Domestic smelters are increasingly qualifying concentrate suppliers in additional countries, including Mexico and select African producers, to reduce dependence on any single South American source. This diversification has helped several smelters avoid the sharpest treatment charge compression experienced by single-source-dependent competitors during recent Chilean supply disruptions and export slowdowns. This also improves negotiating leverage during tight concentrate supply periods.

Expanding Domestic Scrap Recycling to Buffer Import Reliance

Fabricators are investing in advanced scrap collection and refining infrastructure to reduce reliance on imported primary cathode, providing a buffer supply source during periods of concentrate scarcity. This approach has proven particularly valuable for wire rod producers able to blend recycled and primary cathode flexibly depending on relative pricing and availability across different supply sources at any given time.

Locking Multi-Year Concentrate Supply Agreements

Larger smelters are negotiating multi-year concentrate agreements with fixed treatment charge terms to shield refining margins from spot market volatility. This approach has helped several domestic refiners maintain steadier quarterly margins compared to spot-market-dependent competitors during recent periods of Chilean and Peruvian export disruption and elevated global concentrate pricing. Fixed terms also simplify budgeting for downstream wire rod buyers.

Portfolio Architecture for Margin Defence

Portfolio economics split across three tiers. Volume commodity-adjacent cathode and basic wire rod carry thin margins driven by exchange-linked pricing, while premium certified grid-grade and EV-qualified products command meaningfully higher margins reflecting technical qualification requirements and delivery reliability premiums buyers increasingly demand from suppliers across large capital infrastructure projects. Buyers in each tier evaluate suppliers on different criteria, complicating cross
The tension between volume and premium positioning defines producer strategy. Commodity cathode and basic wire rod volume remains large but price-competitive and exposed to exchange benchmark swings, while premium grid-grade and recycled-content products represent a smaller but faster-growing and higher-margin pool that rewards producers with dedicated technical qualification and recycling capability across their operations. Producers unable to run both playbooks well risk losing ground on at least one front.

High-value margin pools concentrate specifically in grid-grade wire rod, EV-qualified busbar and harness copper, and high-purity recycled cathode, where technical differentiation and delivery reliability requirements remain highest relative to commodity cathode and general-purpose wire categories sold mainly on price alone. Suppliers absent from these pools risk being confined to thinner-margin commodity competition long-term.

Volume / Commodity-Adjacent Tier

Standard cathode and general-purpose wire rod sold largely at exchange-linked pricing to broad industrial and construction buyers with thin margins. These buyers typically negotiate primarily on delivered price and minimum order volume commitments each quarter.
Gross Margin: 12-18%

Premium / Certified Tier

Grid-grade wire rod and EV-qualified busbar products requiring formal technical qualification, commanding steadier premium pricing from utility and automotive buyers. Qualification testing cycles can take a year or more before a new supplier is fully approved.
Gross Margin: 24-30%

Sustainability / Regulatory / Next-Generation Tier

High-purity recycled cathode and low-carbon certified copper products capturing sustainability-linked procurement premiums from utility and automotive customers. Adoption remains early-stage but is expanding steadily as utilities formalize sustainability procurement scoring criteria.
Gross Margin: 28-35%
usa-and-canada-copper-market-trends-portfolio-architecture-1787310955983

High-value Sub-segments and Strategic Watch-out

Grid-Grade Wire Rod for Utilities

Highest-value, fastest-growing pool tied directly to grid modernization spending, commanding premium pricing on delivery reliability and long-term utility supply contract commitments. Suppliers here typically sign multi-year agreements tied directly to specific utility capital project schedules. Delivery penalties in these contracts make reliability the biggest differentiator in this segment.
Gross Margin: 26-32%

EV and Battery Plant Busbar Copper

High-value pool growing steadily alongside EV and battery plant construction, anchored in multi-year supply relationships tied to facility production ramp schedules. Facility ramp-up timelines determine most of the near-term volume variability within this segment. Suppliers embedded early in a facility's supply chain rarely get displaced once production stabilizes.
Gross Margin: 25-31%

General Construction Wire and Tube

Largest volume core segment, price-competitive and exchange-exposed, generating steady but comparatively low-margin revenue across residential and commercial construction demand. Interest rate sensitivity in residential construction makes this segment the most cyclical of the four. Producers here compete mainly on logistics efficiency and regional proximity rather than technical differentiation.
Gross Margin: 13-18%

Import-Dependent Spot Cathode Purchasing

Strategic watch-out segment facing rising exposure to tariff policy shifts and exchange price volatility; fabricators reliant on spot imports face margin compression risk. Producers reliant on this channel should actively diversify toward integrated or recycled supply sources. Tariff policy shifts could compress this segment's already thin margins with little notice.
Gross Margin: 10-15%

Contract Cycles and Capital Timelines

Copper demand tied to utility, EV, and data center capital projects behaves like a multi-year annuity once a supplier is qualified and contracted, since these projects run on commissioning schedules spanning several years and switching suppliers mid-project risks costly delays that most large buyers actively avoid wherever possible. Requalifying an alternative supplier mid-construction can add months to an already tight project timeline.
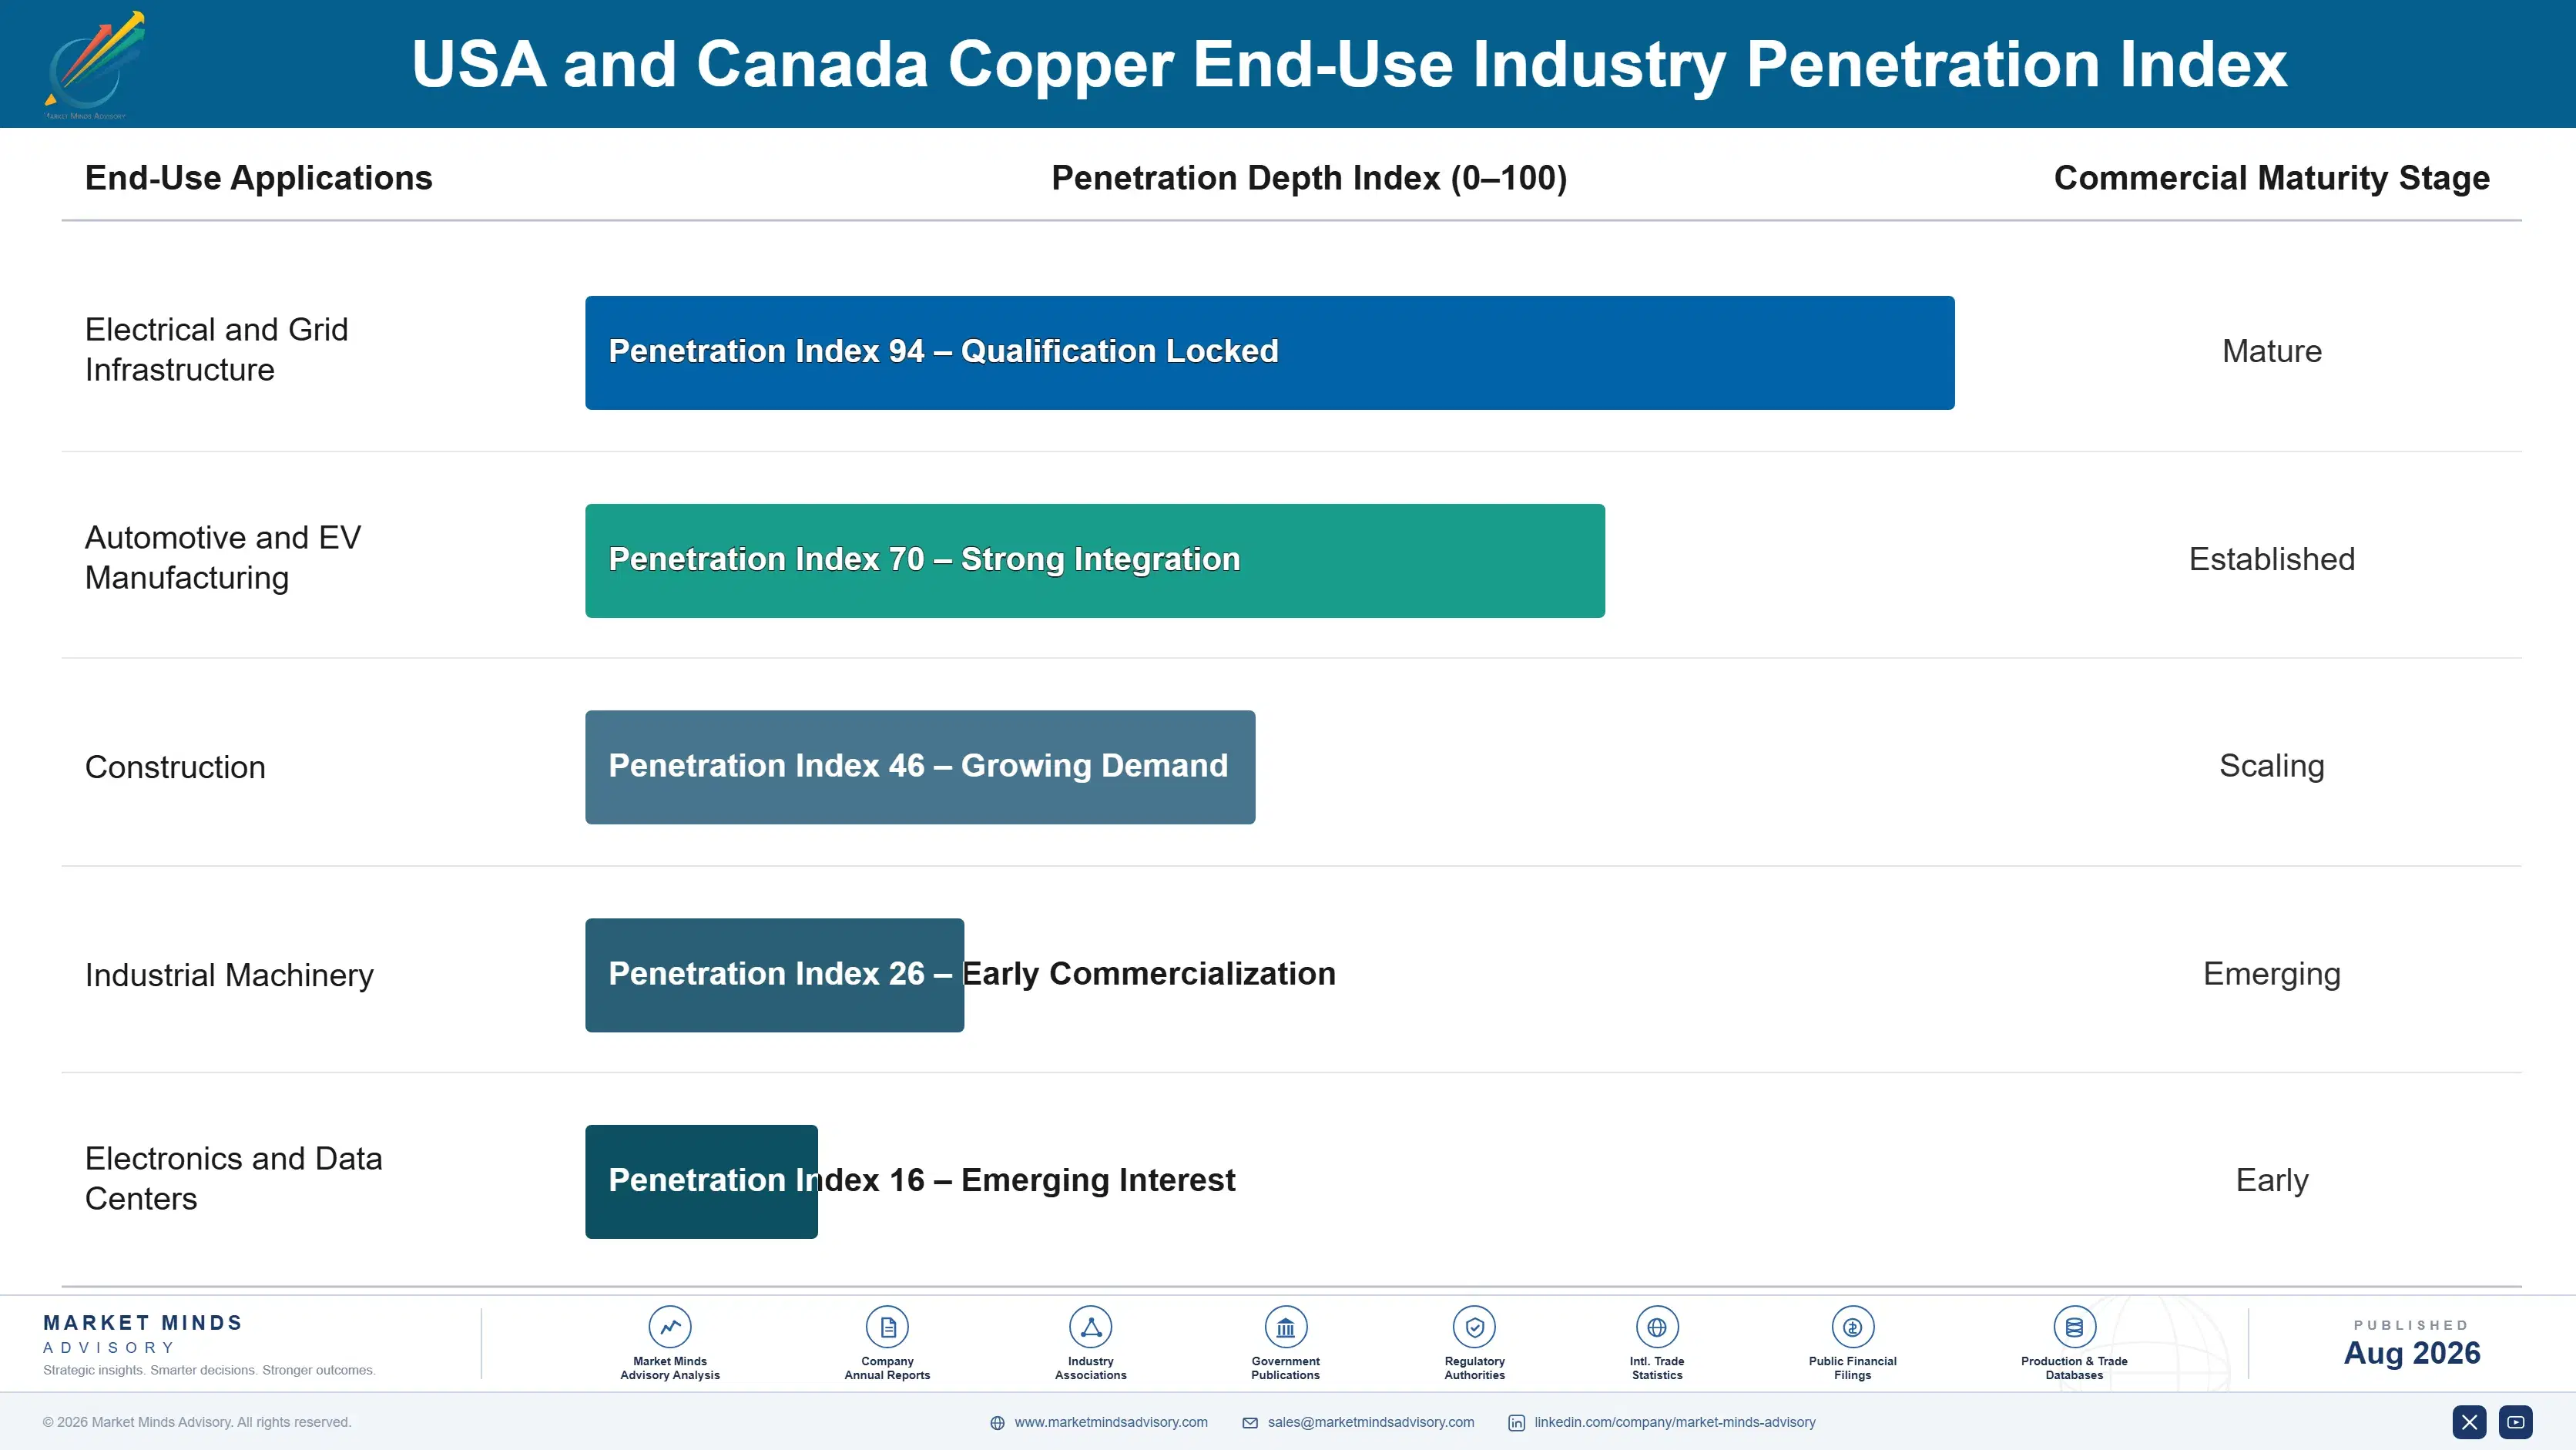
Adoption stickiness varies meaningfully by end-use vertical. Utility grid projects show the deepest stickiness given strict technical qualification and multi-year contract structures, while general construction buyers show moderate stickiness tied to project duration, and EV and battery plant buyers show intermediate stickiness that strengthens considerably once a supplier proves reliable delivery during initial facility ramp-up phases. Data center developers increasingly mirror utility-level stickiness given similarly demanding uptime requirements.

A generational shift in buyer profiles is underway as utility and industrial procurement teams increasingly include dedicated supply chain risk specialists focused on delivery reliability and geopolitical sourcing exposure, changing how suppliers must present supply chain resilience credentials during contract negotiations across most large accounts. Younger procurement staff also weigh recycled-content credentials more heavily than their predecessors did.
usa-and-canada-copper-market-trends-end-use-penetration-index-1787310956469

Where Delivery Reliability Beats Price

These are among the four positions where our research anticipates prominent divergence between winners and laggards over the coming forecast period. Each is grounded in the demand model, the regulatory perimeter, and the announced capacity pipeline.
01 / VERTICAL INTEGRATION STRATEGY

Prioritize integrated mine-to-fabrication capability over pure trading positions

Producers with integrated domestic mining, smelting, and fabrication capability are best positioned to capture premium long-term contracts from utilities and EV manufacturers who value delivery certainty over marginal price differences. Import-dependent fabricators without upstream integration remain exposed to exchange price volatility and concentrate supply disruptions that integrated competitors can absorb more easily, and companies that delay this transition risk losing the largest utility and EV contracts to faster-moving, better-integrated rivals. Companies should evaluate brownfield mining and recycling acquisitions as a faster path to integration than greenfield projects.
02 / RECYCLING CAPACITY INVESTMENT

Expand scrap recycling infrastructure to buffer import price exposure

Fabricators investing in advanced scrap sorting and refining capacity reduce dependence on volatile import-priced primary cathode, improving margin stability during periods of concentrate scarcity and exchange price swings. This capability matters most for wire rod producers serving utility and EV customers who increasingly value both delivery reliability and recycled-content credentials, and producers without comparable recycling investment risk losing sustainability-conscious customers to better-positioned rivals over time. Producers without comparable recycling capacity should expect margin volatility to widen relative to diversified competitors.
03 / UTILITY CONTRACT POSITIONING

Secure multi-year grid modernization supply agreements ahead of competitors

Wire rod producers who lock in multi-year supply agreements with utilities planning grid modernization projects secure predictable volume and premium pricing well ahead of competitors still selling primarily into spot markets. This positioning matters most given the scale of announced utility capital spending through the early 2030s, which will absorb a growing share of domestic wire rod output, and producers slower to pursue these relationships face a shrinking window as remaining contracts get allocated to qualified suppliers. Producers without early utility relationships risk losing contract opportunities to already-qualified competitors.
04 / GEOGRAPHIC SOURCING DIVERSIFICATION

Diversify concentrate sourcing beyond concentrated South American supply

Smelters overly dependent on Chilean and Peruvian concentrate face meaningful disruption risk during periods of labor unrest or permitting delays in those countries, as recent history has demonstrated clearly across several separate incidents. Diversifying sourcing across additional countries and expanding scrap recycling capacity reduces this concentration risk meaningfully, and producers who delay this diversification risk repeated margin compression each time South American supply disruptions recur, a pattern likely to continue through the decade. Diversification investment made now will pay off across multiple future disruption cycles ahead.

Engagement Snapshot From the Field

A live engagement with an industry participant carrying material or product regulatory and market exposure ahead of a defining policy shift, showing how our research translates into a defensible multi-year portfolio strategy.
MARKET MINDS ADVISORY · CLIENT ENGAGEMENT SUMMARY
USA and Canada Copper Producer Strategic Portfolio Review and Transition Roadmap 2026·Investment Scenario on USA and Canada Copper Exposure Evaluation 2025-26
CLIENT PROFILE
The client is a regional investor-owned utility holding company operating transmission and distribution infrastructure across several US Midwest states, with a multi-year grid modernization capital plan valued at approximately $4.2 billion (client-reported, unverified by MMA). The utility sought an independent supplier qualification assessment ahead of finalizing long-term wire and cable procurement contracts. The company operates within traditional cost-of-service rate regulation across its territory.
STRATEGIC CHALLENGE
The utility needed to select wire rod and cable suppliers capable of guaranteeing delivery reliability across a multi-year construction schedule while managing budget exposure to copper exchange price volatility. Existing supplier relationships lacked documented capacity commitments sufficient to cover the full scale of planned grid modernization spending across the utility's service territory.
MMA APPROACH
MMA conducted a comparative supplier capacity and reliability assessment covering six candidate wire rod and cable suppliers, evaluating domestic production capacity, import exposure, and pricing structure across comparable contract volumes. The engagement included interviews with utility procurement staff and review of supplier delivery performance history across comparable prior utility infrastructure projects.
KEY FINDINGS
  1. Only three of six candidate suppliers had sufficient domestic wire rod capacity to cover the full multi-year procurement volume without import reliance.
  2. Suppliers with integrated recycling capacity offered pricing roughly 4% below import-dependent competitors once volatility risk was factored in. for the covered service territory.
  3. Two candidate suppliers had prior delivery delays on comparable utility projects, raising concerns about capacity commitments under peak demand conditions. under peak demand scenarios.
  4. Long-term supply agreements with price collars reduced projected budget exposure to exchange volatility by an estimated 22% (client-reported, unverified by MMA). over the full contract term.
CLIENT PROFILE
The client is a regional investor-owned utility holding company operating transmission and distribution infrastructure across several US Midwest states, with a multi-year grid modernization capital plan valued at approximately $4.2 billion (client-reported, unverified by MMA). The utility sought an independent supplier qualification assessment ahead of finalizing long-term wire and cable procurement contracts. The company operates within traditional cost-of-service rate regulation across its territory.
STRATEGIC CHALLENGE
The utility needed to select wire rod and cable suppliers capable of guaranteeing delivery reliability across a multi-year construction schedule while managing budget exposure to copper exchange price volatility. Existing supplier relationships lacked documented capacity commitments sufficient to cover the full scale of planned grid modernization spending across the utility's service territory.
MMA APPROACH
MMA conducted a comparative supplier capacity and reliability assessment covering six candidate wire rod and cable suppliers, evaluating domestic production capacity, import exposure, and pricing structure across comparable contract volumes. The engagement included interviews with utility procurement staff and review of supplier delivery performance history across comparable prior utility infrastructure projects.
KEY FINDINGS
  1. Only three of six candidate suppliers had sufficient domestic wire rod capacity to cover the full multi-year procurement volume without import reliance.
  2. Suppliers with integrated recycling capacity offered pricing roughly 4% below import-dependent competitors once volatility risk was factored in. for the covered service territory.
  3. Two candidate suppliers had prior delivery delays on comparable utility projects, raising concerns about capacity commitments under peak demand conditions. under peak demand scenarios.
  4. Long-term supply agreements with price collars reduced projected budget exposure to exchange volatility by an estimated 22% (client-reported, unverified by MMA). over the full contract term.
RECOMMENDED STRATEGY
Phase 1: Phase 1 (Months 1 to 3): Finalize supplier selection based on domestic capacity, delivery track record, and price collar terms offered. Phase 2: Phase 2 (Months 4 to 10): Execute long-term supply agreements covering the first two years of the grid modernization construction schedule. Phase 3: Phase 3 (Months 11 to 24): Monitor supplier delivery performance and renegotiate volume commitments as later project phases are finalized.
OUTCOME
The utility selected two suppliers offering combined domestic and recycled-content capacity sufficient to cover the full multi-year procurement volume without import reliance. Projected budget exposure to copper price volatility dropped by roughly 20% (client-reported, unverified by MMA) once price collar terms were finalized, while delivery risk assessments improved meaningfully across the covered construction schedule.

Frequently Asked Questions

Foundational context covering the market sizes, CAGR, scope, country, region and competition that inform every finding below. This section is provided to cover basics and most often pre-purchase conversations, answered from the MMA Primary Research Dataset.

What is the current size of the USA and Canada Copper Market?

The market is valued at approximately $42.5 billion in 2025. Growth is driven by grid modernization, electric vehicle manufacturing, and data center construction across both countries.

How large will the USA and Canada Copper Market be by 2036?

The market is projected to reach approximately $66.12 billion by 2036. Electrification-linked demand from grid, EV, and data center investment continues outpacing domestic mine and smelter capacity growth.

What is the CAGR for the USA and Canada Copper Market 2026 to 2036?

The market is forecast to grow at a compound annual growth rate of 4.1% between 2026 and 2036. Copper wire rod is growing considerably faster than the overall market average.

Which segment is growing fastest?

Copper wire rod is growing fastest at approximately 5.6% CAGR, driven by grid modernization, EV manufacturing, and data center power distribution demand across the region.

Who are the major companies in the USA and Canada Copper Market?

Leading producers include Freeport-McMoRan, Southern Copper Corporation, Wieland Group, Mueller Industries, and Teck Resources, together holding roughly 36% combined market share with mid-tier producers making up the remainder.

Which country is growing fastest?

The United States is the faster-growing of the two countries at approximately 4.4% CAGR, driven by grid modernization and EV plant construction. Canada follows at a more moderate pace.

Report Segmentation Architecture

The full report scope spans multiple orthogonal segmentation dimensions, with cross-tabulated demand data provided for each dimension pair. Coverage extends further to regional breakdowns, trend trajectories, and the competitive detail needed to support segment-level decision-making.

By Product Form

  • Copper Cathode and Refined Copper
  • Copper Wire Rod
  • Copper Tube and Pipe
  • Copper Sheet and Strip
  • Copper Alloy Products
  • Secondary and Recycled Copper

By End-Use Industry

  • Electrical and Grid Infrastructure
  • Automotive and EV Manufacturing
  • Construction
  • Industrial Machinery
  • Electronics and Data Centers

By Commercial Dimension

  • Direct Utility Contracts
  • Industrial Distribution
  • Long-Term Supply Agreements
  • Spot Market Purchasing

By Region

  • North America
  • Western Europe
  • East Asia
  • South Asia and Pacific
  • Latin America
  • Middle East and Africa
  • Eastern Europe

Scope, Methodology, and Coverage

Every figure in this report is reproducible from documented input assumptions. The scope below maps the historical period, the forecast horizon, the segmentation dimensions, and the countries covered, alongside the underlying primary and qualitative methodology.
Historical Period
2020 to 2025
Forecast Period
2026 to 2036
Base Year
2025 (USD billions; MMA Primary Research Dataset, August 2026)
Market Definition
This report covers copper cathode, copper wire rod, copper tube and pipe, copper sheet and strip, copper alloy products, and secondary refined copper produced for consumption within the United States and Canada. It excludes copper mining exploration services and copper trading or hedging activity conducted independently of physical product sales.
Quantitative Units
USD billions (current prices); metric tons where volume data is available
Segmentation Dimensions
By Product Form; By End-Use Industry; By Commercial Dimension; By Region
Regions Covered
North America, Western Europe, East Asia, South Asia and Pacific, Latin America, Middle East and Africa, Eastern Europe
Countries Covered
USA, Canada, and reference data for Chile, Peru, Mexico, China, Germany, and additional markets relevant to global copper trade linkage
Key Companies Profiled
Freeport-McMoRan, Southern Copper Corporation, Wieland Group, Mueller Industries, Teck Resources, Rio Tinto Kennecott, Hudbay Minerals, First Quantum Minerals, Ivanhoe Electric, Global Brass and Copper, Encore Wire, Cerro Wire, Southwire Company, Luvata, KME Group, Aurubis, Materion Corporation, Wolverine Tube, Mersen, Nexans Canada
Quantitative Methodology
Primary survey, n=3,800 respondents, Q4 2025, six countries; demand-side model with trade association cross-validation
Qualitative Methodology
47 expert interviews, Q4 2025; applied to validate demand model assumptions, identify emerging dynamics, and assess competitive positioning
Report Format
PDF and XLSX data workbook (Word format preview document)
Publisher
Market Minds Advisory
Report Code
MMA-2026-CHM-102
Published
August 2026
Contact
sales@marketmindsadvisory.com | www.marketmindsadvisory.com

Purchase the full USA and Canada Copper Market Report (2026 to 2036).

The full report delivers detailed segment-level sizing across all six product form categories, a full breakdown of United States versus Canada demand, and in-depth competitive profiles covering twenty companies active across mining, smelting, and fabrication. It includes granular analysis of import dependence by source country, concentrate price sensitivity modeling, and supplier qualification pathway guidance for utilities and manufacturers navigating grid modernization and EV plant procurement. Buyers also receive access to underlying data tables and a dedicated analyst briefing call. The analysis also benchmarks domestic smelter and recycling capacity expansion plans against projected electrification demand growth.
State and province-level demand sizing detail
Import dependence tracker by source country
Concentrate price sensitivity modeling and forecasting tools
Twenty-company competitive benchmarking profiles provided in full
Supplier qualification pathway guidance and checklists
Dedicated analyst briefing call included free

Built For The People Who Decide

From boardroom strategy to bench-side execution, this report is read cover-to-cover by leaders shaping the next decade of their industry, turning demand scenarios, market dynamics and valuation benchmarks into decisions.
CXOs/ Presidents/ VPs/ Managers
M&A and Corporate Development
Strategy Teams and R&D Heads
Procurement and Product Directors
Regulatory and Compliance Leaders
Investor Relations and Equity Analysts