Market Minds Advisory
US Plastic to Fuel Market

US Plastic to Fuel Market: Announced Capacity Is Not Operating Capacity

Around one fifth of announced capacity actually runs at commercial rates, and every failure traces back to feedstock rather than chemistry. The same barrel is worth very different money depending on certification.

Lead Analyst

David Horsley

Published

August 2026

Make Smarter Decisions with Customized Research Insights

Request a free sample report and evaluate market opportunities, growth trends, and competitive dynamics relevant to your business needs.

2025 MARKET VALUE$0.4BMarket Size 2025
2036 FORECAST VALUE$1.9BBase Case , 2026 to 2036
CAGR 2026 TO 203614.8 %Bull 16.0% / Bear 13.6%
INCREMENTAL OPPORTUNITY$1.4BNet 10- year value creation
EXPANSION MULTIPLE4.00x2036 value over 2026 base
Strategic Levers
M&A Pipeline
Regional Outlook
Country Rankings
Competitive Intelligence
Segmental Deep-dive
Call-Us : 91 93563 13602

Executive Snapshot and Market Trajectory

Roughly 19% of announced United States capacity is running at commercial rates. The gap is not financing or permitting, it is feedstock: pyrolysis needs clean sorted polyolefin, and collected mixed plastic yields about 62% usable material after sorting, with chlorine above 50 parts per million damaging catalysts downstream.
Growth runs at 14.8% and depends almost entirely on where the output goes rather than on how it is made. Pyrolysis oil sold as certified circular cracker feedstock grows fastest at 22.2%, exactly 1.50 times the market rate, because that barrel realises around 3.4 times what the identical barrel fetches as transport fuel. Gasification to syngas follows at 17.4%. Fuel routes carry commodity exposure that no operating improvement escapes. Waxes hold a smaller position.
Concentration reaches 43% across the top five measured on annual operating processing capacity in the United States, spread across project developers, chemical companies buying output, and technology licensors. Twenty-four states have reclassified the process as manufacturing rather than solid waste disposal, which changes permitting more than any technical development has. Competition turns on feedstock access rather than on reactor design. Rankings move when plants stop running.
Market Definition
This market covers conversion of waste plastic into fuels, chemical feedstocks, and hydrocarbon products at facilities operating in the United States, measured at realised revenue from products sold, spanning pyrolysis oil sold as circular cracker feedstock, pyrolysis oil upgraded to transport fuel, gasification to syngas and chemicals, fuel gas and onsite energy recovery, waxes and specialty hydrocarbons, and char and solid residue products. Mechanical recycling, waste collection and sorting infrastructure, incineration with energy recovery, and facilities outside the United States fall outside scope.
Base Year Value
$0.4B in 2025 (MMA Primary Research Dataset, August 2026)
Forecast Period
2026 to 2036, eleven discrete annual values
CAGR
14.8% base case. Bull 16.0%. Bear 13.6%.
Fastest Growth Segment
Pyrolysis Oil Sold as Circular Cracker Feedstock: 22.2% CAGR
Fastest Growth Country
United States: 14.8% CAGR
Fastest Growth Region
South Asia and Pacific: 16.6% CAGR
Largest Region
North America: 44% of 2025 global value
Market Leaders
Brightmark, Alterra Energy, Nexus Circular, Encina, Agilyx. Source: MMA Analysis based on company annual reports.
Primary Survey
n=3,800 procurement and R&D decision-makers, Q4 2025, six countries
Methodology
Demand-side build-up, cross-validated against public data, 47 expert interviews

US Plastic to Fuel Market Forecast Scenarios

us-plastic-to-fuel-market-size-forecast-scenario-1787300416614
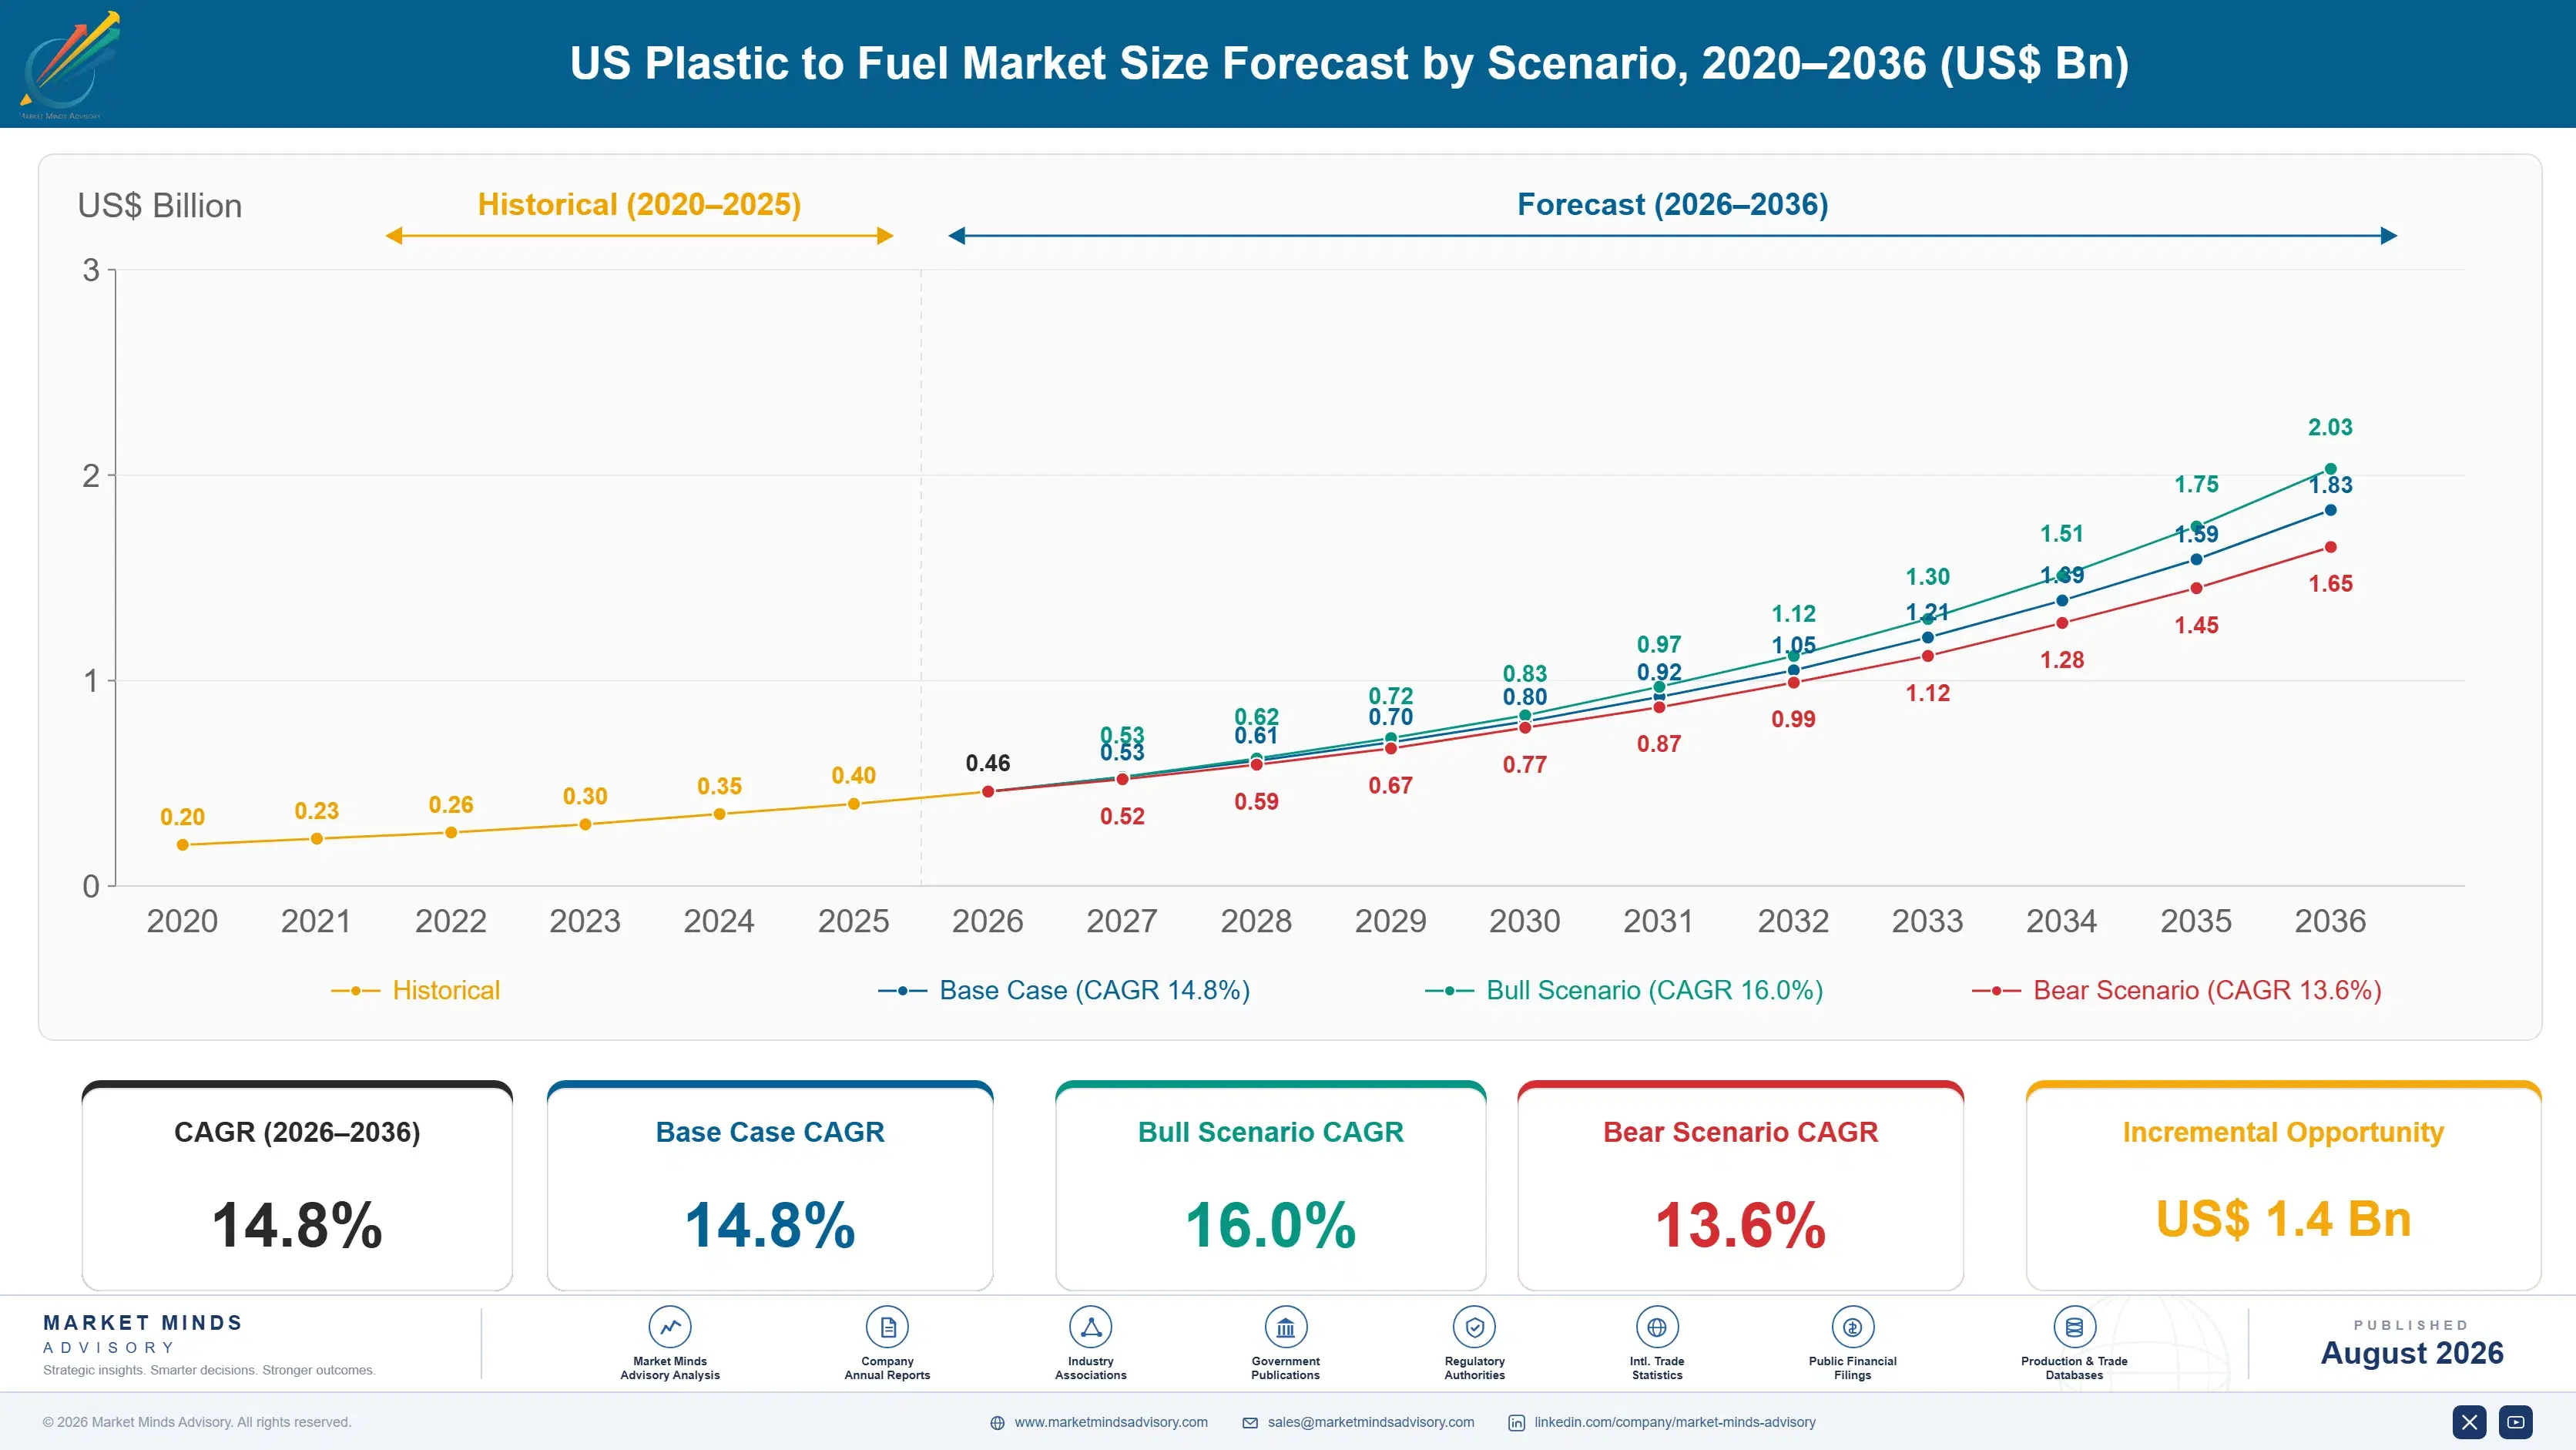
The 2020 to 2025 period ran at 13.2% against announcements suggesting something far larger. Projects were announced, financed, and in several cases built, then ran well below nameplate or stopped entirely once real mixed feedstock arrived. Twenty-four states reclassified the process as manufacturing through the period, which removed a genuine permitting obstacle. Brand owner recycled-content commitments created the demand that makes certified output valuable.
Three mechanisms carry the 14.8% base case. Certified circular feedstock demand is the largest, since brand owners with recycled-content commitments pay a premium no fuel market offers. Feedstock preprocessing investment is the second, because plants that solved sorting and chlorine control are the ones that run. And state regulatory reclassification is the third, which changes permitting timelines from years to something manageable. None of the three depends on any reactor breakthrough arriving.
The 16.0% bull case rests on dedicated preprocessing infrastructure being built ahead of conversion capacity, which is the sequence almost nobody followed and the one the operating plants demonstrate works. The 13.6% bear case is certification frameworks tightening on mass balance accounting, since the premium that makes this business viable rests entirely on a chain of custody claim brands are willing to buy.

Why Most of It Never Ran

The number this industry avoids is that roughly 19% of announced United States capacity runs at commercial rates. That gap has one explanation, and it is not financing or permitting. Pyrolysis works reliably on clean, dry, sorted polyolefin and behaves very differently on what actually arrives. Collected mixed plastic yields about 62% usable material after sorting and cleaning, and the remainder carries the contaminants that break the process.
OPERATING SHARE OF ANNOUNCED19%Of announced capacity actually running at commercial rates
CHLORINE TOLERANCE LIMIT50 ppmAbove which downstream catalysts and equipment suffer damage
FEEDSTOCK SORTING YIELD62%Of collected mixed plastic usable after sorting and cleaning
CERTIFIED FEEDSTOCK PREMIUM3.4 timesPaid against the same barrel sold as transport fuel
STATE RECLASSIFICATION COUNT24 statesWhere the process is regulated as manufacturing not disposal
TYPICAL PLANT CAPITAL COST180 million dollarsFor a commercial scale conversion facility before preprocessing investment
Chlorine is the specific killer. Polyvinyl chloride in the feed releases hydrogen chloride during pyrolysis, which corrodes equipment and poisons downstream hydrotreating catalysts, with tolerance limits around 50 parts per million against contamination levels an unsorted stream routinely exceeds by an order of magnitude. Polyester adds acids that foul, moisture disrupts thermal balance, and food residue coats surfaces. Every plant that failed, failed here rather than in the reactor.
The commercial question is entirely separate from the technical one. A barrel of pyrolysis oil sold into transport fuel competes against diesel on price and earns commodity margins. The identical barrel sold as certified circular feedstock into a steam cracker, backed by mass balance chain of custody, realises around 3.4 times as much, because a brand owner needs recycled content available nowhere else.
"Investors kept asking me about reactor technology. Nobody was failing in the reactor. They were failing at the tipping floor, three weeks earlier, when somebody accepted a load with PVC pipe in it because the sorting line was down."
Director, Circular Materials and Waste Conversion Practice · MMA Energy and Wast

Market Trends

The Certified Barrel Is A Different Business

Pyrolysis oil sold as transport fuel competes against diesel and gets diesel economics, which do not support the capital cost of a conversion plant at any plausible scale. The same oil sold into a steam cracker under mass balance certification, feeding polymer a brand owner counts toward a recycled-content commitment, realises around 3.4 times as much. Nothing about the molecule changes. Growth runs at 22.2% against 14.8% for the market, and the certification framework rather than the chemistry is what supports it. Certification frameworks, not reactor performance, therefore decide which projects are worth financing.
Market Impact: Premium reaches 3.4 times
States Reclassified The Process As Manufacturing

Twenty-four states have amended their statutes to regulate pyrolysis and gasification of plastic as manufacturing rather than solid waste disposal, which changes permitting from a waste facility process taking years into an industrial siting process taking months. That removed a genuine obstacle for developers and drew criticism from groups arguing the reclassification reduces environmental oversight of a combustion-adjacent process. Both positions are being argued in state legislatures rather than settled, and the split determines where new capacity gets built. Developers now screen state statute before screening feedstock availability in any given siting decision.
Market Impact: Sorting yields only 62%

Market Opportunities and Growth Drivers

Brands Need Recycled Content Mechanical Recycling Cannot Supply

Food-contact packaging, medical applications, and films all require polymer quality that mechanical recycling of mixed post-consumer plastic cannot reliably deliver, since mechanical processing preserves contamination and degrades chain length with each cycle. Chemical conversion returns material to monomer or naphtha and rebuilds virgin-equivalent polymer. Brand owners with dated recycled-content commitments have nowhere else to obtain that material, which is why they pay a premium of roughly 3.4 times over fuel value without much argument. Commitment dates are public, which removes most of the negotiating room buyers would normally hold. Feedstock-driven trips dominate lost availability at almost every operating facility.
Market Impact: Only 19% of announced runs

Preprocessing Investment Separates Plants That Run

Facilities that built or contracted dedicated sorting, washing, drying, and chlorine screening ahead of conversion are the ones operating at commercial rates, and those that assumed municipal recycling streams would arrive clean enough are largely the ones that did not. Sorting yield near 62% means a plant sized on collected tonnage rather than on usable tonnage is overbuilt from the start. This is a sequencing lesson the operating plants demonstrate and announcements still routinely ignore. Financing conversations have shifted accordingly, with lenders now asking about sorting capacity first. Fuel routes have never recovered conversion capital anywhere in this sector.
Market Impact: Chlorine limit is 50 ppm

Market Restraints and Challenges

Nineteen Percent Of Announced Capacity Actually Runs

Announcements in this sector have exceeded operating reality by a wide margin for a decade, with roughly 19% of announced United States capacity running at commercial rates. The root cause is that projects were financed on nameplate throughput and clean feedstock assumptions that mixed post-consumer plastic does not satisfy. Commercial impact is investor scepticism that raises the cost of capital for every subsequent project including the good ones. Demonstrated sustained operation rather than announcements is the only available remedy. Published availability data from facilities that run is beginning to reopen that financing conversation.
Market Impact: Growing at 22.2% annually

Fifty Parts Per Million Of Chlorine Breaks Everything

Polyvinyl chloride in the feed releases hydrogen chloride during pyrolysis, corroding equipment and poisoning downstream hydrotreating catalysts at contamination above roughly 50 parts per million. The root cause is that PVC and polyolefin look similar on a sorting line and near-infrared detection struggles with dark and multilayer materials. Commercial impact is unplanned shutdowns, catalyst replacement, and off-specification product. Mitigation runs through dedicated PVC detection, feedstock supply contracts with specification limits, and rejecting loads rather than processing them. Gasification tolerates the same feed, at considerably higher capital cost. Detection equipment for dark and multilayer material remains the weak point.
Market Impact: Reclassified in 24 states
3 additional market trends, 4 additional growth drivers, and 2 additional restraints and challenges are covered in the full report. Contact sales@marketmindsadvisory.com to access the complete intelligence.

Segment CAGR and Growth Architecture

Segmentation follows output product and destination, because that determines the price realised, the certification required, the upgrading needed after conversion, and whether the economics support a plant at all. Conversion technology and feedstock source both cut across every output route rather than separating them, which makes either a weak primary dimension for this market.
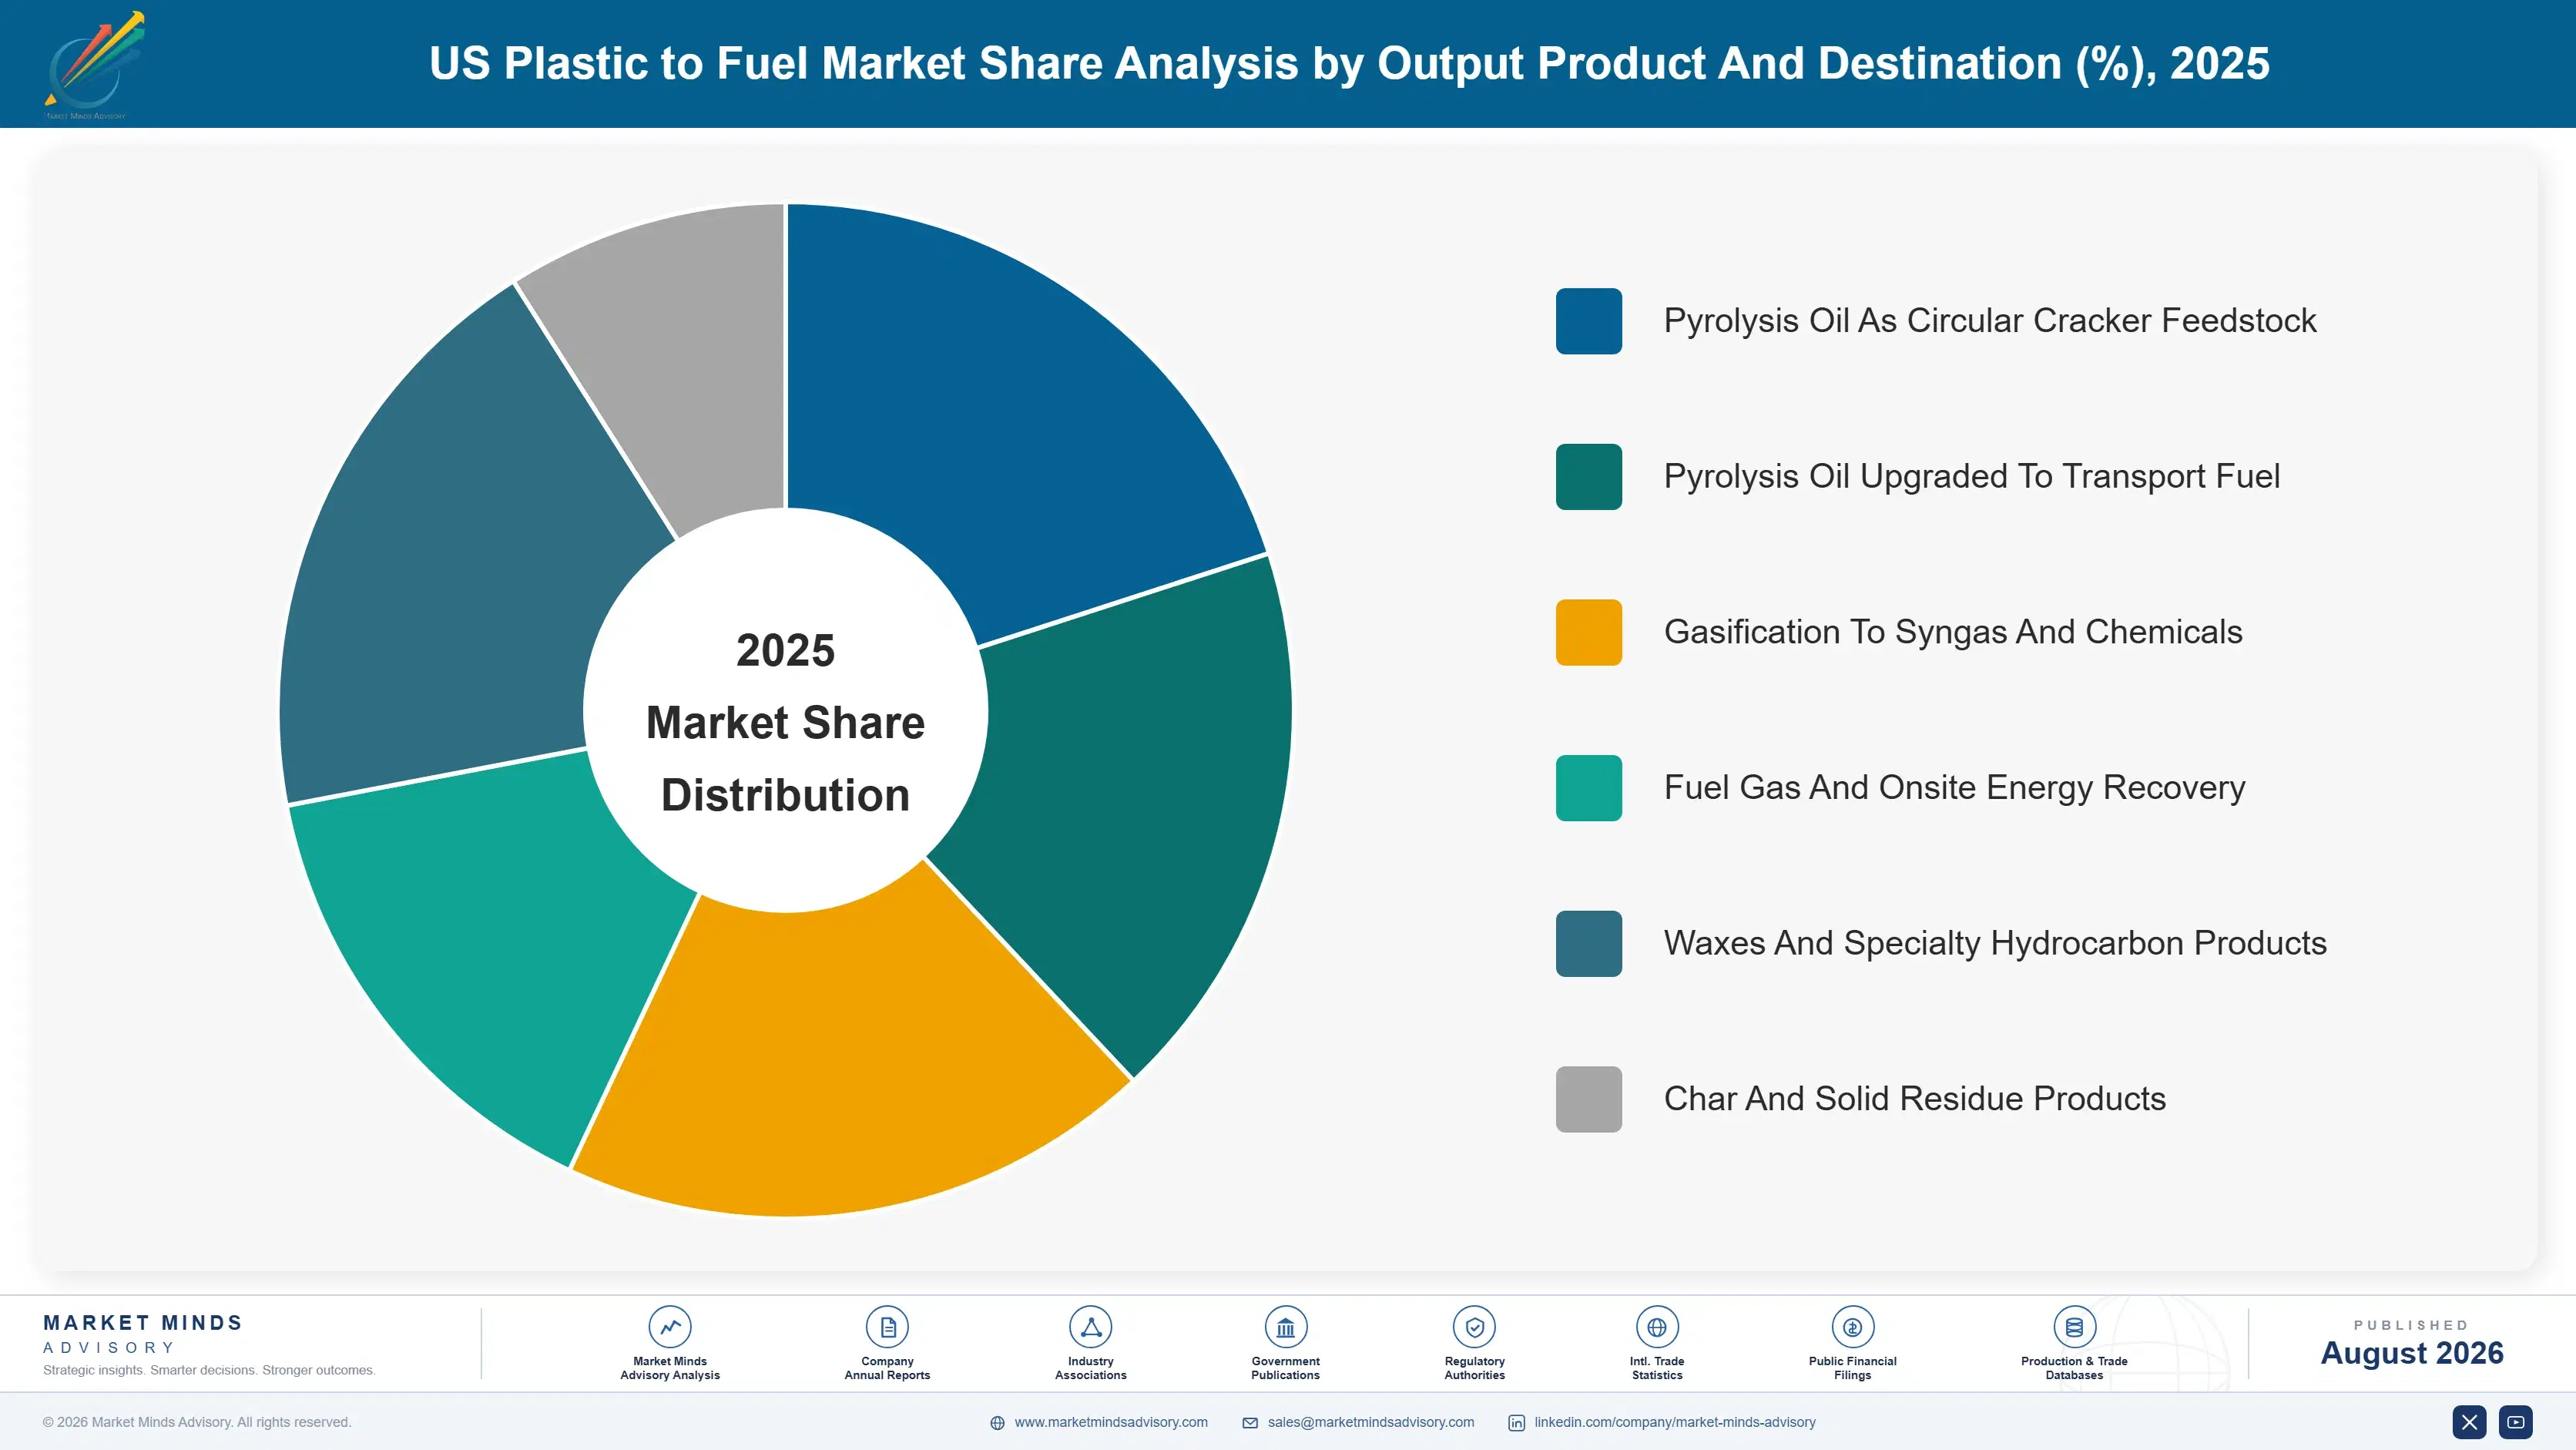
us-plastic-to-fuel-market-market-share-analysis-1787300417144

Pyrolysis Oil Sold As Circular Cracker Feedstock

The fastest route at 22.2%, exactly 1.50 times the market rate, and the only one whose economics genuinely support the capital involved. Oil delivered into a steam cracker under mass balance chain of custody produces polymer that a brand owner counts toward a recycled-content commitment, and realises roughly 3.4 times what the same barrel earns as transport fuel. Specification requirements are far tighter than fuel markets impose, particularly on chlorine and metals, which is precisely why feedstock preprocessing determines whether a plant can access this route at all rather than settling for fuel. Brand owner commitments carry public dates, so demand here is contracted rather than traded. Volume is limited by supply.
CAGR 22.2%

Gasification To Syngas And Chemicals

Second fastest at 17.4%, and a genuinely different process tolerating a dirtier feed than pyrolysis manages. Gasification breaks material down to carbon monoxide and hydrogen at much higher temperature, which handles mixed and contaminated streams that would poison a pyrolysis catalyst, then rebuilds methanol, ammonia, or synthetic fuels from the syngas. Capital intensity is considerably higher and scale requirements larger, so fewer projects reach commercial operation. The feedstock tolerance is the whole argument, and it matters most exactly where sorting infrastructure is weakest. Municipal waste heritage gives several licensors operating history that pyrolysis developers cannot match. Output routes into methanol and ammonia rather than into polymer, which changes the buyer entirely.
CAGR 17.4%
Full segment breakdown across 6 segments available in the complete report.

Regional Architecture and Country Demand Map

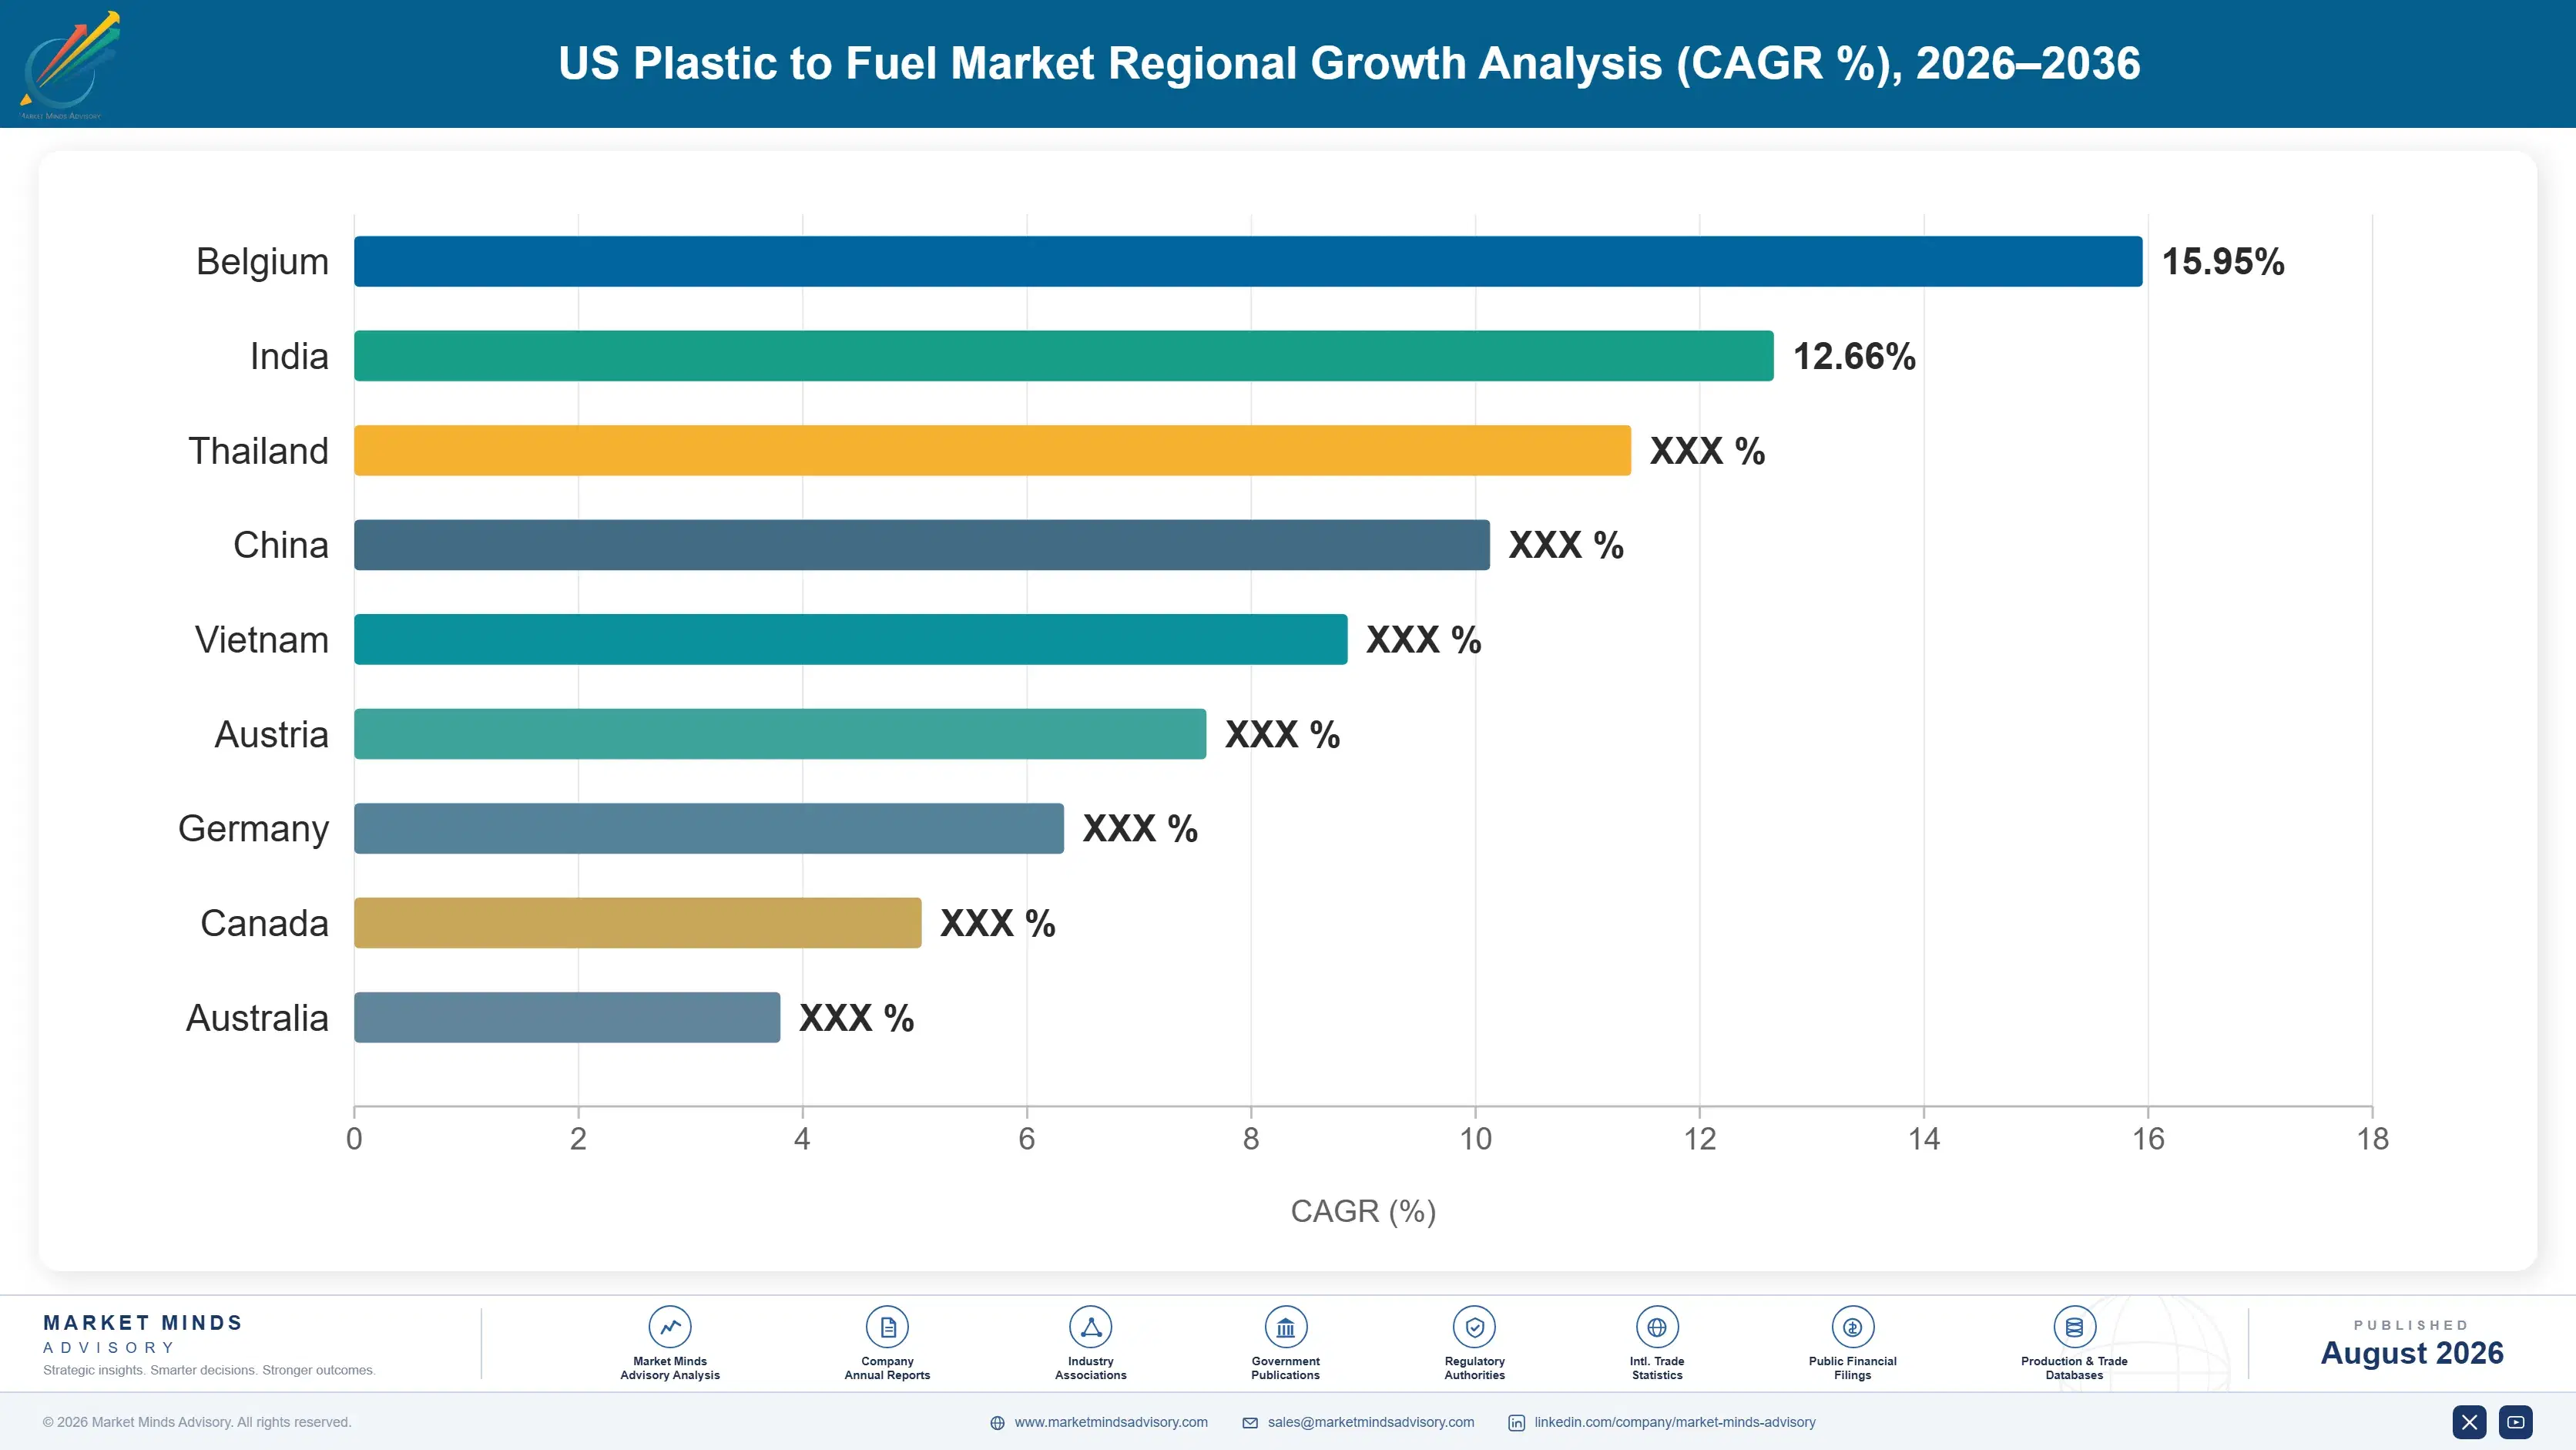
This report covers conversion capacity operating in the United States, so the regional table below is repurposed to show where the process technology behind that capacity originates rather than where the plants themselves sit. Every share falls outside its framework band by construction rather than judgment.

North America

Forty-four percent of the process technology behind United States conversion capacity originates domestically, far outside the framework band because this table shows technology origin rather than plant location. American and Canadian developers built most of the pyrolysis capacity now operating, learning the feedstock lesson expensively and in public across a decade of announcements and closures. Chemical companies purchasing output have increasingly taken equity or offtake positions that shape technology selection. Growth at 14.2% tracks close to the market rate, reflecting domestic technology maturing alongside the capacity it serves. Several domestic processes now carry operating hours that no announcement can substitute for. Licensing into projects funded by others has become the preferred model.
Share: 44% | CAGR: 14.2% (2026 to 2036)

Western Europe

Thirty-one percent, and European licensors carry a disproportionate share relative to European operating capacity because packaging waste regulation there forced technology development earlier than commercial demand justified. British, Spanish, Dutch, German, and Finnish developers hold processes now licensed into American projects, several of them with longer continuous operating records than any domestic equivalent. Certification and mass balance frameworks also developed in Europe first and travelled with the technology. Growth at 13.4% is the slowest of any origin here, reflecting mature licensing positions rather than any decline in capability. Packaging waste directives created demand for the technology before any commercial market existed for its output. American developers increasingly license rather than develop.
Share: 31% | CAGR: 13.4% (2026 to 2036)
Regional intelligence for 5 additional markets available in the complete report: East Asia, Eastern Europe, South Asia and Pacific, Latin America, Middle East and Africa. Contact sales@marketmindsadvisory.com.
us-plastic-to-fuel-market-country-cagr-analysis-1787300417668

Getting Plants To Actually Run

Around 19% of announced capacity actually operates, sorting yields only 62% usable material, chlorine above 50 parts per million breaks the process, and the certified barrel earns 3.4 times what the fuel barrel earns. Value comes from building preprocessing first, from reaching the certified route, and and from contracting feedstock on strict contaminant specification limits.

Build Preprocessing Before Building Conversion Capacity

Plants operating at commercial rates built or contracted dedicated sorting, washing, drying, and chlorine screening before commissioning conversion, and plants that assumed municipal streams would arrive clean enough largely did not reach commercial operation at all. Preprocessing costs roughly 45 million dollars alongside a conversion facility and determines whether the rest of the capital works. Sizing a plant on collected tonnage rather than on the 62% that survives sorting guarantees an overbuilt facility running permanently below nameplate. Lenders have started asking about sorting capacity before asking about reactor selection. Reactor selection now comes second in most credible development sequences.
Market Impact: Preprocessing investment adds about 45 million dollars of capital

Reach The Certified Feedstock Route Or Do Not Build

Oil sold into transport fuel earns diesel economics that do not support a conversion plant at any scale that has been attempted, while the identical barrel delivered into a steam cracker under mass balance certification realises roughly 3.4 times as much. Specification requirements are correspondingly tighter, particularly on chlorine and metals, which loops directly back to preprocessing. A project without a credible route to certified offtake is building a facility whose output cannot cover its capital. Certified offtake also removes crude price exposure entirely from the revenue line. Recycled-content scarcity rather than crude sets that price entirely.
Market Impact: Certified barrel realises about 3.4 times the fuel pricing

Contract Feedstock On Specification Not On Tonnage

Supply agreements written on tonnage delivered rather than on contaminant specification transfer every quality risk to the plant, which then shuts down when a load carrying polyvinyl chloride pipe arrives and chlorine passes 50 parts per million. Contracts specifying maximum chlorine, moisture, and polyester content, with rejection rights and testing at receipt, move that risk to the party who can actually control it. Suppliers resist the terms and the alternative is unplanned shutdowns and catalyst replacement costing far more. Testing at receipt costs little and prevents the shutdown that follows acceptance.
Market Impact: Supply specification caps chlorine at 50 parts per million

Demonstrate Sustained Operation Instead Of Announcing Capacity

A decade in which roughly 19% of announced capacity reached commercial operation has left investors and offtakers treating announcements as noise, which raises the cost of capital for competent developers alongside everybody else. Publishing sustained throughput, availability, and product specification data from an operating facility is worth more than any further announcement. It costs nothing beyond disclosure discipline and separates a developer from a field that has spent a decade damaging its own credibility. Offtakers now ask for availability records before discussing any volume commitment. Competent developers currently pay for the failures of others.
Market Impact: Roughly 19% of announced capacity reaches commercial operation

Who Controls the Margin Pool

Concentration reaches 43% across the top five measured on annual operating processing capacity in the United States, and the moderate figure reflects a sector where the leaderboard changes when plants stop running rather than when anybody wins business. Project developers, chemical companies taking offtake and equity positions, and technology licensors all appear, and several names that dominated announcement volume five years ago no longer operate anything at all.
Competitive activity runs on three fronts. Feedstock access and preprocessing capability is the first, since it determines whether a plant runs and what output specification it can reach. Certified offtake relationships are the second, because the price difference between certified and fuel routes exceeds any operating efficiency available. Demonstrated availability is the third, and after a decade of announcements it is what finances the next project.

Pressure comes from two directions. Mechanical recycling keeps improving on the streams it can handle, which removes the cleanest feedstock from this sector. And state legislative pushback against reclassification threatens the permitting position that made recent projects viable. Gasification licensors are also pushing into positions pyrolysis developers assumed were theirs, on feedstock tolerance rather than on efficiency. Rankings will move on demonstrated availability.
us-plastic-to-fuel-market-company-positioning-matrix-1787300418188

Competitive Moat and Risk Dimensions

BRIGHTMARK

Moat: Operating scale and feedstock relationships

Reaching commercial operation at scale in a sector where most announced capacity never did produces genuine knowledge about which feedstock streams work and which destroy a plant, and that learning was expensive to acquire. Established supply relationships on specification terms rather than tonnage terms are worth more than any reactor design advantage.
BRIGHTMARK

Risk: Sector credibility damages everybody

A decade in which roughly 19% of announced capacity reached operation has left investors sceptical of every developer regardless of individual record, which raises the cost of capital for competent operators alongside failed ones. Demonstrated availability data helps and does not fully separate a company from its sector.
ALTERRA ENERGY

Moat: Licensed process with operating record

A continuously operating reference facility supporting technology licensing gives potential developers something almost nobody else in this sector can offer, which is evidence rather than projection. Licensing also spreads the technology across projects funded by others, building operating hours and learning without carrying the capital risk of each plant. That model scales considerably faster than owning facilities.
ALTERRA ENERGY

Risk: Licensees control feedstock quality

A licensor's technology reputation depends on plants operated by other companies that may or may not invest in the preprocessing the process actually requires. A licensee cutting sorting investment produces a failure attributed to the technology rather than to the operator. Controlling that through licence terms is difficult and enforcing it commercially is harder still.

Key Players

Brightmark
Alterra Energy
Nexus Circular
Encina
Agilyx

Others

Plastic Energy
BASF
ExxonMobil
Chevron Phillips Chemical
Dow
Eastman Chemical
LyondellBasell
Shell
Neste
PureCycle Technologies
Cyclyx
Braven Environmental
Freepoint Eco-Systems
Anellotech
Honeywell UOP

Recent Developments

JANUARY 2025

Developer commissions dedicated preprocessing ahead of conversion capacity

A conversion developer commissioned dedicated sorting, washing, and chlorine screening capacity before starting its conversion reactor, reversing the sequence most earlier projects followed. The investment was organic capital expenditure rather than any joint venture, acquisition, or arrangement with a waste handling company. Sorting capacity was sized on usable yield.
Signal: The plants that run built preprocessing first, and the announcements still routinely ignore that sequence entirely.
APRIL 2025

Chemical producer signs multi-year certified circular feedstock offtake

A petrochemical producer contracted multi-year offtake of pyrolysis oil meeting cracker specification under mass balance certification, supplying polymer into brand owner recycled-content commitments. The agreement was a commercial offtake contract rather than any equity investment, joint venture, or acquisition of the conversion developer. Volume was contracted rather than traded.
Signal: Certified offtake rather than fuel sales is what makes the capital behind these plants recoverable at all.
AUGUST 2025

State legislature debates reversing manufacturing reclassification for pyrolysis

A state legislature considered amending its statute to return pyrolysis and gasification of plastic to solid waste regulation, following campaigning that the manufacturing classification reduces environmental oversight. The debate was a legislative process rather than any enforcement action or agreement involving conversion developers. No enforcement action accompanied the debate.
Signal: Reclassification is being argued rather than settled, and it determines where new capacity can be permitted

Feedstock, Sorting and Heat

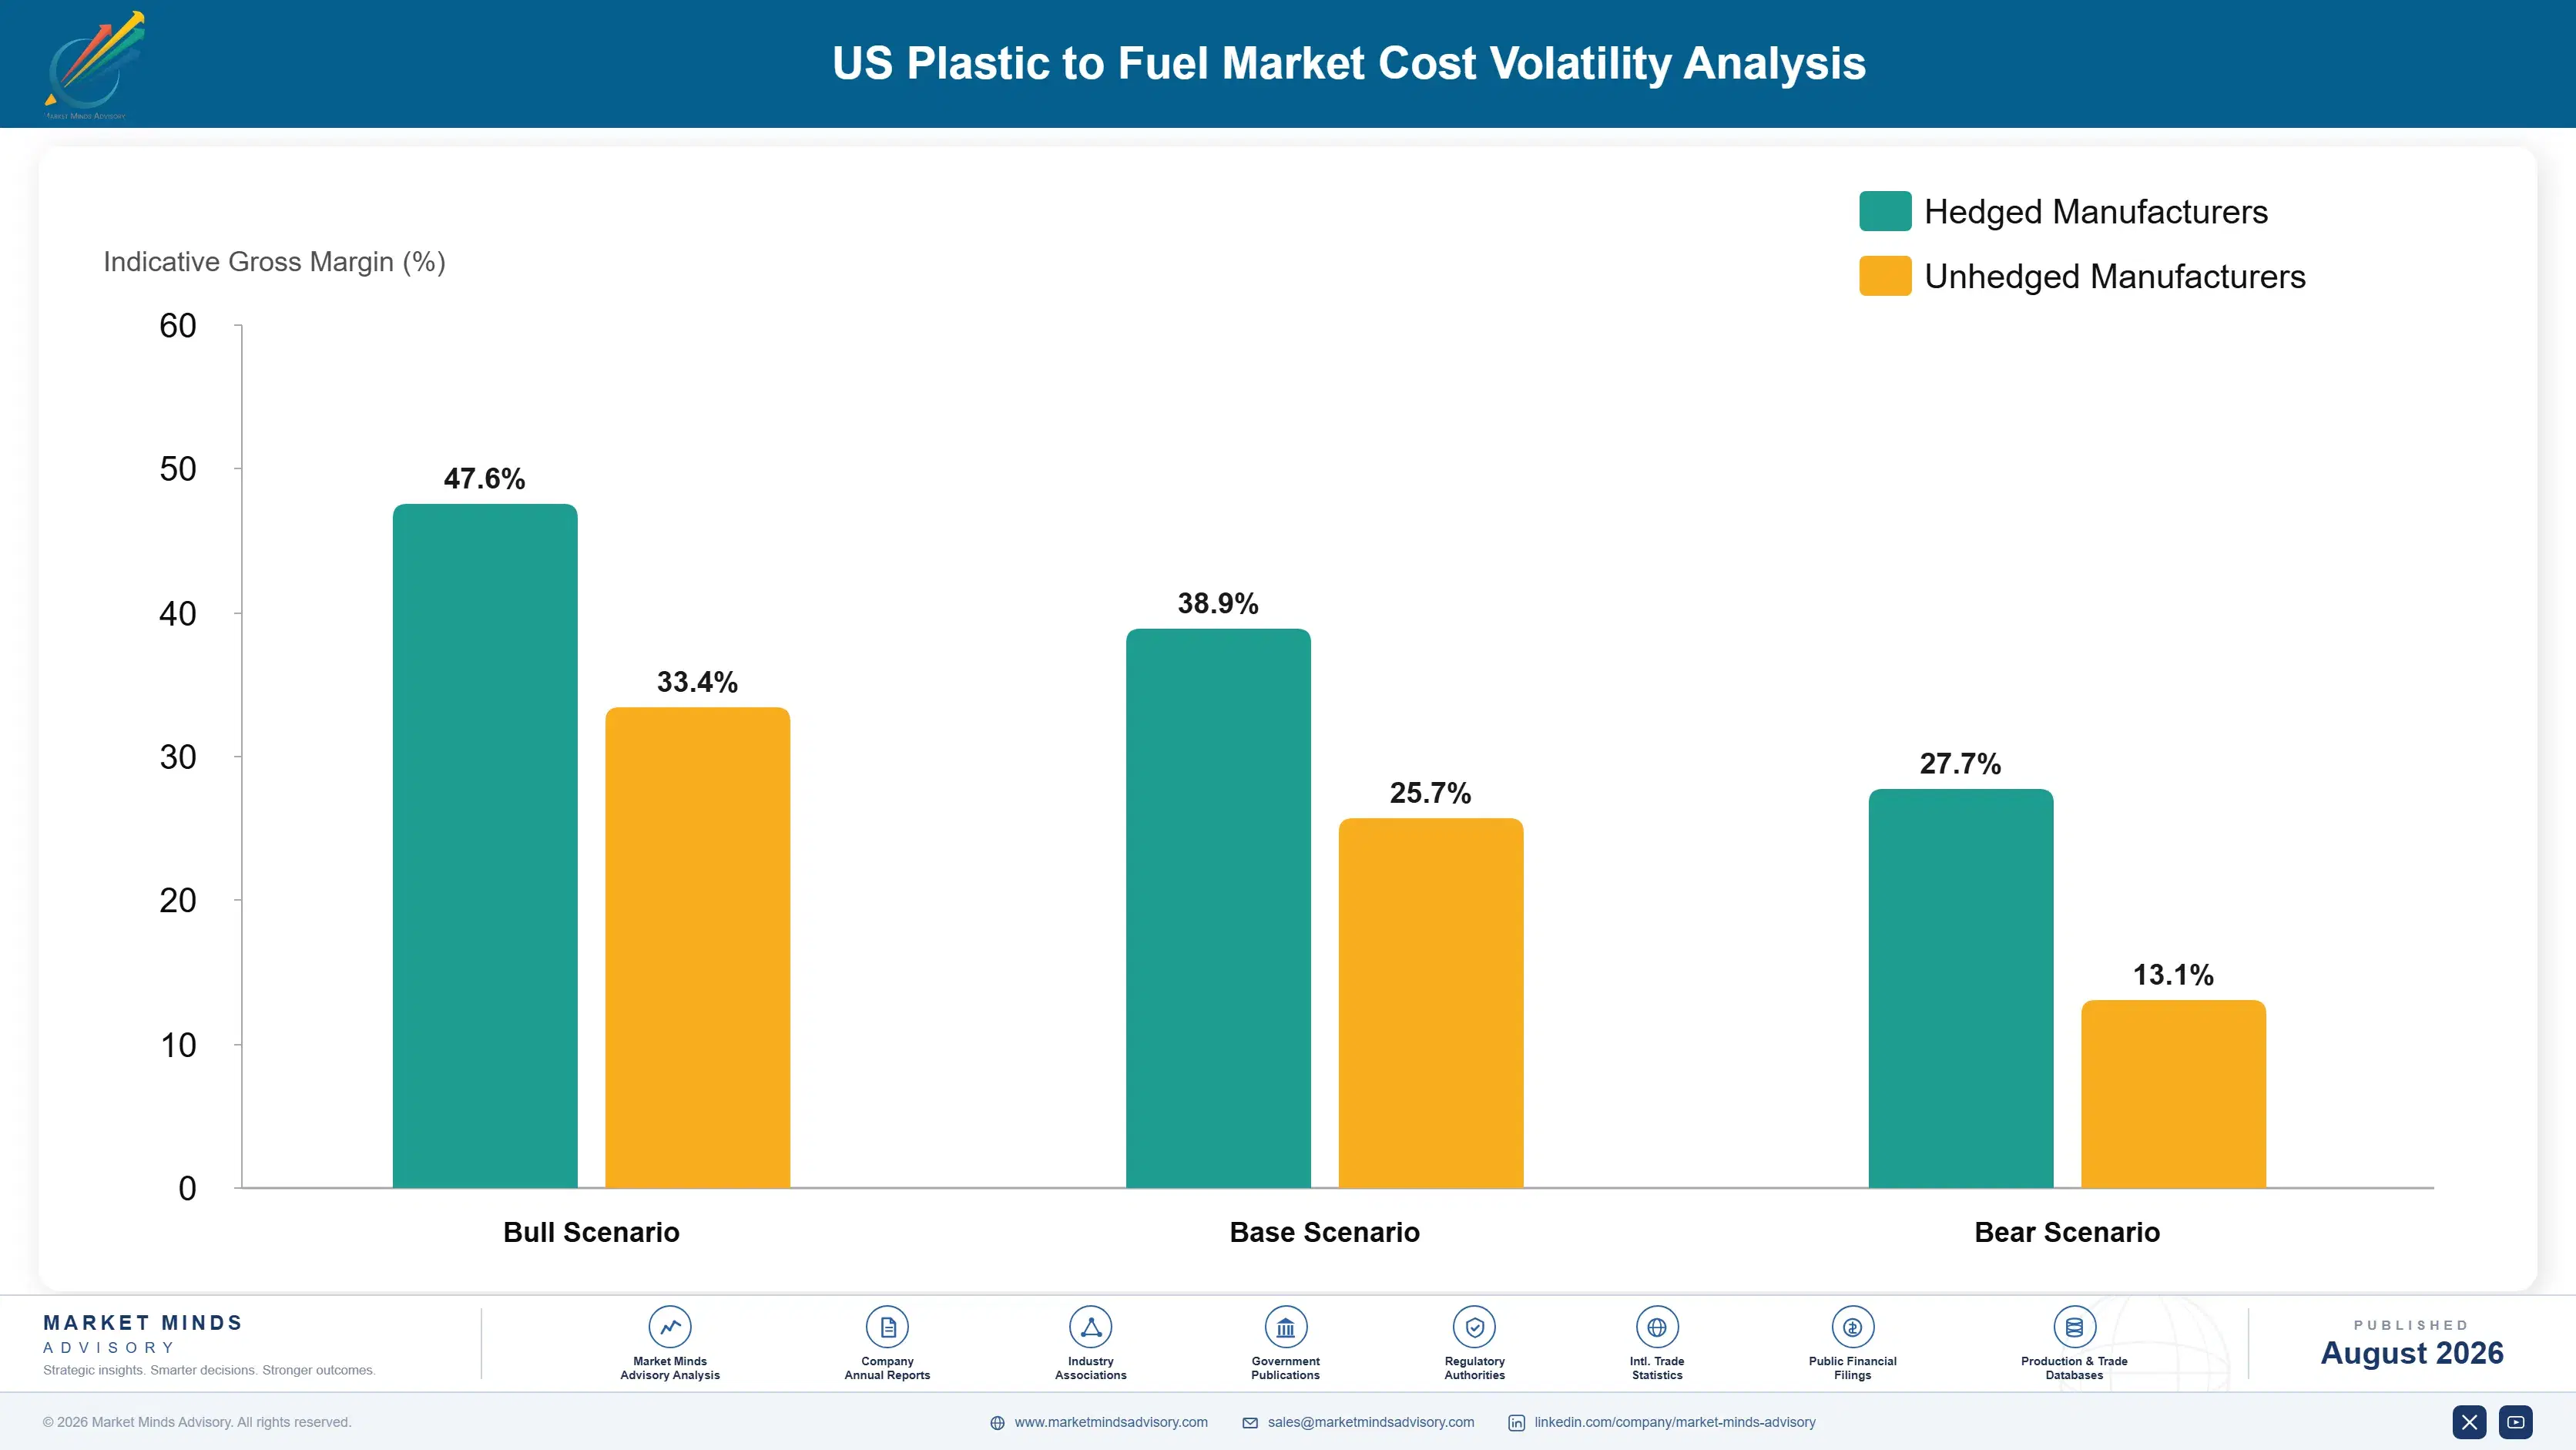
Feedstock acquisition and preprocessing together dominate at roughly 46% of operating cost, which is higher than most projections assumed because sorting, washing, drying, and rejection of unusable material all sit inside it. Process energy for pyrolysis adds about 21%, catalyst and consumables near 11%, and upgrading, hydrotreating, and product handling carry the remainder alongside labour and maintenance.
Diesel and naphtha pricing sets the floor under this business whenever output is sold as fuel rather than as certified feedstock. EIA petroleum price reporting documents the movement that determines whether a fuel-route facility covers its operating cost at all, and periods of weak distillate pricing have pushed several operators toward shutdown rather than production. That exposure disappears entirely on the certified route, which is priced against recycled-content scarcity rather than against crude.

The competitive disadvantage mechanism runs through output route rather than through operating efficiency. A facility selling into fuel markets carries full commodity price exposure and cannot escape it through any process improvement available. One delivering certified cracker feedstock is priced against a recycled-content commitment with no crude linkage at all. Route choice, decided at project design, determines exposure more completely than anything an operator does afterward.
us-plastic-to-fuel-market-cost-volatility-analysis-1787300418382

Design for certified specification rather than fuel specification

A plant built to fuel specification cannot reach cracker feedstock quality without substantial retrofit, which means the route decision is effectively made at design and cannot be revisited cheaply afterward. Designing for the tighter specification costs more upfront and removes commodity price exposure permanently. Operators who built to fuel specification are now discovering how expensive that decision was to reverse.

Contract feedstock supply on contaminant specification limits

Supply agreements written on tonnage transfer all quality risk to the plant, which then absorbs the shutdown and catalyst replacement cost when contaminated material arrives. Specification limits on chlorine, moisture, and polyester content with rejection rights move that risk to the handler who can control it through sorting. Suppliers resist the terms until the alternative is explained properly.

Recover process heat rather than purchasing all of it

Pyrolysis consumes about 21% of operating cost in process energy, and the fuel gas fraction produced by the reaction itself can supply a meaningful share of that requirement whenever the plant has been designed to capture and burn it properly. Facilities that vented or flared that fraction are simply purchasing energy they already produced themselves.

Portfolio Architecture for Margin Defence

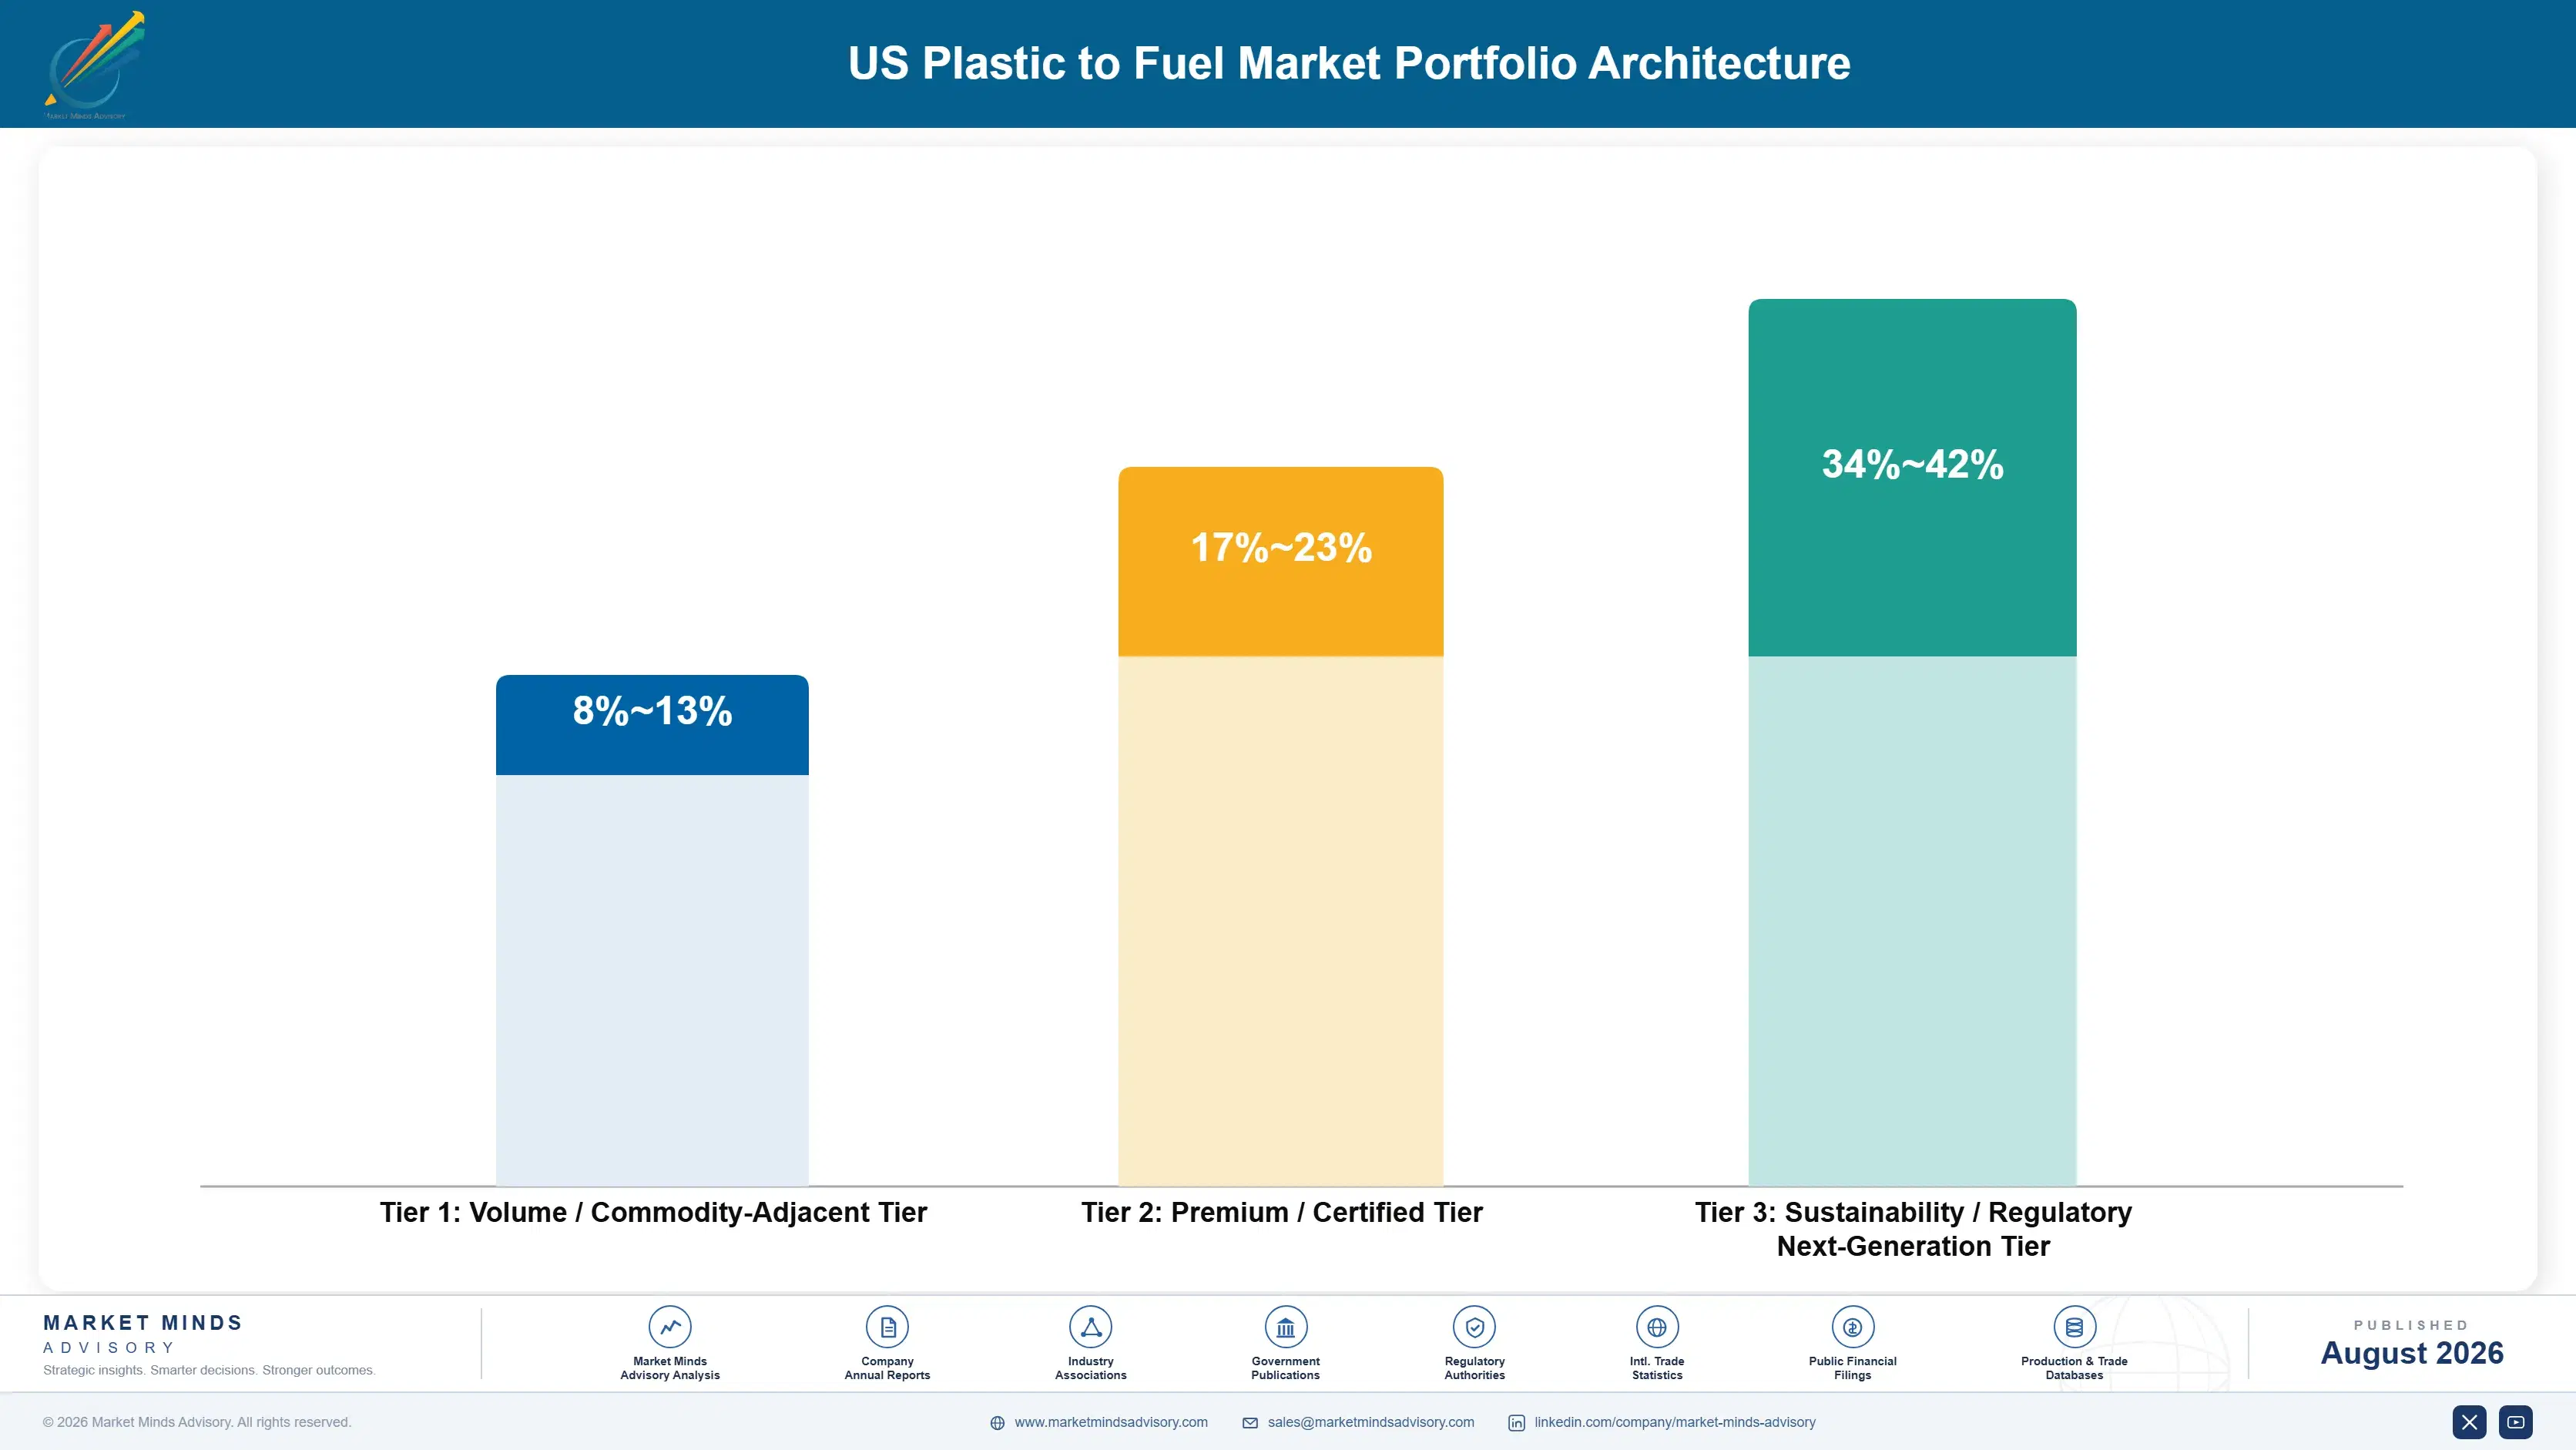
Three tiers describe this business and the spread is set entirely by where the output goes. Fuel gas, char, and onsite energy recovery sit at the bottom, priced against commodity energy and barely covering the handling they require. Transport fuel and wax products sit modestly higher on distillate and specialty pricing. Certified circular cracker feedstock occupies a third tier priced against recycled-content scarcity rather than against any hydrocarbon benchmark.
The tension is that every plant produces all three whether it wants to or not. Pyrolysis yields an oil fraction, a gas fraction, and a solid residue, and the lower-value streams must be handled and sold regardless. A facility optimised purely for certified oil still needs a route for the rest, and operators who ignored that discovered disposal costs consuming the premium the oil earned.

High-value pools concentrate where a brand owner has a dated commitment and no alternative supply. Food-contact packaging and film applications both require polymer quality mechanical recycling cannot deliver, which removes price comparison from the conversation almost entirely. Film converters and food-contact brands both carry dated commitments and no alternative supply route. That combination is where pricing power actually sits in this market.

Volume / Commodity-Adjacent Tier

Fuel gas, char, and onsite energy recovery priced against commodity energy and barely covering the handling required. Negligible margin, but every plant produces these fractions regardless and needs a disposal or sales route for all of them.
Gross Margin: 8-13%

Premium / Certified Tier

Transport fuel and specialty wax products priced against distillate and hydrocarbon benchmarks with full commodity exposure. Margin covers operating cost in favourable price periods and disappears in weak ones, which is what pushed several facilities toward shutdown.
Gross Margin: 17-23%

Sustainability / Regulatory / Next-Generation Tier

Certified circular cracker feedstock delivered under mass balance chain of custody into brand recycled-content commitments. Best margin by a wide margin, because pricing follows recycled-content scarcity rather than any crude linkage and no alternative supply exists.
Gross Margin: 34-42%
us-plastic-to-fuel-market-portfolio-architecture-1787300418883

High-value Sub-segments and Strategic Watch-out

Certified Circular Cracker Feedstock

Fastest growth at 22.2%, exactly 1.50 times the market rate, and the only route whose economics genuinely support conversion plant capital. Realises roughly 3.4 times what the identical barrel earns as transport fuel, priced against scarcity rather than crude. Demand is contracted against dated brand commitments.
Gross Margin: 34-42%

Gasification Feedstock Tolerance

Strong growth at 17.4% on a process handling contaminated streams that would poison a pyrolysis catalyst outright. Capital intensity and scale requirements are considerably higher, which is why fewer projects reach commercial operation despite the feedstock advantage. Output routes into methanol and ammonia rather than polymer.
Gross Margin: 17-23%

Transport Fuel Output Routes

Full commodity exposure against distillate pricing with no escape available through any process improvement whatsoever. Facilities designed to fuel specification cannot reach cracker quality without substantial retrofit, which makes the design decision effectively permanent. Weak distillate pricing has pushed several such facilities toward shutdown. Retrofit is expensive.
Gross Margin: 17-23%

Announcement-Stage Project Pipeline

The strategic watch-out, since roughly 19% of announced capacity has reached commercial operation and investors now discount announcements accordingly across the whole sector. Reputation damage here is collective rather than individual, which competent developers cannot escape alone. Publishing sustained availability data is the only available remedy here.
Gross Margin: 8-13%

Who Actually Buys The Output

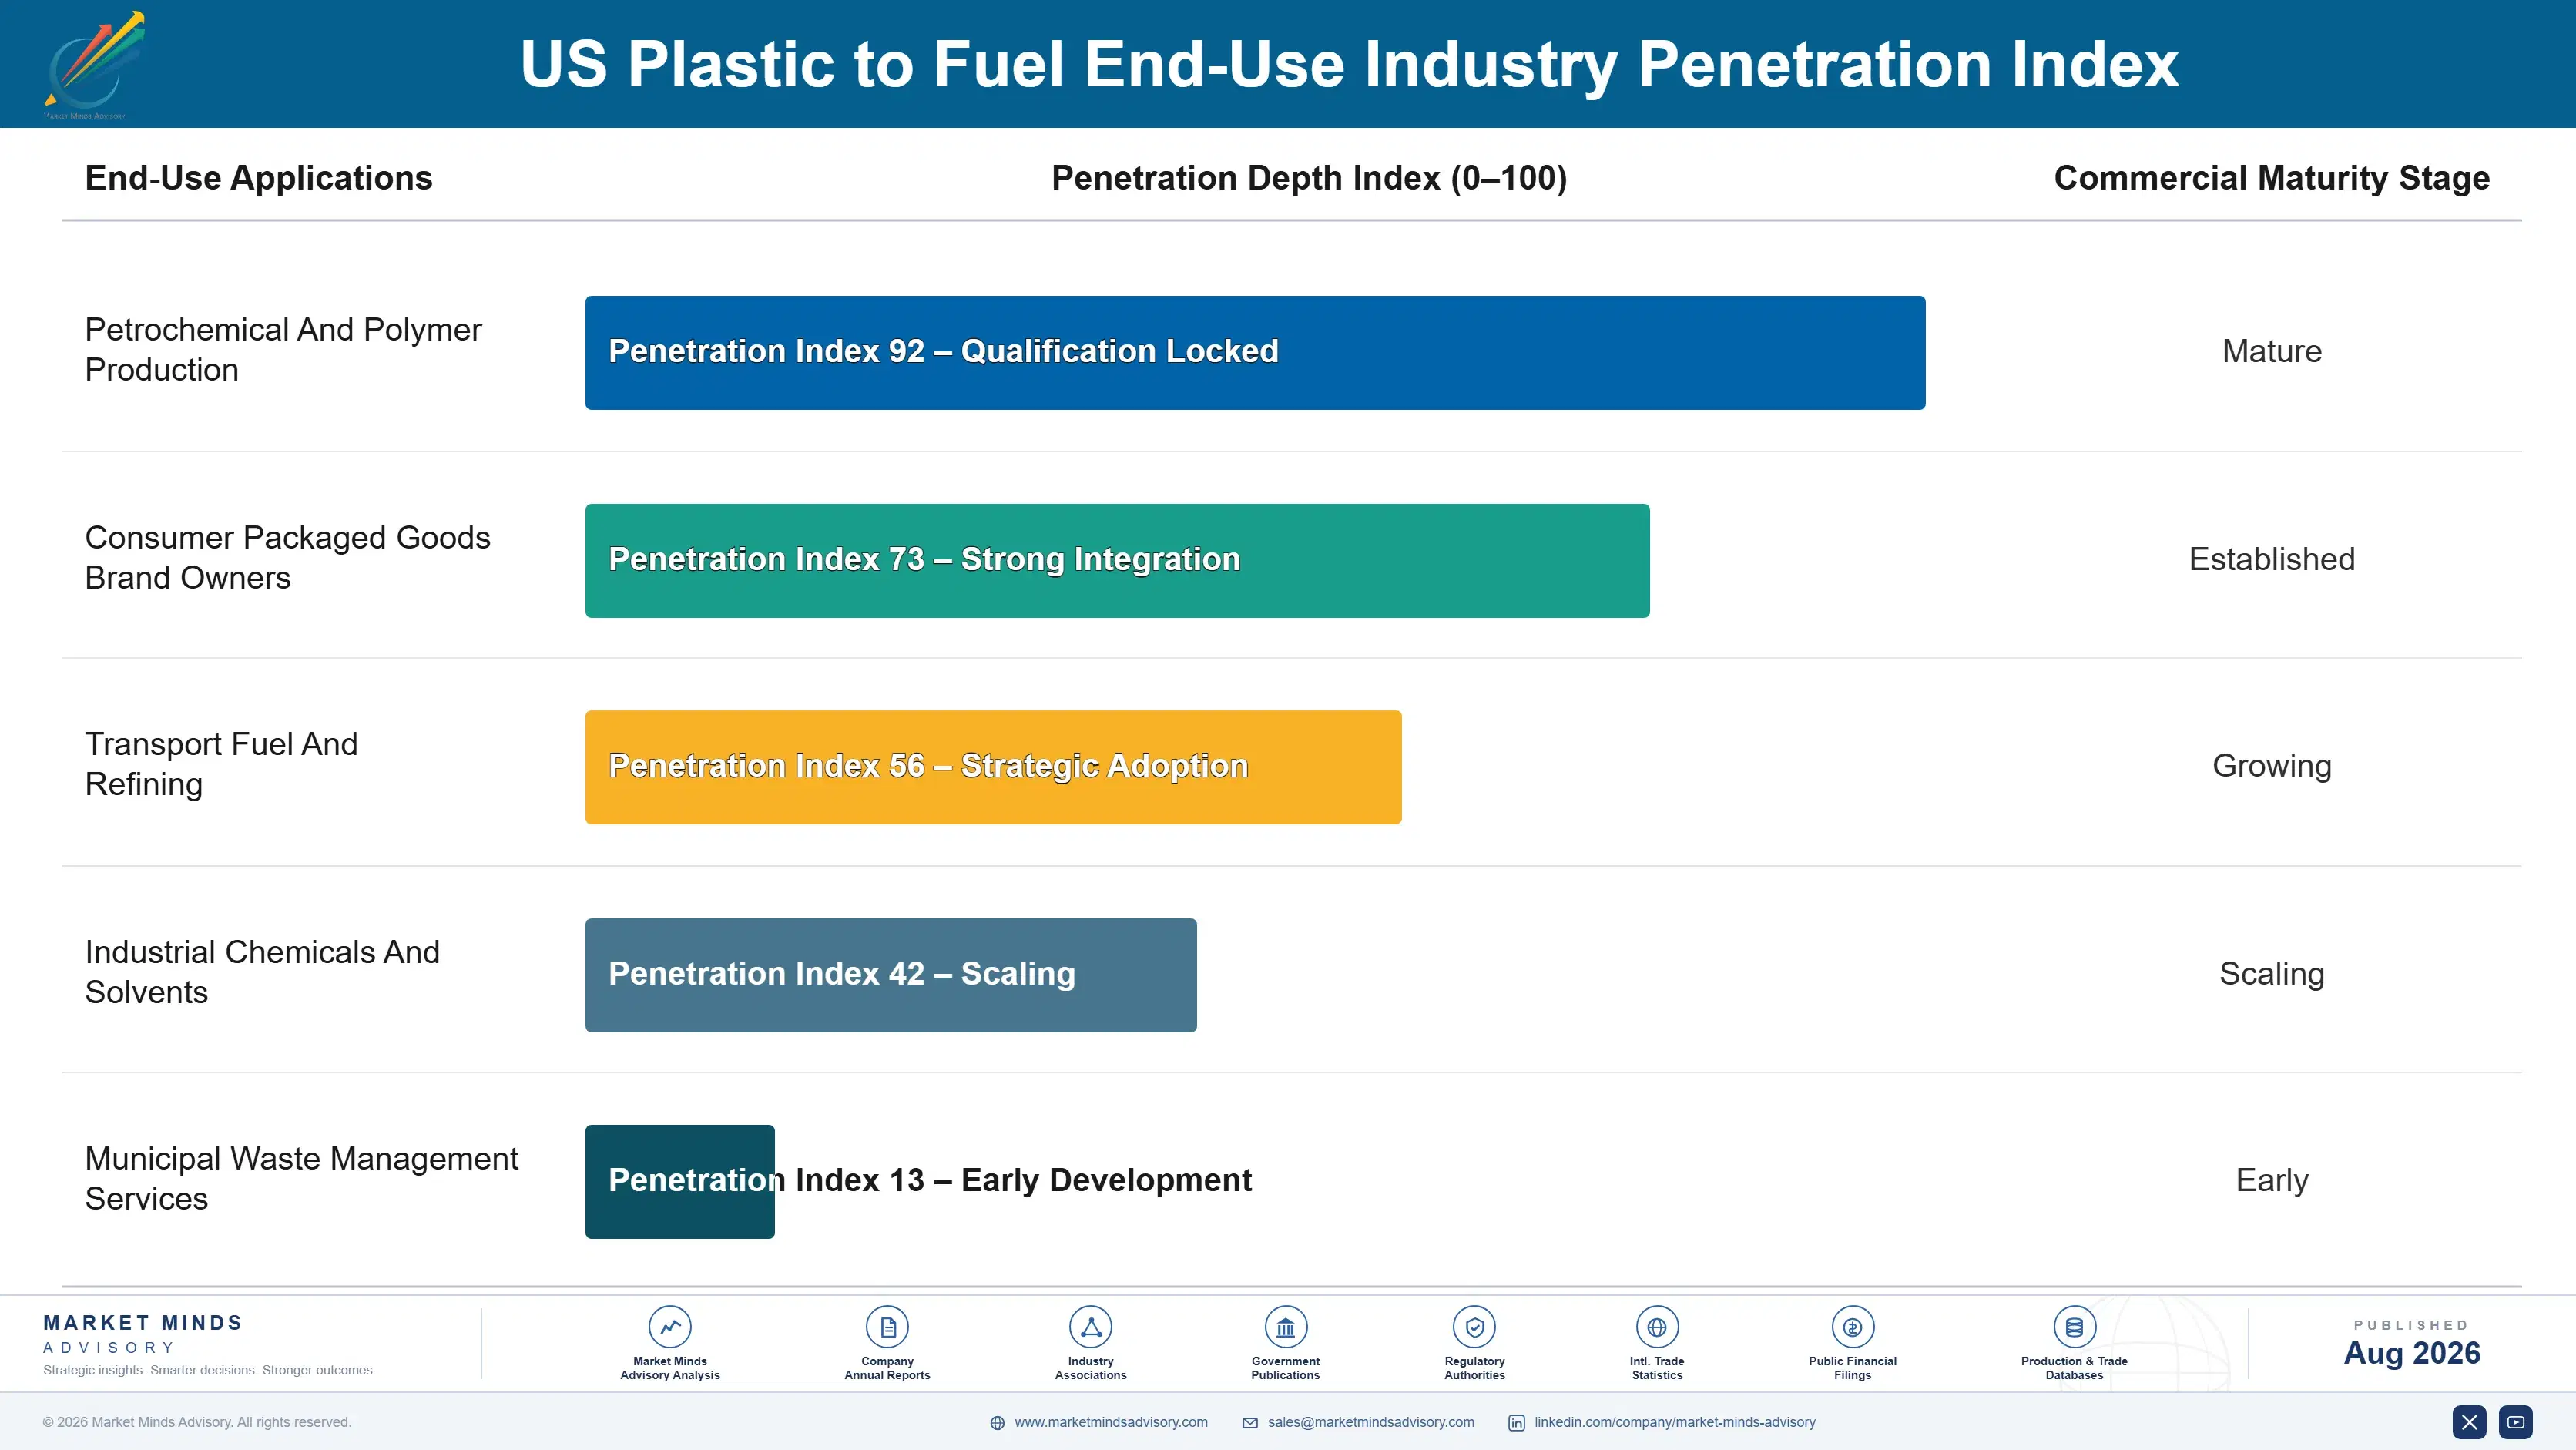
Demand splits into two populations that behave nothing alike. Fuel buyers purchase against a posted commodity price, switch on cents, and offer no contractual security beyond the immediate transaction. Brand owners buying certified circular content sign multi-year offtake against dated commitments they have publicly announced, care about chain of custody documentation far more than price, and cannot switch to an alternative because mechanical recycling cannot supply the quality they require.
Stickiness follows the certification rather than the relationship. A cracker that has qualified a pyrolysis oil against its own specification, and a brand that has validated the resulting polymer for food contact, will not repeat that work casually for a marginal price difference. Fuel offtake sticks not at all. Gasification syngas customers sit between the two, tied by pipeline or plant adjacency rather than by any qualification.

Buyer profiles shifted decisively when brand commitments got dates attached. Purchasing moved from fuel traders to sustainability and packaging functions inside consumer goods companies. Those functions evaluate chain of custody documentation and audit trails rather than posted price. Procurement now runs on multi-year contracts written against commitment deadlines.
us-plastic-to-fuel-market-end-use-penetration-index-1787300419369

What We Would Tell a Board

These are among the four positions where our research anticipates prominent divergence between winners and laggards over the coming forecast period. Each is grounded in the demand model, the regulatory perimeter, and the announced capacity pipeline.
01 / PREPROCESSING SEQUENCING DISCIPLINE

Build the sorting line before the reactor

Every facility running at commercial rates built or contracted dedicated sorting, washing, drying, and chlorine screening before commissioning conversion, while those that assumed municipal recycling streams would arrive clean enough largely never reached commercial operation at all. Preprocessing costs roughly 45 million dollars alongside a conversion plant, and it determines whether the remaining capital ever produces anything worth selling at all. Sizing a facility on collected tonnage rather than on the 62% that survives sorting guarantees permanent operation well below nameplate throughput.
02 / OUTPUT ROUTE SELECTION

The fuel barrel will not pay for the plant

Pyrolysis oil sold into transport fuel earns diesel economics that have never supported conversion plant capital at any scale attempted anywhere in this sector, while the identical barrel delivered under mass balance certification into a steam cracker realises roughly 3.4 times as much money. Specification requirements are correspondingly tighter on chlorine and on metals, which loops directly back into preprocessing investment decisions made at design. A project without a credible certified offtake route is building a facility whose output cannot recover its capital.
03 / FEEDSTOCK CONTRACT STRUCTURE

Tonnage contracts hand you all the quality risk

Supply agreements written on tonnage delivered rather than on contaminant specification transfer every quality risk to the plant, which then shuts down when a load carrying polyvinyl chloride arrives and chlorine passes 50 parts per million in the feed. Contracts specifying maximum chlorine, moisture, and polyester content with rejection rights and testing at receipt move that risk to the handler who can actually control it through better sorting. Suppliers resist those terms until the shutdown and catalyst cost is explained properly.
04 / SECTOR CREDIBILITY RESTORATION

Publish availability data and stop announcing capacity

A decade in which roughly 19% of announced capacity reached commercial operation has left investors and offtakers treating every announcement in this sector as noise, which raises the cost of capital for competent developers alongside the failures they never resembled. Publishing sustained throughput, availability, and product specification data from an operating facility is worth considerably more to a board than any further announcement. It costs nothing beyond ordinary disclosure discipline, and it separates a competent company from a field that spent a decade damaging itself.

Engagement Snapshot From the Field

A live engagement with an industry participant carrying material or product regulatory and market exposure ahead of a defining policy shift, showing how our research translates into a defensible multi-year portfolio strategy.
MARKET MINDS ADVISORY · CLIENT ENGAGEMENT SUMMARY
US Plastic to Fuel Producer Strategic Portfolio Review and Transition Roadmap 2026·Investment Scenario on US Plastic to Fuel Exposure Evaluation 2025-26
CLIENT PROFILE
A waste conversion developer with approximately 68 million dollars in annual revenue (client-reported, unverified by MMA), operating one commercial pyrolysis facility in the United States and holding two announced projects at development stage. Output was sold largely into fuel markets, feedstock was contracted on tonnage terms, and preprocessing had been sized against nameplate rather than usable throughput.
STRATEGIC CHALLENGE
The operating facility ran well below nameplate with frequent unplanned shutdowns, and management attributed this to reactor performance and proposed a technology change for the two development projects. The board wanted an independent read on where availability was actually being lost before committing to a different licensor across the whole pipeline.
MMA APPROACH
We reconstructed two years of shutdown events by root cause, separating reactor faults from feedstock-driven trips and catalyst issues. Incoming feedstock was sampled and tested against reactor specification. Contract terms were reviewed across every supply agreement, and realised pricing was compared between the client's fuel sales and certified feedstock transactions elsewhere in the market.
KEY FINDINGS
  1. Feedstock-driven trips accounted for the substantial majority of lost availability, and reactor faults explained a small minority of shutdown hours across the two years.
  2. Incoming material exceeded chlorine specification on a meaningful share of loads tested, and no supply contract contained any contaminant limit or rejection right at all.
  3. Sorting capacity had been sized on collected tonnage rather than on usable yield, leaving preprocessing as the bottleneck whenever feed quality deteriorated.
  4. Certified feedstock transactions elsewhere realised several times the client's fuel pricing, and the facility could not meet that specification without preprocessing investment.
CLIENT PROFILE
A waste conversion developer with approximately 68 million dollars in annual revenue (client-reported, unverified by MMA), operating one commercial pyrolysis facility in the United States and holding two announced projects at development stage. Output was sold largely into fuel markets, feedstock was contracted on tonnage terms, and preprocessing had been sized against nameplate rather than usable throughput.
STRATEGIC CHALLENGE
The operating facility ran well below nameplate with frequent unplanned shutdowns, and management attributed this to reactor performance and proposed a technology change for the two development projects. The board wanted an independent read on where availability was actually being lost before committing to a different licensor across the whole pipeline.
MMA APPROACH
We reconstructed two years of shutdown events by root cause, separating reactor faults from feedstock-driven trips and catalyst issues. Incoming feedstock was sampled and tested against reactor specification. Contract terms were reviewed across every supply agreement, and realised pricing was compared between the client's fuel sales and certified feedstock transactions elsewhere in the market.
KEY FINDINGS
  1. Feedstock-driven trips accounted for the substantial majority of lost availability, and reactor faults explained a small minority of shutdown hours across the two years.
  2. Incoming material exceeded chlorine specification on a meaningful share of loads tested, and no supply contract contained any contaminant limit or rejection right at all.
  3. Sorting capacity had been sized on collected tonnage rather than on usable yield, leaving preprocessing as the bottleneck whenever feed quality deteriorated.
  4. Certified feedstock transactions elsewhere realised several times the client's fuel pricing, and the facility could not meet that specification without preprocessing investment.
RECOMMENDED STRATEGY
Phase 1: Phase 1 (months one to nine): cancel the technology change, renegotiate supply agreements onto contaminant specification with rejection rights, and expand sorting capacity. Phase 2: Phase 2 (months nine to twenty-four): invest in preprocessing to reach cracker specification and pursue certified offtake rather than fuel sales. Phase 3: Phase 3 (months twenty-four to forty-two): redesign the two development projects around preprocessing capacity sized on usable yield. sized on usable yield.
OUTCOME
The technology change was cancelled. Availability at the operating facility improved substantially within three quarters once supply contracts carried specification limits, preprocessing investment was approved, and the first certified feedstock offtake discussions began with a petrochemical producer (client-reported, unverified by MMA). Both development projects were redesigned around preprocessing capacity.

Frequently Asked Questions

Foundational context covering the market sizes, CAGR, scope, country, region and competition that inform every finding below. This section is provided to cover basics and most often pre-purchase conversations, answered from the MMA Primary Research Dataset.

What is the current size of the US Plastic to Fuel Market?

The market is valued at USD 0.42 billion in 2025, rising to USD 0.48 billion in 2026. Scope covers revenue from products sold by conversion facilities operating in the United States.

How large will the US Plastic to Fuel Market be by 2036?

MMA forecasts USD 1.92 billion by 2036, an increase of USD 1.44 billion over the 2026 base. That represents an expansion multiple of 4.00 times across the forecast period.

What is the CAGR for the US Plastic to Fuel Market 2026 to 2036?

The base case CAGR is 14.8%, with a bull case of 16.0% and a bear case of 13.6%. The historical rate from 2020 to 2025 was 13.2%, well below what announcements implied.

Which segment is growing fastest?

Pyrolysis oil sold as certified circular cracker feedstock at 22.2%, exactly 1.50 times the market rate. That barrel realises roughly 3.4 times what the identical barrel earns as transport fuel.

Who are the major companies in the US Plastic to Fuel Market?

Brightmark, Alterra Energy, Nexus Circular, Encina, and Agilyx lead on annual operating processing capacity. The top five hold 43%, and the ranking changes when plants stop running.

Which country is growing fastest?

The United States at 14.8%, which is nominal since this report covers a single national market. Growth varies far more by output route and feedstock access than by geography.

Report Segmentation Architecture

The full report scope spans multiple orthogonal segmentation dimensions, with cross-tabulated demand data provided for each dimension pair. Coverage extends further to regional breakdowns, trend trajectories, and the competitive detail needed to support segment-level decision-making.

By Output Product And Destination

  • Pyrolysis Oil As Circular Cracker Feedstock
  • Pyrolysis Oil Upgraded To Transport Fuel
  • Gasification To Syngas And Chemicals
  • Fuel Gas And Onsite Energy Recovery
  • Waxes And Specialty Hydrocarbon Products
  • Char And Solid Residue Products

By End-Use Industry

  • Petrochemical And Polymer Production
  • Consumer Packaged Goods Brand Owners
  • Transport Fuel And Refining
  • Industrial Chemicals And Solvents
  • Municipal Waste Management Services

By Commercial Model

  • Owned And Operated Conversion Facilities
  • Technology Licensing To Third Party Developers
  • Long-Term Certified Offtake Contracts
  • Spot Fuel And Commodity Sales
  • Joint Development With Chemical Producers

By Region

  • North America
  • Western Europe
  • East Asia
  • Eastern Europe
  • South Asia and Pacific
  • Latin America
  • Middle East and Africa

Scope, Methodology, and Coverage

Every figure in this report is reproducible from documented input assumptions. The scope below maps the historical period, the forecast horizon, the segmentation dimensions, and the countries covered, alongside the underlying primary and qualitative methodology.
Historical Period
2020 to 2025
Forecast Period
2026 to 2036
Base Year
2025 (USD billions; MMA Primary Research Dataset, August 2026)
Market Definition
This market comprises conversion of post-consumer and post-industrial waste plastic into fuels, chemical feedstocks, and hydrocarbon products at facilities physically operating within the United States, measured at realised revenue from products sold rather than at announced or installed nameplate capacity. Output coverage spans pyrolysis oil sold as circular cracker feedstock under mass balance certification, pyrolysis oil upgraded to transport fuel, gasification to syngas and downstream chemicals, fuel gas and onsite energy recovery, waxes and specialty hydrocarbon products, and char and solid residue products. Mechanical recycling, waste collection and municipal sorting infrastructure sold independently, incineration with energy recovery, landfill gas, and any facility operating outside the United States fall outside scope.
Quantitative Units
USD billions (current prices); tonnes processed annually; realised price per tonne of output; operating against announced capacity
Segmentation Dimensions
By Output Product And Destination; By End-Use Industry; By Commercial Model; By Region
Regions Covered
North America, Western Europe, East Asia, Eastern Europe, South Asia and Pacific, Latin America, Middle East and Africa
Countries Covered
United States, with technology origin coverage across Canada, United Kingdom, Spain, Netherlands, Germany, Finland, Belgium, Italy, Japan, China, South Korea, India, Australia, Poland, Czechia, Brazil, Saudi Arabia, UAE, and additional origins relevant to this sector
Key Companies Profiled
Brightmark, Alterra Energy, Nexus Circular, Encina, Agilyx, Plastic Energy, BASF, ExxonMobil, Chevron Phillips Chemical, Dow, Eastman Chemical, LyondellBasell, Shell, Neste, PureCycle Technologies, Cyclyx, Braven Environmental, Freepoint Eco-Systems, Anellotech, Honeywell UOP
Quantitative Methodology
Primary survey, n=3,800 respondents, Q4 2025, six countries; demand-side model with trade association cross-validation
Qualitative Methodology
47 expert interviews, Q4 2025; applied to validate demand model assumptions, identify emerging dynamics, and assess competitive positioning
Report Format
PDF and XLSX data workbook (Word format preview document)
Publisher
Market Minds Advisory
Report Code
MMA-2026-ENE-553
Published
August 2026
Contact
sales@marketmindsadvisory.com | www.marketmindsadvisory.com

Purchase the full US Plastic to Fuel Market Report (2026 to 2036).

The full report sizes United States plastic to fuel conversion across six output routes, five end-use industries, five commercial models, and the domestic market in detail, with process technology origin mapped across licensing countries. Announced capacity is reconciled against capacity operating at commercial rates, since the gap between the two rather than any growth rate describes this sector honestly. Feedstock quality requirements are quantified by conversion route against achievable sorting yields. Competitive profiling covers twenty companies on annual operating processing capacity. State regulatory classification is tracked alongside its effect on permitting timelines.
Announced capacity reconciled against capacity operating commercially
Feedstock quality requirements quantified by conversion route
Certified against fuel route pricing compared across transactions
State regulatory classification tracked against permitting timelines
Shutdown root causes analysed across operating facility records
Preprocessing investment mapped against achieved plant availability

Built For The People Who Decide

From boardroom strategy to bench-side execution, this report is read cover-to-cover by leaders shaping the next decade of their industry, turning demand scenarios, market dynamics and valuation benchmarks into decisions.
CXOs/ Presidents/ VPs/ Managers
M&A and Corporate Development
Strategy Teams and R&D Heads
Procurement and Product Directors
Regulatory and Compliance Leaders
Investor Relations and Equity Analysts