Market Minds Advisory
US Food Premix Market

US Food Premix Market: Overage Science, Custom Formulation Service and Vitamin Supply Concentration, 2026 to 2036

Vitamins degrade on the shelf, so every premix carries an overage nobody sees on the label, and calculating that correctly across a food matrix is what a blender actually sells.

Lead Analyst

Lisa Gevelber

Published

September 2026

Make Smarter Decisions with Customized Research Insights

Request a free sample report and evaluate market opportunities, growth trends, and competitive dynamics relevant to your business needs.

2025 MARKET VALUE$1.2BMarket Size 2025
2036 FORECAST VALUE$2.4BBase Case , 2026 to 2036
CAGR 2026 TO 20366.4 %Bull 7.6% / Bear 5.2%
INCREMENTAL OPPORTUNITY$1.1BNet 10- year value creation
EXPANSION MULTIPLE1.86x2036 value over 2026 base
Strategic Levers
M&A Pipeline
Regional Outlook
Country Rankings
Competitive Intelligence
Segmental Deep-dive
Call-Us : 91 93563 13602

Executive Snapshot and Market Trajectory

Premix looks like an ingredient business and operates as a service business instead. Roughly 78% of American volume is blended to a customer specific formula, and what the food manufacturer is actually buying is formulation development, stability data and regulatory support rather than the vitamins themselves at all.
Clinical and medical nutrition premix grows at 9.6% annually, a full 1.50 times the market rate, pulled by enteral formulations, oncology nutrition and renal products where micronutrient specification is genuinely prescriptive and realised margins reflect that. North America holds 86% of total value within this United States scoped report, entirely outside the standard global band, because this report covers domestic American demand rather than any global market.
Concentration is high at 62% for the five largest suppliers, and the field divides cleanly between global nutrition houses with vitamin manufacturing behind them and the independent blenders selling formulation service alone. Vitamin raw material supply remains the persistent exposure across the whole industry, since several vitamins have effectively only one or two Chinese producers worldwide, and a single plant outage moves pricing right across the American premix industry within a few weeks.
Market Definition
The market covers custom and standard nutrient premixes blended and supplied within the United States for food, beverage and nutritional product fortification, spanning vitamins, minerals, amino acids, nucleotides and functional actives combined into a single dosed blend. It excludes individual vitamin and mineral raw materials sold unblended, dietary supplement finished products, animal feed premixes, flavour and colour systems, protein and fibre ingredients supplied without micronutrients, and contract manufacture of finished food.
Base Year Value
$1.2B in 2025 (MMA Primary Research Dataset, August 2026)
Forecast Period
2026 to 2036, eleven discrete annual values
CAGR
6.4% base case. Bull 7.6%. Bear 5.2%.
Fastest Growth Segment
Clinical and Medical Nutrition Premix: 9.6% CAGR
Fastest Growth Country
United States: 6.4% CAGR
Fastest Growth Region
South Asia and Pacific: 8.7% CAGR
Largest Region
North America: 86% of 2025 global value
Market Leaders
dsm-firmenich, Glanbia Nutritionals, Prinova Group, Watson, BASF. Source: MMA Primary Research Dataset, July 2026.
Primary Survey
n=3,800 procurement and R&D decision-makers, Q4 2025, six countries
Methodology
Demand-side build-up, cross-validated against public data, 47 expert interviews

US Food Premix Market Forecast Scenarios

us-food-premix-market-trends-size-forecast-scenario-1787313543852
The market compounded at 5.2% between 2020 and 2025, and supply disruption shaped it more than demand did. Vitamin raw material availability tightened sharply through 2021 and 2022 as Chinese production and shipping both faltered, and premix blenders spent that period managing allocation rather than winning new business. Clinical and sports nutrition demand grew steadily throughout regardless.
The 6.4% base case rests on three mechanisms. First, clinical and medical nutrition volumes grow with an ageing population and with hospital and home enteral feeding expanding together. Second, food manufacturers keep outsourcing micronutrient formulation, because maintaining internal capability for a small part of the recipe stopped making commercial sense years ago. Third, functional beverage and active nutrition reformulation cycles keep generating premix development work at genuinely healthy service margins.
The bull case at 7.6% assumes clinical nutrition growth holds while functional beverage launch activity stays elevated. The bear case at 5.2% turns on vitamin supply: renewed Chinese production disruption would push raw material costs through fixed annual food contracts again, compress blender margins as it did in 2022, and slow the reformulation activity that generates most of the development revenue in this business.

Why Overage Calculation Is The Product

The technical heart of this business is entirely invisible on any label. Vitamins degrade during processing and across shelf life at rates that depend on heat, moisture, oxygen, pH and what else is in the food, so a blender adds an overage sufficient to guarantee the declared claim on the final day of shelf life.
TOP FIVE CONCENTRATION62%Combined position of the five largest domestic premix blenders
AVERAGE SELLING PRICE$34 per kilogramTypical realised price across food and beverage premixes
CUSTOM FORMULATION SHARE78%Portion of volume blended to a customer specific formula
VITAMIN INPUT SHARE54% of COGSVitamin and mineral raw material share of blended cost
REFORMULATION CYCLE16 monthsMedian time from customer brief to commercial premix launch
TYPICAL OVERAGE ALLOWANCE18%Extra active added to guarantee label claim at expiry
Getting that number right is genuinely difficult and commercially decisive. Too little overage and the product fails label claim testing, a regulatory problem no manufacturer forgives. Too much and the customer pays for vitamin it never declares, which on a beverage costs real money. Typical allowances run around 18% but vary from single digits to well over half by vitamin and matrix, and the stability data sitting behind those numbers is what a premix house actually owns.
That explains why 78% of volume is custom and why switching supplier is harder than it looks from outside. A new blender must rebuild the overage model, generate its own stability data, and accept the label claim risk meanwhile. Food manufacturers therefore change premix supplier reluctantly and only at a reformulation, which is why blenders compete so hard to be present when a brief is drafted.
"Buyers think they are purchasing vitamins and they are actually purchasing somebody else's liability for a label claim three years out. The blenders who understand that price the stability work properly and never lose an account. The ones who think they are selling powder get benchmarked against a Chinese vitamin quote and cannot explain why they cost more."
Principal Analyst, Nutrition Ingredients and Fortification Practice · MMA Health

Market Trends

Food Manufacturers Exit Internal Micronutrient Capability

Maintaining in-house expertise for the smallest and most technically demanding part of a recipe stopped making sense for most American food companies some time ago, and the specialists who held that knowledge have largely retired without replacement. Roughly 78% of premix volume is now blended to custom specification with the blender doing the formulation work, against a substantially lower share a decade ago. That transfer moves both the technical work and the label claim liability outward, and it makes the resulting blender relationship considerably harder for a competitor to displace afterwards.
Market Impact: Serves 62 million older Americans

Clinical Nutrition Specification Tightens Beyond Food Practice

Enteral formulations, oncology support products and renal nutrition carry micronutrient specifications closer to pharmaceutical practice than to food fortification, with tighter tolerances, documented stability across the entire claim period and traceability requirements that ordinary food blending never once demanded. Blenders qualified to that standard serve demand growing at 9.6% annually while facing far fewer credible competitors for it. The qualification investment runs well into seven figures and takes about two years to complete, which is precisely why the credible competitor field there remains so narrow. Customers also reformulate these products rarely.
Market Impact: Represents 27% of premix volume

Market Opportunities and Growth Drivers

Ageing Population Expands Medical Nutrition Volume

Enteral feeding, oral nutritional supplements and specialised renal and diabetic formulations all grow with an ageing American population and with home care substituting for hospital stays. Those products carry prescriptive micronutrient profiles and are reformulated very infrequently, which makes the premix positions sitting behind them unusually durable once they have been won. Roughly 62 million Americans are now aged sixty or over, and clinical nutrition consumption rises steeply within that group. Reimbursement coverage for enteral nutrition also makes this demand considerably less price-elastic than any retail food category ever is.
Market Impact: Relies on 2 producers per vitamin

Functional Beverage Launches Generate Development Revenue

Energy drinks, protein beverages, hydration products and functional waters all launch and reformulate far more frequently than any shelf-stable food category, and every one of those cycles generates premix development work at service margins running well above the blend itself. Beverage matrices are also technically awkward, since vitamins in solution degrade considerably faster than in dry systems, and both clarity and taste constrain what can actually be added. Beverage fortification accounts for roughly 27% of premix volume and a considerably larger share of the development activity happening across the whole industry.
Market Impact: Compressed margins for 2 years

Market Restraints and Challenges

Vitamin Supply Concentration Creates Unhedgeable Exposure

Several vitamins including biotin, vitamin B12 and certain forms of vitamin E have effectively one or two producers worldwide, almost all of them Chinese, and no futures market exists for any of them. The root cause is that vitamin synthesis is capital intensive with modest global demand, so capacity consolidated decades ago. Commercially this means a single plant outage moves American premix costs within weeks and no financial instrument protects against it. Participants manage it through inventory depth, dual qualification where a second source exists, and through indexed contract terms where customers will accept them.
Market Impact: Outsources 78% of formulation work

Fixed Annual Contracts Absorb Raw Material Movement

American food manufacturers negotiate ingredient pricing annually and resist mid-term increases as a matter of policy, while vitamin raw materials move continuously on Chinese production and international freight conditions. The root cause here is procurement convention rather than any genuine market failure. Commercially this transferred the entire 2021 and 2022 vitamin cost movement onto blenders, compressing margins right across the industry for two consecutive years. Participants are addressing it through indexation clauses that larger customers now accept, and through explicit pass-through triggers written into contracts at specific defined movement thresholds.
Market Impact: Serves demand growing at 9.6%
3 additional market trends, 4 additional growth drivers, and 2 additional restraints and challenges are covered in the full report. Contact sales@marketmindsadvisory.com to access the complete intelligence.

Segment CAGR and Growth Architecture

Segmentation follows the application a premix is formulated for, meaning the food or nutritional product it will be dosed into. That single dimension determines the stability challenge, the regulatory framework, the tolerance the customer requires, how often the formulation changes, and consequently the service margin that a blender can realistically command for the work.
us-food-premix-market-trends-market-share-analysis-1787313544419

Clinical and Medical Nutrition Premix

The fastest segment at 9.6%, a full 1.50 times the market rate, covering premixes formulated for enteral feeding, oral nutritional supplements, oncology support, renal and diabetic nutrition and other comparable medical products. Specification practice within this segment sits considerably closer to pharmaceutical than to ordinary food work, with tighter tolerances, documented stability across the full claim period and traceability that ordinary fortification never required. Blenders qualified to that standard face far fewer credible competitors, and their customers reformulate rarely because clinical products carry regulatory filings sitting behind them. Qualification costs well into seven figures and takes about two years to complete, which keeps the credible competitor field genuinely narrow here.
CAGR 9.6%

Sports and Active Nutrition Premix

Growing at 8.3% annually on premixes formulated for sports nutrition, active lifestyle and performance products spanning protein powders, ready-to-drink recovery beverages, energy formats and pre-workout blends alike. Formulation churn in this segment is faster than anywhere else in the whole market, since brands refresh claims and actives continuously to stay competitive, and every refresh generates development work at service margins well above the blend value. Amino acids, botanical actives and specialised mineral forms all feature alongside the conventional vitamins here. The commercial risk is that brands in this category fail frequently, so a blender inevitably carries development cost against accounts that may never survive to reach commercial volume at all.
CAGR 8.3%
Full segment breakdown across 5 segments available in the complete report.

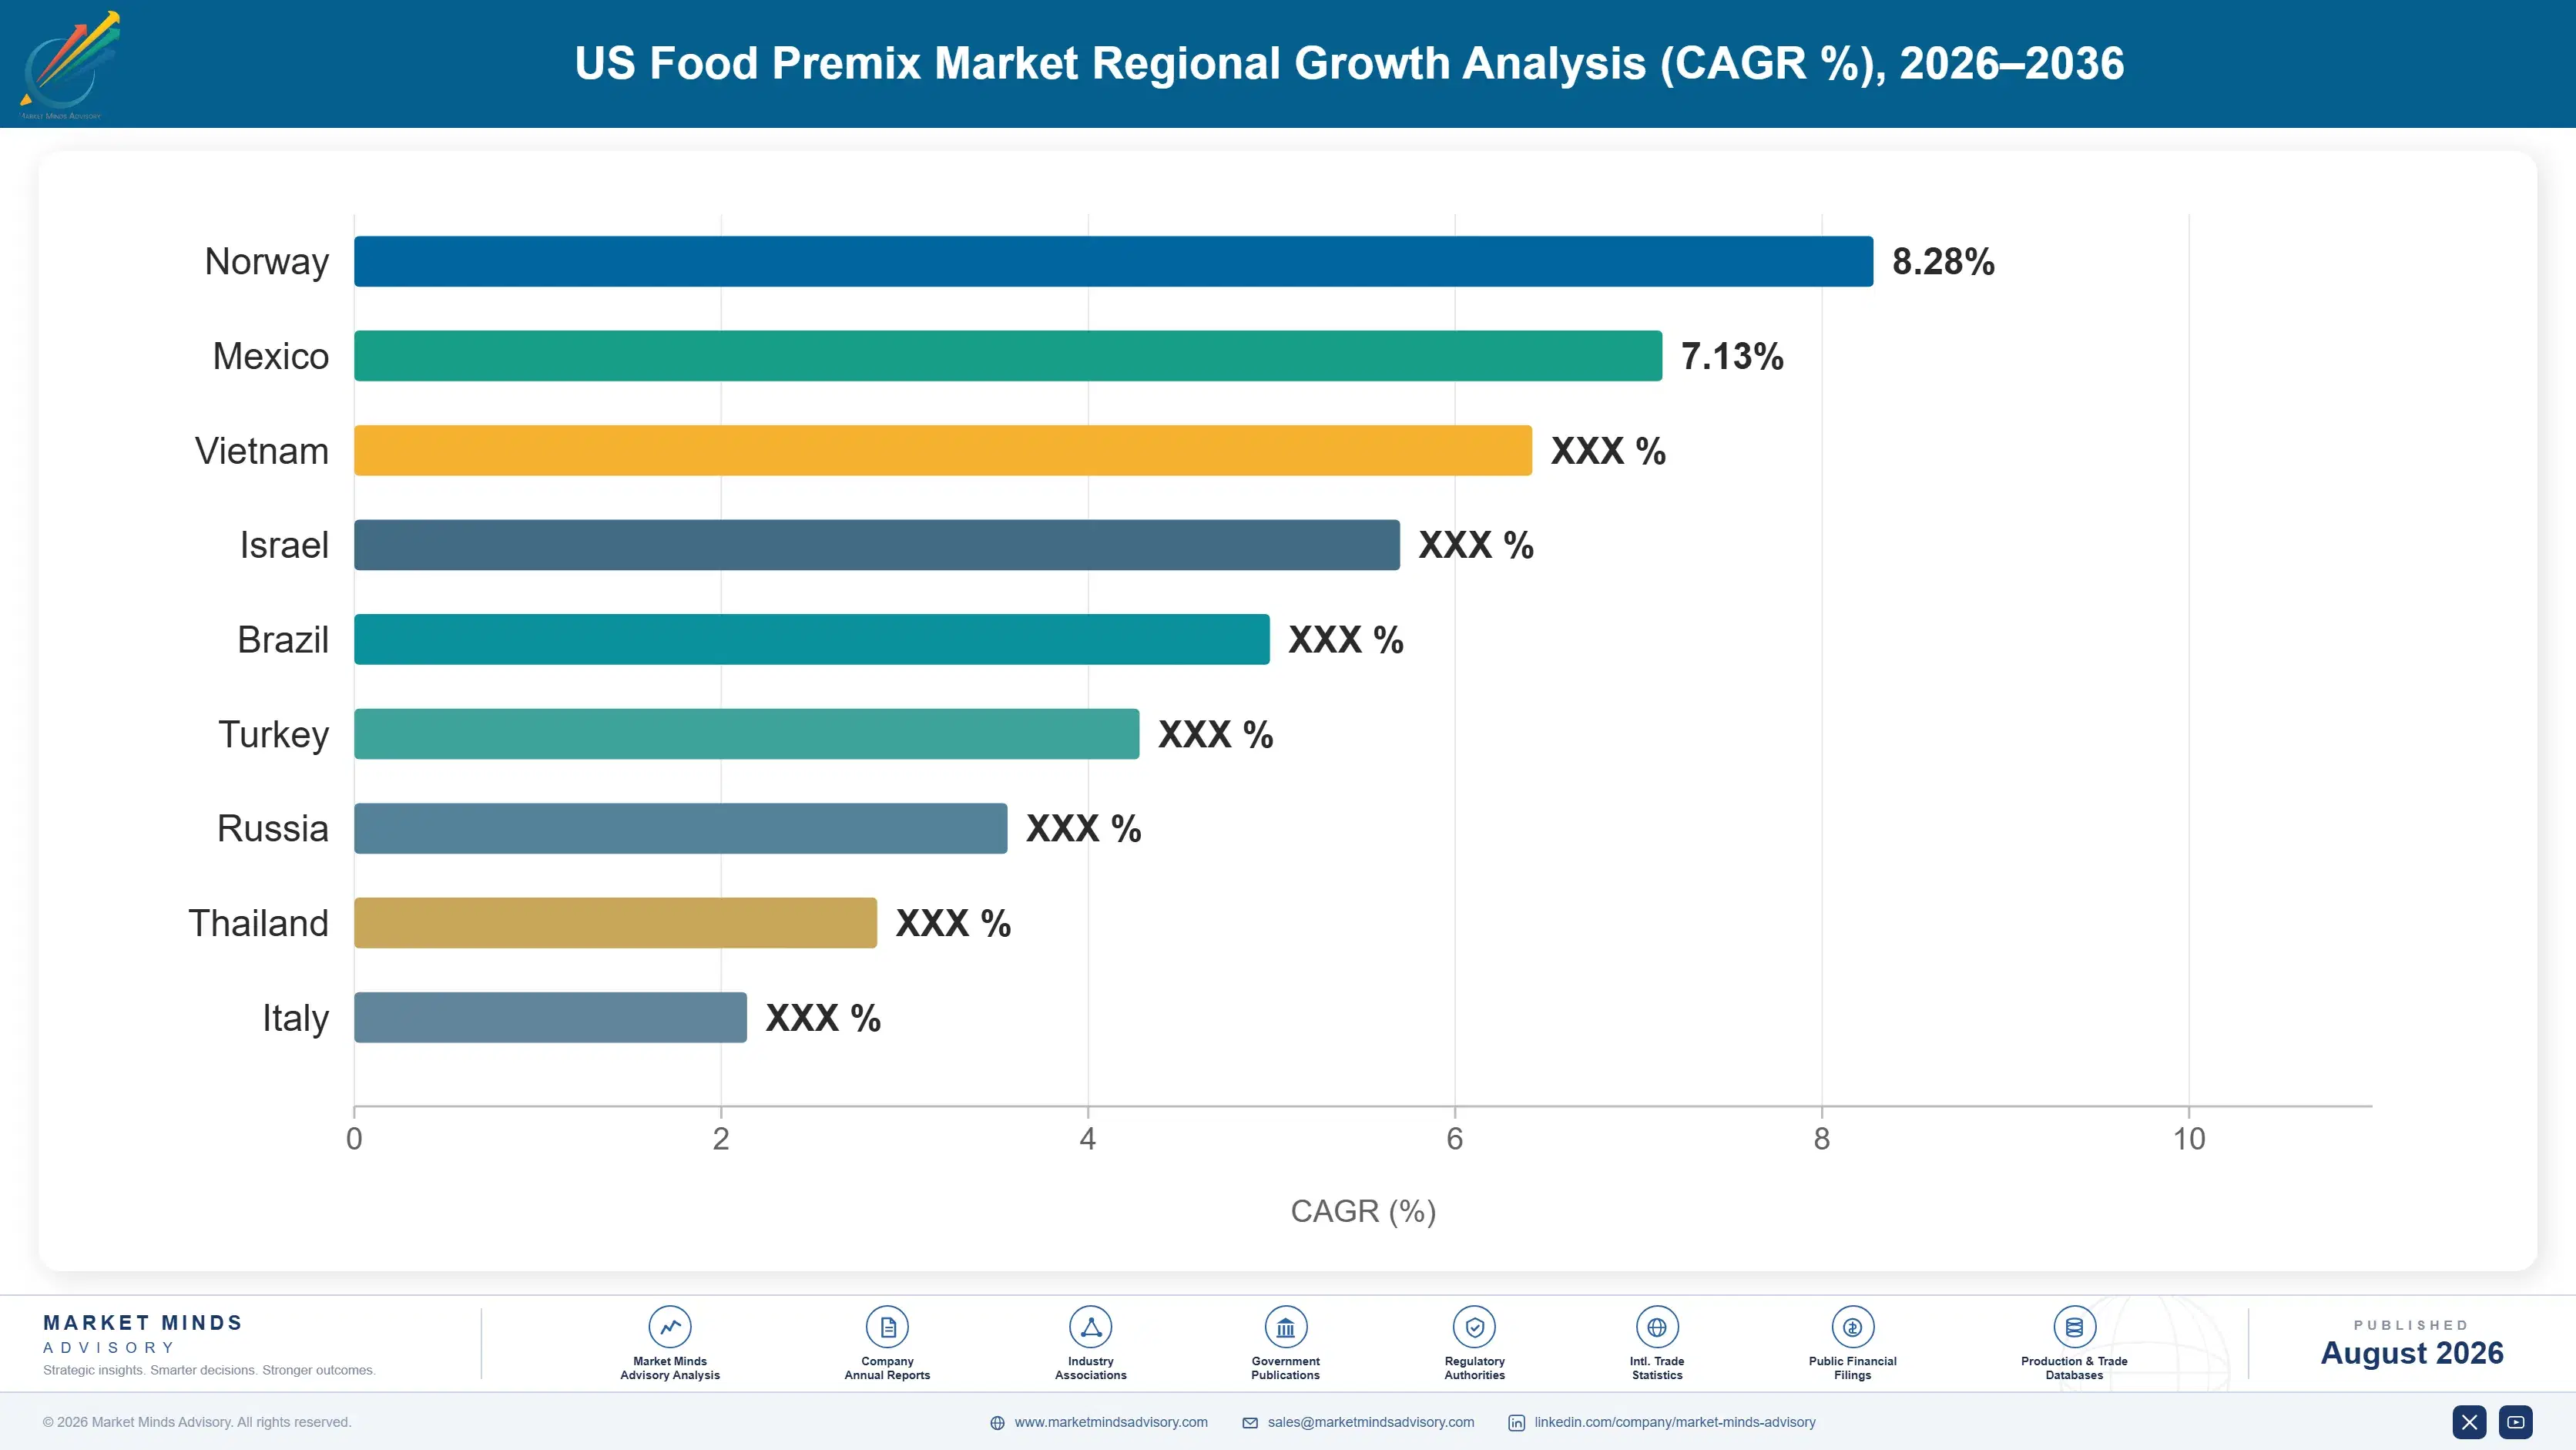
Regional Architecture and Country Demand Map

This report is scoped to the United States alone, so demand naturally sits almost entirely within the North America region. Remaining regional shares reflect only that portion of American premix demand which is met through blending, formulation or raw material entities based outside the country.

North America

Eighty-six percent of value within this United States scoped report. Note: this sits far outside the standard global band because the report covers domestic American demand alone rather than any world market. Blending capacity concentrates around food manufacturing clusters in the Midwest, the Northeast and California, with clinical nutrition work weighted toward sites carrying pharmaceutical-grade quality systems. Growth of 5.8% reflects clinical and sports nutrition expansion against slower staple fortification. Canadian and Mexican blending serves cross-border supply into American manufacturers, and several suppliers operate integrated North American footprints rather than purely domestic ones. Technical service headcount rather than blending capacity is the constraint on winning better work. Growth concentrates in clinical work.
Share: 86% | CAGR: 5.8% (2026 to 2036)

Western Europe

Five percent of value within this scoped report. Note: this sits far below the standard global band because the report covers American demand only, and the share represents European blenders and formulation houses supplying into the United States rather than European consumption. Swiss, Dutch and German nutrition companies hold meaningful positions in clinical and infant formula premix supplied to American manufacturers, generally on formulation expertise rather than cost. Growth of 4.8% tracks the underlying American market. Their position is strongest where pharmaceutical-grade documentation and long stability datasets matter more than delivered price. Formulation expertise rather than cost sustains their position. Infant formula premix is their strongest position, built on stability datasets accumulated over decades of supply.
Share: 5% | CAGR: 4.8% (2026 to 2036)
Regional intelligence for 5 additional markets available in the complete report: East Asia, South Asia and Pacific, Latin America, Middle East and Africa, Eastern Europe. Contact sales@marketmindsadvisory.com.
us-food-premix-market-trends-country-cagr-analysis-1787313544937

Where Blending Margin Actually Accumulates

Four commercial moves separate the blenders earning genuine service margins from those merely quoting powder against a published vitamin price. Each one depends on owning something that the customer simply cannot rebuild quickly for itself: accumulated stability data, clinical grade site qualification, presence at the reformulation brief, or vitamin inventory depth when supply tightens.

Price The Stability Data Rather Than The Powder

A premix quote benchmarked against a vitamin price loses every time, because the customer is comparing the wrong things. Blenders presenting overage modelling, matrix stability data and label claim liability as the deliverable realise 25% to 40% higher pricing than those quoting a blend cost with a margin on top. The data already exists in the business and costs nothing further to present. What it actually requires is a commercial team able to explain why the powder itself is not the product, which a great many blenders still cannot do convincingly.
Market Impact: Realises up to 40% higher realised

Qualify A Site To Clinical Nutrition Standards

Enteral, oncology and renal nutrition demand specification practice closer to pharmaceutical than food work, with documented stability across full claim periods and traceability ordinary fortification never required. Qualification costs between $3 million and $7 million and takes roughly two years to complete. In return the segment grows at 9.6%, customers reformulate rarely because regulatory filings sit behind their products, and the credible competitor set is small enough to count on one hand. Very few food-focused blenders have ever made that investment, which is exactly why it continues to pay so well today.
Market Impact: Enters a segment growing at 9.6% ea

Be Present When The Reformulation Brief Is Written

Food manufacturers change their premix supplier almost exclusively at reformulation, because switching at any other point means rebuilding overage models and accepting label claim risk mid-life. Blenders maintaining the technical relationships that put them in the room when a brief is being drafted win roughly 70% of the resulting business, against under 20% for those merely responding to a completed specification. Maintaining that presence costs technical service headcount rather than any capital at all, and it remains comfortably the single highest-return commercial investment available anywhere across this entire business today.
Market Impact: Wins roughly 70% of briefed reformu

Carry Inventory Depth On Concentrated Vitamins

Several vitamins have only one or two producers worldwide and no hedging instrument exists for any of them, so a single plant outage moves both cost and availability within weeks. Blenders holding six to nine months of inventory on the most concentrated items keep supplying when competitors cannot, and they win accounts permanently during disruptions rather than merely temporarily. The working capital cost is entirely real, typically between $4 million and $9 million for a mid-sized blender, and the events of 2021 demonstrated fairly conclusively that it is money well spent.
Market Impact: Holds up to 9 months of critical vi

Who Controls the Margin Pool

Concentration is high at 62% for the five largest blenders, measured on premix revenue across all participants supplying the United States, and the field divides between global nutrition houses with vitamin manufacturing behind them and independent blenders selling formulation service alone. dsm-firmenich leads on integrated vitamin supply combined with formulation depth, and the gap to the second tier is widest in raw material access rather than in blending capability.
Competition runs on three dimensions. Technical relationship depth decides most outcomes, since suppliers present when a reformulation brief is written win the great majority of that business. Clinical grade qualification decides access to the fastest growing demand. Price competition is fiercest in standard staple fortification, where formulations are established, overage models are well understood and buyers genuinely can compare quotes on a comparable basis.

Two pressures are building. Independent blenders without vitamin manufacturing behind them carry raw material exposure that integrated competitors partially absorb internally, and that gap widens whenever supply tightens. Meanwhile food manufacturers continue exiting internal micronutrient capability, which grows the addressable service pool for everyone. Rankings shift where clinical qualification meets raw material security, since holding one without the other leaves a blender either capped or exposed.
us-food-premix-market-trends-company-positioning-matrix-1787313545474

Competitive Moat and Risk Dimensions

DSM-FIRMENICH

Moat: Integrated vitamin manufacturing behind blending

Producing several vitamins internally rather than buying all of them gives the company cost visibility and supply security that independent blenders cannot match, particularly when concentrated raw materials tighten. Customers experiencing an outage remember which supplier kept delivering, and those relationships tend to persist long after the disruption itself has passed.
DSM-FIRMENICH

Risk: Scale complexity against nimble independents

Large integrated organisations respond more slowly to small custom development briefs than independent blenders built entirely around that work. Sports and functional beverage customers reformulate quickly and value responsiveness above supply security. Where the account is small and the brief is urgent, organisational scale becomes a genuine disadvantage rather than any kind of asset.
GLANBIA NUTRITIONALS

Moat: Deep sports nutrition formulation position

Long-established capability across sports and active nutrition, combined with protein and functional ingredient supply into the same customers, lets the company sell premix as part of a complete formulation solution. Brands developing a new product prefer one technical partner across the whole recipe rather than coordinating several suppliers themselves.
GLANBIA NUTRITIONALS

Risk: Exposure to brand failure rates

Sports and active nutrition brands fail frequently, and a blender carries development cost against accounts that may never reach commercial volume. Concentration in that category means absorbing more of those write-offs than a blender weighted toward clinical or staple fortification would. Growth there is genuine but the churn beneath it is considerably higher than headline figures suggest.

Players Tracked

Prominent Players

dsm-firmenich
Glanbia Nutritionals
Prinova Group
Watson
BASF

Other Key Players

SternVitamin
Vitablend
Barentz
Jubilant Ingrevia
Fenchem
Wright Enrichment
Nutrascience Labs
Bactolac Pharmaceutical
Vitaquest International
Farbest Brands
Balchem
Archer Daniels Midland
Ingredion
Kerry Group
Lonza

Recent Developments

FEBRUARY 2025

Prinova expands clinical nutrition premix capability domestically

Additional dedicated blending capacity qualified to clinical nutrition standards entered commercial service at a United States blending site during the year, targeting the enteral and oral nutritional supplement manufacturers whose specification, tolerance and documentation requirements ordinary food fortification blending operations simply cannot satisfy at all.
Signal: Clinical grade qualification is now where
JUNE 2025

Glanbia extends technical service into early formulation work

Technical service capability was extended in order to place formulation specialists alongside customers during early product development work rather than at the specification stage, reflecting how premix supplier decisions are in practice effectively settled at the very moment a reformulation brief is first being written.
Signal: Blenders are moving upstream into the brie
OCTOBER 2025

Watson secures dual-source qualification on concentrated vitamins

Second-source qualification work was completed across several of the vitamins that carry highly concentrated global supply positions today, reflecting how the supply disruptions of 2021 and 2022 had persuaded American blenders that inventory depth alone offered wholly insufficient protection against any single plant outage occurring.
Signal: Dual sourcing rather than inventory depth

What Drives Delivered Premix Cost

Vitamin and mineral raw materials account for roughly 54% of cost of goods, and within that a handful of concentrated items drive most of the volatility. Overage adds a further layer, since the blend contains more active than the label declares. Blending, packaging and quality control contribute 17%, technical service and formulation development a further 12%, and freight and warehousing the balance.
The 2021 and 2022 vitamin episode was the defining recent event. Chinese production interruptions and shipping disruption pushed several vitamins to multiples of their historical pricing, and American blenders holding annual food contracts absorbed nearly all of it before any recovery was negotiated. Company reporting across the nutrition ingredient sector documented substantial input cost pressure. Some blenders reported the worst two consecutive years of margin performance in their history.

The competitive disadvantage mechanism runs through integration and contract structure. A blender buying all its vitamins on the open market and selling on fixed annual terms carries the whole movement with no offset available. One with internal vitamin manufacture absorbs part of it, and indexed contract terms pass most of it through. Independent blenders on fixed pricing sat worst of all, and several exited or sold during that period.
us-food-premix-market-trends-cost-volatility-analysis-1787313545670

Write indexed pass-through triggers into food contracts

Annual fixed pricing set against continuously moving vitamin costs is where nearly all of the margin damage in this business originates. Blenders now negotiate explicit pass-through triggers at defined movement thresholds rather than seeking general indexation, which customers accept considerably more readily, because such a clause activates only when the movement is genuinely material.

Dual-qualify every concentrated vitamin where possible

Several vitamins have one or two producers worldwide, and inventory depth only delays the problem rather than solving it. Where a credible second source exists, qualifying it costs analytical and stability work in the low hundreds of thousands and it provides protection that no amount of stock cover genuinely delivers during any extended outage.

Model overage tightly rather than defensively

Excessive overage is an invisible cost the customer pays without ever knowing, and it makes a blender uncompetitive on quotes it ought to win comfortably. Investing in matrix-specific stability data to tighten those allowances from defensive to genuinely accurate typically removes three to six percentage points of raw material cost across an entire formulation portfolio.

Portfolio Architecture for Margin Defence

Margin architecture tracks how much liability the blender accepts. Standard staple fortification premixes run at gross margins in the high teens, because formulations are established, overage models are widely understood, and buyers can genuinely compare competing quotes on a properly comparable basis. Custom and clinical work earns several times that.
The volume-versus-premium tension is real because blending equipment needs throughput. Standard fortification volume fills the plant and funds the technical service capability that wins better work, yet it is precisely where quotes are comparable and margin thinnest. A blender serving only clinical and custom development work cannot load its equipment, while one relying on staple fortification finds itself benchmarked against a vitamin price it can never match. Both halves are necessary.

Value concentrates where the customer cannot verify the work itself. Clinical nutrition premix sits at the top, because the manufacturer is buying documented stability across a regulated claim period and accepting a supplier's judgement it cannot independently reproduce. Custom development work sits alongside on similar logic. Standard fortification sits at the other extreme, where the formulation is public knowledge and the discussion reduces to price per kilogram of active.

Volume / Commodity-Adjacent

Standard fortification premixes for flour, cereal, dairy and staple foods where formulations are established and overage practice is widely understood. Buyers compare competing quotes directly. This volume loads blending equipment and funds the technical capability that wins better work.
Gross Margin: 17-25%

Premium / Certified

Custom beverage, bakery and confectionery premixes developed to a specific matrix with blender-generated stability data. Formulation work and label claim liability support pricing well above standard fortification. Range reflects the spread across matrix difficulty and development intensity.
Gross Margin: 28-40%

Sustainability / Regulatory / Next-Generation

Clinical, medical and infant nutrition premixes blended under pharmaceutical-grade quality systems with full claim-period stability documentation. Site qualification and accepted regulatory liability, rather than the nutrients themselves, justify the pricing achieved here.
Gross Margin: 42-58%
us-food-premix-market-trends-portfolio-architecture-1787313546166

High-value Sub-segments and Strategic Watch-out

Clinical Nutrition Premix

High value on the fastest growth in the market at 9.6%, protected by site qualification costing millions and taking fully two years, which very few food-focused blenders have ever undertaken. Customers here reformulate very rarely, because regulatory filings sit behind every one of their finished products.
Gross Margin: 44-58%

Custom Beverage Development

Strong margins on solid and genuinely predictable growth, driven by frequent reformulation cycles which generate development revenue running well above the blend value itself. Beverage matrices degrade vitamins faster than dry systems, which makes the stability work genuinely difficult and therefore correspondingly valuable to the customer.
Gross Margin: 32-42%

Standard Staple Fortification

The throughput that loads blending equipment and funds the technical service capability behind everything else, earning gross margins in the high teens on formulations that everybody in the industry understands. Buyers compare competing quotes directly here, and the whole discussion reduces to price per kilogram of active.
Gross Margin: 17-25%

Sports Nutrition Development

The strategic watch-out sitting squarely inside this portfolio. Reformulation churn in this segment generates genuinely excellent development revenue, but the brands operating in this category fail frequently indeed, and blenders end up carrying the development cost against accounts that may never reach commercial volume at all.
Gross Margin: 30-40%

How This Demand Actually Repeats

Premix revenue behaves as an annuity attached to a formulation rather than to a purchasing relationship. Once a blend is designed into a product, it ships against every production run for years, because changing supplier means rebuilding the overage model, generating new stability data and accepting label claim risk in the interim.
Stickiness varies sharply by application. Clinical and infant nutrition are the tightest, since regulatory filings reference the formulation and any change triggers documentation work manufacturers avoid. Custom beverage and food premixes sit close behind, held by matrix-specific stability data the incumbent owns. Standard staple fortification is moderately sticky, with buyers reviewing quotes annually. Commodity single-nutrient supply is barely sticky at all, and blenders competing there have effectively become vitamin distributors rather than formulators.

Buyer profiles have changed considerably. Purchasing once sat with food technologists who understood micronutrient behaviour themselves and specified accordingly. It now frequently involves procurement leads, regulatory affairs and quality functions who have inherited responsibility without the underlying expertise. Blenders whose commercial approach assumes technical fluency on the other side of the table increasingly find themselves explaining overage from first principles, which is an opportunity rather than a frustration.
us-food-premix-market-trends-end-use-penetration-index-1787313546651

Where To Place Capital

These are among the four positions where our research anticipates prominent divergence between winners and laggards over the coming forecast period. Each is grounded in the demand model, the regulatory perimeter, and the announced capacity pipeline.
01 / COMMERCIAL FRAMING DISCIPLINE

Quote the liability, never the powder

A premix benchmarked against a vitamin price loses every time, because the customer is comparing the wrong two things entirely. Blenders presenting overage modelling, matrix stability data and label claim liability as the deliverable realise 25% to 40% higher pricing than those quoting a blend cost with margin added on top. The data already exists inside the business at no further cost, and what it needs is a commercial team able to explain why the powder is not actually the product.
02 / CLINICAL GRADE QUALIFICATION

Two years of work buys a decade of position

Enteral, oncology and renal nutrition demand specification practice closer to pharmaceutical than food work, and qualification costs $3 million to $7 million across roughly two years. In return the segment grows at 9.6%, customers reformulate rarely because regulatory filings sit behind their products, and the credible competitor set is small enough to count on one hand. Very few food-focused blenders have made that investment, which is precisely why the investment continues to pay so well for those who make it.
03 / UPSTREAM RELATIONSHIP TIMING

Supplier selection happens at the brief

Food manufacturers change premix supplier almost exclusively at reformulation, because switching at any other point means rebuilding overage models and carrying label claim risk mid-life. Blenders who are present when a brief is drafted win roughly 70% of the resulting business, against under 20% for those merely responding to a completed specification afterwards. Maintaining that presence costs technical service headcount rather than any capital at all, which makes it comfortably the highest-return commercial spend available anywhere in this business today.
04 / RAW MATERIAL SECURITY

Dual-source before the next outage arrives

Several vitamins have one or two producers worldwide with no hedging instrument available anywhere, so a single plant outage moves cost and availability within weeks. Inventory depth of six to nine months costs between $4 million and $9 million in working capital and merely delays the problem; dual qualification where a second source exists actually solves it for a few hundred thousand in analytical work. The disruption of 2021 showed fairly clearly which blenders had done which of those two things.

Engagement Snapshot From the Field

A live engagement with an industry participant carrying material or product regulatory and market exposure ahead of a defining policy shift, showing how our research translates into a defensible multi-year portfolio strategy.
MARKET MINDS ADVISORY · CLIENT ENGAGEMENT SUMMARY
US Food Premix Producer Strategic Portfolio Review and Transition Roadmap 2026·Investment Scenario on US Food Premix Exposure Evaluation 2025-26
CLIENT PROFILE
An independent United States premix blender with annual revenue near $88 million (client-reported, unverified by MMA), operating two blending sites serving bakery, cereal, dairy and beverage manufacturers. Roughly 71% of volume was standard fortification quoted against competing bids, no clinical grade qualification existed at either site, and all vitamins were purchased on the open market.
STRATEGIC CHALLENGE
Gross margin had compressed for three consecutive years as customers benchmarked quotes against vitamin pricing, and the 2022 raw material movement had been absorbed almost entirely under fixed annual contracts. Management wanted to know whether to pursue clinical qualification, rebuild commercial positioning, or invest in raw material security, and could fund roughly one.
MMA APPROACH
MMA analysed win rates by point of engagement across the client's recent tenders, quantified the pricing gap between quotes framed on blend cost and those framed on stability liability, and sized the clinical nutrition opportunity against realistic qualification timelines. Findings were tested against 47 expert interviews covering food manufacturer premix purchasing, clinical nutrition specification and vitamin supply concentration.
KEY FINDINGS
  1. The client won 64% of opportunities where it had been involved before the specification was written, against 17% where it responded to a completed brief.
  2. Quotes presenting stability data and label claim liability realised 31% higher pricing than blend-cost quotes for comparable products (client-reported, unverified by MMA).
  3. Overage allowances were set defensively rather than from matrix data, adding an estimated four percentage points of unnecessary raw material cost across the portfolio.
  4. Clinical qualification was viable at roughly $4.1 million but would take two years, during which the commercial and overage improvements would deliver more than the investment cost.
CLIENT PROFILE
An independent United States premix blender with annual revenue near $88 million (client-reported, unverified by MMA), operating two blending sites serving bakery, cereal, dairy and beverage manufacturers. Roughly 71% of volume was standard fortification quoted against competing bids, no clinical grade qualification existed at either site, and all vitamins were purchased on the open market.
STRATEGIC CHALLENGE
Gross margin had compressed for three consecutive years as customers benchmarked quotes against vitamin pricing, and the 2022 raw material movement had been absorbed almost entirely under fixed annual contracts. Management wanted to know whether to pursue clinical qualification, rebuild commercial positioning, or invest in raw material security, and could fund roughly one.
MMA APPROACH
MMA analysed win rates by point of engagement across the client's recent tenders, quantified the pricing gap between quotes framed on blend cost and those framed on stability liability, and sized the clinical nutrition opportunity against realistic qualification timelines. Findings were tested against 47 expert interviews covering food manufacturer premix purchasing, clinical nutrition specification and vitamin supply concentration.
KEY FINDINGS
  1. The client won 64% of opportunities where it had been involved before the specification was written, against 17% where it responded to a completed brief.
  2. Quotes presenting stability data and label claim liability realised 31% higher pricing than blend-cost quotes for comparable products (client-reported, unverified by MMA).
  3. Overage allowances were set defensively rather than from matrix data, adding an estimated four percentage points of unnecessary raw material cost across the portfolio.
  4. Clinical qualification was viable at roughly $4.1 million but would take two years, during which the commercial and overage improvements would deliver more than the investment cost.
RECOMMENDED STRATEGY
Phase 1: Phase one: retrain commercial teams to quote stability liability rather than blend cost, since it costs nothing and addresses the largest measured pricing gap. Phase 2: Phase two: invest in matrix-specific stability data to tighten overage from defensive to accurate, recovering raw material cost the customer was paying invisibly. Phase 3: Phase three: begin clinical grade site qualification, funded from the margin recovered in the first two phases rather than from new capital.
OUTCOME
The client changed its commercial framing within four months and reported realised pricing improving roughly 19% on newly quoted business (client-reported, unverified by MMA). Overage tightening removed a further three points of raw material cost, and clinical qualification began the following year funded entirely from those recovered margins.

Frequently Asked Questions

Foundational context covering the market sizes, CAGR, scope, country, region and competition that inform every finding below. This section is provided to cover basics and most often pre-purchase conversations, answered from the MMA Primary Research Dataset.

What is the current size of the US Food Premix Market?

The market was worth $1.2 billion in 2025 and is forecast to reach $1.28 billion in 2026. Custom formulations account for 78% of that volume rather than standard blends.

How large will the US Food Premix Market be by 2036?

MMA forecasts $2.38 billion by 2036, an expansion multiple of 1.86 times the 2026 base. That represents $1.10 billion of incremental value across the forecast period.

What is the CAGR for the US Food Premix Market 2026 to 2036?

The base case compound annual growth rate is 6.4%, with a bull case of 7.6% and a bear case of 5.2%. Historical growth from 2020 to 2025 also ran at 5.2%.

Which segment is growing fastest?

Clinical and medical nutrition premix at 9.6%, a full 1.50 times the market rate. Enteral, oncology and renal formulations drive that demand as the population ages.

Who are the major companies in the US Food Premix Market?

dsm-firmenich, Glanbia Nutritionals, Prinova Group, Watson and BASF lead with 62% between them. Fifteen further blenders and ingredient houses hold meaningful positions across the American market.

Which country is growing fastest?

The report covers the United States alone, growing at 6.4% overall. Within it, clinical nutrition and functional beverage applications expand considerably faster than staple fortification.

Report Segmentation Architecture

The full report scope spans multiple orthogonal segmentation dimensions, with cross-tabulated demand data provided for each dimension pair. Coverage extends further to regional breakdowns, trend trajectories, and the competitive detail needed to support segment-level decision-making.

By Premix Application

  • Clinical and Medical Nutrition Premix
  • Sports and Active Nutrition Premix
  • Infant Formula Premix
  • Beverage Fortification Premix
  • Cereal, Bakery and Staple Fortification Premix

By End-Use Industry

  • Dairy and Chilled Products
  • Bakery, Cereal and Snacks
  • Beverages and Functional Drinks
  • Infant and Toddler Nutrition
  • Clinical and Medical Nutrition
  • Sports and Supplement Manufacture

By Commercial Dimension

  • Custom Formulation Development Supply
  • Standard Catalogue Premix Supply
  • Contract Blending and Toll Manufacture
  • Integrated Ingredient and Premix Packages
  • Distributor and Ingredient Broker Channel

By Region

  • North America
  • Western Europe
  • East Asia
  • South Asia and Pacific
  • Latin America
  • Middle East and Africa
  • Eastern Europe

Scope, Methodology, and Coverage

Every figure in this report is reproducible from documented input assumptions. The scope below maps the historical period, the forecast horizon, the segmentation dimensions, and the countries covered, alongside the underlying primary and qualitative methodology.
Historical Period
2020 to 2025
Forecast Period
2026 to 2036
Base Year
2025 (USD billions; MMA Primary Research Dataset, August 2026)
Market Definition
This report covers custom and standard nutrient premixes blended and supplied within the United States for food, beverage and nutritional product fortification, combining vitamins, minerals, amino acids, nucleotides and functional actives into a single dosed blend. Coverage includes the formulation development, overage modelling, stability testing and regulatory support supplied alongside the blend. Individual vitamin and mineral raw materials sold unblended, dietary supplement finished products, animal feed premixes, flavour and colour systems, protein and fibre ingredients supplied without micronutrients, and contract manufacture of finished food are excluded from scope.
Quantitative Units
USD billions at blender realised prices within the United States; volume in thousand tonnes of blended premix; gross margin percentages by portfolio tier.
Segmentation Dimensions
Premix application, end-use industry, commercial dimension, region.
Regions Covered
North America, Western Europe, East Asia, South Asia and Pacific, Latin America, Middle East and Africa, Eastern Europe
Countries Covered
United States in full, with supplier-origin coverage of Canada, Mexico, Switzerland, Germany, the Netherlands, China, Japan, India, Israel, Poland and Hungary.
Key Companies Profiled
dsm-firmenich, Glanbia Nutritionals, Prinova Group, Watson, BASF, SternVitamin, Balchem, Farbest Brands, Vitaquest International, Jubilant Ingrevia, and ten further blenders.
Quantitative Methodology
Primary survey, n=3,800 respondents, Q4 2025, six countries; demand-side model with trade association cross-validation
Qualitative Methodology
47 expert interviews, Q4 2025; applied to validate demand model assumptions, identify emerging dynamics, and assess competitive positioning
Report Format
PDF and XLSX data workbook (Word format preview document)
Publisher
Market Minds Advisory
Report Code
MMA-2026-HLT-851
Published
August 2026
Contact
sales@marketmindsadvisory.com | www.marketmindsadvisory.com

Purchase the full US Food Premix Market Report (2026 to 2036).

The full report sets out ten-year forecasts for the United States food premix market by application, end-use industry and commercial model. It quantifies win rates by point of customer engagement, showing how decisively supplier selection is settled at the reformulation brief rather than at tender. Competitive assessment covers twenty blenders on a consistent revenue basis, mapping clinical grade qualification and vitamin supply security separately from blending capacity. Overage practice is benchmarked by matrix and vitamin, isolating where defensive allowances are adding avoidable cost. Findings draw on a quantitative survey of 3,800 respondents across six countries and 47 expert interviews conducted during the fourth quarter of 2025.
Ten-year United States forecasts by premix application
Win rates quantified by point of customer engagement
Overage practice benchmarked by food matrix and vitamin
Twenty-blender assessment on consistent revenue basis
Vitamin supply concentration mapped by nutrient and origin
Margin architecture across three commercial portfolio tiers

Built For The People Who Decide

From boardroom strategy to bench-side execution, this report is read cover-to-cover by leaders shaping the next decade of their industry, turning demand scenarios, market dynamics and valuation benchmarks into decisions.
CXOs/ Presidents/ VPs/ Managers
M&A and Corporate Development
Strategy Teams and R&D Heads
Procurement and Product Directors
Regulatory and Compliance Leaders
Investor Relations and Equity Analysts