Market Minds Advisory
United States Fintech Market

United States Fintech Market: Embedded Finance and the Banking-as-a-Service Shift

US fintech sits between a digital payments business built on consumer app adoption, and an embedded finance wave reshaping how non-financial platforms specify banking capabilities across commerce and software products.

Lead Analyst

Published

September 2026

Make Smarter Decisions with Customized Research Insights

Request a free sample report and evaluate market opportunities, growth trends, and competitive dynamics relevant to your business needs.

2025 MARKET VALUE$42.0BMarket Size 2025
2036 FORECAST VALUE$191.7BBase Case , 2026 to 2036
CAGR 2026 TO 203614.8 %Bull 16.0% / Bear 13.5%
INCREMENTAL OPPORTUNITY$143.5BNet 10- year value creation
EXPANSION MULTIPLE3.98x2036 value over 2026 base
Strategic Levers
M&A Pipeline
Regional Outlook
Country Rankings
Competitive Intelligence
Segmental Deep-dive
Call-Us : 91 93563 13602

Executive Snapshot and Market Trajectory

US fintech built its commercial base on digital payments and money transfer platforms sold largely through consumer app adoption, and that base still anchors most transaction volume today. Embedded finance and banking-as-a-service now grow fastest of all, as platforms pull investment toward new capabilities overall.
Embedded finance and banking-as-a-service are growing fastest as software platforms seek documented API reliability that standard payment apps cannot offer without dedicated infrastructure investment. This report is scoped to the United States, and North America anchors demand given the country's own regional classification, while Western European fintech markets follow closely on rising embedded finance adoption. That supply split reflects platform investment culture as much as raw transaction volume.
Twenty companies compete across a market split between commodity payment processing sold largely through established merchant distribution, and embedded finance and regtech platforms earning meaningfully more on API reliability documentation and compliance automation depth. Regulatory licensing and fraud risk volatility genuinely complicates margin planning in ways long-term platform contracts cannot always fully absorb, and that exposure keeps widening for smaller regional providers over time. That exposure only keeps widening steadily over time.
Market Definition
The market covers fintech products including digital payments, digital lending, wealth management, insurtech, regtech, and embedded finance and banking-as-a-service platforms serving the United States. Traditional bank branch banking and unrelated cryptocurrency mining products are excluded from this scope.
Base Year Value
$42.0B in 2025 (MMA Primary Research Dataset, August 2026)
Forecast Period
2026 to 2036, eleven discrete annual values
CAGR
14.8% base case. Bull 16.0%. Bear 13.5%.
Fastest Growth Segment
Embedded Finance and Banking-as-a-Service: 20.2% CAGR
Fastest Growth Country
India: 16.8% CAGR
Fastest Growth Region
South Asia and Pacific: 16.8% CAGR
Largest Region
North America: 68% of 2025 global value
Market Leaders
PayPal Holdings Inc, Block Inc, Stripe Inc, SoFi Technologies Inc, Plaid Inc. Source: MMA Analysis based on company annual reports.
Primary Survey
n=3,800 procurement and R&D decision-makers, Q4 2025, six countries
Methodology
Demand-side build-up, cross-validated against public data, 47 expert interviews

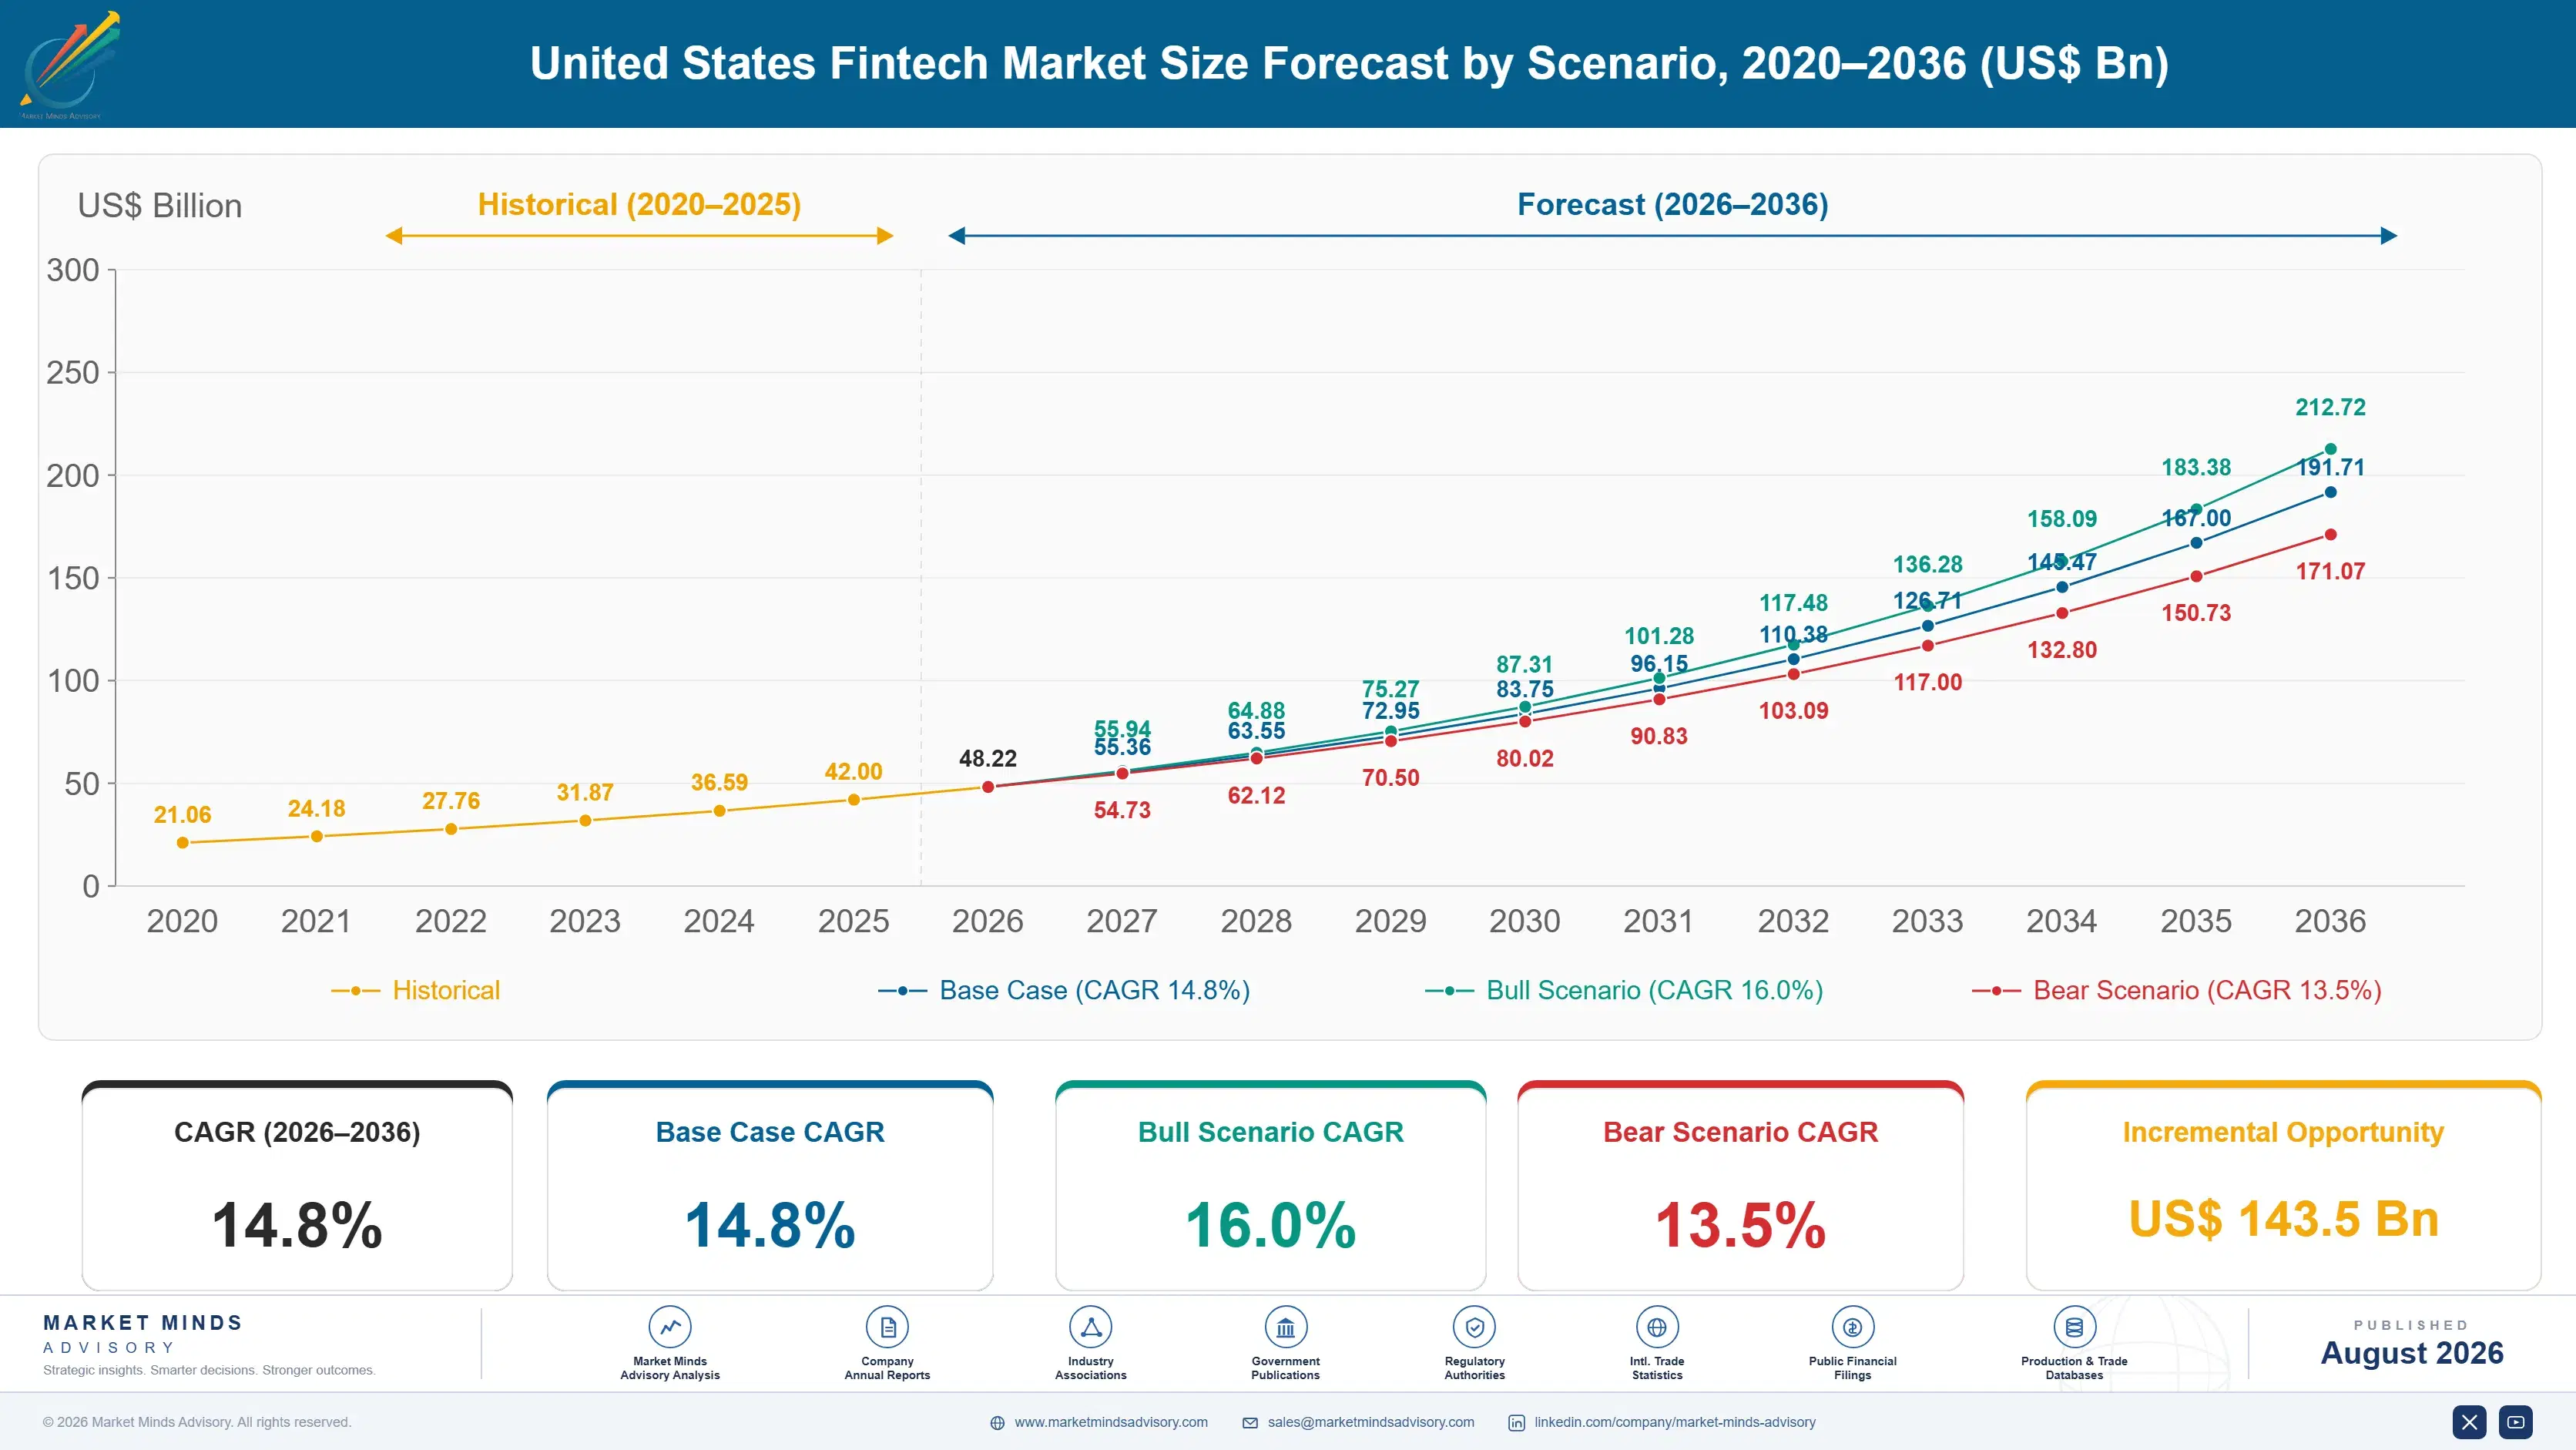
United States Fintech Market Forecast Scenarios

us-fintech-market-size-forecast-scenario-1787913312102
Between 2020 and 2025 the market grew near 12.8% a year, propelled initially by pandemic-driven digital adoption before embedded finance demand began contributing meaningfully toward the end of the historical period, a shift that strengthened noticeably once API infrastructure reliability data justified broader platform integration. That shift now shapes procurement priorities at nearly every major platform.
The base case carries the market to 14.8% CAGR on three mechanisms: rising demand for frictionless digital payment experiences expanding baseline transaction volume, growing SMB adoption of digital banking and lending platforms sustaining lending volume, and embedded finance technology scaling to meet platform integration requirements. None of these three mechanisms depends on any single platform launch alone, which is what makes the base case durable across funding cycles. Compliance timelines rarely slip once regulatory authorities set enforcement dates.
The bull case at 16.0% assumes faster embedded finance adoption across major software platforms than currently modelled. The bear case at 13.5% assumes continued regulatory licensing restriction outweighs platform growth by a wider margin than currently anticipated, leaving overall category volume flatter than the base case projects. Regulatory-constrained smaller providers remain the key swing factor between these two scenarios.

Digital Payments Meet the Embedded Finance Pull

Three forces shape this market at once, and each moves on its own separate timeline. Digital payments volume tracks consumer app adoption cycles set months in advance, embedded finance demand tracks software platform integration largely independent of those adoption cycles, and regtech demand tracks regulatory compliance requirements disconnected from either commercial driver entirely.
DIGITAL PAYMENTS VOLUME SHARE44%share of volume still using standard digital payment processing
AVERAGE TAKE RATE2.4%blended average transaction take rate across platform categories
TOP PLATFORM SHARE11%largest single platform share of category transaction revenue
API UPTIME RANGE99.5 to 99.99%typical infrastructure reliability range across all platform generations
COMPLIANCE COST SHARE34%share of operating cost from regulatory licensing and fraud prevention
HHI CONCENTRATION320a highly fragmented category across many fintech platforms
Commercially, the market behaves like a specialty infrastructure reliability business wearing a consumer payments label. API documentation genuinely matters, since embedded finance claims depend on documented uptime and reliability data that software platforms scrutinise closely during integration qualification, but adoption still tracks delivered cost and developer experience economics more than pure payment chemistry alone. A platform with proven reliability documentation competes on developer trust long before it competes on price.
Over the next decade, embedded finance and regtech demand will decide winners more than digital payments volume alone, since payments demand already tracks a well-established, consumer-constrained adoption cycle. Companies investing early in API infrastructure research will capture growth that payments-only platforms cannot easily replicate without significant engineering investment. Later movers will find catching up considerably more expensive once that infrastructure gap compounds across the industry.
"Consumer app adoption got digital payments this far on convenience alone. Embedded finance is winning because software platforms finally have the API reliability data to justify full banking integration."
Director, Financial Technology and Digital Banking Practice · MMA Financial Services and Insurance Practice · August 2026

Market Trends

Embedded Finance Reshapes Platform Integration Standards

Software platforms increasingly specify embedded finance and banking-as-a-service infrastructure delivering documented API reliability rather than standard standalone payment integration, a certification capability traditional payment apps were never designed to deliver without dedicated infrastructure investment. This trend reaches an entirely different buyer base than traditional consumer payment apps, spanning platform-focused software companies investing at a pace standalone payment volume rarely matches. Providers with dedicated infrastructure research capability are capturing this demand fastest, since achieving reliable API uptime requires meaningful engineering investment most payments-focused providers have not committed to. This shift is fundamentally changing how established fintech providers structure long-term platform contracts.
Market Impact: Adds USD 4.2 billion by 2029
Regtech Automation Gains Compliance Officer Preference

Financial institutions increasingly specify regtech and compliance automation platforms offering documented regulatory reporting accuracy over standard manual compliance processes, driven by research demonstrating reduced regulatory penalty exposure across licensing categories. Providers investing in regtech automation capacity are capturing this specification shift specifically, since standard manual processes increasingly fail to meet tightening regulatory reporting targets major institutions now require. This shift is gradually changing how fintech providers structure long-term compliance distribution agreements. This shift is fundamentally changing how established fintech providers structure long-term institutional contracts. This trend shows no sign of reversing.
Market Impact: Adds USD 2.9 billion by 2030

Market Opportunities and Growth Drivers

Rising Digital Payment Experience Demand Expands Baseline Volume

Consumer and business demand for frictionless digital payment experiences continues expanding as contactless and mobile-first transaction preferences drive increased platform adoption across both retail and commercial channels. Businesses routinely integrate digital payment infrastructure as a standard operational practice given documented impact on conversion rates, checkout speed, and customer retention across every major commerce category. This demand base provides a stable multi-year foundation even as broader consumer spending fluctuates with disposable income conditions and economic cycles. Merchants treat this baseline demand as effectively non-discretionary across annual planning cycles. Demand should stay durable across most planning cycles.
Market Impact: Caps national scaling at 38 states

Growing SMB Digital Banking Adoption Sustains Volume Growth

Small and medium business interest in digital banking and lending platforms continues at elevated levels as traditional bank branch access constraints drive increased fintech platform adoption across most established markets. This demand creates a reasonably predictable pipeline that providers can plan capacity investment around regardless of broader consumer payment channel conditions, since SMB digital banking adoption has shown durable persistence rather than reverting to prior branch-only patterns. Providers with established SMB distribution relationships are positioned to capture this demand ahead of newer entrants still building lending infrastructure. This trend shows no sign of reversing.
Market Impact: Adds 15 to 22% fraud exposure

Market Restraints and Challenges

Regulatory Licensing Complexity Limits Platform Scaling

Fintech providers continue navigating fragmented state money transmitter licensing requirements when scaling payment and lending platforms nationally, particularly across jurisdictions requiring separate licensing and capital reserve compliance for each state of operation. The root cause is genuinely inconsistent state-level regulatory frameworks that treat money transmission and lending licensing very differently across jurisdictions. Providers are responding by developing dedicated regulatory affairs teams and by building multi-state licensing compliance documentation that navigates jurisdiction-specific requirements across their operating footprint. Larger providers increasingly offer expedited licensing partnerships as a standard commercial approach. This remains an active area of ongoing regulatory engagement.
Market Impact: Adds USD 6.8 billion in demand

Fraud Risk Exposure Complexity Limits Platform Trust

Fintech providers continue facing escalating fraud risk exposure as sophisticated account takeover and synthetic identity fraud schemes target digital payment and lending platforms at scale. The root cause is genuine adversarial escalation in fraud technique sophistication that traditional fraud detection systems were not originally designed to counter at comparable transaction volumes. Providers are responding by investing in machine learning-based fraud detection infrastructure and by building shared fraud intelligence networks that reduce exposure across the broader platform network. Larger providers are increasingly securing multi-year fraud intelligence partnerships to reduce this exposure.
Market Impact: Lifts regtech-platform demand 15%
3 additional market trends, 4 additional growth drivers, and 2 additional restraints and challenges are covered in the full report. Contact sales@marketmindsadvisory.com to access the complete intelligence.

Segment CAGR and Growth Architecture

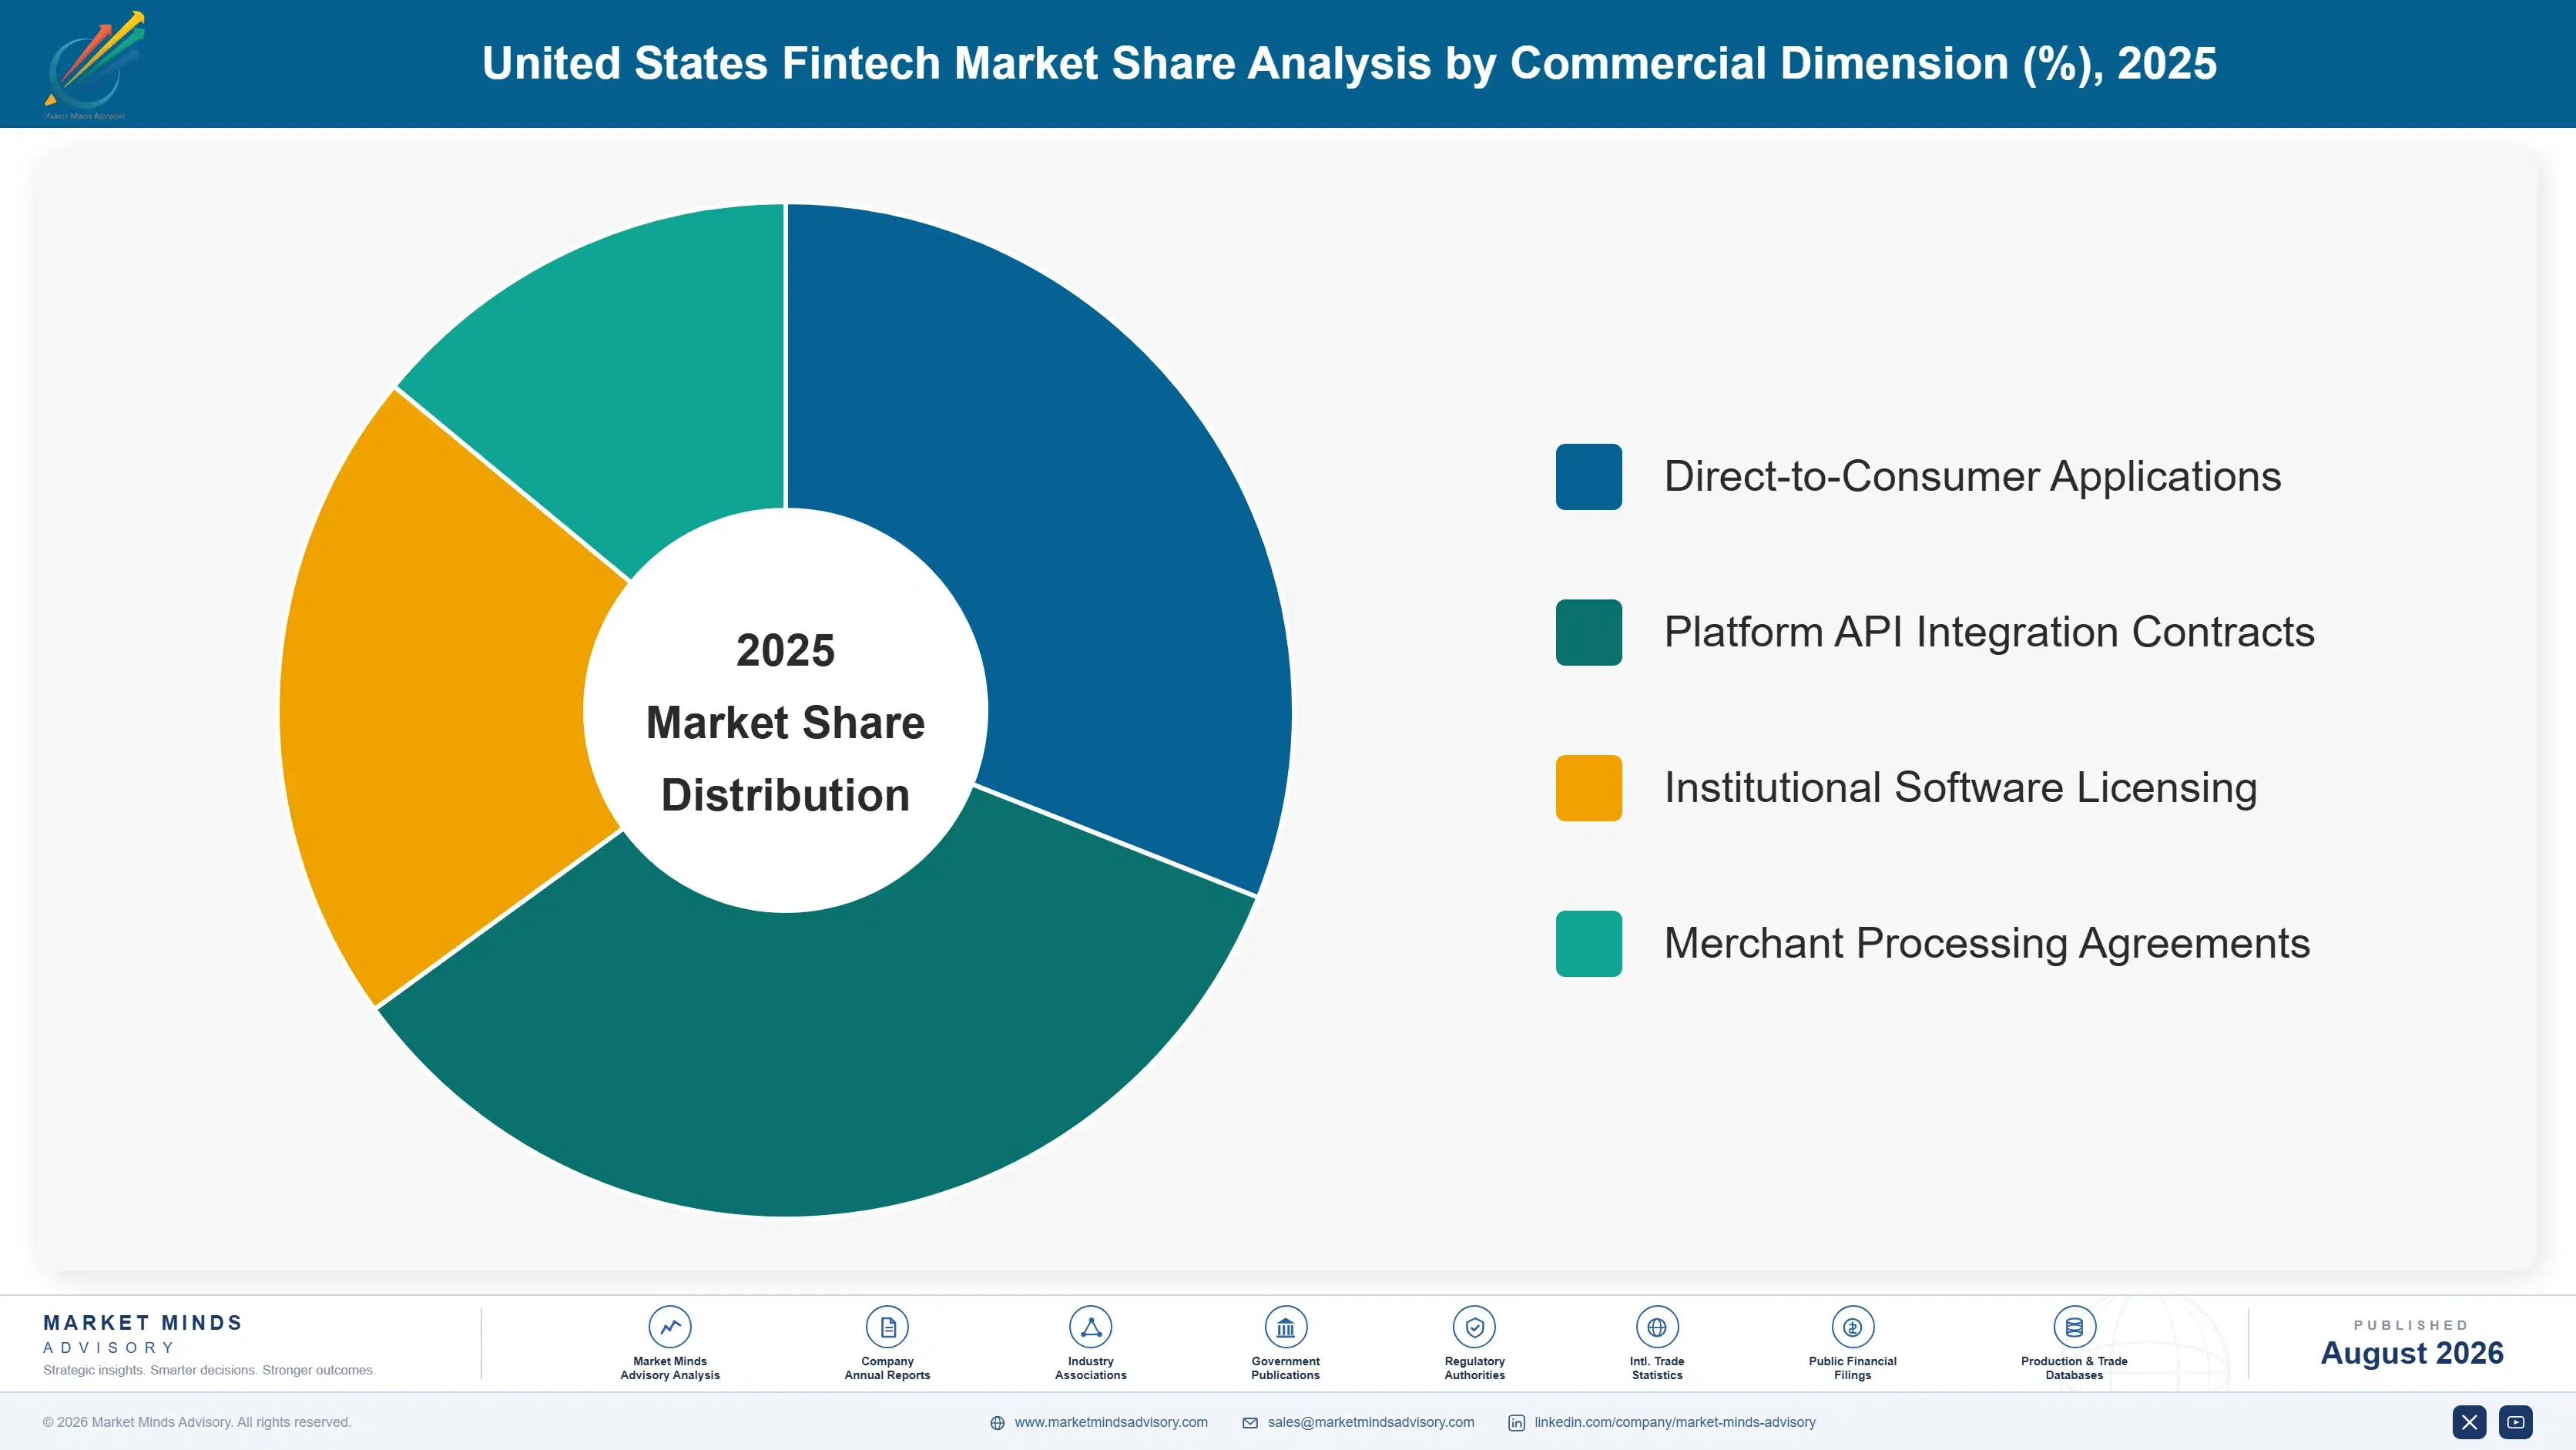
Segmentation follows fintech service category, the single commercial logic determining integration pathway, buyer adoption process, and platform qualification structure across this category. Digital payments dominate by volume, while embedded finance and regtech grow fastest on infrastructure investment and platform demand across major markets. Each dimension moves on its own procurement timeline entirely. Buyers treat this as a platform decision.
us-fintech-market-market-share-analysis-1787913312633

Embedded Finance and Banking-as-a-Service

Embedded finance and banking-as-a-service grows fastest at 20.2%, about 1.36 times the overall 14.8% rate, as software platforms specify documented API reliability that traditional standalone payment apps were never designed to deliver without dedicated infrastructure investment. This segment reaches an entirely different buyer base than traditional consumer payment apps, spanning platform-focused software companies investing at a pace standalone payment replacement rarely matches. Providers with dedicated infrastructure research capability are capturing this demand fastest, since achieving reliable API uptime requires specialized engineering investment most payments-focused providers have not built internally. Suppliers serving this segment increasingly need dedicated infrastructure reliability certification entirely distinct from standard payments qualification processes. That specification depth keeps deepening as platforms adopt formal qualification protocols.
CAGR 20.2%

Regtech and Compliance Technology

Regtech and compliance technology grows second-fastest at 16.8%, driven by financial institutions seeking documented regulatory reporting accuracy that standard manual compliance processes cannot provide at comparable consistency. This segment has proven particularly valuable as compliance automation programmes increasingly favour regtech platforms for applications requiring continuous regulatory monitoring across licensing categories. Institutions increasingly combine regtech sourcing decisions with broader compliance automation strategy rather than treating it as a standalone software purchase. Providers here compete on reporting accuracy and audit trail documentation given the specification requirements these platforms demand from major institutions. That specification depth keeps deepening as institutions adopt formal qualification protocols across major markets. That requirement continues expanding steadily across the industry.
CAGR 16.8%
Full segment breakdown across 6 segments available in the complete report.

Regional Architecture and Country Demand Map

North America accounts for the large majority of this US-scoped market given the country's own regional classification, while Western European fintech markets follow on rising embedded finance adoption, and East Asia posts strong growth as platform investment expands. That gap reflects national market scope more than trade volume alone.

North America

This report is scoped to the United States domestic market, and North America reflects the country's own regional classification within this analysis, explaining the region's 68% share, well above this report's standard regional band given the market's national scope, and its 14.4% growth tracking the overall US category closely. PayPal and Block facilities across the country serve both consumer payment and rapidly growing embedded finance demand. American software platforms increasingly specify embedded banking given rising API infrastructure reliability data. Growth here should continue tracking domestic platform integration and regtech adoption more than any independent international cycle alone. American platforms increasingly view embedded finance reformulation as a competitive necessity rather than a niche marketing exercise.
Share: 68% | CAGR: 14.4% (2026 to 2036)

Western Europe

Western Europe's 10% share and 13.2% growth reflect a meaningful but secondary relationship to this US-scoped market, anchored by Stripe's European operations exporting embedded finance infrastructure technology to European platforms. German and UK fintech markets continue expanding export capacity specifically targeting cross-border commerce demand. This corridor remains a secondary channel behind established domestic US platform relationships. Growth here should keep tracking specialty infrastructure demand more than any broader US consumer payment cycle alone. Regional trading houses increasingly bundle infrastructure licensing with technical support, a combination that gives European partners an edge over pure distribution intermediaries. This corridor should continue growing steadily as cross-border commerce demand expands over the coming years across major European markets.
Share: 10% | CAGR: 13.2% (2026 to 2036)
Regional intelligence for 5 additional markets available in the complete report: East Asia, South Asia and Pacific, Latin America, Middle East and Africa, Eastern Europe. Contact sales@marketmindsadvisory.com.
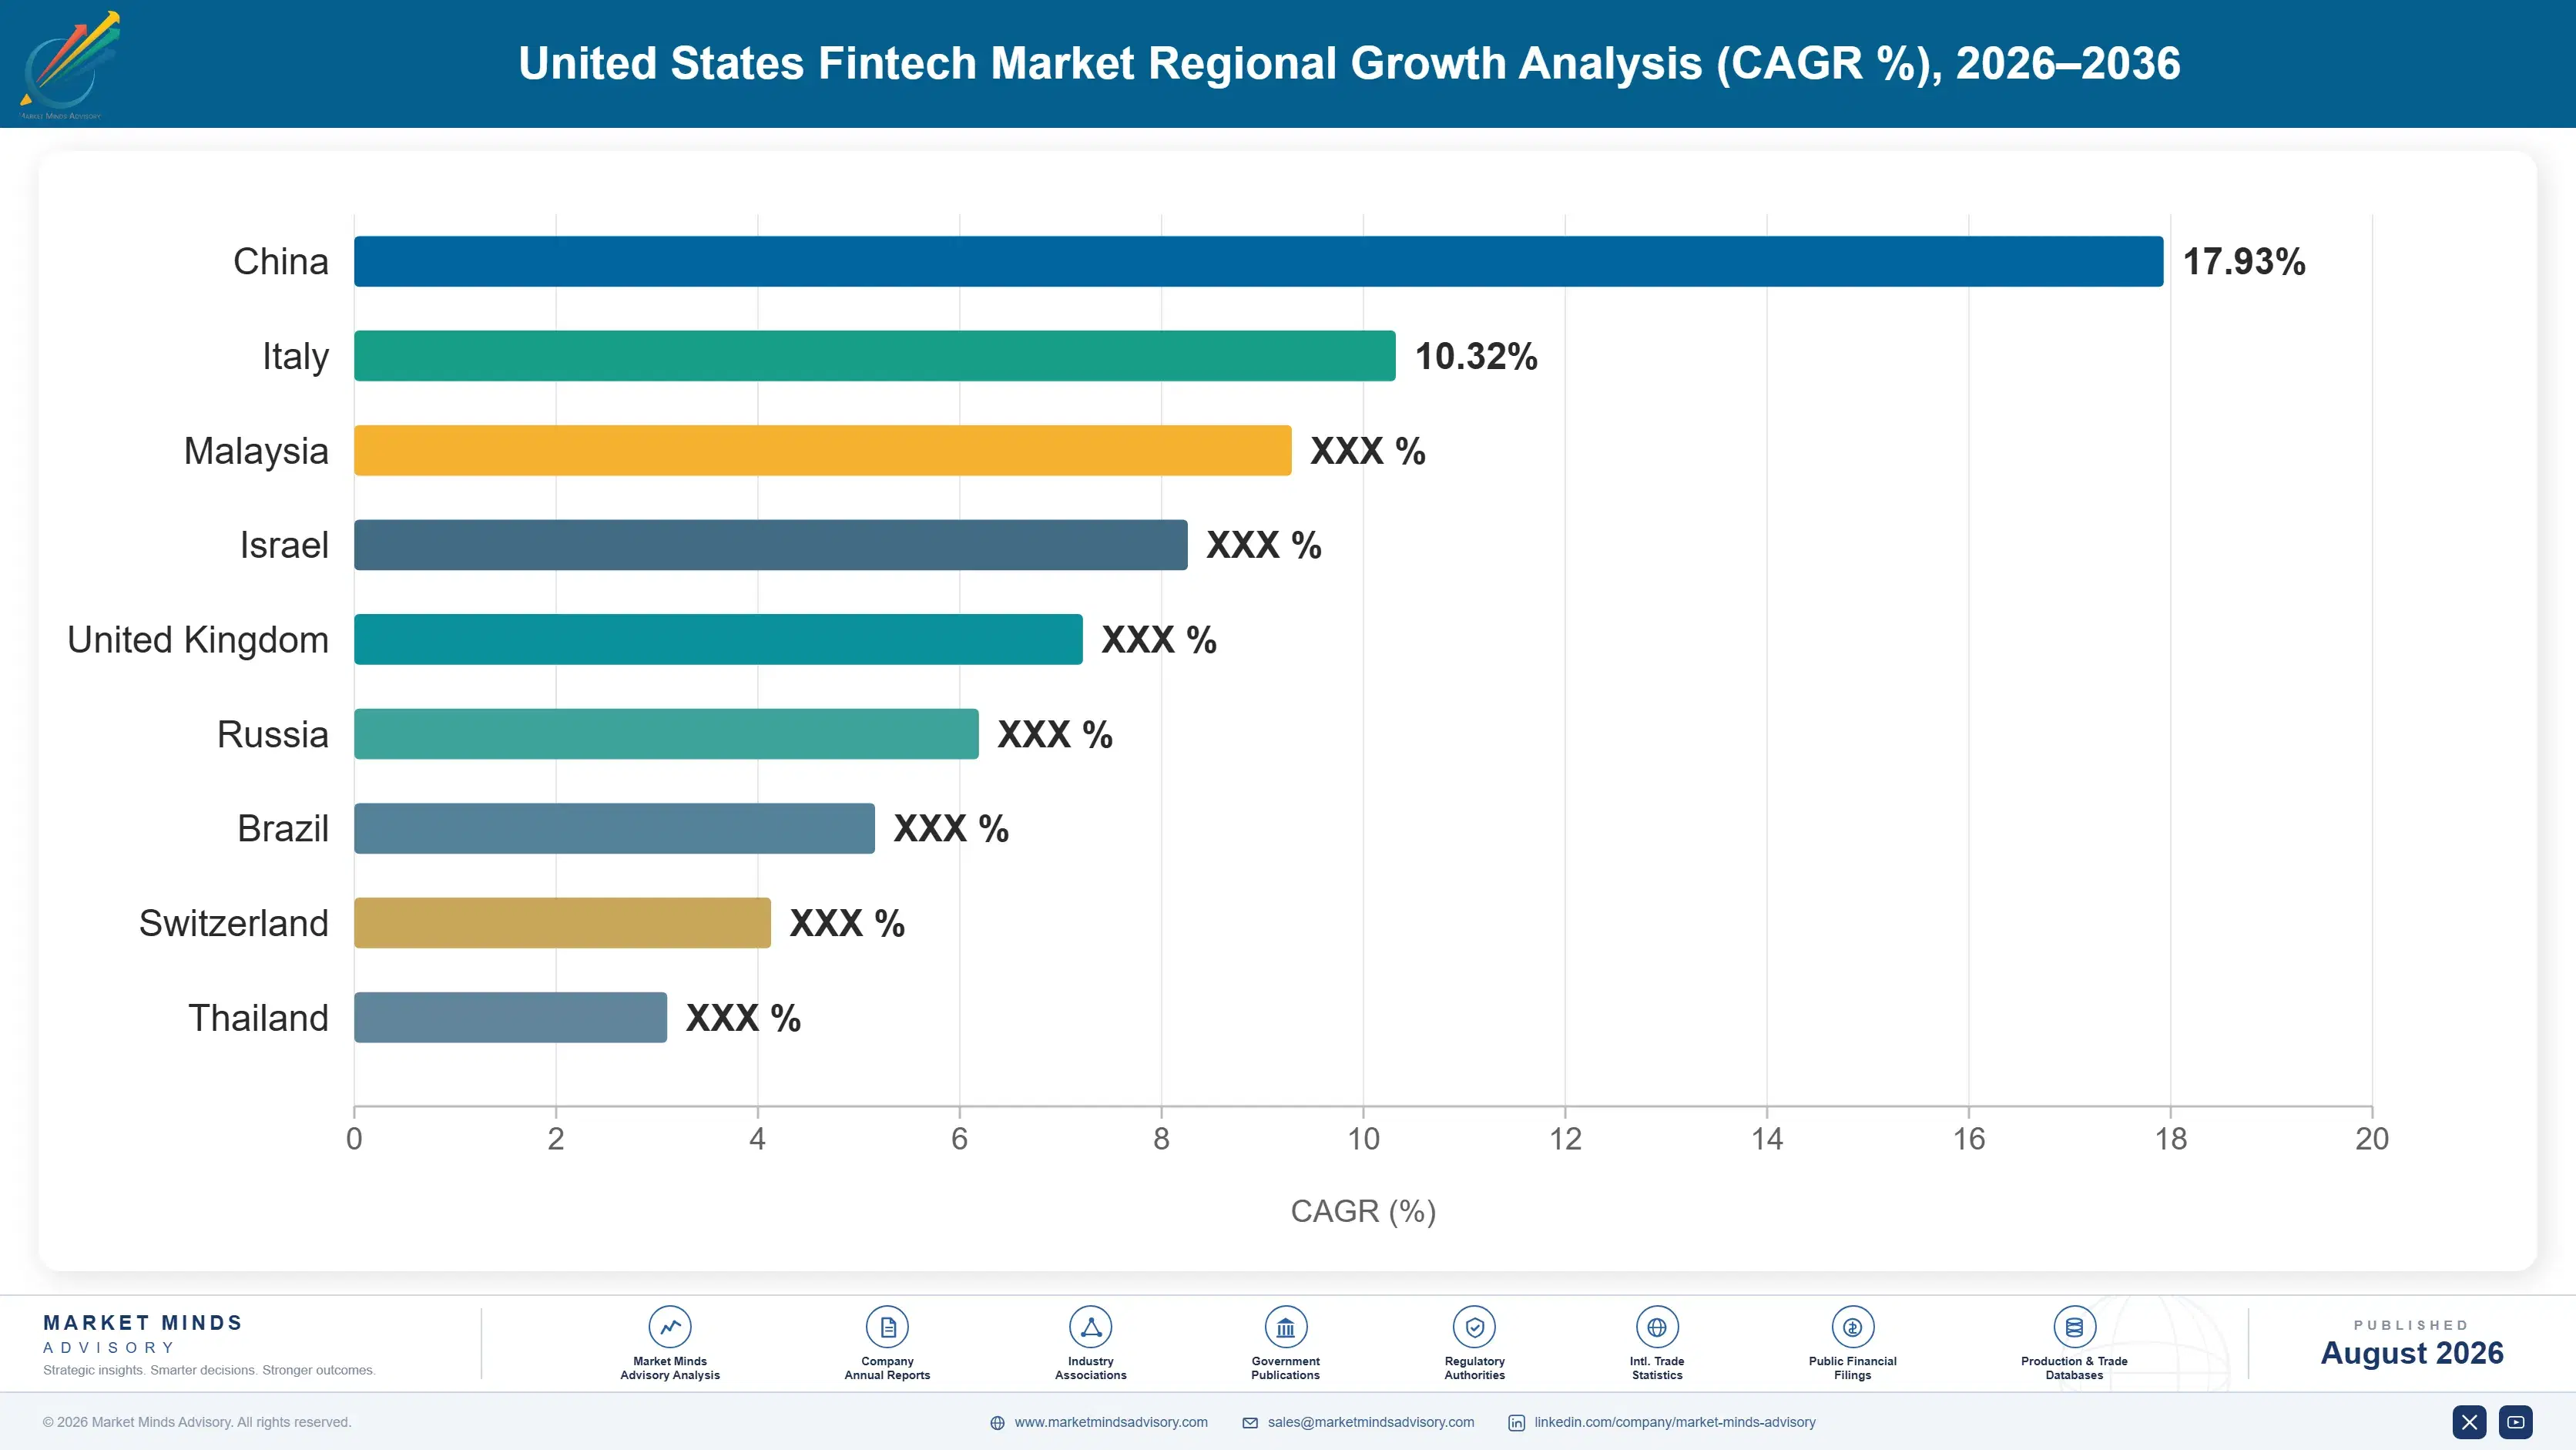
us-fintech-market-country-cagr-analysis-1787913313147

Where Platforms Can Defend Category Margin

Digital payments volume sets a real ceiling on legacy growth in this market, but four commercial moves let platforms capture more value above that ceiling regardless of service category, and regardless of how quickly embedded finance demand ultimately reshapes overall category revenue mix across this coming decade of platform integration expansion. Each targets a distinct margin lever available now.

Build API infrastructure research capability early

Platforms investing in embedded finance API infrastructure research capability ahead of broader industry recognition of platform integration demand's commercial scale capture software platform contracts that payments-only providers cannot service at required reliability specification. This investment requires meaningful engineering expenditure distinct from standard payment processing development, but embedded finance integration already commands premiums of 32% to 48% over payments-only pricing, and early movers are securing multi-year platform relationships that later entrants find considerably harder to displace once qualified. Few competitors move this early in the engineering cycle. Authority-level relationships built this early rarely change hands once locked into a specific programme.
Market Impact: Captures a 32% to 48% pricing premium overall

Develop regtech automation platform capacity now

Providers offering regtech automation with genuine compliance documentation capture financial institution contracts that standard manual compliance providers cannot satisfy given regulatory reporting specification requirements set by major institutions. This investment requires dedicated compliance engineering capability distinct from traditional payment development, but it opens access to a compliance-focused institutional base expanding automation programmes, expanding a provider's addressable market by roughly 6 to 9 percentage points beyond payments-only channels. Institutions increasingly treat this as a standard qualification requirement rather than an optional upgrade. That expanded addressable market compounds meaningfully as more institutions adopt precision procurement requirements.
Market Impact: Expands addressable market by 6 to 9 points

Secure multi-state licensing certification early on

Providers securing recognized multi-state money transmitter licensing ahead of broader scaling requirements are winning contracts that unlicensed competitors increasingly cannot access given tightening national platform expansion policies across major partners. This certification typically costs USD 4 million to 8 million and requires dedicated regulatory affairs investment spanning one to two years, but it directly addresses a specification preference shift that shows every sign of accelerating across major platforms worldwide. Late movers should expect qualification lists closed by the time they finish licensing. Regulatory affairs teams that start this process now retain a meaningful head start over slower rivals.
Market Impact: Wins 16% more embedded-finance contracts overall this decade

Lock long-term fraud intelligence partnership agreements

Providers negotiating long-term fraud intelligence sharing partnerships with defined data exchange terms reduce fraud loss exposure to isolated detection gaps that smaller regional competitors depend on entirely. This approach requires sustained partnership investment beyond internal fraud systems, but providers with these arrangements in place typically reduce fraud losses by 12% to 18% annually and have maintained more stable margins through several fraud escalation cycles. Smaller providers without comparable fraud intelligence relationships rarely achieve similar terms. That stability compounds meaningfully over multiple fraud cycles relative to unsupported providers. Early movers rarely lose these relationships once established.
Market Impact: Reduces fraud losses by 12% to 18% annually

Who Controls the Margin Pool

Concentration is low at a CR5 of 28%, measured consistently across all participants on US fintech platform revenue. PayPal Holdings Inc and Block Inc lead on consumer platform scale and merchant distribution breadth respectively, and the gap to Stripe and other established challengers reflects years of platform relationship and infrastructure investment rather than any single technology advantage a challenger cannot eventually close given sufficient capital commitment.
Competitive activity today runs along three lines: embedded finance infrastructure investment targeting platform integration demand, regtech automation capacity expansion targeting compliance requirements, and fraud intelligence diversification targeting risk stability. Smaller regional providers lacking certification breadth increasingly pursue distribution partnerships with established majors rather than building independent platform relationships from scratch given the capital and time required.

Pressure is building from international providers expanding consumer-grade export capacity specifically to challenge established US incumbents on delivered cost, while embedded finance demand reshapes where established majors direct new infrastructure investment. Any provider still relying purely on commodity payments volume without embedded finance or regtech diversification faces a widening growth disadvantage that consumer scale alone cannot offset indefinitely. Smaller regional providers without diversification will find this pressure compounding steadily.
us-fintech-market-company-positioning-matrix-1787913313665

Competitive Moat and Risk Dimensions

PAYPAL HOLDINGS INC

Moat: Deep consumer platform scale

PayPal holds established consumer payment platform scale and merchant relationships built over years of certified supply into demanding e-commerce procurement programmes. Its integrated fraud detection infrastructure also gives it credibility that smaller specialty providers cannot replicate quickly. Few competitors match this depth. That breadth is rarely matched.
PAYPAL HOLDINGS INC

Risk: Slower embedded-finance adaptation

PayPal's scale and consumer-heritage positioning have made it comparatively slower to adapt to embedded finance platform integration trends than nimbler infrastructure-focused competitors, risking share loss among platform-focused software buyers. Competitors moving faster on embedded finance capability could erode this advantage over the next several years.
BLOCK INC

Moat: Established merchant distribution breadth

Block holds long-standing merchant distribution relationships across the United States, built over years of certified supply into demanding small business payment programmes across several commerce categories. This merchant trust and installed base gives it renewal advantage that newer entrants cannot replicate without a comparable multi-year track record.
BLOCK INC

Risk: Concentrated consumer revenue exposure

Block's revenue remains more concentrated in consumer and small merchant payments than some diversified specialty competitors, exposing it more directly to consumer spending cycle risk than providers with broader embedded finance and regtech diversification across categories. That gap could widen as infrastructure-focused competitors expand further.

Players Tracked

Prominent Players

PayPal Holdings Inc
Block Inc
Stripe Inc
SoFi Technologies Inc
Plaid Inc

Other Key Players

Chime Financial Inc
Affirm Holdings Inc
Robinhood Markets Inc
Coinbase Global Inc
Marqeta Inc
Brex Inc
Ramp Business Corporation
Dave Inc
MoneyLion Inc
Varo Bank
Green Dot Corporation
Fiserv Inc
Global Payments Inc
Bill.com Holdings
Toast Inc

Recent Developments

MARCH 2025

PayPal acquires embedded finance API startup

PayPal Holdings Inc acquired a smaller specialty embedded finance API startup outright, a genuine acquisition rather than a joint venture or minority stake, adding platform integration capability to its payments portfolio. The deal closed within a single quarter and folded the acquired team into PayPal's platform infrastructure division.
Signal: Major payment companies are buying embedded finance technology rather than building it internally. Expect more deals.
NOVEMBER 2024

Block expands Cash App lending platform capacity

Block Inc completed a platform scaling initiative expanding Cash App lending services, adding dedicated engineering capacity ahead of rising consumer demand. The project was an organic platform expansion funded internally, not an acquisition or joint venture, targeting consumer lending customers specifically. The new capability serves major consumer lending programmes.
Signal: Established platforms keep investing directly in lending capacity rather than defending payments volume. Expect more soon.
JULY 2025

Stripe signs e-commerce platform embedded banking agreement

Stripe Inc signed a multi-year partnership agreement with a major e-commerce platform covering embedded banking service integration across several merchant tiers. The arrangement was a commercial partnership agreement, not an equity transaction or joint venture, and included infrastructure reliability support commitments spanning the full contract term.
Signal: E-commerce platforms increasingly value integrated banking infrastructure alongside straightforward payment processing. More such bundled agreements should follow across the industry.

Regulatory Compliance and Fraud Prevention Cost

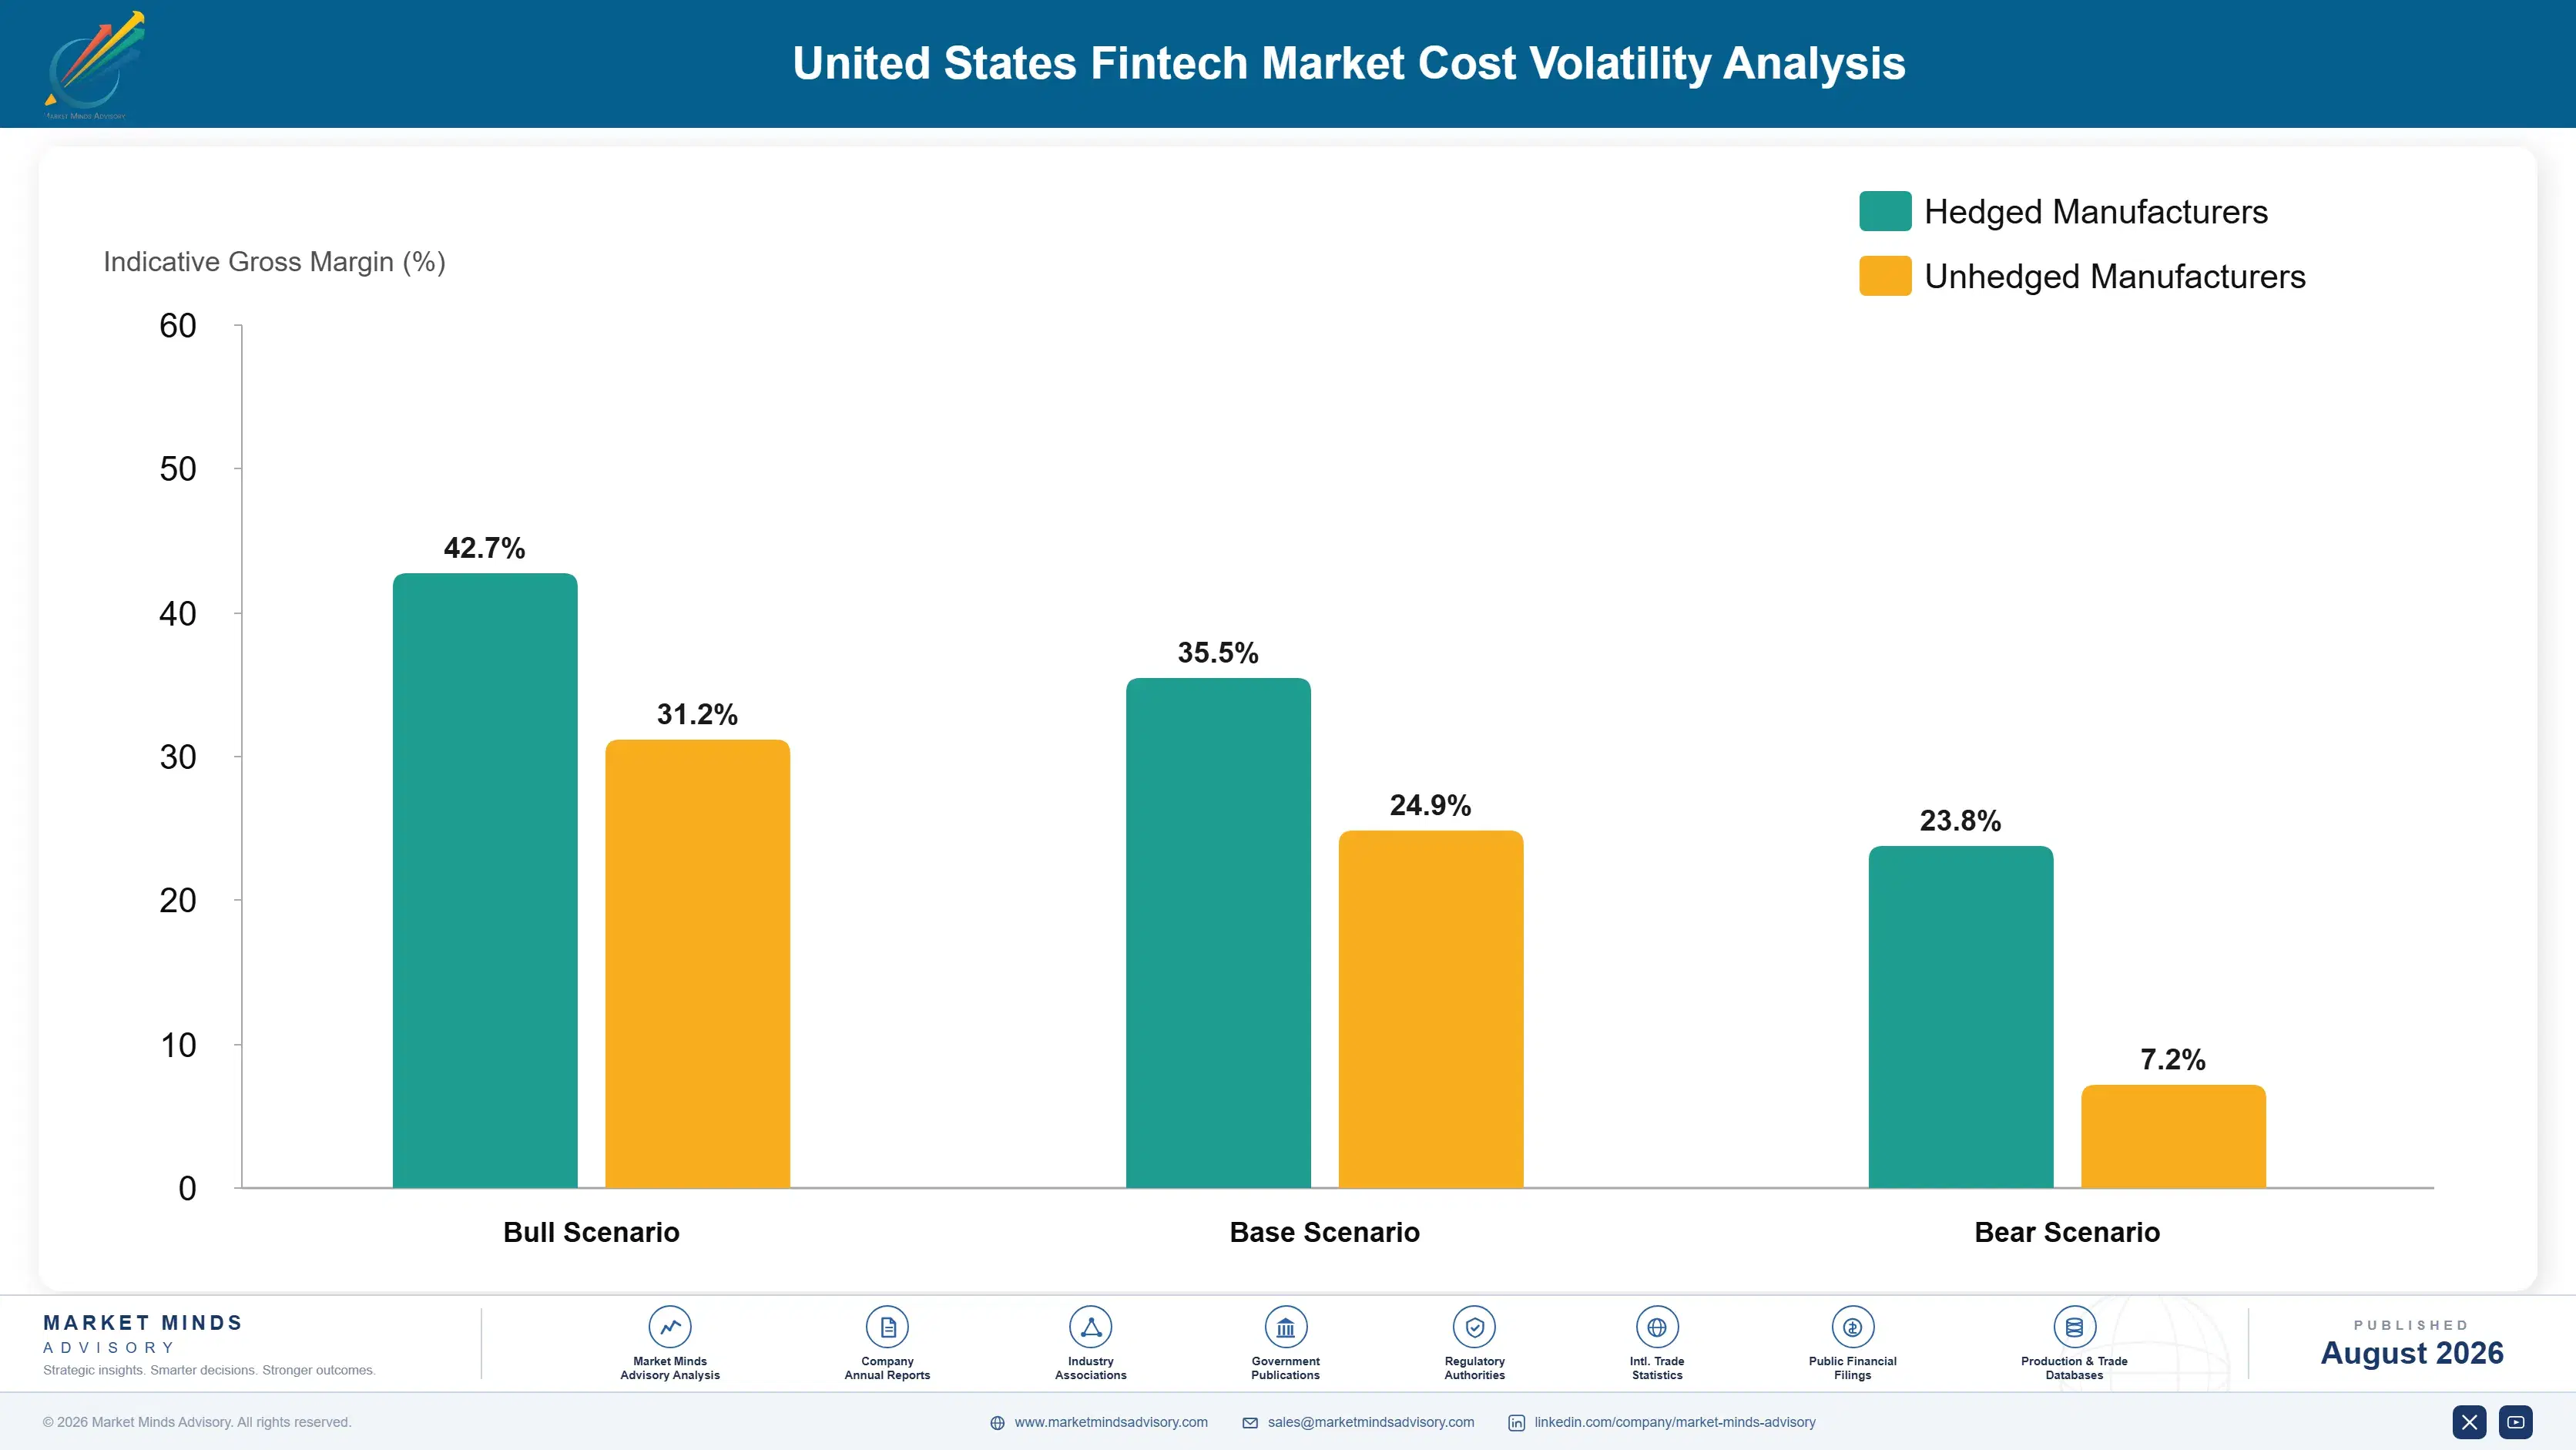
Regulatory licensing and fraud prevention infrastructure runs 34% of operating cost across US fintech providers, sourced either through in-house compliance teams or contracted regulatory affairs partners under project-based or ongoing retainer arrangements. Cloud infrastructure and engineering development add a further 30% to 36%, with customer acquisition marketing making up much of the remainder. Compliance testing adds further overhead across most development lines.
The 2023 fraud escalation cycle showed how directly that exposure translates into margin. Major synthetic identity and account takeover fraud schemes targeted digital payment platforms that year as fraud technique sophistication accelerated across the broader fintech sector, and industry trade data recorded platform fraud prevention costs climbing meaningfully across the period. Providers without diversified fraud intelligence relationships absorbed a disproportionate share of that increase given competition with broader financial technology buyers for the same fraud prevention capacity.

Exposure separates providers cleanly by scale and compliance diversification. Larger incumbents with diversified regulatory affairs relationships across multiple licensing jurisdictions absorbed that shock more effectively than smaller specialty providers dependent on narrower compliance relationships. That gap has hardened into a durable disadvantage for smaller providers without the scale to negotiate favourable long-term compliance infrastructure contracts.
us-fintech-market-cost-volatility-analysis-1787913313859

Diversify regulatory affairs partnership relationships

Providers sourcing regulatory compliance and licensing support from multiple partnership relationships and jurisdictions reduce exposure to localized regulatory changes or cost increases in any single jurisdiction. This diversification requires additional partnership management but has proven valuable during recent regulatory volatility affecting broader fintech markets. This capability separates leading providers from smaller regional competitors. Larger providers pursue this systematically.

Secure long-dated fraud intelligence sharing agreements

Locking multi-year fraud intelligence sharing and data exchange commitments removes much of the detection gap volatility that follows any single fraud technique escalation. This approach has become increasingly standard among larger fintech providers with the scale to negotiate favourable forward terms with major fraud intelligence networks. This procurement investment pays off across multiple contract cycles.

Shift revenue mix toward higher-margin platform contracts

Providers with greater embedded finance and regtech revenue share are less exposed to fraud and compliance cost volatility relative to revenue, since premium platform-grade pricing carries more room to absorb input cost increases than thin-margin consumer payment sales. This mix shift provides a genuine cushion during sustained compliance cost pressure across development cycles. Providers pursuing this mix shift outperform peers.

Portfolio Architecture for Margin Defence

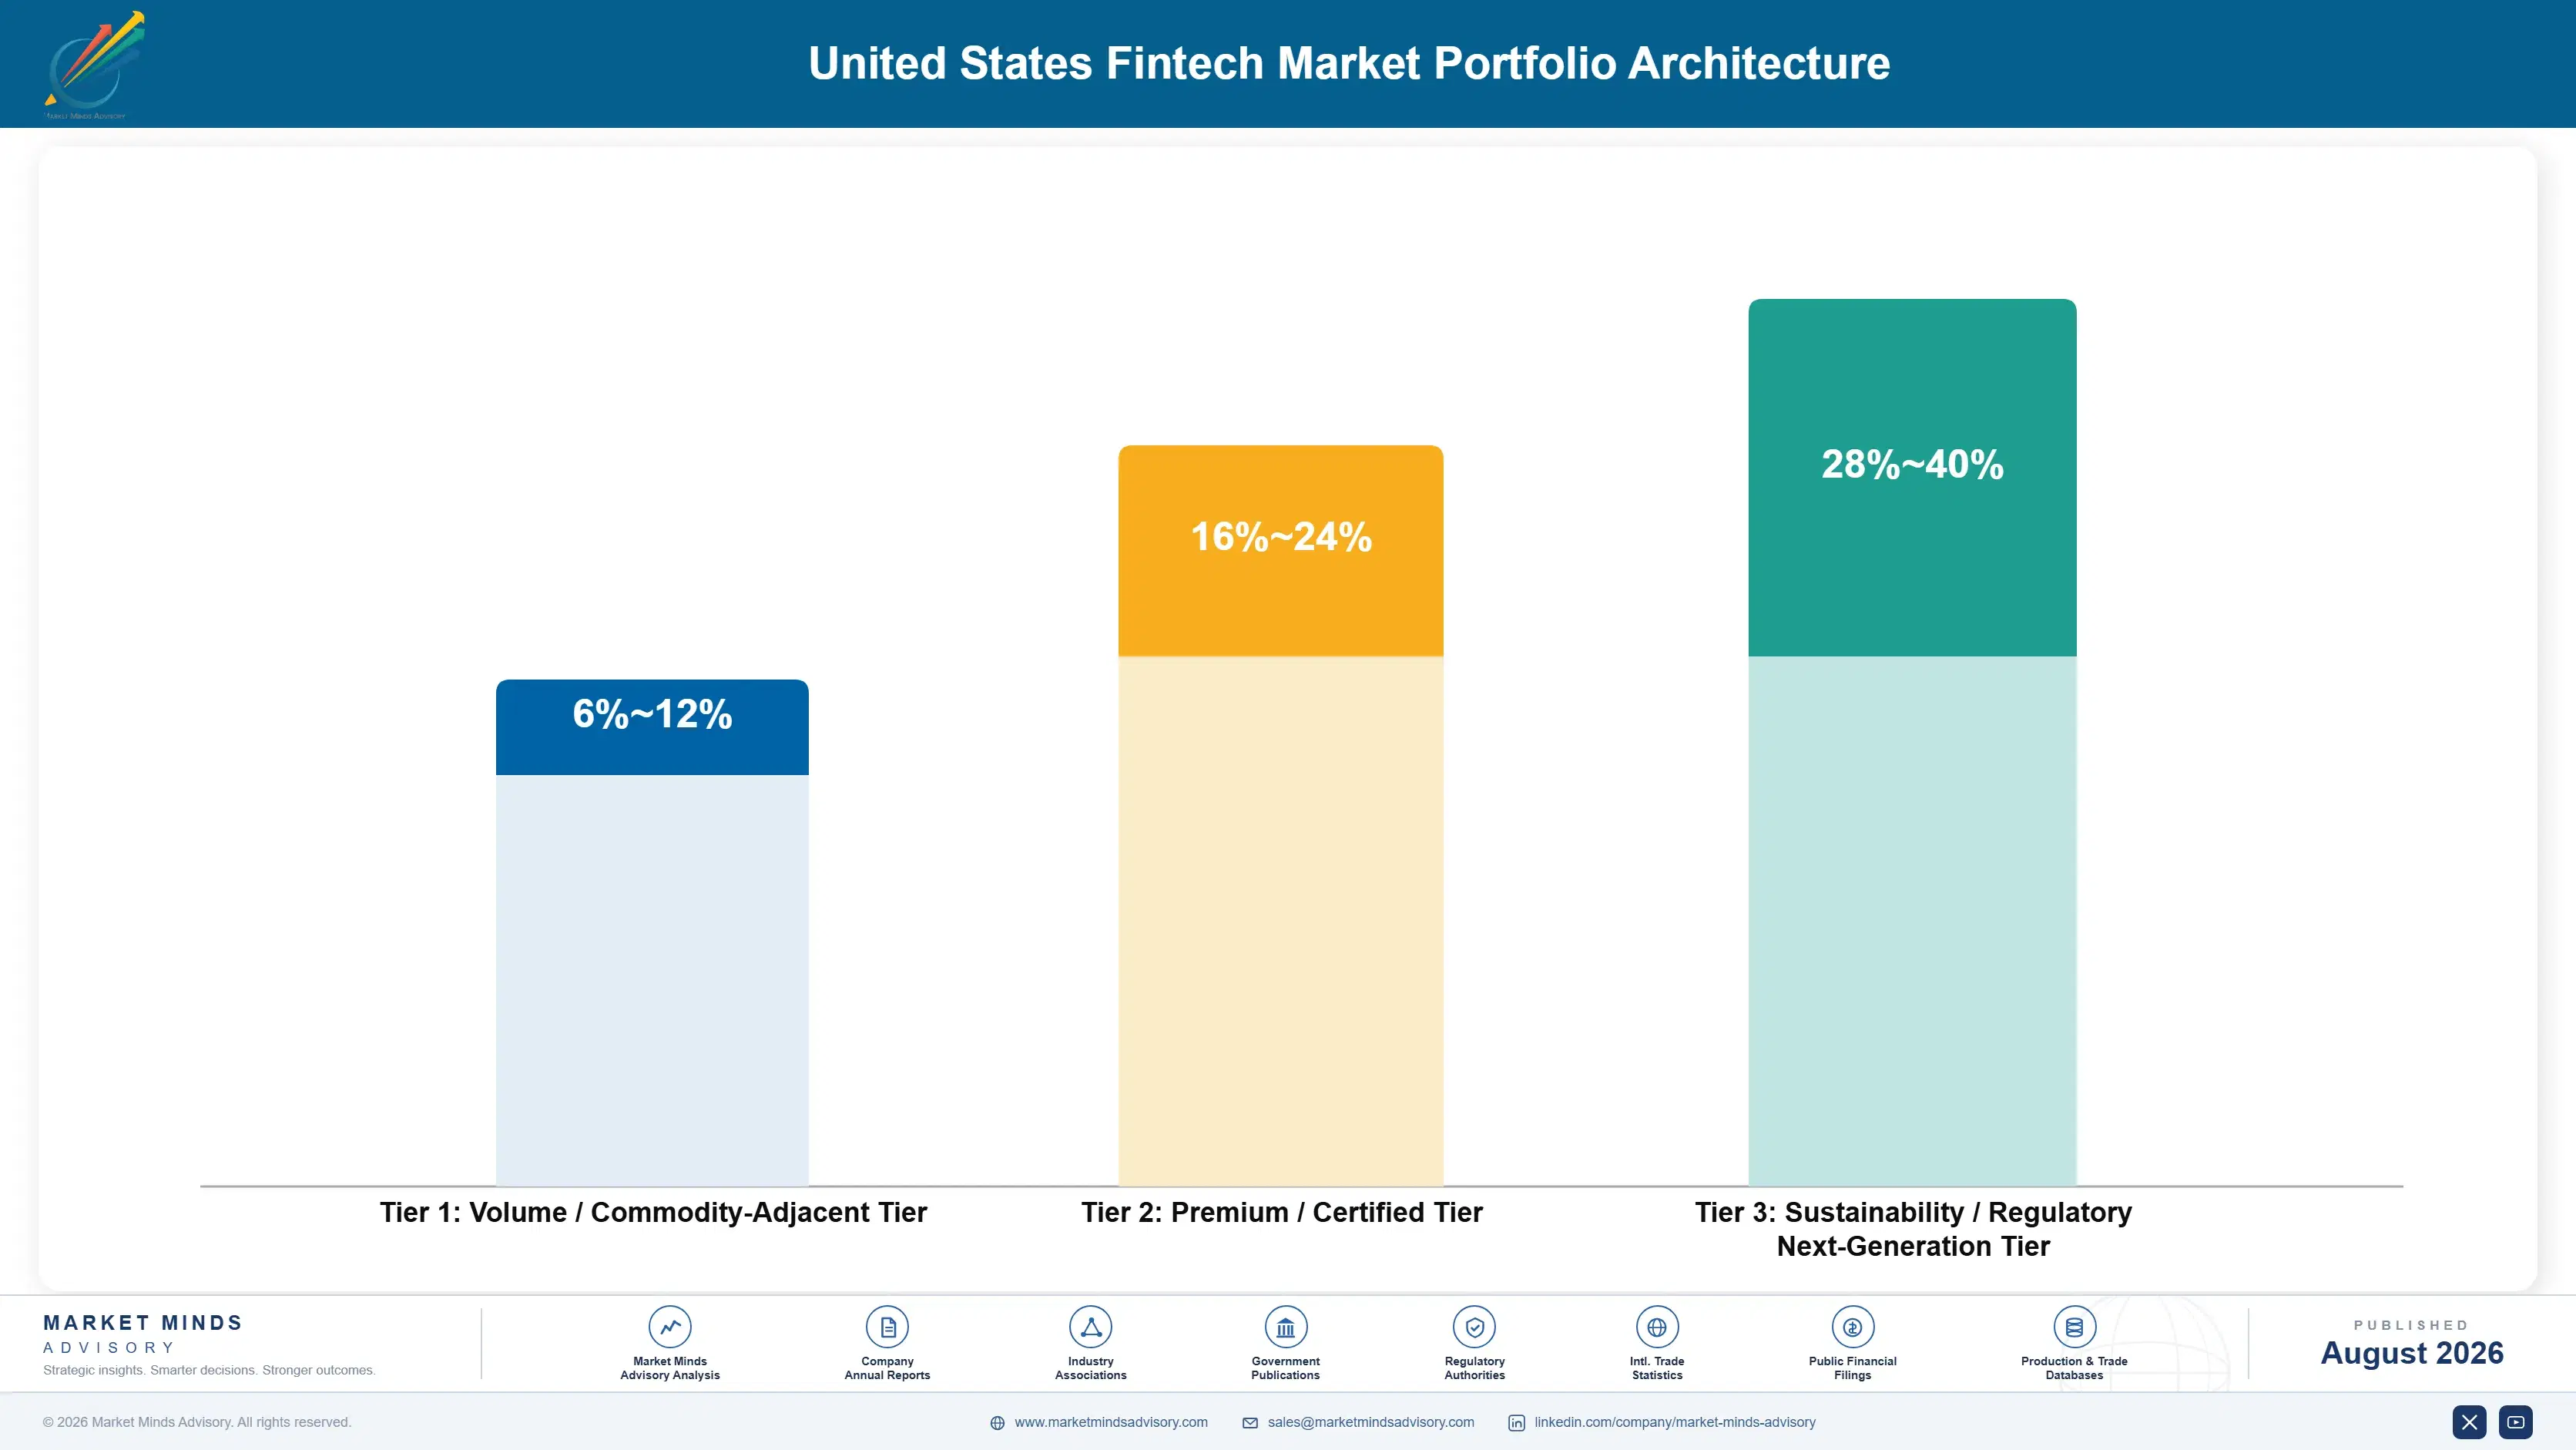
The portfolio splits into three tiers with real margin separation tied to infrastructure sophistication and compliance depth rather than raw transaction volume alone. Standard digital payment processing competes largely on delivered take rate against benchmark pricing, while embedded finance and regtech integrations earn meaningfully more on API reliability documentation and platform partnership depth that commodity-grade providers cannot easily replicate. Buyers increasingly specify tier explicitly during platform qualification rather than treating fintech services as one undifferentiated payment purchase.
The tension between payments volume and specialty premium runs through every provider's development allocation decision each year. Digital payments volume still represents the largest share of the market by transaction count despite consumer-constrained growth, yet margin and growth increasingly concentrate in embedded finance and regtech integrations that require infrastructure investment most payments-only providers have not built. That infrastructure gap separates the tiers most sharply today.

High-value pools concentrate specifically where technical or regulatory requirements limit substitutable supply: embedded finance products commanding the strictest reliability premiums, and regtech platforms rewarding providers who invested in compliance research years ahead of any specific institutional partnership. These pools reward early infrastructure investment over pure consumer platform scale.

Volume / Commodity-Adjacent Tier

Standard digital payment processing sold largely on delivered take rate against benchmark pricing across major established merchant relationships built over several years. Providers here compete almost entirely on delivered cost and reliable, on-time transaction processing.
Gross Margin: 6-12%

Premium / Certified Tier

Digital lending and wealth management platforms commanding real premiums for reliability documentation and proven consumer performance history across several product categories. Buyers in this tier value consistent quality and documentation over the absolute lowest available price.
Gross Margin: 16-24%

Sustainability / Regulatory / Next-Generation Tier

Embedded finance and regtech products meeting emerging API reliability and compliance requirements that mass-market payment processing was never designed to satisfy. Providers here invest heavily in research and compliance documentation to defend this pricing position.
Gross Margin: 28-40%
us-fintech-market-portfolio-architecture-1787913314361

High-value Sub-segments and Strategic Watch-out

Embedded Finance and Banking-as-a-Service

High value and the fastest-growing segment at 20.2% CAGR, anchored by platform-focused software companies reaching an entirely different buyer base than traditional consumer payment apps. Premiums of 32% to 48% reflect genuine infrastructure research cost, and early movers should retain this advantage for years. Expect this trend to continue steadily.
Gross Margin: 28-38%

Regtech and Compliance Technology

High value with strong second-fastest growth at 16.8%, driven by compliance demand among institutions requiring documented regulatory reporting accuracy across categories. Supply remains constrained by compliance engineering expertise that generic providers lack, and buyers rarely switch once a platform is validated. That loyalty compounds over time.
Gross Margin: 20-28%

Standard Digital Payments

The volume core of the market despite consumer-constrained growth, competing on delivered take rate against benchmark pricing with thin margins and intense provider rivalry nationwide. Growth tracks a well-documented consumer adoption cycle with limited differentiation between providers overall. Providers here rarely capture meaningful pricing power beyond basic scale-driven cost advantages.
Gross Margin: 6-12%

Payments-Only Legacy Platforms

The strategic watch-out. Providers dependent purely on payments-only volume without embedded finance or regtech investment face a widening exposure to category-wide demand shift and competitive substitution risk over the coming decade of platform integration growth worldwide. These providers should expect continued margin compression unless they diversify meaningfully soon.
Gross Margin: 2-8%

Platform Contracts and Developer Loyalty

Demand here runs on multi-year platform integration and institutional partnership contracts rather than transactional sales for the majority of platform-grade revenue, since software integration programmes need consistent, validated API performance locked in well before any platform qualifies a new provider. Contract renewal typically follows infrastructure validation cycles spanning several years rather than the monthly transactional churn common in commodity consumer payments.
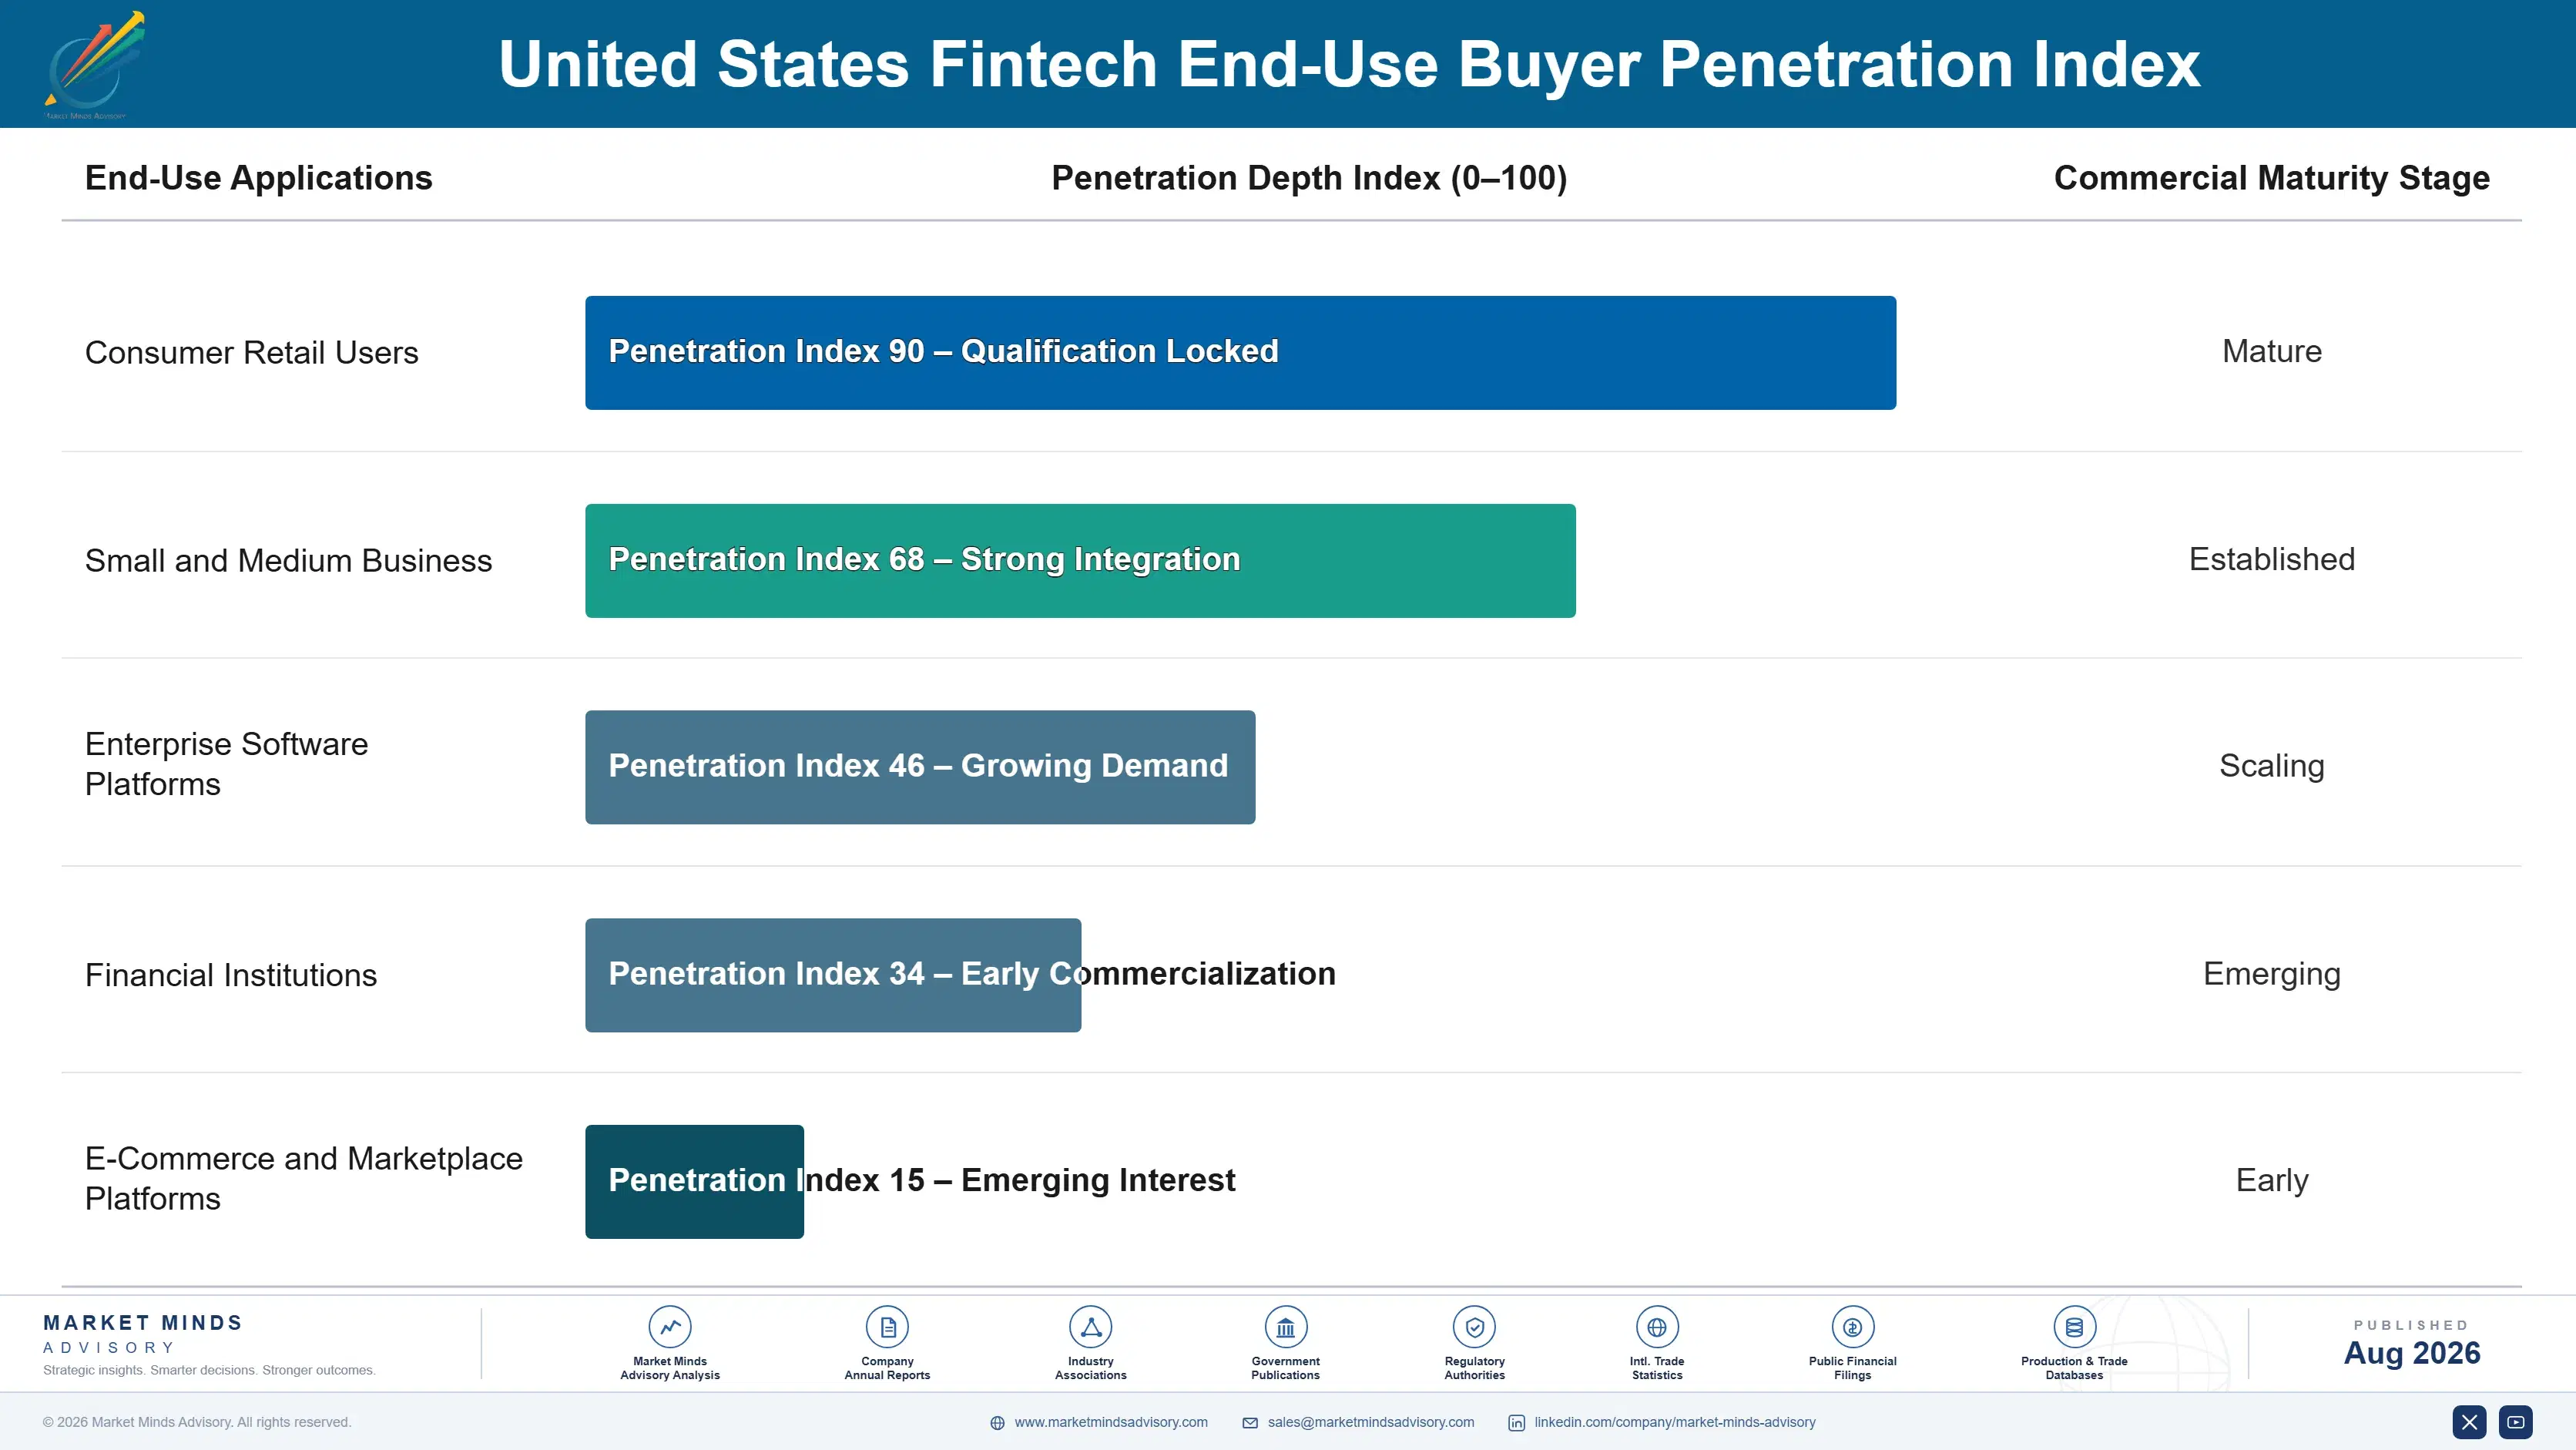
Adoption depth varies sharply by service category. Embedded finance and regtech buyers show the strongest provider loyalty given validation cost and the operational risk of switching mid-integration given reliability requirements, while consumer payment buyers switch relatively freely based on price and convenience given the category's mature, standardised adoption processes. Digital lending buyers sit between the two, valuing documentation consistency over transactional pricing given regulatory considerations.

Buyer profiles have shifted generationally as fintech procurement moved from purely convenience-driven consumer purchasing toward reliability-driven, technically demanding platform qualification programmes spanning multiple service categories simultaneously. Younger developers increasingly evaluate API reliability documentation and platform trust rather than upfront transaction cost alone, a shift that favours providers investing in infrastructure and certification depth over those competing purely on traditional consumer volume.
us-fintech-market-end-use-penetration-index-1787913314851

Where Infrastructure Investment Decides Outcomes

These are among the four positions where our research anticipates prominent divergence between winners and laggards over the coming forecast period. Each is grounded in the demand model, the regulatory perimeter, and the announced capacity pipeline.
01 / EMBEDDED FINANCE RESEARCH PRIORITY

Early infrastructure capability will keep capturing the fastest-growing segment

Providers investing in embedded finance API infrastructure research capability are capturing platform contracts that payments-only providers cannot service at required reliability specification, and that gap will not close quickly given the engineering investment involved. Platforms rarely switch providers once an integration is validated against a specific software stack, which locks in early movers for years at a time. Expect continued investment concentrating among providers who committed to this capability years ahead of the segment's current growth, leaving later entrants a steeper infrastructure curve to climb.
02 / PAYMENTS VOLUME DIVERSIFICATION

Diversified providers will outperform payments-only legacy competitors

Digital payments volume growth is a well-documented, predictable consumer adoption cycle, and providers dependent purely on payments-only processing face a steadily compressing margin position regardless of how well they execute operationally, since no amount of operational excellence changes a mature category's growth ceiling. Companies that diversified into embedded finance and regtech integrations early have already begun offsetting slower payments volume growth with faster-growing, higher-margin revenue streams. Expect continued consolidation toward diversified providers as payments-only competitors face an increasingly difficult margin position that should keep widening.
03 / REGULATORY CERTIFICATION EXPANSION

Early certification will outcompete unlicensed regional incumbents

Multi-state licensing requirements will keep tightening across additional major platform markets, and providers who secured licensing certification ahead of that tightening are already winning contracts citing proven regulatory track record specifically, since certified capacity remains scarce relative to growing platform demand nationwide. That scarcity sustains real advantage for early movers, though broader industry investment should eventually compress it as more providers complete certification over time. Expect procurement lists to gradually close against unlicensed bidders as this trend continues over the coming years.
04 / REGTECH PLATFORM GROWTH

Early compliance research will build durable institutional advantage

Financial institutions are increasingly specifying regtech automation formats, and providers who invested in compliance engineering research now are building institutional trust relationships that later entrants must wait years to replicate given typical certification qualification timelines across major markets. This opportunity depends on genuine research investment rather than simple product marketing, which is why smaller providers struggle to compete here. Expect continued investment concentrating among regtech format leaders as adoption advances, with later movers finding contract wins considerably harder to secure.

Engagement Snapshot From the Field

A live engagement with an industry participant carrying material or product regulatory and market exposure ahead of a defining policy shift, showing how our research translates into a defensible multi-year portfolio strategy.
MARKET MINDS ADVISORY · CLIENT ENGAGEMENT SUMMARY
United States Fintech Producer Strategic Portfolio Review and Transition Roadmap 2026·Investment Scenario on United States Fintech Exposure Evaluation 2025-26
CLIENT PROFILE
A regional e-commerce software platform serving small business merchants across the United States approached MMA while planning a supplier qualification programme for embedded banking integration. The client reported annual platform revenue near USD 85 million, with limited prior experience qualifying embedded finance providers against API reliability targets (client-reported, unverified by MMA). The team reported using only informal provider comparisons in prior sourcing decisions.
STRATEGIC CHALLENGE
Management wanted to add embedded banking and lending capabilities to its e-commerce platform to increase merchant retention, but lacked internal expertise comparing provider API reliability data across candidate partners. The engineering team worried that integrating an unproven provider too quickly could disrupt established merchant checkout experiences. Timeline pressure from leadership added further complexity.
MMA APPROACH
MMA benchmarked available embedded finance providers against the client's specific API reliability and regulatory compliance requirements, then modelled the qualification timeline needed for a credible platform integration. We also assessed each candidate provider's fraud infrastructure and licensing coverage to identify the most durable long-term partner. We benchmarked findings against comparable qualification programmes completed by other regional e-commerce platforms.
KEY FINDINGS
  1. The client's initial provider shortlist included several candidates whose documented API uptime claims fell short of independent benchmarks on closer review. This gap was not obvious before independent testing.
  2. A qualified provider with proven embedded finance integration experience could compress the client's qualification timeline meaningfully compared with developing a new partner relationship from scratch. That timeline advantage mattered considerably to the client's leadership.
  3. Licensing coverage assessment revealed one leading candidate had considerably more diversified state licensing than the client's incumbent provider. This finding shaped the client's final provider ranking significantly.
  4. A phased integration approach reduced merchant checkout disruption risk considerably compared with the single-launch rollout originally proposed. Production teams welcomed the reduced disruption risk this approach offered.
CLIENT PROFILE
A regional e-commerce software platform serving small business merchants across the United States approached MMA while planning a supplier qualification programme for embedded banking integration. The client reported annual platform revenue near USD 85 million, with limited prior experience qualifying embedded finance providers against API reliability targets (client-reported, unverified by MMA). The team reported using only informal provider comparisons in prior sourcing decisions.
STRATEGIC CHALLENGE
Management wanted to add embedded banking and lending capabilities to its e-commerce platform to increase merchant retention, but lacked internal expertise comparing provider API reliability data across candidate partners. The engineering team worried that integrating an unproven provider too quickly could disrupt established merchant checkout experiences. Timeline pressure from leadership added further complexity.
MMA APPROACH
MMA benchmarked available embedded finance providers against the client's specific API reliability and regulatory compliance requirements, then modelled the qualification timeline needed for a credible platform integration. We also assessed each candidate provider's fraud infrastructure and licensing coverage to identify the most durable long-term partner. We benchmarked findings against comparable qualification programmes completed by other regional e-commerce platforms.
KEY FINDINGS
  1. The client's initial provider shortlist included several candidates whose documented API uptime claims fell short of independent benchmarks on closer review. This gap was not obvious before independent testing.
  2. A qualified provider with proven embedded finance integration experience could compress the client's qualification timeline meaningfully compared with developing a new partner relationship from scratch. That timeline advantage mattered considerably to the client's leadership.
  3. Licensing coverage assessment revealed one leading candidate had considerably more diversified state licensing than the client's incumbent provider. This finding shaped the client's final provider ranking significantly.
  4. A phased integration approach reduced merchant checkout disruption risk considerably compared with the single-launch rollout originally proposed. Production teams welcomed the reduced disruption risk this approach offered.
RECOMMENDED STRATEGY
Phase 1: Phase 1 (0 to 3 months): Complete API reliability testing and licensing coverage review for the top three candidate providers. Phase 2: Phase 2 (3 to 7 months): Qualify the selected provider through staged merchant pilot integration. Performance data was tracked continuously throughout each trial batch. Phase 3: Phase 3 (7 to 12 months): Transition full platform-wide integration once pilot performance validates the provider change. Full transition was monitored closely against baseline performance metrics.
OUTCOME
The client completed its embedded finance integration within the planned timeline following the phased approach, avoiding the merchant disruption risk a faster rollout would likely have introduced. The integration also secured a reported 26% increase in merchant retention through the new banking capabilities (client-reported, unverified by MMA).

Frequently Asked Questions

Foundational context covering the market sizes, CAGR, scope, country, region and competition that inform every finding below. This section is provided to cover basics and most often pre-purchase conversations, answered from the MMA Primary Research Dataset.

What is the current size of the United States Fintech Market?

The US fintech market reached USD 42.0 billion in 2025, covering digital payments, lending, wealth management, insurtech, regtech, and embedded finance platforms. These platforms serve consumer and institutional applications nationwide.

How large will the United States Fintech Market be by 2036?

The market is projected to reach USD 191.71 billion by 2036 under the base case scenario, representing a 3.98 times expansion over the 2026 starting value.

What is the CAGR for the United States Fintech Market 2026 to 2036?

The base case CAGR is 14.8%, with a bull case of 16.0% and a bear case of 13.5%. Embedded finance adoption and regulatory licensing drive most of the variance.

Which segment is growing fastest?

Embedded finance and banking-as-a-service grows fastest at 20.2% CAGR, about 1.36 times the overall market rate, as platform integration demand drives this growth directly. This growth outpaces the overall market by a wide margin.

Who are the major companies in the United States Fintech Market?

Leading companies include PayPal Holdings Inc, Block Inc, Stripe Inc, SoFi Technologies Inc, and Plaid Inc, together holding roughly 28% combined market share. across the entire national category.

Which country is growing fastest?

India posts the fastest supply-side growth at 16.8% CAGR, driven by expanding fintech infrastructure investment, with growing digital payment demand anchoring most of this growth nationwide.

Report Segmentation Architecture

The full report scope spans multiple orthogonal segmentation dimensions, with cross-tabulated demand data provided for each dimension pair. Coverage extends further to regional breakdowns, trend trajectories, and the competitive detail needed to support segment-level decision-making.

By Fintech Service Category

  • Digital Payments and Money Transfer
  • Digital Lending and Credit Platforms
  • Wealth Management and Robo-Advisory
  • Insurtech Platforms
  • Regtech and Compliance Technology
  • Embedded Finance and Banking-as-a-Service

By End-Use Buyer

  • Consumer Retail Users
  • Small and Medium Business
  • Enterprise Software Platforms
  • Financial Institutions
  • E-Commerce and Marketplace Platforms

By Commercial Dimension

  • Direct-to-Consumer Applications
  • Platform API Integration Contracts
  • Institutional Software Licensing
  • Merchant Processing Agreements

By Region

  • North America
  • Western Europe
  • East Asia
  • South Asia and Pacific
  • Latin America
  • Middle East and Africa
  • Eastern Europe

Scope, Methodology, and Coverage

Every figure in this report is reproducible from documented input assumptions. The scope below maps the historical period, the forecast horizon, the segmentation dimensions, and the countries covered, alongside the underlying primary and qualitative methodology.
Historical Period
2020 to 2025
Forecast Period
2026 to 2036
Base Year
2025 (USD billions; MMA Primary Research Dataset, August 2026)
Market Definition
This market comprises fintech products including digital payments, digital lending, wealth management, insurtech, regtech, and embedded finance and banking-as-a-service platforms serving the United States. Traditional bank branch banking and unrelated cryptocurrency mining products are excluded from this scope.
Quantitative Units
USD billions (current prices); number of active platform users where applicable
Segmentation Dimensions
By Fintech Service Category; By End-Use Buyer; By Commercial Dimension; By Region
Regions Covered
North America, Western Europe, East Asia, South Asia and Pacific, Latin America, Middle East and Africa, Eastern Europe
Countries Covered
USA, Canada, Germany, France, UK, China, Japan, South Korea, India, Australia, Brazil, Mexico, Argentina, Colombia, UAE, Saudi Arabia, South Africa, Nigeria, Poland, Lithuania, Latvia, and additional supply markets relevant to this sector
Key Companies Profiled
PayPal Holdings Inc, Block Inc, Stripe Inc, SoFi Technologies Inc, Plaid Inc, Chime Financial Inc, Affirm Holdings Inc, Robinhood Markets Inc, Coinbase Global Inc, Marqeta Inc, Brex Inc, Ramp Business Corporation, Dave Inc, MoneyLion Inc, Varo Bank, Green Dot Corporation, Fiserv Inc, Global Payments Inc, Bill.com Holdings, Toast Inc
Quantitative Methodology
Primary survey, n=3,800 respondents, Q4 2025, six countries; demand-side model with trade association cross-validation
Qualitative Methodology
47 expert interviews, Q4 2025; applied to validate demand model assumptions, identify emerging dynamics, and assess competitive positioning
Report Format
PDF and XLSX data workbook (Word format preview document)
Publisher
Market Minds Advisory
Report Code
MMA-2026-TEC-347
Published
August 2026
Contact
sales@marketmindsadvisory.com | www.marketmindsadvisory.com

Purchase the full United States Fintech Market Report (2026 to 2036).

The full MMA United States Fintech report sizes the market across six service category segments, five end-use buyer categories, four commercial channels, and seven regions through 2036. It profiles twenty companies on a consistent basis of US fintech platform revenue, scoring each on embedded finance infrastructure depth, regtech automation capacity, and multi-state licensing breadth. Scenario models quantify how platform integration demand, regulatory licensing, and fraud risk exposure move both demand and realised pricing. The report also includes delivered-cost modelling by service category, a payments-only exposure screen, and embedded finance segment economics built for procurement, strategy, and investment teams.
Six-segment fintech demand breakdown detailed analysis
Compliance cost delivered-cost bridge modelling review
Payments-only provider exposure screening evaluation tool
Provider API reliability depth benchmarking comparison
Embedded finance segment economics deep detail review
Regional platform investment mapping detail review

Built For The People Who Decide

From boardroom strategy to bench-side execution, this report is read cover-to-cover by leaders shaping the next decade of their industry, turning demand scenarios, market dynamics and valuation benchmarks into decisions.
CXOs/ Presidents/ VPs/ Managers
M&A and Corporate Development
Strategy Teams and R&D Heads
Procurement and Product Directors
Regulatory and Compliance Leaders
Investor Relations and Equity Analysts