Market Minds Advisory
United States Capital Exchange Ecosystem Market

United States Capital Exchange Ecosystem Market: Selling Information About Trades

Roughly 47% of consolidated equity volume never reaches a lit venue at all, and the venues themselves now earn most of their money selling data about trading rather than matching it.

Lead Analyst

Published

September 2026

Make Smarter Decisions with Customized Research Insights

Request a free sample report and evaluate market opportunities, growth trends, and competitive dynamics relevant to your business needs.

2025 MARKET VALUE$62.5BMarket Size 2025
2036 FORECAST VALUE$126.3BBase Case , 2026 to 2036
CAGR 2026 TO 20366.6 %Bull 7.8% / Bear 5.4%
INCREMENTAL OPPORTUNITY$59.6BNet 10- year value creation
EXPANSION MULTIPLE1.89x2036 value over 2026 base
Strategic Levers
M&A Pipeline
Regional Outlook
Country Rankings
Competitive Intelligence
Segmental Deep-dive
Call-Us : 91 93563 13602

Executive Snapshot and Market Trajectory

The venue is not where the trading happens. Around 47% of consolidated equity volume is internalised by wholesalers who pay brokers for the order flow, which means half the market never reaches an exchange at all. No other major market anywhere works like that.
Domestic activity carries 83% of value, far above the usual regional band, because this is a single-country market whose participants earn almost entirely at home. Market data and connectivity grows at 9.9%, half again the market rate of 6.6%, and it now supplies around 58% of exchange group revenue while matching trades supplies considerably less. The venue that matches a trade then sells the description of it for considerably more than that again.
Concentration reaches 63% and the contested regulation is about the price of information rather than the price of execution. Proprietary depth feeds cost roughly 42 times the public tape, and the rule intended to change that has been litigated and delayed for years without resolving anything. Delay has been worth more than the litigation costs, which is precisely why the litigation keeps going on year after year here.
Market Definition
The market covers revenue earned across United States capital market trading infrastructure, spanning market data and connectivity, index licensing and analytics, clearing and settlement services, wholesale market making and internalisation, exchange transaction and matching fees, and listings and issuer services. Asset management fees, brokerage commissions charged to end investors, investment banking underwriting and advisory revenue, proprietary trading profits unconnected to market making obligations, and cryptoasset venue revenue are excluded.
Base Year Value
$62.5B in 2025 (MMA Primary Research Dataset, August 2026)
Forecast Period
2026 to 2036, eleven discrete annual values
CAGR
6.6% base case. Bull 7.8%. Bear 5.4%.
Fastest Growth Segment
Market Data and Connectivity: 9.9% CAGR
Fastest Growth Country
Singapore: 8.6% CAGR
Fastest Growth Region
South Asia and Pacific: 8.8% CAGR
Largest Region
North America: 83% of 2025 global value
Market Leaders
Intercontinental Exchange, Nasdaq, Cboe Global Markets, Citadel Securities, DTCC. Source: MMA Analysis based on disclosed exchange, market data, clearing and wholesale market making revenue, company annual reports 2025.
Primary Survey
n=3,800 procurement and R&D decision-makers, Q4 2025, six countries
Methodology
Demand-side build-up, cross-validated against public data, 47 expert interviews

United States Capital Exchange Ecosystem Market Forecast Scenarios

us-capital-market-exchange-ecosystem-size-forecast-scenario-1787916059556
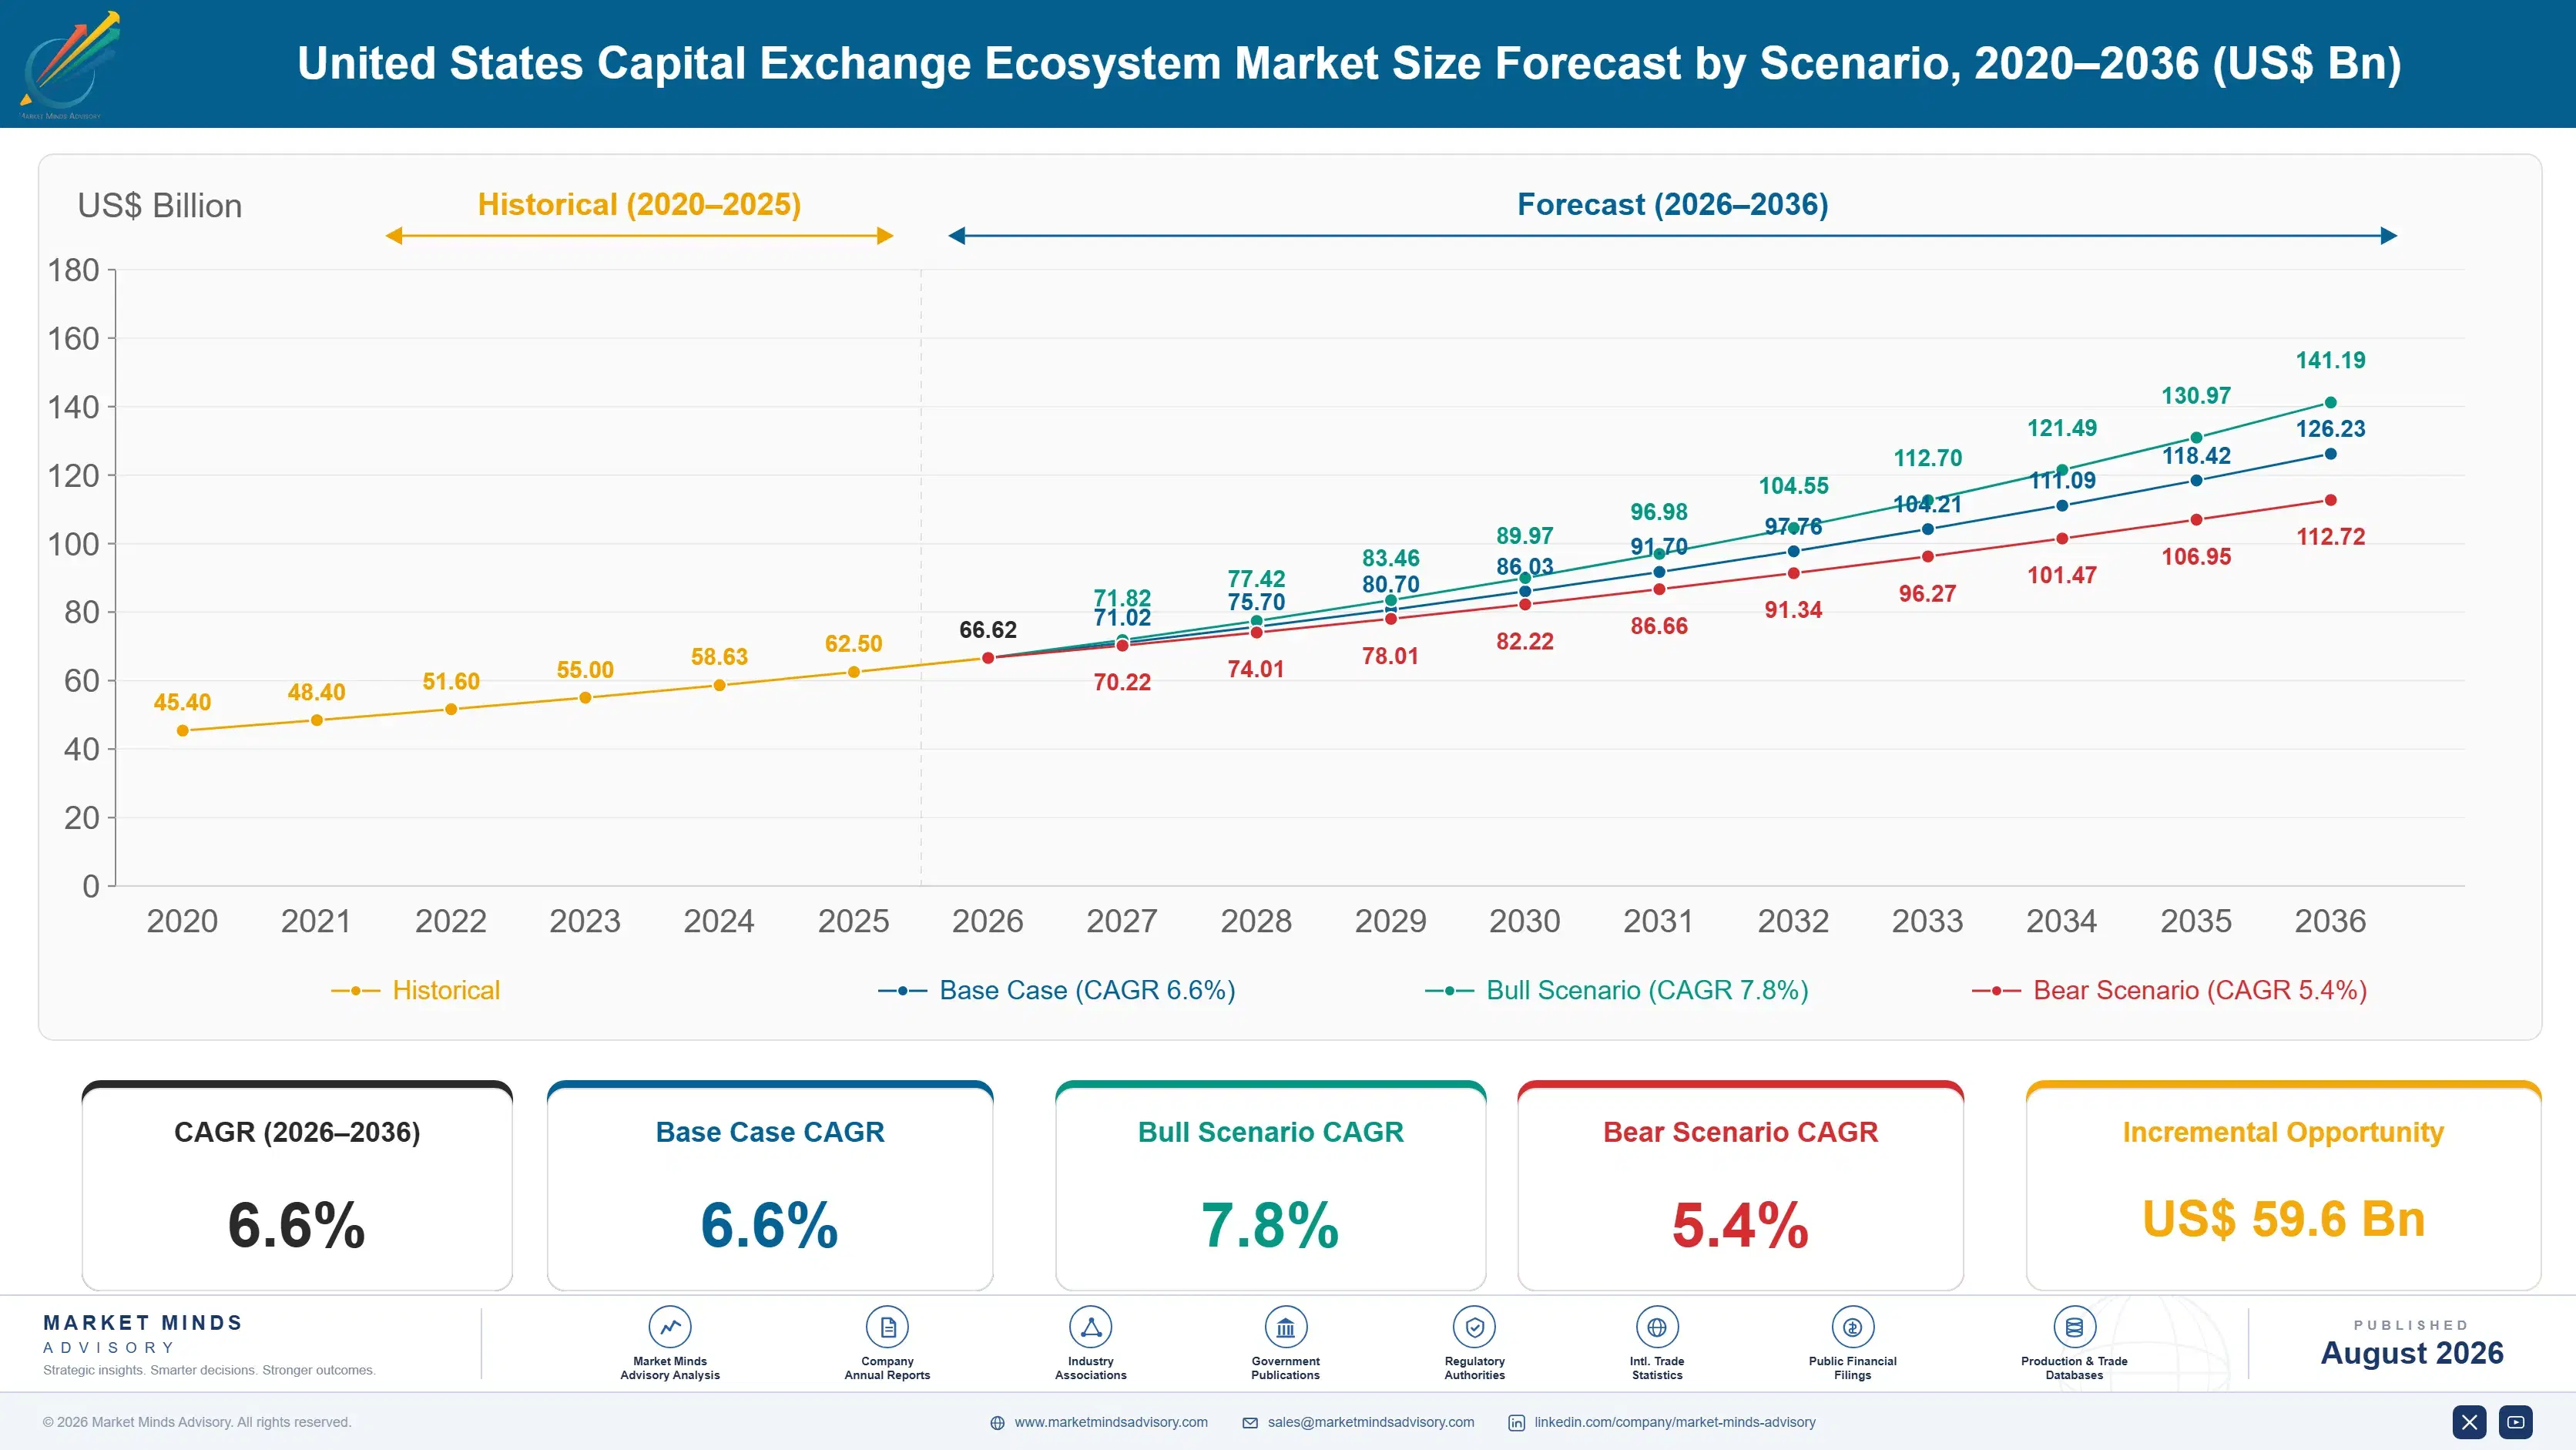
Growth from 2020 to 2025 ran at 5.4% and the composition shifted underneath it considerably. Retail participation surged and almost all of that flow went to wholesalers rather than to any exchange. Data and index revenue grew steadily while matching fees stagnated. Settlement moved to a single day in May 2024, which reduced clearing margin requirements while raising operational pressure on affirmation rates across the whole chain.
The 6.6% base case rests on three mechanisms. Market data and connectivity revenue keeps growing because every participant needs faster and deeper information and only the venues can sell it. Index licensing keeps compounding with the passive assets tracking those benchmarks. And clearing revenue keeps rising on volume even as the cycle shortens and margin requirements fall. None of the three depends on any trading volume whatsoever rising at all anywhere here either.
The bull case at 7.8% assumes volumes stay elevated and index-linked assets keep compounding against benchmarks the venues own. The bear case at 5.4% is data rulemaking finally taking effect and introducing competing consolidators alongside expanded tape content, which would attack the single most profitable revenue line these groups have and which they have litigated hard to prevent.

Half The Market Skips The Venue

Retail orders mostly do not reach an exchange. A broker routes marketable retail flow to a wholesaler who internalises it, provides price improvement against the public quote and pays the broker for the privilege of receiving it. Roughly 47% of consolidated volume executes away from lit venues on that basis. No other major market operates this way at this scale, and it has survived every reform attempt.
FIVE-FIRM CONCENTRATION63%Share of category revenue held by the largest participants
OFF-EXCHANGE VOLUME SHARE47%Consolidated trading never touching any lit venue anywhere
DATA REVENUE SHARE58%Group income from information rather than matching trades
SETTLEMENT CYCLE LENGTH1 dayInterval between trade date and final settlement now
DEPTH FEED PRICE MULTIPLE42Times the public tape cost for proprietary data
ACCESS FEE CAP0.001Dollars per share an exchange may charge takers
Exchanges are data companies that also happen to match trades. Around 58% of the major groups' revenue now comes from market data, connectivity, index licensing and technology rather than from transaction fees, and an access fee cap of 0.001 dollars per share limits what matching can earn in any case. Proprietary depth-of-book feeds cost roughly 42 times the public consolidated tape, which is the actual product.
The fight everybody watches is about information pricing. Rulemaking intended to expand consolidated tape content and introduce competing consolidators has been litigated and delayed for years, because it attacks the single most profitable line these groups hold. Meanwhile settlement moved to one day in May 2024, which cut clearing margin requirements meaningfully while pushing operational pressure onto affirmation rates that many participants had never measured.
"Everybody argues about payment for order flow and almost nobody argues about the market data bill, which is odd, because one of those is a few cents of price improvement and the other is a line item that has gone up every year for two decades."
Director, Market Infrastructure Practice · MMA Market Infrastructure and Trading Services Practice · August 2026

Market Trends

Information Pricing Outgrew Everything It Describes

Proprietary depth-of-book feeds cost roughly 42 times the public consolidated tape and every serious participant buys them, which makes market data and connectivity the fastest growing line at 9.9% while matching fees sit under an access cap of 0.001 dollars per share. The venue that matches the trade sells the description of it for considerably more than the execution earned. Nobody in this market finds that arrangement remarkable any longer. Litigation over that pricing has continued for years, which is a reliable indicator of exactly what the line is worth to somebody.
Market Impact: Compressed settlement to 1 day
Index Franchises Compound With Passive Assets

Index licensing revenue rises with the assets tracking each benchmark rather than with any trading activity, which makes it the most dependable line anywhere in this complex and the least dependent on volume. That segment grows at 8.4%. A listing brings the issuer into a benchmark, the benchmark attracts passive assets, and the licensing fee compounds long after whatever the listing itself earned has become entirely irrelevant to anybody. Exchanges compete for listings at fees that look almost irrelevant on their own precisely because of what arrives long afterwards instead.
Market Impact: Grows Singapore demand at 8.6%

Market Opportunities and Growth Drivers

Shorter Settlement Raises Operational Service Demand

Settlement moved to a single day in May 2024, which reduced central counterparty margin requirements substantially while compressing the window for allocation, affirmation and funding to almost nothing. That segment grows at 6.0%. Participants who had never measured affirmation rates discovered they needed to, and the infrastructure providers selling automation into that gap found demand arriving from firms that had ignored the topic entirely beforehand. Firms that had deferred automation for years quite deliberately found the decision made for them by a settlement cycle that simply does not accommodate any manual step.
Market Impact: Threatens 58% of group revenue

Asian Institutions Buy Depth Data And Connectivity

Institutions across Asia trading United States equities and derivatives buy the same proprietary feeds and colocation as domestic participants and pay the same prices, which makes international data revenue grow faster than domestic volume ever does. Singapore grows fastest at 8.6% as the regional hub for that consumption. Nothing about the product changes for those buyers, and neither does the price, which is the whole appeal of selling it. Selling the same thing to more buyers at the same price is the least complicated growth available anywhere in this business.
Market Impact: Caps fees at 0.001 dollars

Market Restraints and Challenges

The Data Rule Would Attack The Best Revenue Line

Rulemaking intended to expand consolidated tape content and permit competing consolidators has been litigated and delayed for years, precisely because it threatens the line supplying around 58% of exchange group revenue. Root cause is a genuine conflict between public price transparency and private data economics. Commercial impact would be immediate if implemented. Mitigation has been legal challenge and delay, which has worked so far and cannot work indefinitely. Every group here has concentrated its investment in the one line most exposed to a single adverse ruling arriving from a courtroom.
Market Impact: Prices data at 42 times tape

Matching Fees Are Capped And Nobody Expects Relief

An access fee cap of 0.001 dollars per share limits what an exchange may charge liquidity takers, which constrains the maker-taker economics venues have long used to purchase order flow from participants. Root cause is regulatory concern about rebate-driven routing. Commercial impact falls on transaction revenue specifically. Mitigation runs through data, index and technology services, which is exactly where every group has already moved its investment and attention. Buying order flow with rebates stopped working as an argument once regulators decided that was precisely what they wanted to constrain here.
Market Impact: Grows index licensing at 8.4%
3 additional market trends, 4 additional growth drivers, and 2 additional restraints and challenges are covered in the full report. Contact sales@marketmindsadvisory.com to access the complete intelligence.

Segment CAGR and Growth Architecture

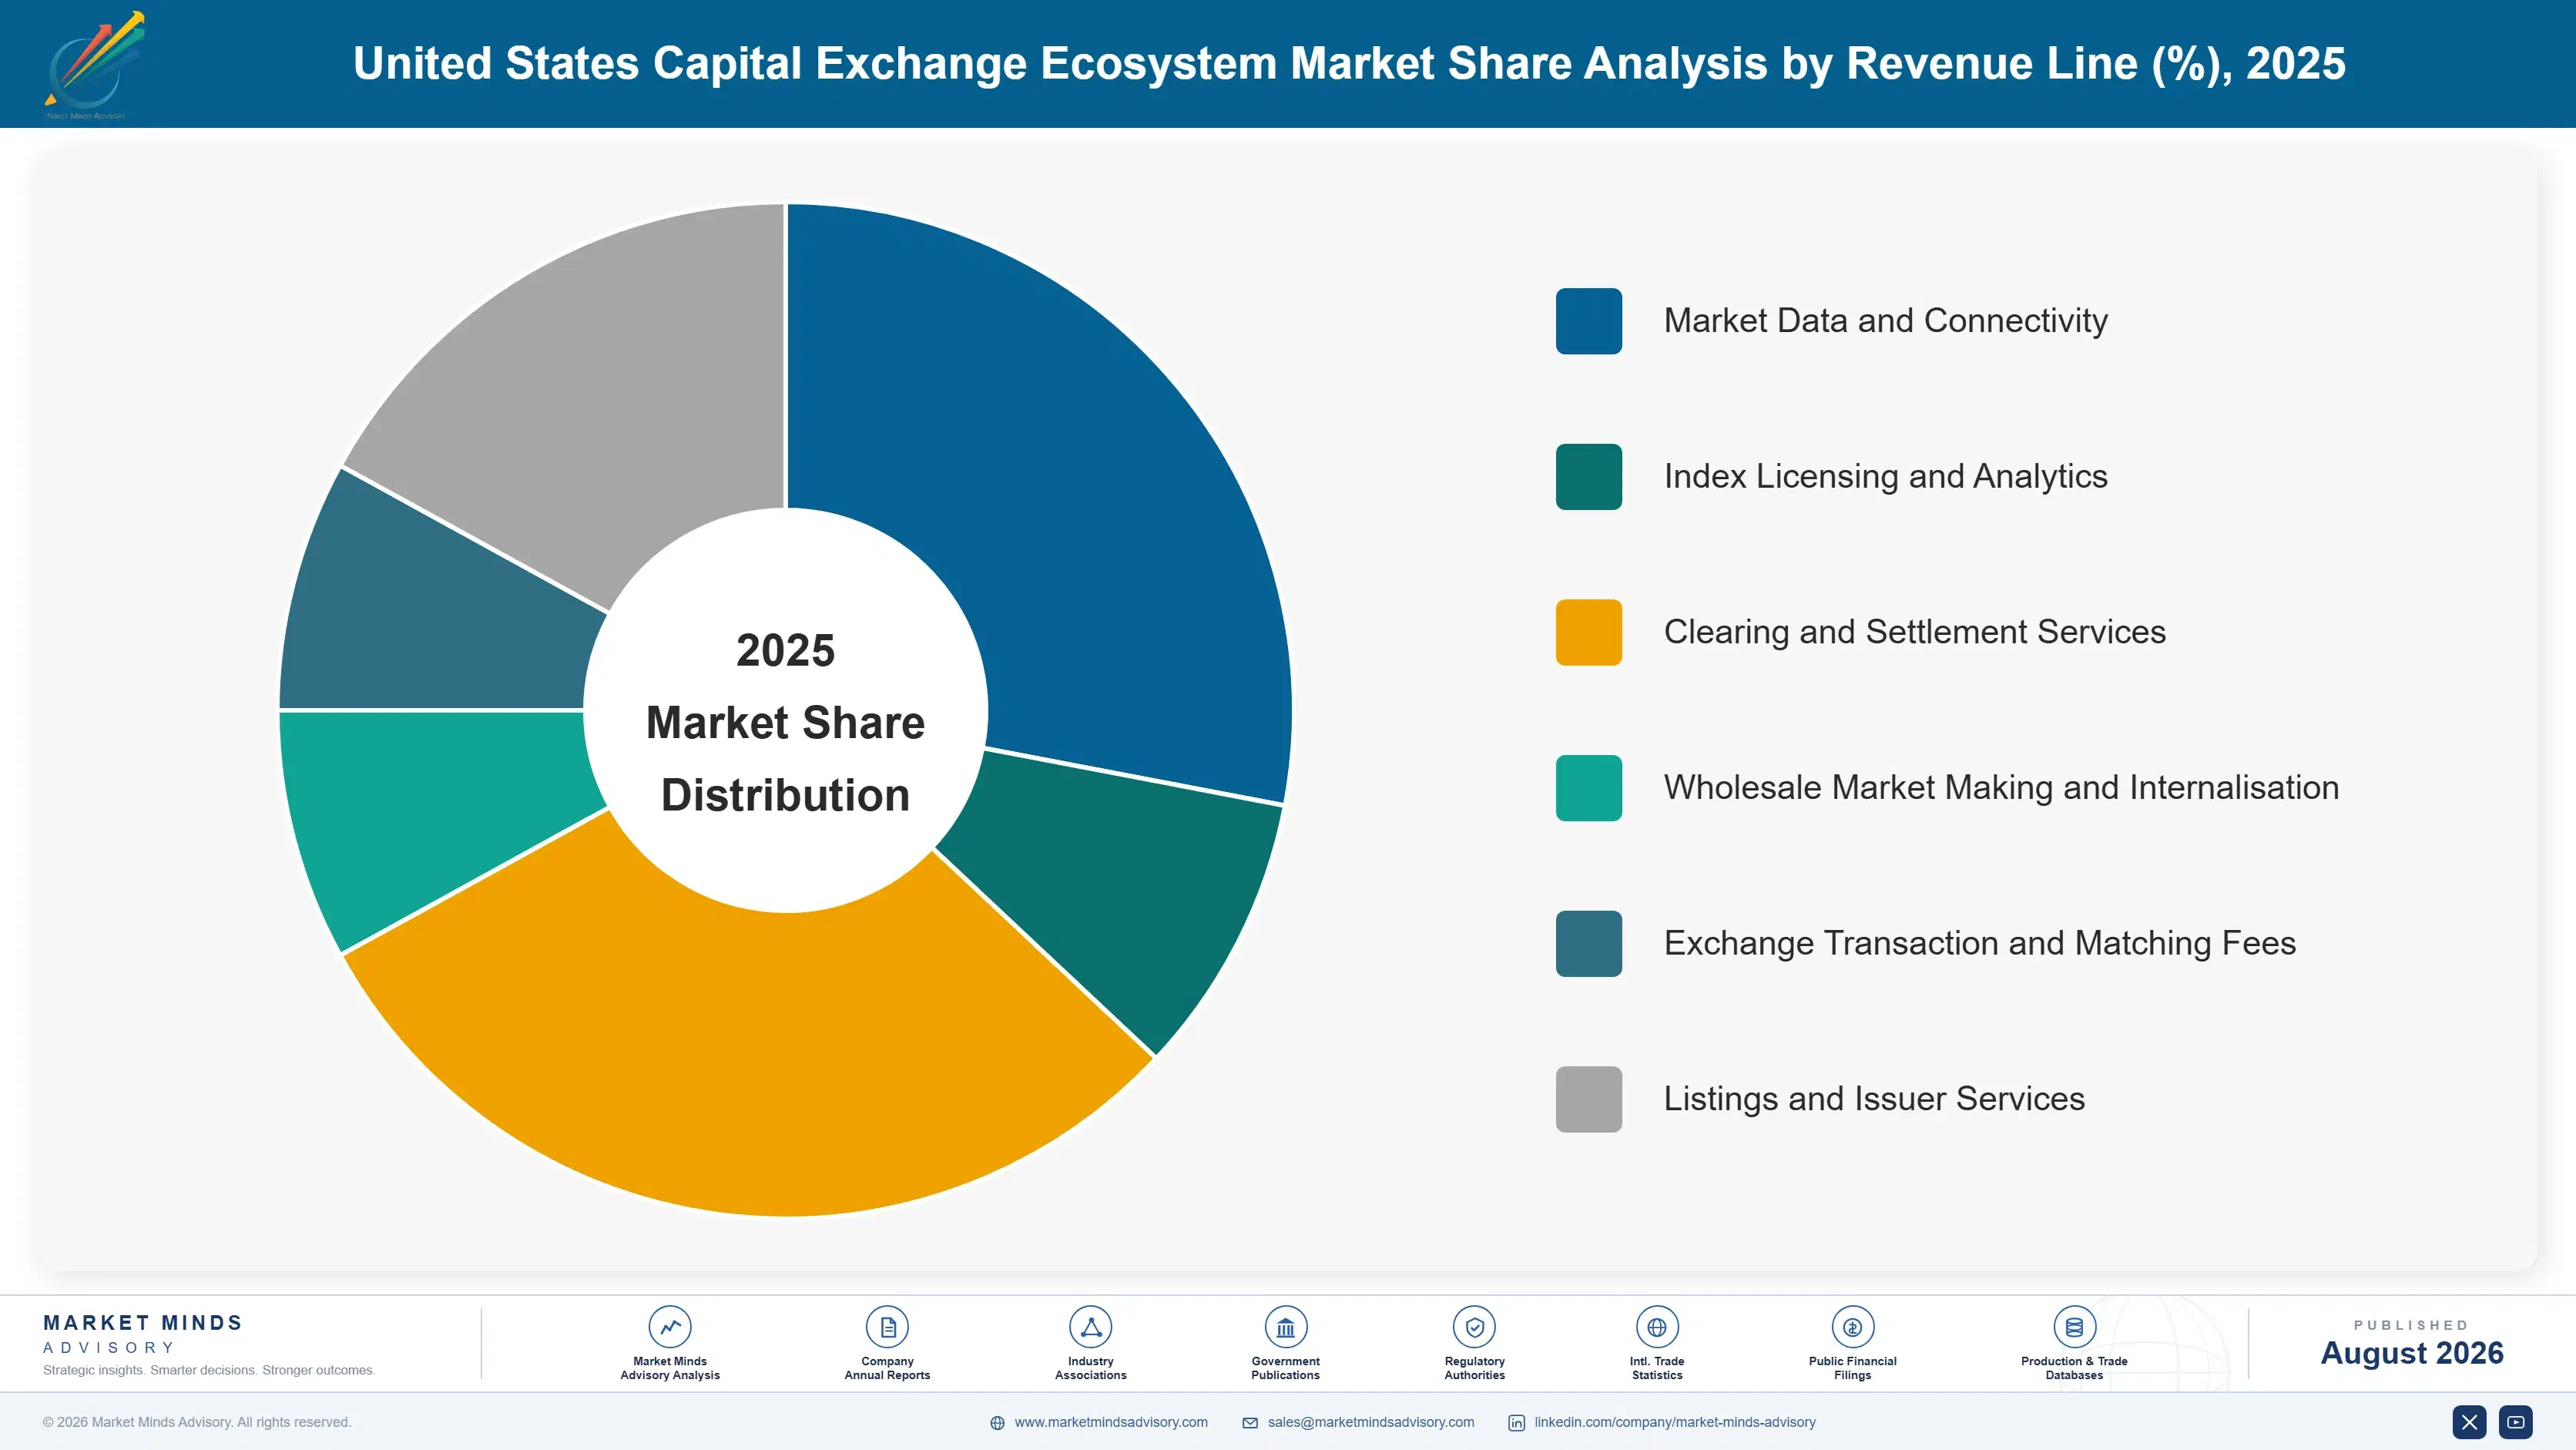
Segmentation follows revenue line, since growth driver, regulatory exposure and margin structure all differ by line rather than by asset class or participant type. Six categories cover the market without overlap. Asset class, participant type and venue are treated as separate commercial dimensions throughout this report rather than as segmentation logic in their own right.
us-capital-market-exchange-ecosystem-market-share-analysis-1787916060162

Market Data and Connectivity

Market data and connectivity grows at 9.9%, half again the market rate of 6.6%, and now supplies the largest part of exchange group revenue because proprietary depth feeds cost roughly 42 times the public tape and every serious participant buys them anyway. Matching the trade earns a capped fraction of a cent while describing it earns considerably more. Rulemaking aimed at that arrangement has been litigated for years, which tells you precisely how much the line is worth to whoever holds it. International institutions buy identical feeds at identical prices, which makes this the least complicated growth available anywhere in the whole complex and one that remarkably few groups pursue systematically.
CAGR 9.9%

Index Licensing and Analytics

Index licensing grows at 8.4% and rises with assets tracking each benchmark rather than with any trading volume at all, which makes it the most dependable revenue anywhere in this complex. A listing places an issuer in a benchmark, the benchmark attracts passive money, and the licensing fee compounds long after the listing revenue has stopped mattering to anybody. That sequence is why exchanges compete for listings at fees which look almost irrelevant on their own. Fund prospectuses name the benchmark and cannot be changed casually, which makes the licensing relationship considerably stickier than anything else in this complex and effectively impossible for a competitor to displace once it is established.
CAGR 8.4%
Full segment breakdown across 6 segments available in the complete report.

Regional Architecture and Country Demand Map

This is a single-country market and the distribution reflects where the revenue is actually earned, with outward exposure arising almost entirely through international data and connectivity consumption. Nothing here depends on where a buyer happens to sit, only on what they need to trade with.

North America

Share sits at 83%, far above the standard regional band, because this is a single-country market and essentially all revenue is earned here. That justification is definitional rather than analytical. Roughly 47% of consolidated volume executes away from lit venues through wholesaler internalisation, an arrangement that exists at this scale nowhere else. Access fee caps, tick size reform and the contested data rulemaking all apply here and shape every participant's revenue mix directly. Around 58% of exchange group revenue now comes from data, connectivity, index licensing and technology rather than from matching trades, which is a mix that no participant here would have predicted twenty years ago and none would now reverse.
Share: 83% | CAGR: 5.8% (2026 to 2036)

Western Europe

Share sits at 7%, far below the standard regional band, for the definitional reason applying to every non-domestic region here. European institutions trading United States securities buy the same proprietary feeds and colocation at the same prices as domestic participants, which is where the outward revenue arises. European market structure took a different path on payment for order flow, banning it outright, which makes the comparison a live argument in policy discussion on both sides. European institutions also license United States benchmarks heavily for products sold to European investors, which generates index revenue entirely disconnected from any trading those investors ever do in any of those American securities directly themselves. That gap is instructive.
Share: 7% | CAGR: 5.0% (2026 to 2036)
Regional intelligence for 5 additional markets available in the complete report: East Asia, South Asia and Pacific, Latin America, Middle East and Africa, Eastern Europe. Contact sales@marketmindsadvisory.com.
us-capital-market-exchange-ecosystem-country-cagr-analysis-1787916060690

Sell The Description, Not The Trade

Off-exchange volume runs at 47%, data supplies 58% of group revenue, depth feeds cost 42 times the tape and access fees are capped at 0.001 dollars. Four levers work on data products, index franchises, settlement services and international consumption rather than on matching volume, which regulation in this market has already capped for absolutely everybody.

Price Depth Data Against What It Replaces

Proprietary depth feeds already cost roughly 42 times the public tape and every serious participant buys them, because the public tape does not contain what anybody needs to trade competitively. Pricing against the alternative rather than against last year's schedule is what has driven this line to around 58% of group revenue. Rulemaking may eventually change the arrangement, and litigation has held it off for years already. Every participant objects publicly to each increase and every participant renews the subscription immediately afterwards, which is a negotiating position of no strength whatsoever.
Market Impact: Sustains a 42 times data pricing multiple properly

Convert Listings Into Index Franchise Value

Listing fees are almost irrelevant to revenue on their own, and a listing places an issuer into a benchmark that attracts passive assets and generates licensing income compounding for decades afterwards. That segment grows at 8.4%. Exchanges competing on listing price alone are optimising the smallest number in the sequence, while those competing on index inclusion and analytics are buying an annuity with a loss leader. Fund prospectuses name the benchmark and cannot be altered casually, which makes the resulting licensing relationship close to permanent once anybody has actually established it.
Market Impact: Builds toward an 8.4% growth licensing annuity stream

Sell Automation Into The Shortened Settlement Window

Settlement moved to a single day in May 2024, compressing allocation, affirmation and funding into a window that manual processes simply cannot meet reliably. Participants who had never measured affirmation rates discovered they had to. Infrastructure providers selling automation into that gap reached firms that had ignored the topic entirely, and the demand arrived from compliance obligation rather than from any efficiency argument anybody made. Reported affirmation rates show a persistent group still falling short, which identifies the buyers precisely and saves anybody selling into that gap a great deal of prospecting.
Market Impact: Serves the new 1 day settlement window properly

Grow International Data Consumption Quite Deliberately

Institutions abroad buy identical proprietary feeds and colocation at identical prices, which makes international data revenue grow faster than domestic volume without requiring any product change whatsoever. Singapore grows fastest at 8.6% as the regional aggregation point. Selling the same thing to more buyers at the same price is the least complicated growth available anywhere in this business, and remarkably few groups pursue it systematically. Institutions abroad already pay full price through intermediaries who hold the relationship, which means the revenue arrives without the venue knowing who is actually consuming any of it.
Market Impact: Grows the overseas data demand at 8.6% annually

Who Controls the Margin Pool

Measured on disclosed exchange, market data, clearing and wholesale market making revenue, the five largest participants hold a CR5 of 63%, which is high and reflects genuine infrastructure concentration rather than any competitive failure. Intercontinental Exchange and Nasdaq carry the largest listing and data franchises, Cboe Global Markets holds substantial derivatives and data positions, Citadel Securities dominates wholesale internalisation, and DTCC operates clearing as a single utility for essentially everybody. Nobody outside that group holds both a benchmark franchise and a lit venue at meaningful scale.
Three contests define activity. Venues compete for lit volume under a capped fee structure. Wholesalers compete for retail order flow on price improvement. Data providers compete on latency and depth rather than on price. Each of those three rewards a completely different capability, and only two participants compete seriously in more than one.

Pressure builds from newer venues and from rulemaking aimed squarely at data economics. Rankings shift toward whoever owns benchmarks and information rather than whoever matches the most shares. Market share in matching has stopped explaining revenue, since the fee attached to each matched share is capped at a tenth of a cent.
us-capital-market-exchange-ecosystem-company-positioning-matrix-1787916061218

Competitive Moat and Risk Dimensions

INTERCONTINENTAL EXCHANGE

Moat: Data Franchise Across Asset Classes

Owning benchmark data, pricing services and connectivity across equities, fixed income, energy and mortgage markets produces revenue that rises with assets and usage rather than with trading volume, which is a considerably better shape than matching fees have ever been. Assembling comparable breadth would require acquiring several businesses that are no longer available at any price anybody would pay.
INTERCONTINENTAL EXCHANGE

Risk: Data Rulemaking Directly Targets This

The most profitable revenue line is precisely what expanded consolidated tape content and competing consolidators would attack, and litigation has delayed rather than defeated that rulemaking. A structure built on information pricing is exposed to a decision about information pricing. No operational improvement addresses a regulatory outcome of that kind.
CITADEL SECURITIES

Moat: Internalisation Scale And Price Improvement

Handling a very large share of retail order flow produces the volume that makes price improvement economics work, and brokers route to whoever can offer the best combination of improvement and payment consistently. That scale is self-reinforcing, since more flow supports better quotes which attract more flow. Building comparable capability requires the flow nobody will route first.
CITADEL SECURITIES

Risk: Order Flow Rulemaking Exposure

The arrangement supplying the business has been the subject of repeated reform proposals including order competition requirements that would force retail flow into auctions. Those proposals have stalled rather than disappeared. A business built on a routing practice is exposed to any decision about that routing practice being taken elsewhere.

Players Tracked

Prominent Players

Intercontinental Exchange
Nasdaq
Cboe Global Markets
Citadel Securities
DTCC

Other Key Players

Virtu Financial
Jane Street
Susquehanna International Group
IEX
MEMX
MIAX
Charles Schwab
LSEG
MSCI
FTSE Russell
FactSet
Options Clearing Corporation
Tradeweb
MarketAxess
Robinhood Markets

Recent Developments

FEBRUARY 2025

Exchange group raises proprietary depth feed pricing again

An exchange group increased pricing on proprietary depth-of-book market data feeds and connectivity services for the following year. This was a commercial pricing decision rather than any regulatory development, and participants objected publicly while continuing to purchase all the feeds regardless of the increase anyway.
Signal: Objecting loudly and then buying anyway is the long established pattern right across this whole line.
JUNE 2025

Affirmation rate reporting shows continued gaps after cycle change

Industry reporting on trade affirmation rates showed a persistent group of participants falling short of the levels the shortened settlement cycle requires. This was operational performance data rather than any enforcement action, and it identified demand for automation among firms that had assumed manual processes would suffice.
Signal: A shortened cycle exposed manual processes that nobody had previously needed to examine at all before.
OCTOBER 2025

Court proceedings continue over consolidated tape rulemaking

Litigation over rulemaking that would expand consolidated tape content and permit competing consolidators continued without resolution. This was a legal proceeding rather than any implementation step, and the delay preserves the pricing arrangement supplying most exchange group revenue for a further and quite uncertain period.
Signal: Delay here is worth considerably more than the litigation costs, which is exactly why it continues.

Technology, Compliance, Clearing

Three costs consume revenue here. Technology infrastructure with colocation and network capacity, regulatory compliance and surveillance operations, and clearing member obligations with personnel together account for 52 to 68% of revenue at a typical participant. Technology dominates because latency is competitive rather than merely operational, and a venue or wholesaler falling behind on speed loses flow immediately rather than gradually over any period at all.
Two regulatory changes moved the position. Settlement moved to a single day in May 2024, which reduced central counterparty margin requirements meaningfully while raising operational cost across affirmation and funding processes, and Securities and Exchange Commission rulemaking materials document both effects. Access fee caps and tick size reform then compressed matching economics. Intercontinental Exchange Annual Report 2024 and Nasdaq Annual Report 2024 disclosures describe the resulting revenue mix.

Exposure divides by revenue mix rather than by operating efficiency. Participants earning mostly from data, index licensing and technology carry costs that scale with usage and revenue that scales with assets, which is a comfortable combination. Those earning mostly from matching carry the same technology burden against fees a regulator has capped. That difference explains almost every strategic decision taken across this industry over the past decade.
us-capital-market-exchange-ecosystem-cost-volatility-analysis-1787916061441

Shift revenue mix toward assets rather than volume

Matching fees are capped at 0.001 dollars per share while index licensing rises with assets tracking a benchmark regardless of any trading activity. Building or acquiring benchmark franchises costs capital and the attractive ones are largely unavailable now. It converts revenue that depends on volume into revenue that depends on accumulated assets instead entirely.

Defend data pricing through demonstrated content value

Proprietary depth feeds cost roughly 42 times the public tape and rulemaking has targeted that gap repeatedly without succeeding so far. Demonstrating what the proprietary content contains that the tape does not is a stronger long-term position than litigation alone. Litigation delays and evidence persuades, and only one of those two survives an eventual adverse ruling.

Automate settlement processes before enforcement arrives

A single day cycle compresses allocation, affirmation and funding into a window manual processes cannot reliably meet, and reported affirmation rates show a persistent group falling short. Automating costs system investment that firms deferred for years quite deliberately. It removes an operational exposure that will attract supervisory attention rather than merely inconvenience anybody involved.

Portfolio Architecture for Margin Defence

Margin follows whether revenue scales with assets or with volume. Exchange transaction and matching fees earn least, capped at 0.001 dollars per share against a heavy technology burden. Listings earn modestly and matter for what follows them. Clearing and settlement earn reasonably as a regulated utility. Wholesale market making earns well on internalisation scale. Index licensing earns better on assets rather than activity. Market data and connectivity earn best, on information nobody can obtain elsewhere.
The tension is that the best business is the most exposed to a single regulatory decision. Data and connectivity supply around 58% of exchange group revenue and are precisely what expanded tape content and competing consolidators would attack, which is why the rulemaking has been litigated for years rather than implemented. Every group has concentrated its investment in the line most vulnerable to one adverse ruling arriving from a courtroom.

High-value pools sit in three places. Proprietary data and connectivity, where the content genuinely cannot be obtained anywhere else at any price. Index franchises, which compound with passive assets and require no trading activity whatsoever. And international data consumption, which sells an identical product to more buyers at an identical price without additional work.

Volume / Commodity-Adjacent

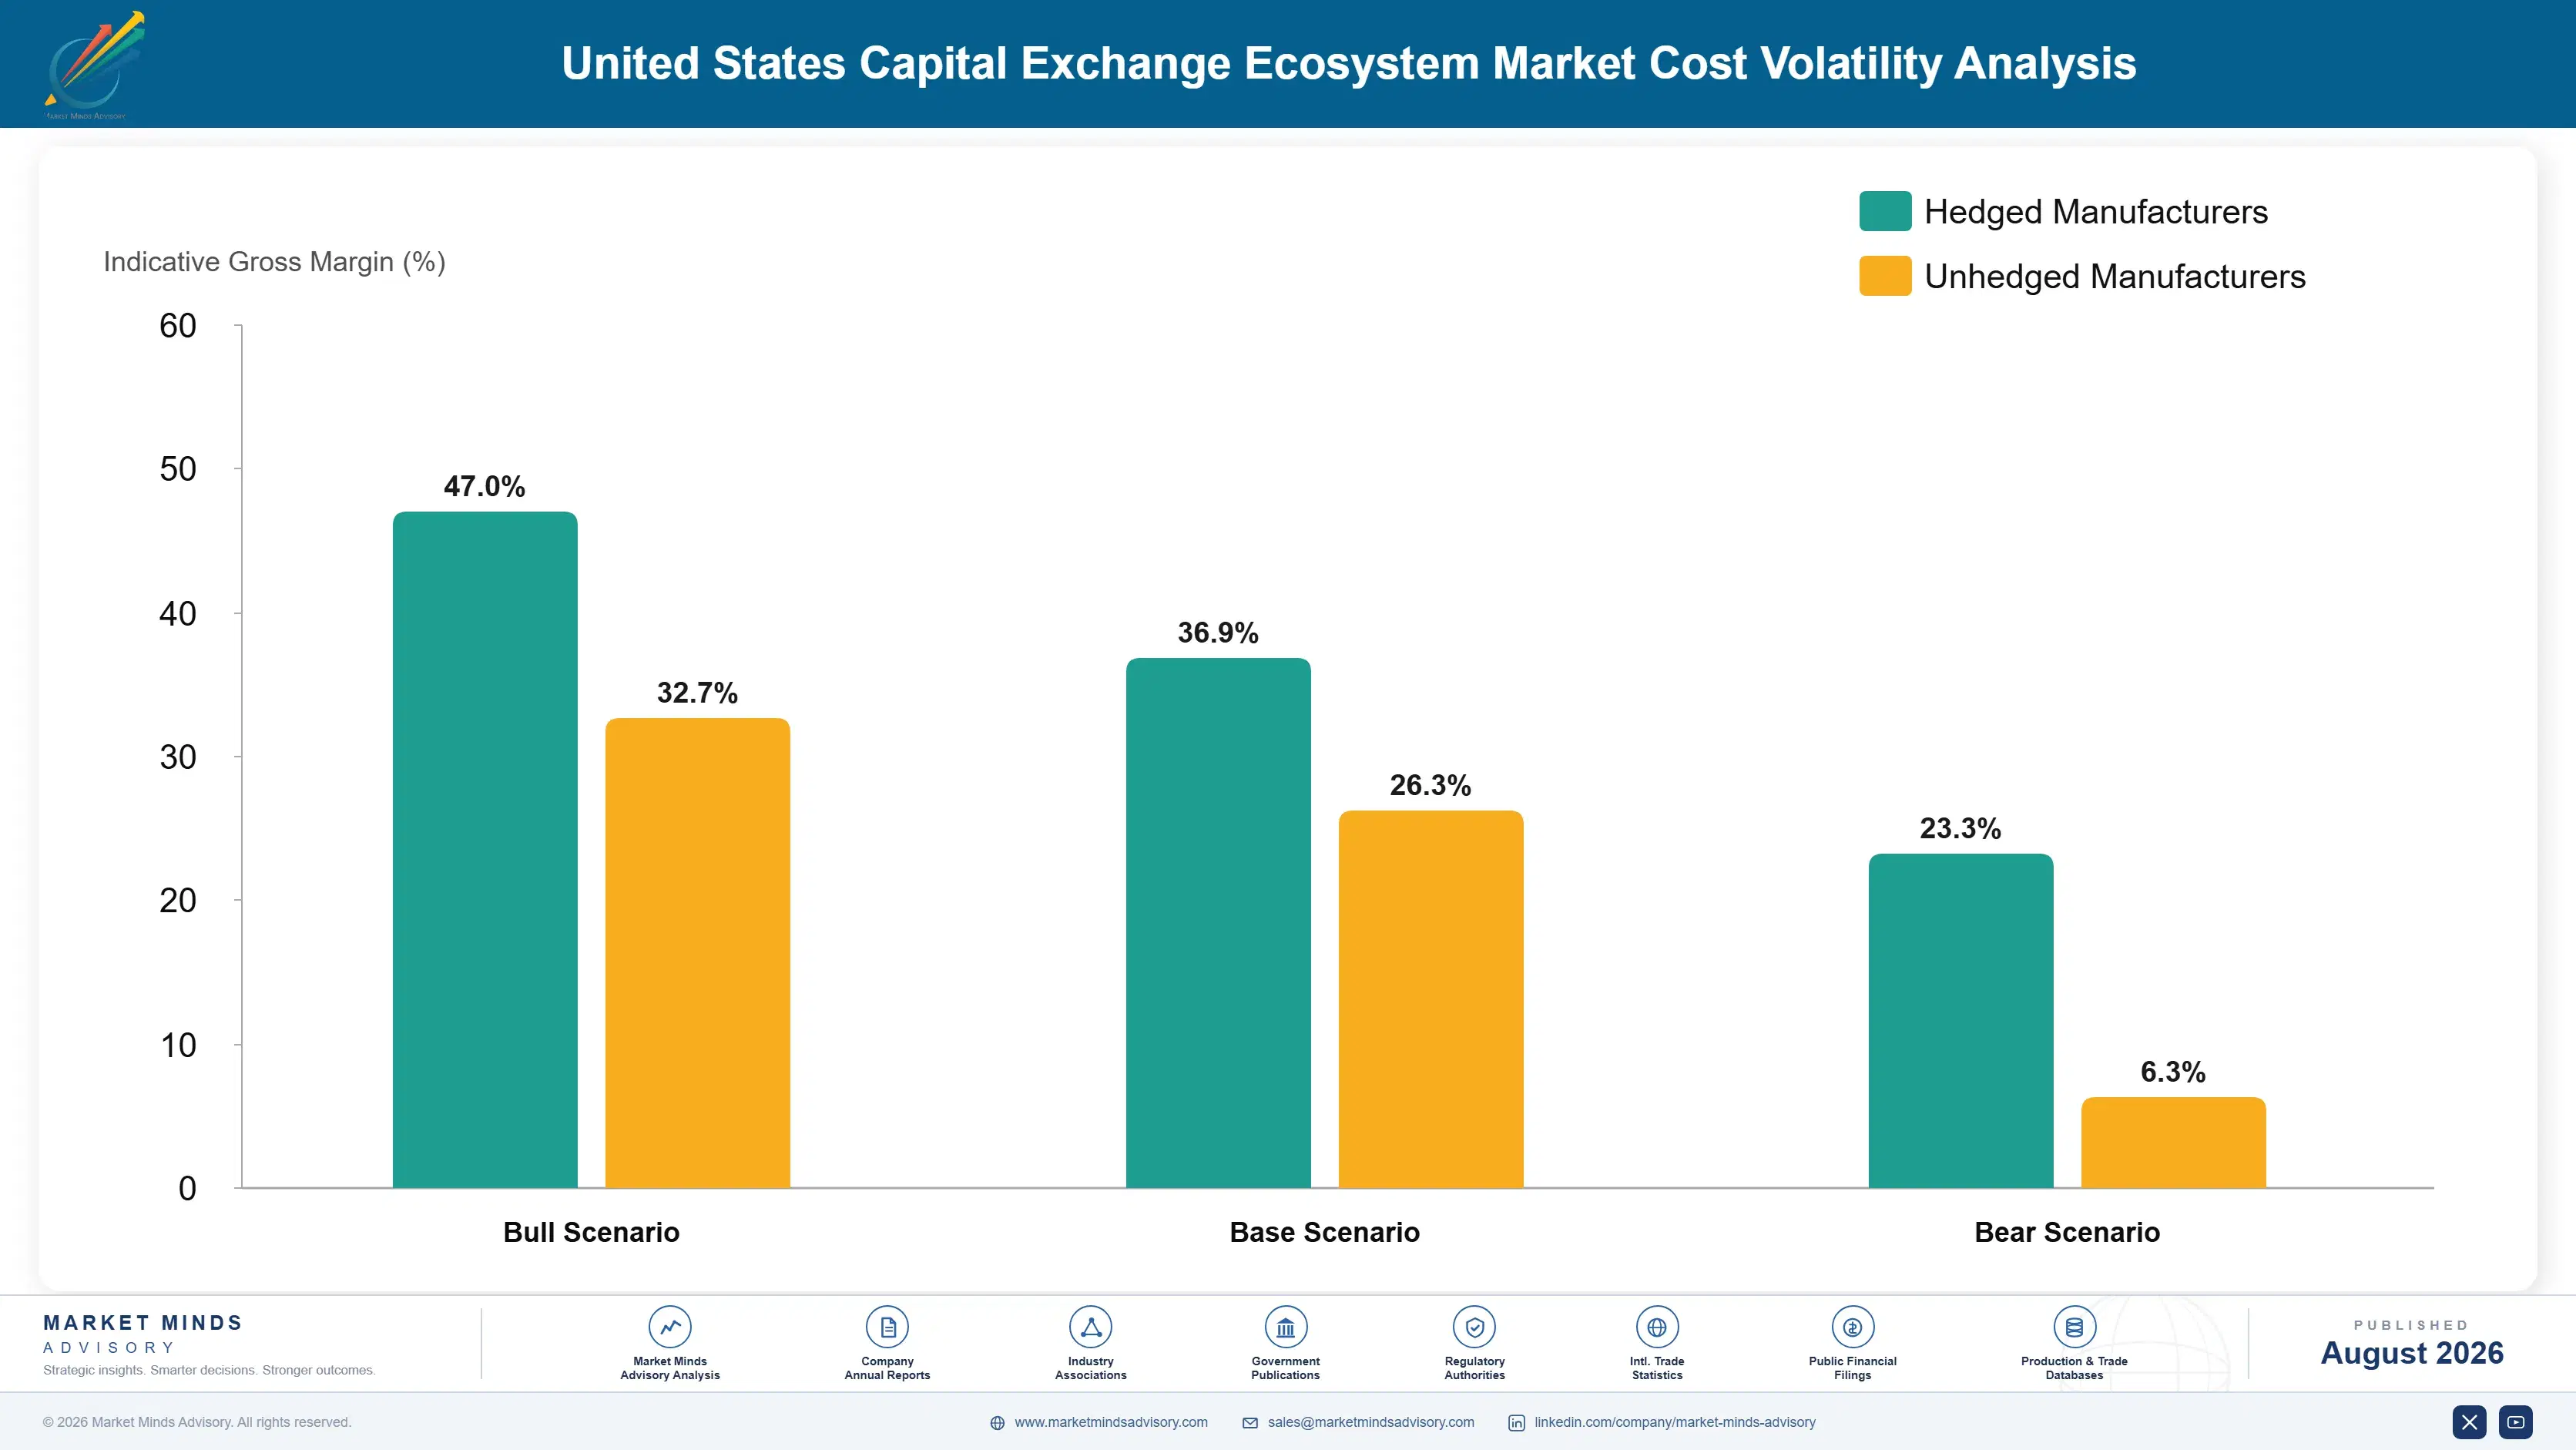
Exchange matching and listings revenue operating under capped fees and competitive pricing pressure. The 12-point range separates venues with meaningful market share and technology scale from smaller venues carrying similar cost against far less volume.
Gross Margin: 12-24%

Premium / Certified

Clearing, settlement and wholesale market making earning on utility position or internalisation scale respectively. The 16-point spread reflects how differently regulated utility economics and competitive internalisation margins behave across a cycle.
Gross Margin: 28-44%

Sustainability / Regulatory / Next-Generation

Market data, connectivity and index licensing where content exclusivity and asset-linked fees produce the strongest economics available. The 24-point range is wide because data pricing and index licensing scale on entirely different underlying drivers.
Gross Margin: 48-72%
us-capital-market-exchange-ecosystem-portfolio-architecture-1787916062050

High-value Sub-segments and Strategic Watch-out

Proprietary Data And Connectivity

Highest margin and fastest growth at 9.9%, protected by content that genuinely cannot be obtained anywhere else at any price by anybody. The risk is that expanded tape rulemaking eventually survives litigation and attacks this line directly. And litigation only ever delays that particular outcome.
Gross Margin: 60-72%

Index Licensing Franchises

Excellent economics rising with assets tracking each benchmark rather than with any trading activity at all. The risk is that benchmark competition and fee pressure from very large passive managers erode licensing rates over time. And the very largest passive managers all negotiate extremely hard.
Gross Margin: 52-66%

Exchange Matching Volume

The volume core, capped at 0.001 dollars per share and carrying the technology burden that everything else runs on. Venues hold it because it generates the data, not because matching itself earns anything worth defending. The data is really what all of it actually produces.
Gross Margin: 14-26%

Single Rulemaking Exposure

The strategic watch-out. Around 58% of group revenue depends on an arrangement that one adverse ruling could reshape entirely. The risk is that litigation delays an outcome rather than preventing it forever. And delay is simply not the same thing at all as any prevention.
Gross Margin: 30-42%

Nobody Can Stop Buying

Annuity characteristics here are close to absolute and almost entirely non-discretionary. A trading firm cannot compete without the fastest feeds, an asset manager cannot track a benchmark without licensing it, and no participant can settle a trade outside the single clearing utility. Demand does not vary with market conditions in any way that matters. Volumes vary, and the data and index revenue underneath them barely notices what volumes are doing at all.
Stickiness varies by how substitutable the input is. Market data is effectively unsubstitutable, since the content exists in one place and participants object to the price while continuing to pay it every year. Index licensing is sticky through fund prospectuses that name the benchmark and cannot be changed casually. Matching venue selection is the least sticky of all, since routing decisions change on economics within a day.

The buyer has professionalised and organised considerably. Market data costs once sat unexamined in technology budgets and now have dedicated management functions negotiating them across whole firms. Industry associations coordinate objections to pricing increases and have become considerably more effective at documenting them. That organisation has not reduced anybody's bill, and it produced the evidence regulators now cite.
us-capital-market-exchange-ecosystem-end-use-penetration-index-1787916062562

Information Beats Execution

These are among the four positions where our research anticipates prominent divergence between winners and laggards over the coming forecast period. Each is grounded in the demand model, the regulatory perimeter, and the announced capacity pipeline.
01 / DATA PRICING DEFENCE

Every participant objects and every participant pays

Proprietary depth feeds here cost roughly 42 times the public consolidated tape and yet every serious participant purchases them anyway, because the public tape simply does not contain any of what anybody needs in order to go and trade competitively at all. That single arrangement supplies around 58% of all exchange group revenue. Rulemaking has attacked that repeatedly and litigation has so far delayed rather than defeated that effort, which tells you precisely what the line is actually worth to somebody.
02 / INDEX FRANCHISE BUILDING

The listing fee was never the point of listings

Listing fees here are almost entirely irrelevant to revenue in their own right, and yet a listing places that issuer into a benchmark which then attracts passive assets and goes on generating licensing income compounding for decades afterwards without any trading whatsoever. That whole segment now grows at 8.4% every year. Exchanges that compete on listing price alone are optimising the smallest number anywhere in the whole sequence, while those competing on index inclusion are quietly buying themselves an annuity.
03 / SETTLEMENT AUTOMATION SELLING

One day left no room for anybody's manual process

Settlement here moved to a single day during May 2024, compressing allocation, affirmation and funding down into a window that any manual process simply cannot meet reliably at any scale at all. Participants who had never once measured any of their affirmation rates discovered rather abruptly that they now needed to. Providers who sell automation into that gap reached firms which had ignored the whole topic entirely, and the demand arrived from obligation rather than from any efficiency argument at all.
04 / INTERNATIONAL CONSUMPTION GROWTH

The same product sold to more buyers

Institutions abroad purchase entirely identical proprietary feeds and colocation arrangements at identical prices to domestic participants, which makes international data revenue grow considerably faster than any domestic trading volume without requiring a single product change at all. Singapore grows fastest of anywhere at all at 8.6% as the main regional aggregation point. Selling exactly the same thing to yet more buyers is the least complicated growth available anywhere in this whole business, and yet remarkably few groups pursue it systematically.

Engagement Snapshot From the Field

A live engagement with an industry participant carrying material or product regulatory and market exposure ahead of a defining policy shift, showing how our research translates into a defensible multi-year portfolio strategy.
MARKET MINDS ADVISORY · CLIENT ENGAGEMENT SUMMARY
United States Capital Exchange Ecosystem Producer Strategic Portfolio Review and Transition Roadmap 2026·Investment Scenario on United States Capital Exchange Ecosystem Exposure Evaluation 2025-26
CLIENT PROFILE
A United States exchange operator with reported revenue of 780 million dollars across matching, data and listings (client-reported, unverified by MMA). Roughly 54% came from transaction fees operating under the access fee cap. Index licensing was minimal, international data sales were handled reactively and no dedicated function existed to pursue any overseas consumption at all.
STRATEGIC CHALLENGE
Transaction revenue had stagnated under capped fees while competitors reported growing data and index income, and market share in matching had drifted downward across three years. Management proposed rebate increases to buy back lit volume. That competed for share in the one revenue line regulation had already capped, using the mechanism regulators had explicitly moved to constrain.
MMA APPROACH
MMA rebuilt revenue by line separating volume-linked from asset-linked income, then modelled international data consumption against comparable groups. Twenty-five expert interviews with trading firms, data management heads, index users and former regulatory staff established where pricing power genuinely sits. The analysis treated data product development and international sales as the routes available rather than rebate competition.
KEY FINDINGS
  1. Transaction revenue had been flat for three years under the fee cap while data revenue grew steadily, and no internal report separated the two growth rates clearly.
  2. International institutions were buying feeds through intermediaries at full price, which meant the operator earned the revenue without holding any relationship at all.
  3. No index franchise existed despite a listings base that would have supported one, and competitors had built comparable franchises from smaller starting positions.
  4. Rebate increases modelled against realistic share gains produced negative contribution in every scenario tested, since the capped fees limited any recovery entirely.
CLIENT PROFILE
A United States exchange operator with reported revenue of 780 million dollars across matching, data and listings (client-reported, unverified by MMA). Roughly 54% came from transaction fees operating under the access fee cap. Index licensing was minimal, international data sales were handled reactively and no dedicated function existed to pursue any overseas consumption at all.
STRATEGIC CHALLENGE
Transaction revenue had stagnated under capped fees while competitors reported growing data and index income, and market share in matching had drifted downward across three years. Management proposed rebate increases to buy back lit volume. That competed for share in the one revenue line regulation had already capped, using the mechanism regulators had explicitly moved to constrain.
MMA APPROACH
MMA rebuilt revenue by line separating volume-linked from asset-linked income, then modelled international data consumption against comparable groups. Twenty-five expert interviews with trading firms, data management heads, index users and former regulatory staff established where pricing power genuinely sits. The analysis treated data product development and international sales as the routes available rather than rebate competition.
KEY FINDINGS
  1. Transaction revenue had been flat for three years under the fee cap while data revenue grew steadily, and no internal report separated the two growth rates clearly.
  2. International institutions were buying feeds through intermediaries at full price, which meant the operator earned the revenue without holding any relationship at all.
  3. No index franchise existed despite a listings base that would have supported one, and competitors had built comparable franchises from smaller starting positions.
  4. Rebate increases modelled against realistic share gains produced negative contribution in every scenario tested, since the capped fees limited any recovery entirely.
RECOMMENDED STRATEGY
Phase 1: Phase one: establish direct international data sales relationships, since those buyers already pay full price through intermediaries holding the relationship. Phase 2: Phase two: build an index franchise from the existing listings base, since licensing revenue compounds with assets rather than volume. Phase 3: Phase three: abandon rebate competition, since capped fees make share bought that way genuinely unrecoverable in every single modelled scenario.
OUTCOME
Direct international sales relationships were established in three markets and grew faster than domestic revenue (client-reported, unverified by MMA). An index franchise was launched from the listings base. Rebate increases were cancelled. The share recovery plan was replaced entirely, having proposed buying volume in the one line where regulation had capped what it could ever earn.

Frequently Asked Questions

Foundational context covering the market sizes, CAGR, scope, country, region and competition that inform every finding below. This section is provided to cover basics and most often pre-purchase conversations, answered from the MMA Primary Research Dataset.

What is the current size of the United States Capital Exchange Market?

The market was worth 62.5 billion dollars in revenue in 2025, across data, index licensing, clearing, wholesale market making, matching fees and listings. It reaches 66.63 billion dollars in 2026.

How large will the United States Capital Exchange Market be by 2036?

MMA forecasts 126.26 billion dollars by 2036, an increase of 59.63 billion dollars over the 2026 base. That represents an expansion multiple of 1.89 times across the forecast period.

What is the CAGR for the United States Capital Exchange Market 2026 to 2036?

The base case compounds at 6.6% annually. The bull case reaches 7.8% if volumes stay elevated and index assets compound, while the bear case sits at 5.4% on data rulemaking taking effect.

Which segment is growing fastest?

Market data and connectivity, at 9.9%, half again the market rate of 6.6%. Proprietary depth feeds cost roughly 42 times the public tape and everybody buys them.

Who are the major companies in the United States Capital Exchange Market?

Intercontinental Exchange, Nasdaq, Cboe Global Markets, Citadel Securities and DTCC lead on disclosed revenue. Concentration reaches 63%, reflecting genuine infrastructure concentration rather than competitive failure.

Which country is growing fastest?

Singapore at 8.6%, functioning as the regional hub where Asian institutions aggregate United States market data consumption and colocation arrangements for the wider region as a whole.

Report Segmentation Architecture

The full report scope spans multiple orthogonal segmentation dimensions, with cross-tabulated demand data provided for each dimension pair. Coverage extends further to regional breakdowns, trend trajectories, and the competitive detail needed to support segment-level decision-making.

By Revenue Line

  • Market Data and Connectivity
  • Index Licensing and Analytics
  • Clearing and Settlement Services
  • Wholesale Market Making and Internalisation
  • Exchange Transaction and Matching Fees
  • Listings and Issuer Services

By End-Use Industry

  • Asset Management and Passive Funds
  • Retail Brokerage Platforms
  • Proprietary Trading Firms
  • Investment Banks and Dealers
  • Hedge Funds and Alternative Managers
  • Corporate Issuers

By Commercial Dimension

  • Direct Data Subscription Contracts
  • Redistributor and Vendor Licensing
  • Colocation and Connectivity Services
  • Index Licensing Agreements
  • Clearing Membership Arrangements
  • Order Flow Routing Agreements

By Region

  • North America
  • Western Europe
  • East Asia
  • South Asia and Pacific
  • Latin America
  • Middle East and Africa
  • Eastern Europe

Scope, Methodology, and Coverage

Every figure in this report is reproducible from documented input assumptions. The scope below maps the historical period, the forecast horizon, the segmentation dimensions, and the countries covered, alongside the underlying primary and qualitative methodology.
Historical Period
2020 to 2025
Forecast Period
2026 to 2036
Base Year
2025 (USD billions; MMA Primary Research Dataset, August 2026)
Market Definition
Scope covers revenue earned across United States capital market trading infrastructure, spanning market data and connectivity including proprietary depth feeds and colocation, index licensing and analytics, clearing and settlement services provided by central counterparties and depositories, wholesale market making and internalisation of retail order flow, exchange transaction and matching fees, and listings and issuer services. Asset management and advisory fees earned on client portfolios, brokerage commissions charged to end investors, investment banking underwriting and advisory revenue, proprietary trading profits unconnected to any market making obligation, cryptoasset venue and custody revenue, and market data revenue earned by non-United States venues are excluded from the market size and all derived figures.
Quantitative Units
USD billions of revenue (current prices); consolidated share volume in billions; off-exchange volume share as percentage; data feed pricing multiples against the public tape; access fees in dollars per share
Segmentation Dimensions
By Revenue Line; By End-Use Industry; By Commercial Dimension; By Region
Regions Covered
North America, Western Europe, East Asia, South Asia and Pacific, Latin America, Middle East and Africa, Eastern Europe
Countries Covered
USA, with outward consumption analysed across UK, Singapore, Japan, Hong Kong, Germany, Switzerland, Australia, Canada, South Korea, Netherlands, Brazil, UAE, India, Ireland, Poland
Key Companies Profiled
Intercontinental Exchange, Nasdaq, Cboe Global Markets, Citadel Securities, DTCC, Virtu Financial, Jane Street, Susquehanna International Group, IEX, MEMX, MIAX, Charles Schwab, LSEG, MSCI, FTSE Russell, FactSet, Options Clearing Corporation, Tradeweb, MarketAxess, Robinhood Markets
Quantitative Methodology
Primary survey, n=3,800 respondents, Q4 2025, six countries; demand-side model with trade association cross-validation
Qualitative Methodology
47 expert interviews, Q4 2025; applied to validate demand model assumptions, identify emerging dynamics, and assess competitive positioning
Report Format
PDF and XLSX data workbook (Word format preview document)
Publisher
Market Minds Advisory
Report Code
MMA-2026-TEC-311
Published
August 2026
Contact
sales@marketmindsadvisory.com | www.marketmindsadvisory.com

Purchase the full United States Capital Exchange Ecosystem Market Report (2026 to 2036).

The full report runs to 200 pages and covers all six revenue lines, seven regions and 20 profiled participants in detail. It includes the complete segment CAGR set, analysis of off-exchange internalisation against lit venue economics, and market data pricing examined against public tape content and regulatory proposals. Company profiles carry evaluation on disclosed exchange, market data, clearing and wholesale market making revenue, with moat and risk assessment for the top five participants. The competitive section extends to 15 tracked regulatory, pricing and operational developments across 2024 and 2025. Primary research inputs include a quantitative survey of 3,800 respondents and 47 expert interviews conducted in Q4 2025.
Six revenue lines with individual CAGR forecasts
Seven regions covering domestic revenue and outward data consumption
Twenty participant profiles on consistent revenue evaluation basis
Fifteen tracked regulatory and pricing developments with commercial interpretation
Off-exchange internalisation modelled against lit venue economics
Data pricing examined against public tape content and rulemaking proposals

Built For The People Who Decide

From boardroom strategy to bench-side execution, this report is read cover-to-cover by leaders shaping the next decade of their industry, turning demand scenarios, market dynamics and valuation benchmarks into decisions.
CXOs/ Presidents/ VPs/ Managers
M&A and Corporate Development
Strategy Teams and R&D Heads
Procurement and Product Directors
Regulatory and Compliance Leaders
Investor Relations and Equity Analysts