Market Minds Advisory
Urinary Tract Infection (UTI) Testing Market

Urinary Tract Infection (UTI) Testing Market: Screening Economics, Susceptibility Speed and the Reimbursement Ceiling on Molecular Panels

Roughly 80% of urine cultures return negative after two days, treatment starts empirically at hour zero, and resistance rather than identification is now the question laboratories cannot answer fast enough to change the first prescription.

Lead Analyst

Alice Ballenger

Published

September 2026

Make Smarter Decisions with Customized Research Insights

Request a free sample report and evaluate market opportunities, growth trends, and competitive dynamics relevant to your business needs.

2025 MARKET VALUE$2.6BMarket Size 2025
2036 FORECAST VALUE$5.2BBase Case , 2026 to 2036
CAGR 2026 TO 20366.4 %Bull 7.6% / Bear 5.2%
INCREMENTAL OPPORTUNITY$2.4BNet 10- year value creation
EXPANSION MULTIPLE1.86x2036 value over 2026 base
Strategic Levers
M&A Pipeline
Regional Outlook
Country Rankings
Competitive Intelligence
Segmental Deep-dive
Call-Us : 91 93563 13602

Executive Snapshot and Market Trajectory

Urinary tract infection is the most common bacterial infection treated in the community and the highest volume culture running through any clinical microbiology laboratory in the world. It is also the least valuable one. Roughly 80% of the urine cultures set up each day grow nothing at all.
Screening technology exists to remove those negatives before they reach a plate, and flow cytometry and automated microscopy now sit in front of the culture bench in most high volume laboratories. Molecular syndromic panels return an answer within an hour instead of two days, and they are the fastest growing segment at 9.6%, half again the market rate of 6.4%. East Asia holds the largest share at 29%, ahead of North America.
Concentration is moderate: the top five suppliers account for 46% of installed analyser capacity, and the contest is between platform vendors defending reagent pull-through and molecular entrants selling speed. Antimicrobial resistance stewardship policy is what moves this market now. Around 22% of urinary Escherichia coli isolates no longer respond to first line oral agents. That single statistic is doing more to reshape purchasing than any speed claim.
Market Definition
Diagnostic testing performed to detect, identify and characterise urinary tract infection, covering dipstick and rapid urinalysis strips, automated screening by flow cytometry and digital microscopy, conventional culture with organism identification and susceptibility testing, rapid phenotypic susceptibility platforms, and molecular syndromic panels. Measured at supplier selling value for instruments, reagents and consumables. Urodynamic testing, imaging, renal function chemistry, and therapeutic products are excluded.
Base Year Value
$2.6B in 2025 (MMA Primary Research Dataset, August 2026)
Forecast Period
2026 to 2036, eleven discrete annual values
CAGR
6.4% base case. Bull 7.6%. Bear 5.2%.
Fastest Growth Segment
Molecular Syndromic Panels: 9.6% CAGR
Fastest Growth Country
India: 10.4% CAGR
Fastest Growth Region
South Asia and Pacific: 8.6% CAGR
Largest Region
East Asia: 29% of 2025 global value
Market Leaders
bioMerieux, Danaher, Siemens Healthineers, Roche Diagnostics, Becton Dickinson. Source: MMA Primary Research Dataset, July 2026.
Primary Survey
n=3,800 procurement and R&D decision-makers, Q4 2025, six countries
Methodology
Demand-side build-up, cross-validated against public data, 47 expert interviews

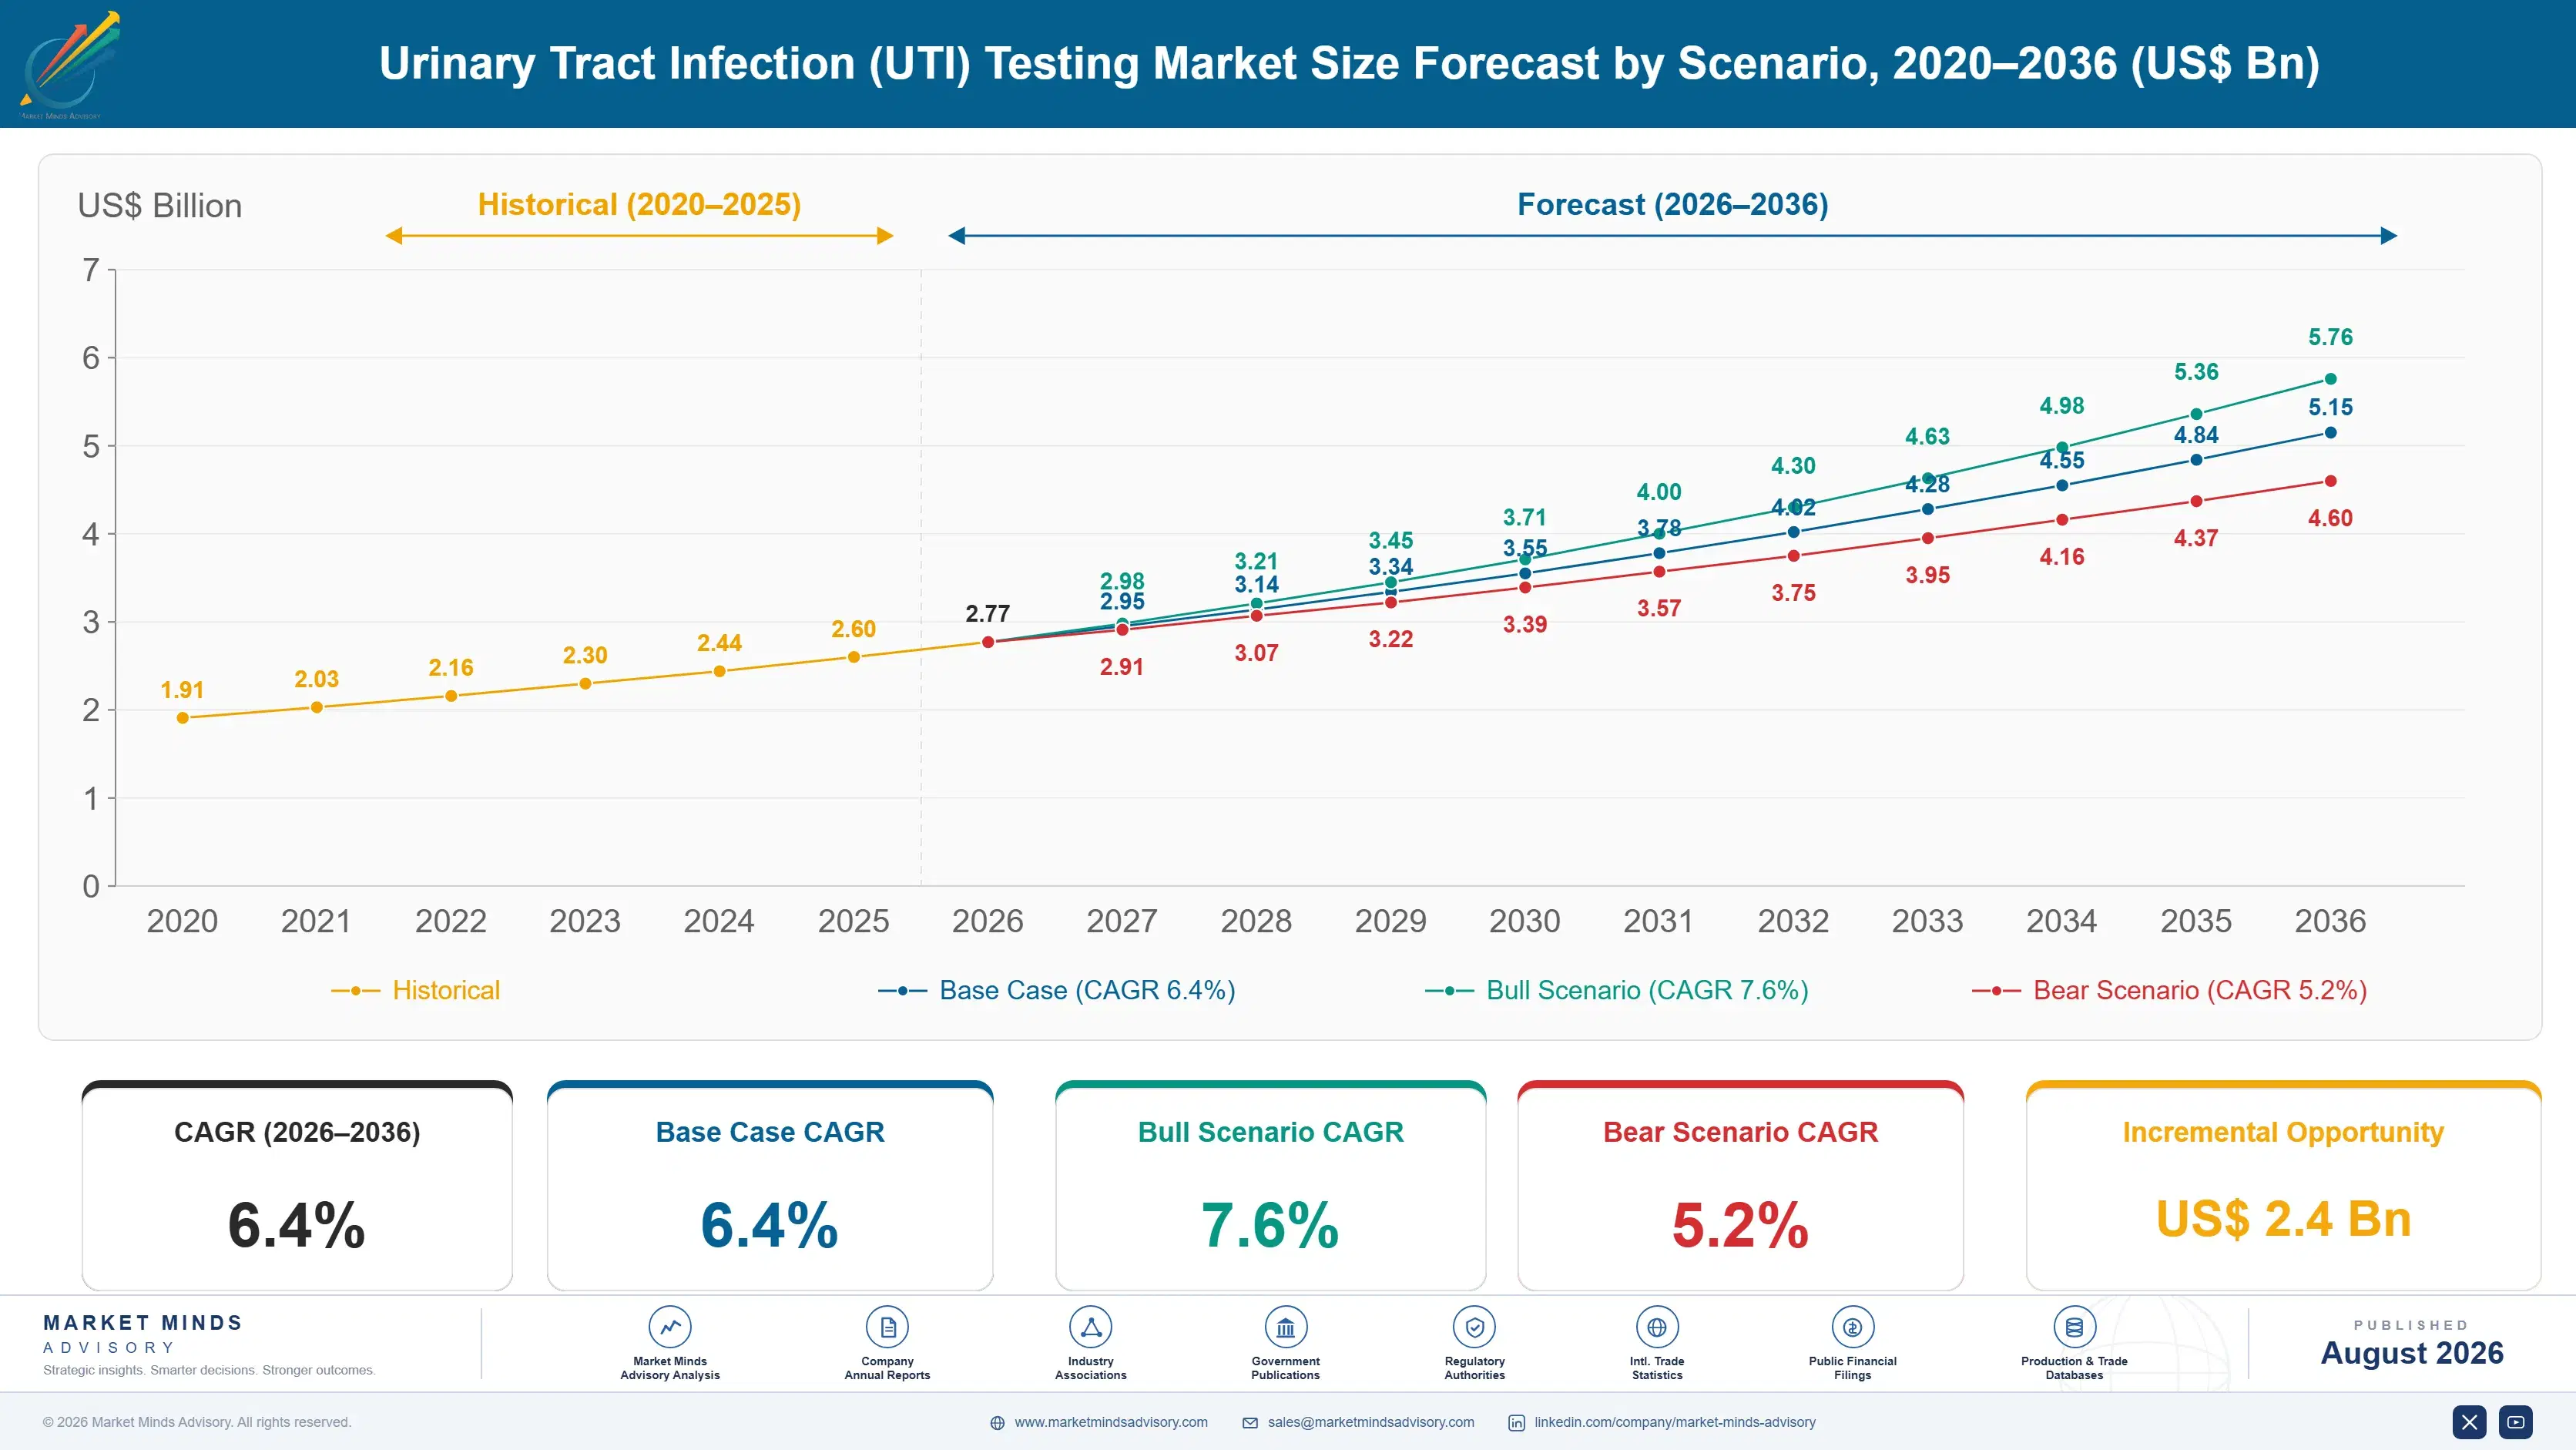
Urinary Tract Infection (UTI) Testing Market Forecast Scenarios

urinary-tract-infection-uti-testing-market-size-forecast-scenario-1787641116894
Testing volume collapsed in 2020 as primary care went remote and urine samples stopped being collected, then rebounded hard through 2021 and 2022 as deferred presentations arrived together. Automation spending followed, since laboratories that had lost staff could not return to manual microscopy. The 5.4% historical rate understates what actually happened, which was two very different halves stitched together.
The 6.4% base case rests on three mechanisms. Screening automation continues to displace manual microscopy, and each installed analyser locks in a decade of reagent purchasing. Antimicrobial stewardship programmes mandated across hospital accreditation schemes in the United States, Europe and Japan require susceptibility data that dipsticks cannot provide. And catheter associated infection surveillance, now a reportable metric in most national safety programmes, generates testing that no clinician ordered and no symptom prompted.
The 7.6% bull case turns on rapid phenotypic susceptibility testing reaching a price point community laboratories can justify, which would convert the two day culture into a same day answer and reprice the whole workflow. The 5.2% bear case is payer resistance to molecular panels: several national schemes already refuse reimbursement on the grounds that detection is not infection, and that argument is winning.

Where Volume and Value Diverge in Urine Testing

A urine culture is the cheapest test in the microbiology laboratory and the most frequently ordered. Reimbursement sits near twelve dollars in most developed systems, against a fully loaded cost that laboratories rarely calculate honestly. The economics only work at volume, which is why consolidation into large reference laboratories has been the defining commercial movement of the past decade.
TOP FIVE CONCENTRATION46%Installed analyser capacity held by the largest suppliers globally
NEGATIVE CULTURE RATE80%Share of urine cultures growing no significant organism
AVERAGE CULTURE PRICEUSD 12Reimbursed price for a routine urine culture episode
MOLECULAR PANEL PREMIUM28xCost ratio of syndromic panels against conventional culture
REAGENT REVENUE SHARE72%Portion of supplier revenue arriving through consumable pull-through
ANALYSER REPLACEMENT CYCLE8 yearsTypical service life before laboratories retender screening platforms
Suppliers understand this and price accordingly. Instruments are placed at minimal capital cost, sometimes free, and 72% of supplier revenue arrives afterwards through reagent and consumable pull-through across an eight year service life. That model works beautifully for high volume screening platforms and badly for molecular panels, which carry a per test cost around 28 times conventional culture and cannot be pushed through the same door.
The clinical reality underneath is more awkward still. Empirical treatment begins at the consultation, hours before any result exists, so the culture almost never informs the first prescription. It informs the second one, for the roughly one in five patients whose first agent fails. That is a real and valuable function, and it is also a much smaller market than the ordering volume suggests.
"The industry keeps selling speed to a problem that is not about speed. Nobody waits for the culture before treating; they wait for it before treating again. Sell the second prescription, not the first."
Director, Diagnostics and Laboratory Medicine Practice · MMA Healthcare and Life Sciences Practice · August 2026

Market Trends

Syndromic Panels Meet Payer Resistance Over Colonisation Detection

Multiplex polymerase chain reaction panels detect bacterial DNA in a urine sample within an hour, which sounds decisive until you consider what else lives in a bladder. Asymptomatic bacteriuria is common in older women and in anyone with a catheter, and a panel cannot distinguish it from infection. Several national reimbursement schemes have now declined coverage on exactly that reasoning, and American payers have narrowed indications sharply since 2024. The technology works. The clinical question it answers is not the one clinicians actually have, and that gap is what caps adoption.
Market Impact: Applies across 6,000 accredited hospitals
Rapid Susceptibility Testing Displaces the Overnight Culture Step

Resistance rather than identification is the unanswered question in urinary infection, since 22% of Escherichia coli isolates no longer respond to first line oral agents in several large national surveillance programmes. Conventional susceptibility testing adds a further overnight incubation on top of the culture, so results arrive at 48 hours. Rapid phenotypic platforms compress that to around six hours by measuring growth directly under antibiotic pressure. Adoption is concentrated in hospital laboratories with sepsis protocols, where the time saved has measurable consequence, and it grows at 8.4% annually, well ahead of the market.
Market Impact: Supplies 18% of hospital specimens

Market Opportunities and Growth Drivers

Stewardship Accreditation Mandates Susceptibility Data in Hospitals

Hospital accreditation schemes across the United States, the European Union and Japan now require documented antimicrobial stewardship programmes, and a stewardship programme without local susceptibility data is an empty document. That single requirement converts susceptibility testing from a clinical option into a compliance obligation, which is a far more reliable purchasing driver. Laboratories serving accredited hospitals cannot decline the workload, and the annual antibiogram those programmes publish depends entirely on culture derived isolates. The obligation applies regardless of whether individual clinicians read the result, which is what makes it dependable revenue.
Market Impact: Reimbursement flat near 12 dollars

Catheter Infection Surveillance Generates Testing Nobody Ordered

Catheter associated urinary tract infection is a reportable safety metric in most national hospital programmes, and reporting requires laboratory confirmation. That produces a stream of specimens driven by surveillance protocol rather than by symptoms, which makes the volume unusually predictable and unusually insensitive to clinical judgement. Roughly 18% of hospital urine specimens in developed systems now arrive through this route. Laboratories dislike it, because surveillance cultures grow colonising organisms that trigger further work, but the specimens keep coming and the analysers keep consuming reagent regardless of what anyone thinks about it.
Market Impact: Removes 35% of community episodes

Market Restraints and Challenges

Culture Reimbursement Has Not Moved in Fifteen Years

A routine urine culture reimburses at around twelve dollars in the United States and less in most European systems, and that figure has barely moved since the schedules were set. The root cause is that culture is coded as a low complexity procedure, a classification made when the work was genuinely manual and cheap, and reclassification requires evidence of clinical impact that culture cannot easily demonstrate. Laboratories absorb the gap through volume and consolidation. Suppliers respond by pushing screening automation that removes negatives before plating, cutting cost per specimen by up to 40%.
Market Impact: Panels grow 9.6% despite restrictions

Empirical Prescribing Removes the Test From the Decision

Uncomplicated urinary infection in a young woman is treated on symptoms alone in most national guidelines, without any test at all. The reasoning is sound: the pretest probability is high, the first line agent is cheap, and waiting two days for confirmation helps nobody. That guidance removes a large share of community presentations from the testing market entirely, and it is getting stricter rather than looser. Suppliers are responding with point of care platforms priced for the clinic rather than the laboratory, aiming to place the answer inside the consultation itself where it can still change something.
Market Impact: Cuts result time to 6 hours
3 additional market trends, 4 additional growth drivers, and 2 additional restraints and challenges are covered in the full report. Contact sales@marketmindsadvisory.com to access the complete intelligence.

Segment CAGR and Growth Architecture

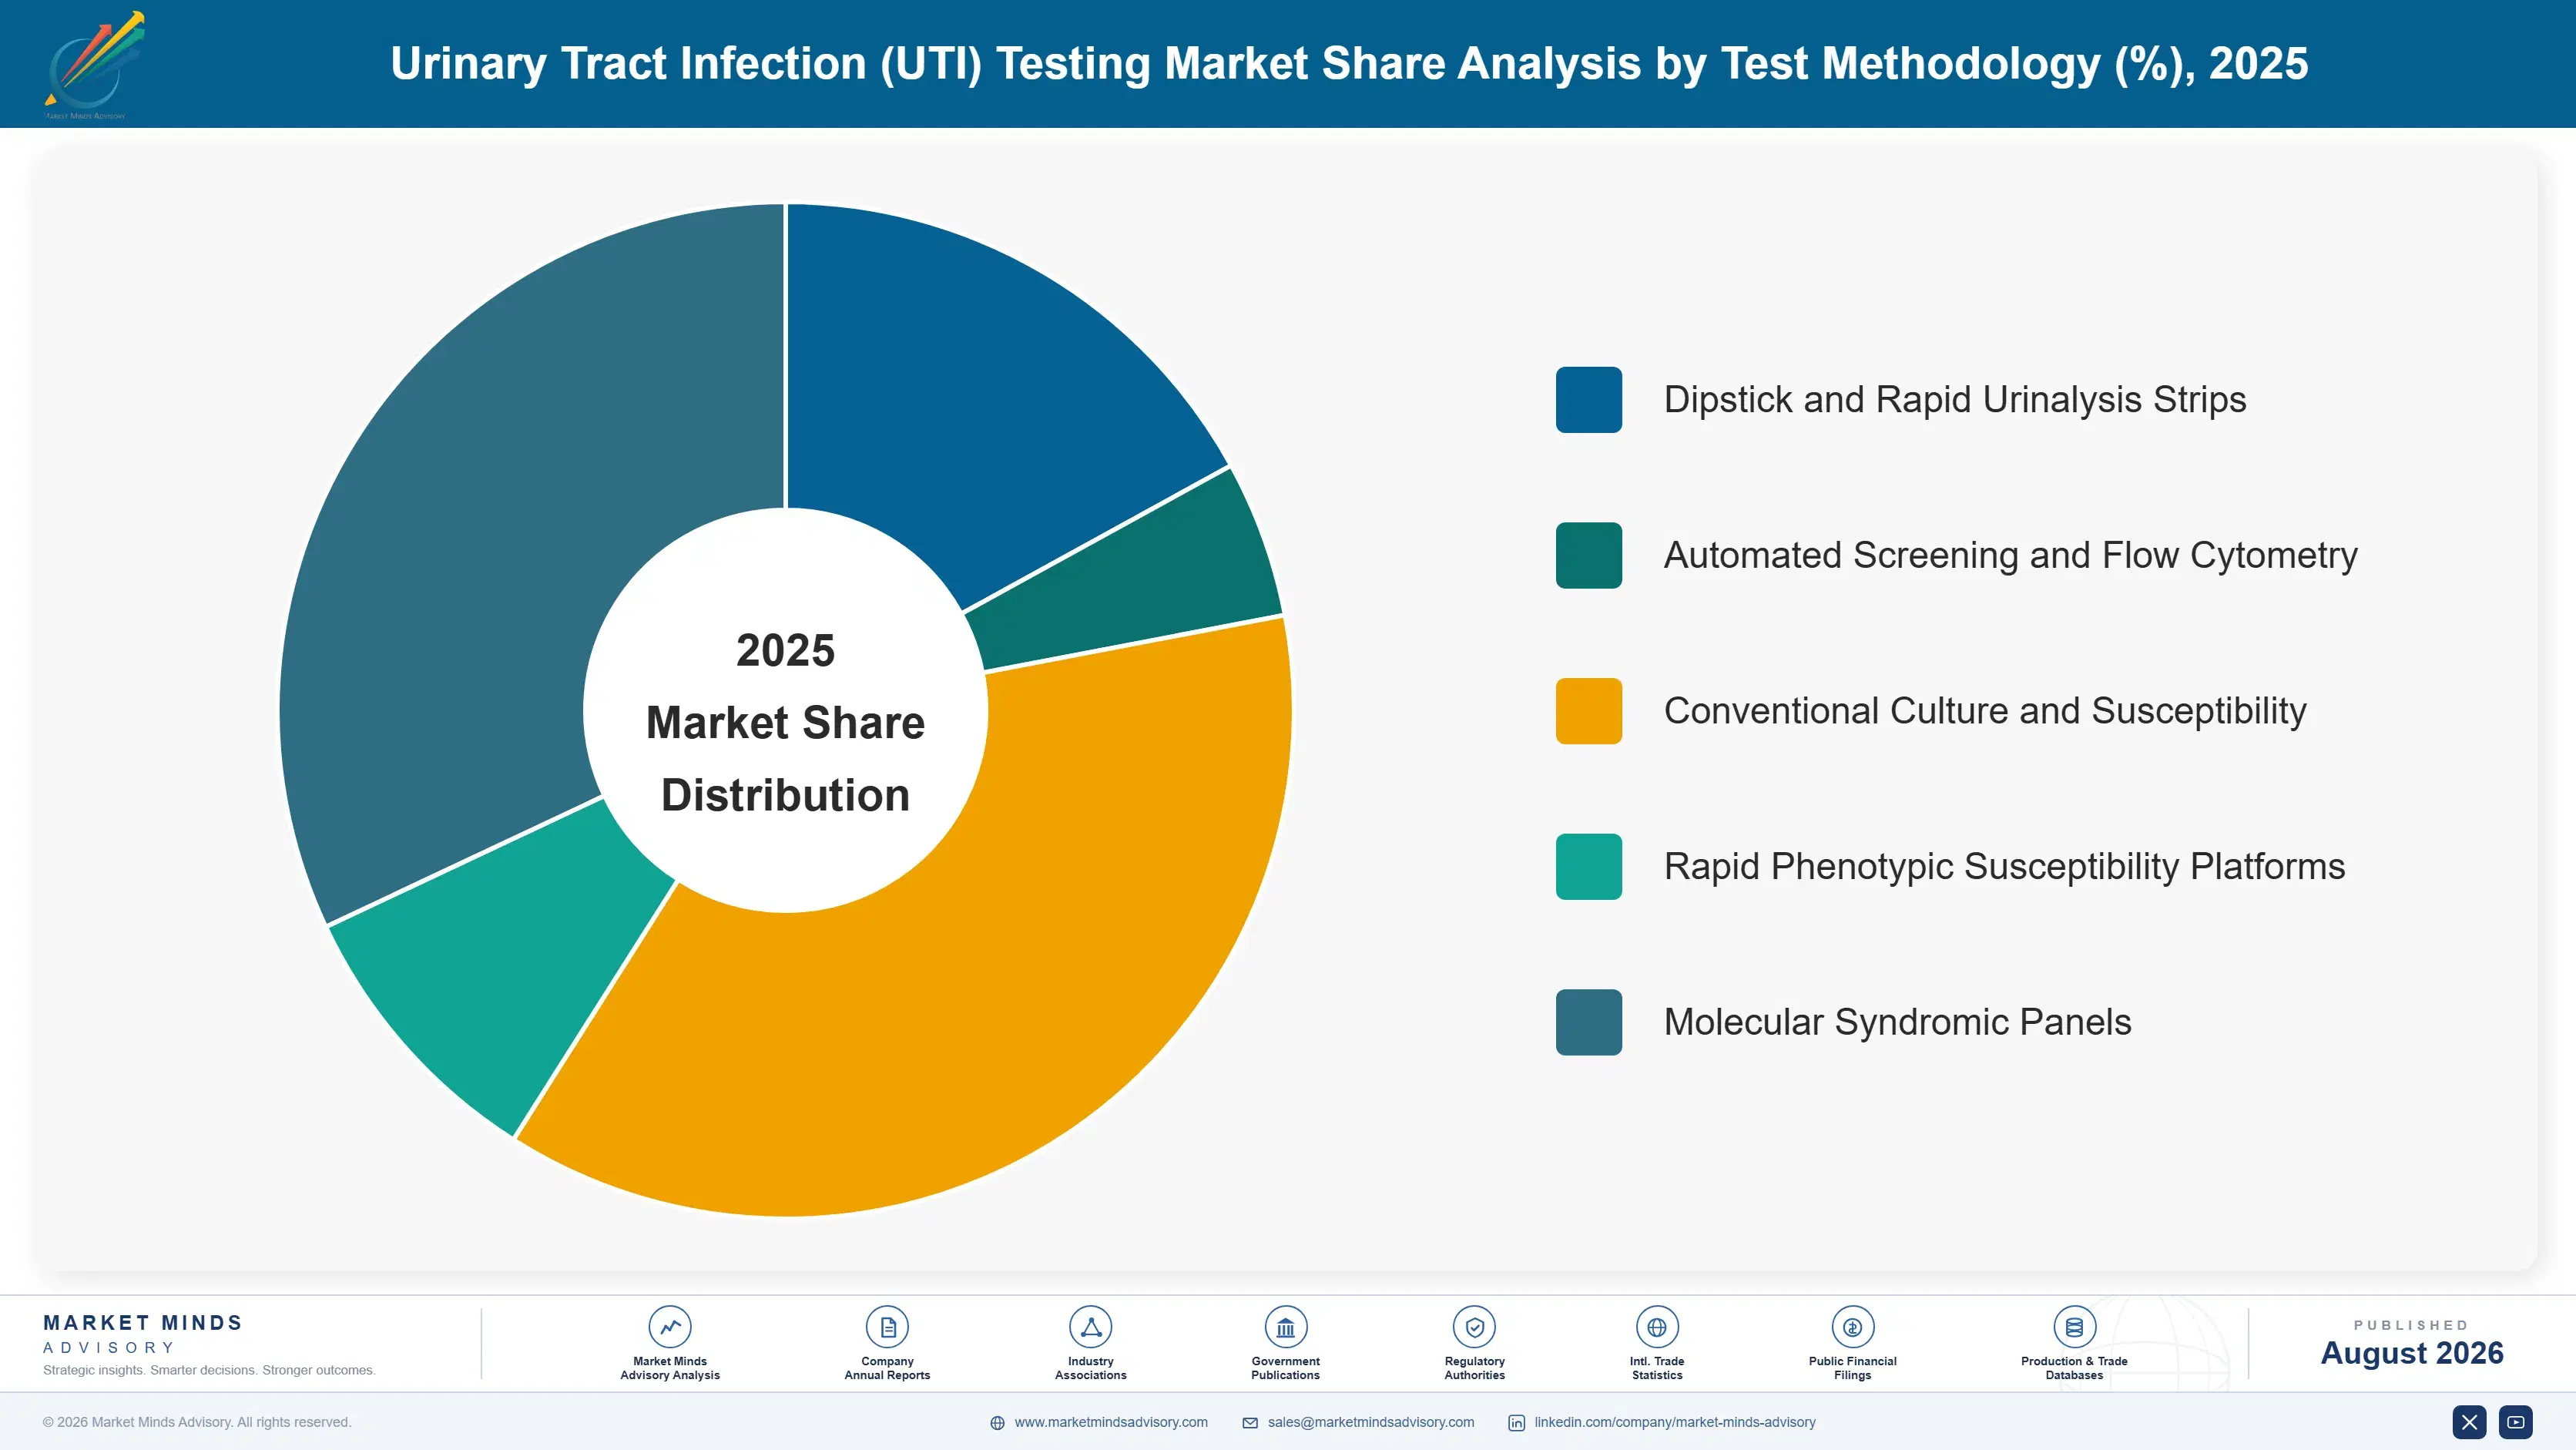
Segmentation follows test methodology, since methodology determines turnaround, cost per specimen and the clinical question answered. Five methods cover the field, from a strip read by eye to a molecular panel returning organism identity within an hour. Growth concentrates where speed and susceptibility information meet, and stalls where neither is offered. Volume tells a different story entirely.
urinary-tract-infection-uti-testing-market-market-share-analysis-1787641117427

Molecular Syndromic Panels

Multiplex panels amplify bacterial and fungal targets directly from the specimen and return identification, and increasingly resistance gene detection, within about an hour. At 9.6% this is the fastest growing method in the market, half again the market rate of 6.4%, and it grows despite active payer resistance rather than because of support. Hospital adoption leads, particularly in emergency departments where a pyelonephritis presentation needs an answer before admission. The commercial obstacle is not performance but interpretation: a panel detects organisms that culture would have dismissed as contamination, and it cannot tell a clinician which finding matters. Suppliers now bundle interpretive algorithms with the assay for exactly that reason, and stewardship teams increasingly gate access.
CAGR 9.6%

Rapid Phenotypic Susceptibility Platforms

These systems measure bacterial growth directly under antibiotic exposure, using imaging or impedance rather than overnight broth dilution, and deliver a susceptibility profile in roughly six hours. Growth runs at 8.4%, second fastest in the market, and the driver is resistance prevalence rather than any general appetite for speed. Where 22% of urinary isolates fail first line therapy, the second prescription matters enough to pay for. Placement concentrates in hospital laboratories running sepsis pathways, since that is where six hours against 48 changes a clinical decision. Community laboratories have not followed, because instrument cost per specimen remains roughly four times conventional testing and their patients are already home. That gap is closing slowly.
CAGR 8.4%
Full segment breakdown across 5 segments available in the complete report.

Regional Architecture and Country Demand Map

East Asia holds the largest share at 29%, reflecting high hospital testing intensity in Japan and rapid laboratory build-out in China. North America follows on reimbursement depth. South Asia and Pacific grows fastest as public laboratory networks add microbiology capacity for the first time. Europe trails on price.

North America

Reimbursement depth rather than testing volume explains the North American position. A routine urine culture is separately payable in almost every American plan, and hospital outpatient laboratories bill susceptibility testing as a distinct line, which supports a price per specimen no other region matches. Consolidation into national reference laboratories has been the defining commercial movement, and those groups negotiate reagent contracts at a scale that compresses supplier margin considerably. Molecular panel coverage narrowed after 2024 as payers pushed back on colonisation detection, which has slowed the segment without stopping it. Canadian provincial laboratories buy centrally and behave more like European systems, favouring screening automation over molecular capability. Both markets are mature and price sensitive.
Share: 27% | CAGR: 6.0% (2026 to 2036)

Western Europe

Central procurement sets the tone across Western Europe. National and regional tenders award multi-year reagent contracts on price per reportable result, which strips out the instrument placement economics that work elsewhere and leaves suppliers competing on consumable cost alone. Germany and France run high specimen volumes through consolidated laboratory groups; the Nordic systems test less and treat empirically more, following guidance that discourages culture in uncomplicated cases. Molecular panels have almost no reimbursed position outside specialist centres, since health technology assessment bodies have repeatedly found the incremental clinical benefit unproven. Growth at 4.8% is the lowest of the seven regions, and price erosion on conventional culture explains most of the gap.
Share: 22% | CAGR: 4.8% (2026 to 2036)
Regional intelligence for 5 additional markets available in the complete report: East Asia, South Asia and Pacific, Latin America, Middle East and Africa, Eastern Europe. Contact sales@marketmindsadvisory.com.
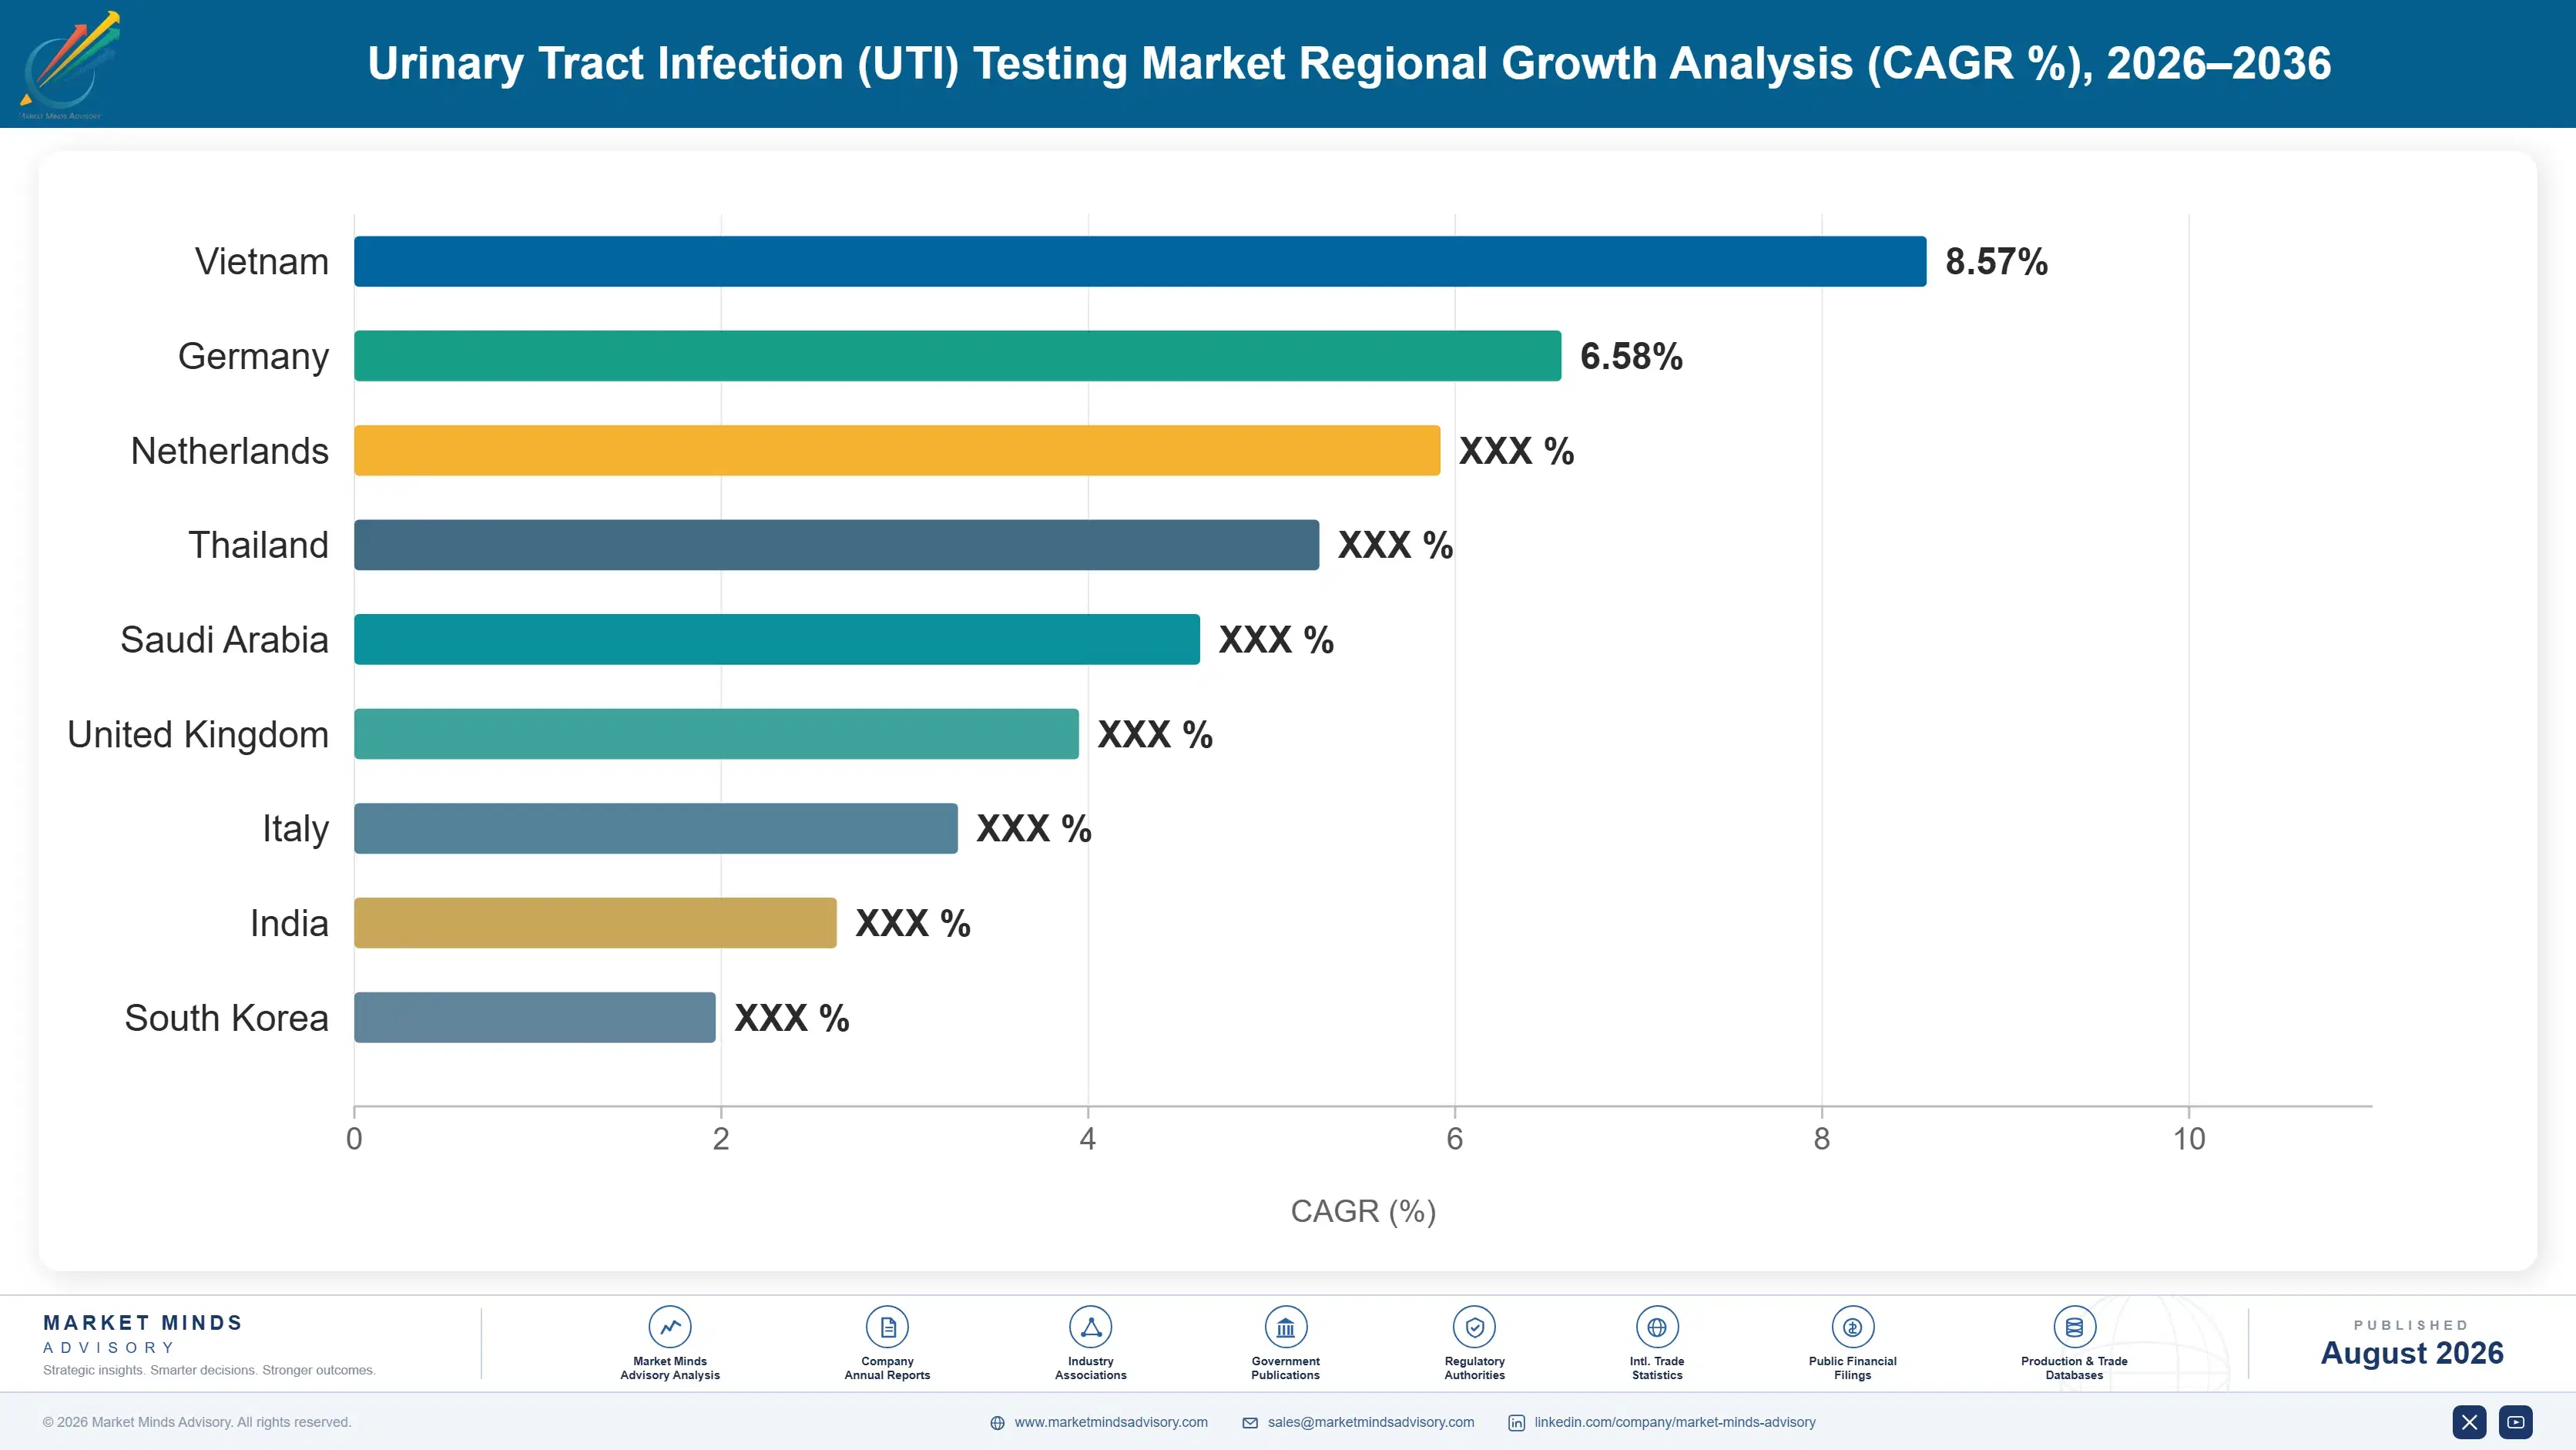
urinary-tract-infection-uti-testing-market-country-cagr-analysis-1787641117947

Where Margin Still Exists in Urine Testing

Nothing in this market rewards a better culture. Value accrues to whoever removes specimens from the bench, answers the resistance question faster, or captures the reagent stream behind a placed instrument. Four routes carry commercial weight, and three of them depend on workflow position rather than assay performance. The fourth is simply geography, and it pays well.

Sell Negative Screening Before Anyone Plates a Specimen

Roughly 80% of urine specimens grow nothing, and every one of them still consumes a plate, an incubator slot and a technologist's attention. Flow cytometry and automated microscopy screening remove between 50% and 65% of specimens from the culture workflow before plating, and laboratories that install them report cost per specimen falling by up to 40%. The commercial position is unusually defensible, because the screening instrument sits upstream of everything else in the laboratory and its cut-off thresholds get validated against local practice, which takes months to redo for a competitor.
Market Impact: Removes up to 65% of the culture bench workload

Price Rapid Susceptibility Against Admission Cost Not Culture

Rapid phenotypic platforms lose every comparison against a twelve dollar culture and win most comparisons against a bed day. Hospitals running sepsis pathways will pay a per test price four times conventional testing when the six hour result moves a patient off broad spectrum therapy sooner, and the internal business case is written against length of stay rather than laboratory budget. Selling to the laboratory director fails here; selling to the stewardship committee and the chief medical officer works. Vendors that restructured their commercial approach on that basis have grown placements considerably faster than the 8.4% segment rate.
Market Impact: Beats the 8.4% segment growth rate through stewardship selling

Contract Reagent Pull-Through Across an Eight Year Placement

Instrument revenue is close to irrelevant in this market: 72% of supplier revenue arrives afterwards, through reagents, controls and consumables consumed across an analyser service life of roughly eight years. The commercial variable is contract structure rather than product. Reagent rental agreements that place the instrument at zero capital cost against a committed annual test volume shift the entire negotiation onto price per reportable result, which suits high volume laboratories and locks them in for the full term. The risk is obvious and worth taking, since a laboratory that under-delivers volume still pays the minimum.
Market Impact: Secures 72% of supplier revenue over 8 years

Follow Public Laboratory Build-Out Into Surveillance Networks

National antimicrobial resistance surveillance programmes are funding microbiology capacity where none existed, and India's network is the largest example, adding participating laboratories every year under central budget. Each node needs identification consumables, susceptibility panels and quality control material from day one, and the tender specifications tend to favour whoever supplied the training. South Asia and Pacific grows at 8.6%, the fastest of the seven regions, and India at 10.4% outpaces every individual country covered. Winning here requires local manufacturing or distributor depth, since pricing sits well below developed market levels.
Market Impact: Captures the 10.4% Indian surveillance network growth rate

Who Controls the Margin Pool

Concentration is moderate by diagnostics standards. The top five suppliers hold 46% of the market measured on installed analyser base and annual reagent and consumable shipment volume, the basis applied consistently here. bioMerieux leads on microbiology depth; the gap to the second tier is narrower than in adjacent immunoassay markets, because urine testing spans four different technology platforms and no supplier owns all of them.
Competition currently runs along three lines. Screening automation is contested on throughput and on how aggressively a cut-off can be set without missing infection, which is a validation argument rather than a specification one. Culture and identification is a consumables business fought on tender price. Molecular is fought on menu breadth and on whether the supplier can defend reimbursement, which increasingly matters more than the assay itself.

Rankings will shift where rapid susceptibility testing lands. It is the one unanswered clinical question in this market and the only place a genuine price premium survives, and the companies holding that technology today are mostly small and mostly loss-making. Acquisition is the likely resolution. Domestic Chinese suppliers are the other pressure point, having taken most screening placements in lower tier hospitals on price and now moving upward.
urinary-tract-infection-uti-testing-market-company-positioning-matrix-1787641118468

Competitive Moat and Risk Dimensions

BIOMERIEUX

Moat: Microbiology Menu Depth

No competitor covers urine testing end to end the way this portfolio does, from screening through identification, susceptibility and molecular panels on connected platforms. Laboratories buying a workflow rather than an instrument have very few alternatives, and the validation effort involved in mixing vendors across those steps is what keeps accounts in place for years.
BIOMERIEUX

Risk: Molecular Reimbursement Exposure

A large share of the growth case rests on syndromic panels, and payers in North America and Europe have been narrowing coverage on the argument that detecting an organism is not the same as diagnosing an infection. If that position hardens further, the premium end of the portfolio stops growing while the conventional end continues eroding on tender price.
DANAHER

Moat: Installed Base Scale

The combined microbiology and molecular franchises put analysers into more laboratories than any competitor, and each placement carries a reagent commitment running roughly eight years. Service networks at that density are close to impossible to replicate, and hospital laboratories weigh engineer response time heavily when they retender, which quietly protects renewal rates across the whole installed fleet.
DANAHER

Risk: Chinese Placement Erosion

Domestic suppliers have taken most new screening analyser placements in Chinese tier two and tier three hospitals on price, and volume based procurement policy actively favours them. East Asia carries 29% of the market and grows at 7.6%, so losing position in the fastest large region during its build-out phase costs more than the current revenue at stake.

Players Tracked

Prominent Players

bioMerieux
Danaher
Siemens Healthineers
Roche Diagnostics
Becton Dickinson

Other Key Players

Thermo Fisher Scientific
Abbott Laboratories
QuidelOrtho
Bio-Rad Laboratories
Sysmex Corporation
Arkray
77 Elektronika
Qiagen
Hologic
Copan Diagnostics
Accelerate Diagnostics
T2 Biosystems
Seegene
Bruker
Meridian Bioscience

Recent Developments

MARCH 2025

United States payer narrows urinary molecular panel coverage

A large national health plan restricted reimbursement for multiplex urinary panels to immunocompromised patients and recurrent complicated infection, citing an inability to distinguish colonisation from infection. Laboratories that had built volume on broader indications lost a substantial share of that testing within two quarters of the policy taking effect.
Signal: Payers have decided the interpretive question themselves, and no assay improvement will change that particular commercial answer
JULY 2025

Indian surveillance network adds hospital microbiology laboratory nodes

India's national antimicrobial resistance surveillance programme brought a further tranche of state hospital laboratories into the reporting network, each requiring identification and susceptibility capability from a standing start. Equipment and consumable tenders followed within months, awarded largely to domestic manufacturers and to multinationals with local production.
Signal: Public programme funding is now creating microbiology demand faster than clinical demand does in these particular markets
OCTOBER 2025

Rapid susceptibility developer raises further growth capital

A rapid phenotypic susceptibility platform developer closed a substantial private financing round to fund commercial expansion, having secured placements in hospital laboratories running sepsis pathways. The company remains loss-making at current volumes, and the round was widely read as a step toward eventual acquisition by a larger diagnostics group.
Signal: The premium technology sits outside the majors, which makes consolidation the most probable route to scale here

What Drives Cost Per Reportable Result

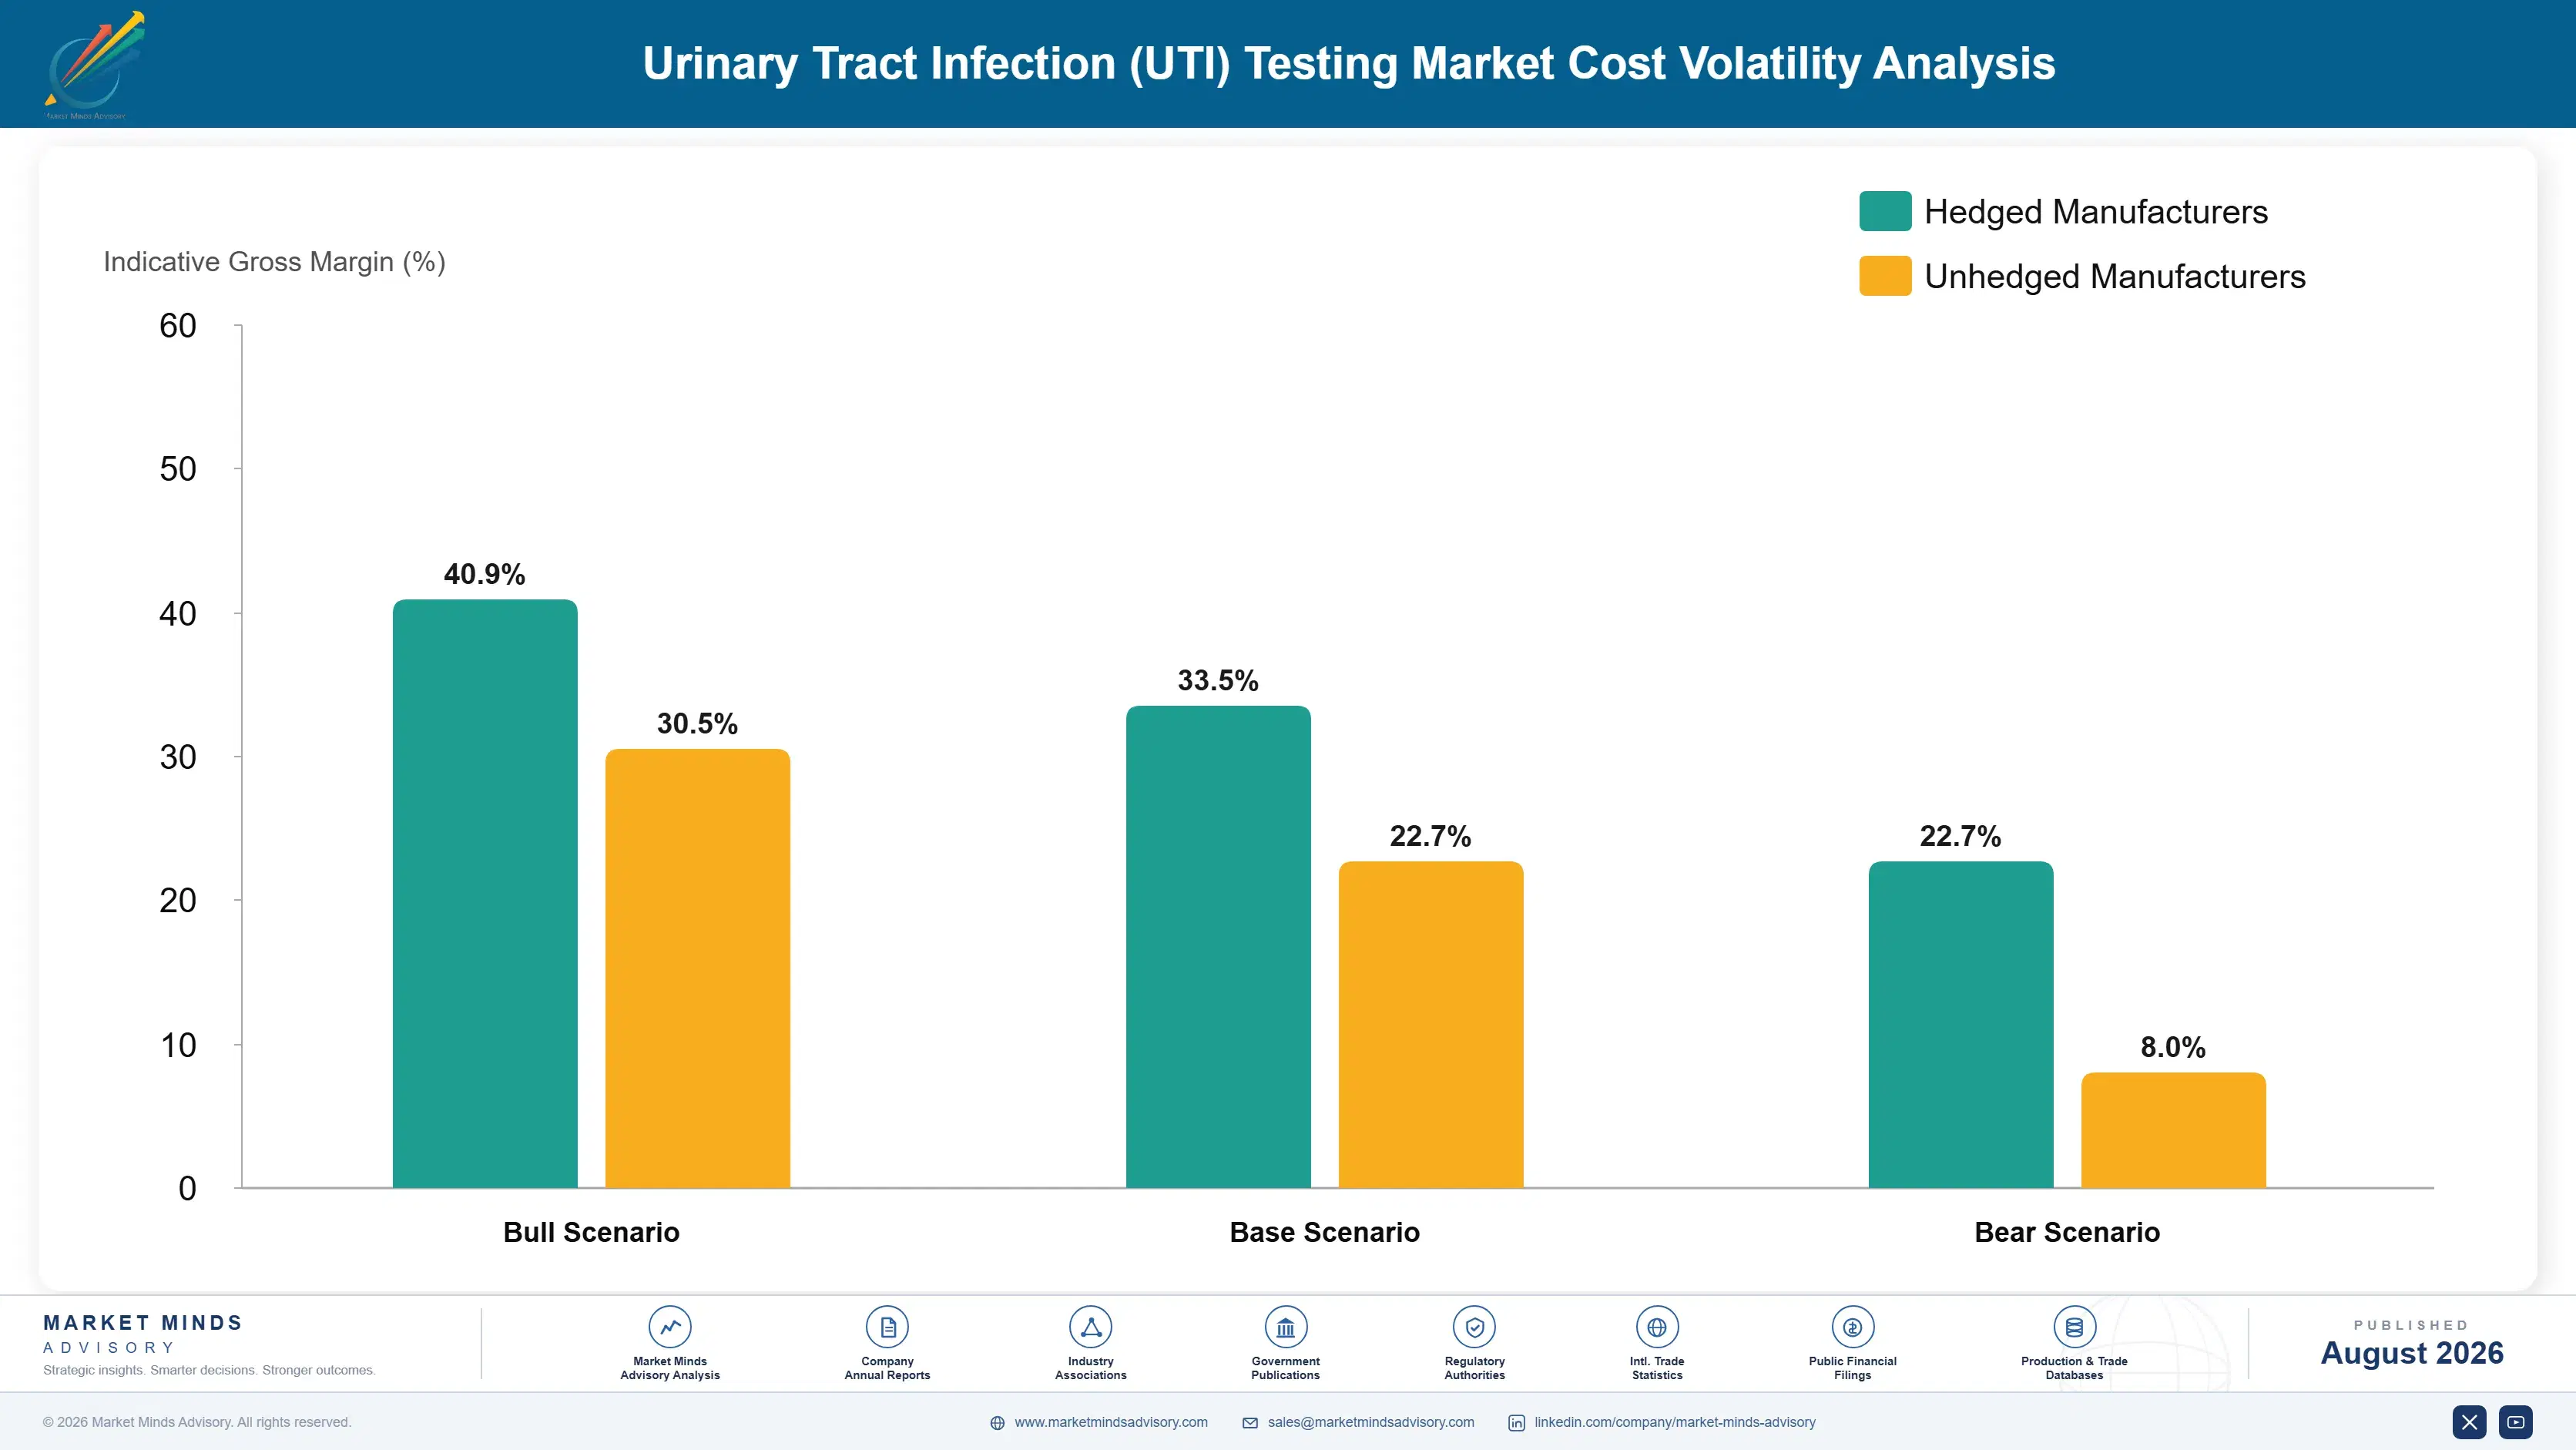
Dry culture media, agar and specialty biochemical reagents account for roughly 38% of cost of goods in the conventional culture segment. Agar itself derives from red seaweed harvested principally in Indonesia, the Philippines and Chile, a narrow supply base. Plastic consumables, mostly polystyrene petri dishes and tubes, add a further 22%, and molecular enzymes and primers dominate cost in the panel segment at around 45%.
Agar pricing moved sharply through the middle of the last decade when Indonesian and Philippine seaweed harvests fell and demand from food processing competed directly with laboratory grade supply. Media manufacturers passed increases through where contract terms allowed. Polystyrene followed a different path, tracking naphtha and therefore crude, and EIA price series show the swings running through 2022 and 2023 that pushed consumable costs up before easing again.

Exposure divides by segment rather than by size. Suppliers weighted toward conventional culture media carry the agar and polystyrene risk directly and sell into tenders priced per result, so they cannot pass anything through until the contract expires. Molecular focused suppliers face enzyme and oligonucleotide costs instead, less volatile but concentrated among very few qualified manufacturers. European tender contracts are the worst place to hold input risk.
urinary-tract-infection-uti-testing-market-cost-volatility-analysis-1787641118663

Dual-source agar and qualify alternative gelling agents

Media manufacturers now qualify seaweed supply across Indonesia, the Philippines and Chile simultaneously rather than accepting a single origin, and several have validated alternative gelling agents for non-critical formulations. Qualification is slow because growth performance testing against reference organisms takes months, but once complete it converts a single point of failure into a negotiating position.

Index tender pricing to published resin benchmarks

Longer European contracts increasingly carry an indexation clause tying consumable pricing to published polymer benchmarks, reviewed annually. Buyers accept it because the alternative is bidders pricing worst case volatility into the headline number for the whole term. Suppliers gain because the exposure that previously sat entirely on their side of the contract now moves with the underlying input.

Shift volume toward screening to cut consumable draw

The most effective cost response is not procurement at all. Removing 50% to 65% of specimens before plating cuts media and plastic consumption proportionally, which reduces exposure to both input streams at once. Laboratories gain the cost saving and suppliers gain a higher value instrument placement, so the incentive runs the same way on both sides.

Portfolio Architecture for Margin Defence

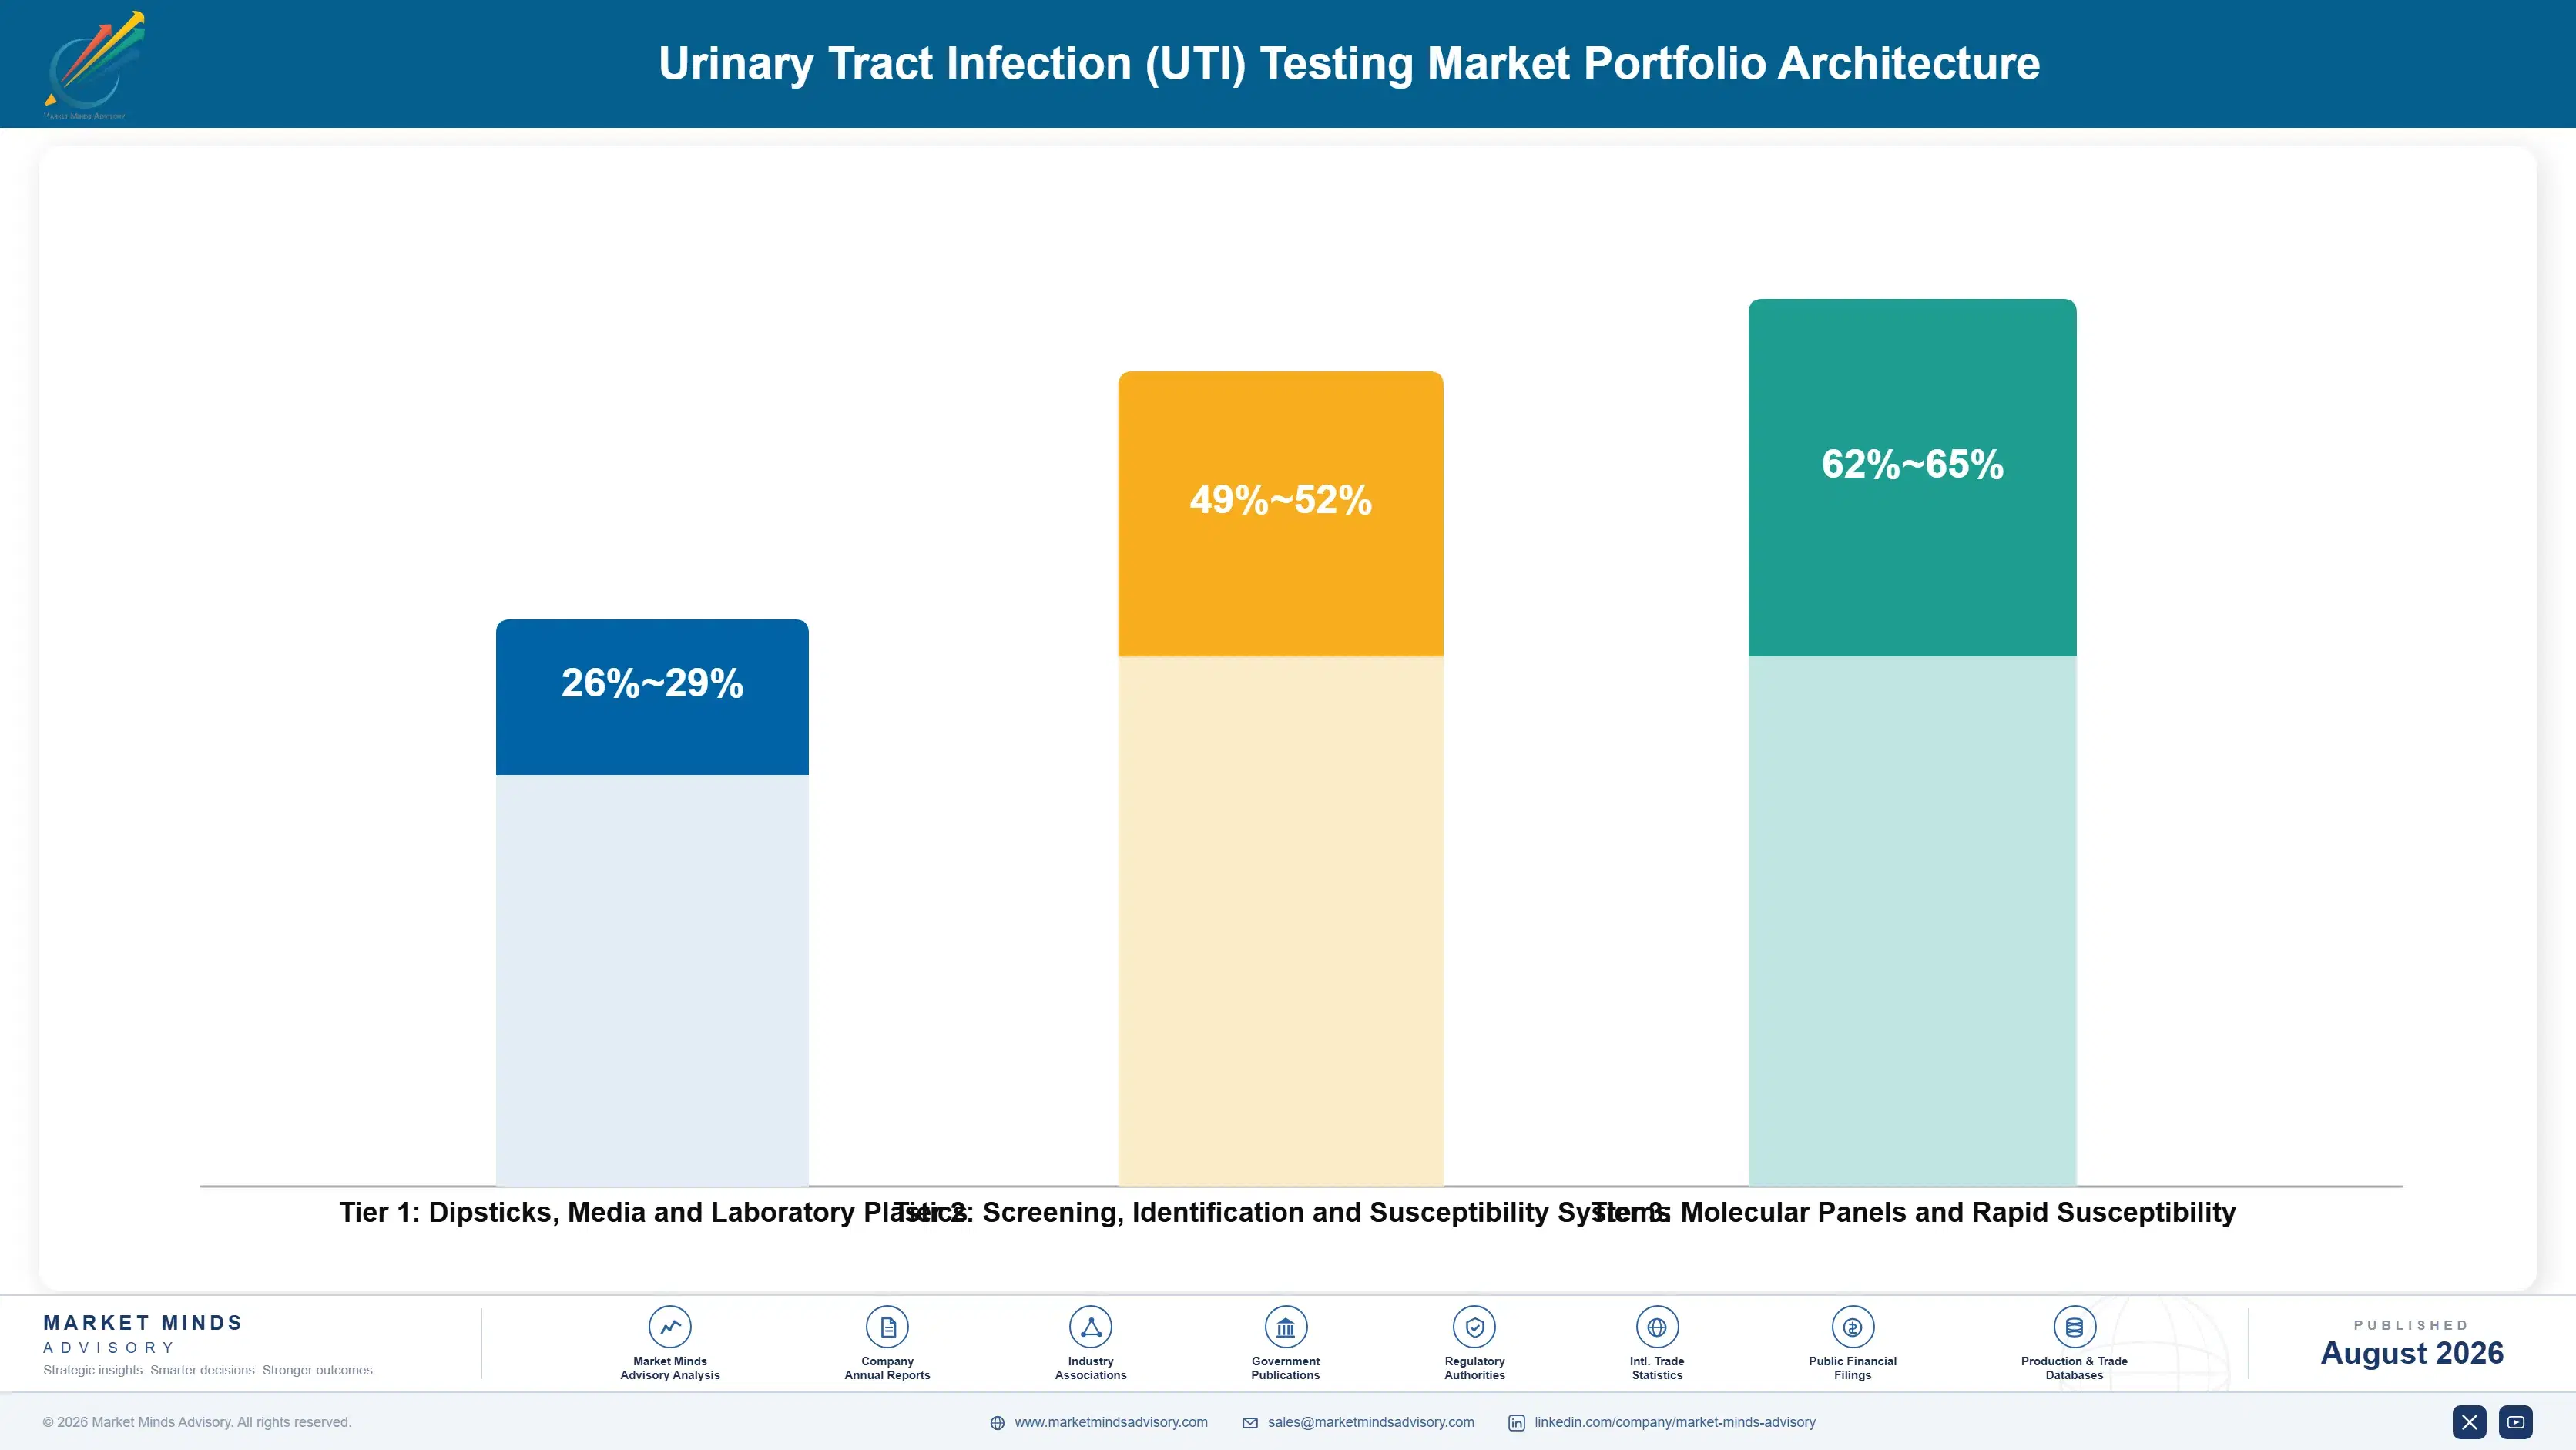
Margin architecture in urine testing follows turnaround time almost exactly. Dipsticks and conventional culture consumables sit close to commodity economics, sold by the thousand into tenders that reward nothing except price. Screening automation earns better, because the instrument carries validation lock-in and the reagent stream runs eight years. Molecular and rapid susceptibility products carry the best gross margin in the market by a wide distance.
The tension is that volume and margin sit in opposite places. Conventional culture and dipsticks account for the overwhelming majority of specimens processed worldwide and a minority of the value. Molecular panels are the reverse, and their volume is capped not by capability but by reimbursement policy that has been tightening since 2024. A supplier optimising purely for margin ends up with a small business, and one optimising purely for volume ends up in tenders.

High value pools concentrate in hospital laboratories running sepsis and stewardship programmes, where a result that changes therapy within hours has demonstrable financial consequence upstream in the bed. That is a narrow customer set, perhaps a few thousand institutions globally, and it is where every premium product in this market is sold. Everything else is a consumables business.

Dipsticks, Media and Laboratory Plastics

Strips, culture media, plates and general laboratory plastics sold into competitive tenders at price per unit. Volume is enormous and pricing power is absent, with margin defended through manufacturing scale and automation rather than any differentiation.
Gross Margin: 26-29%

Screening, Identification and Susceptibility Systems

Screening analysers with validated cut-offs, identification systems and susceptibility panels sold as an accredited workflow. Margin holds because switching requires revalidation against local practice, and accreditation bodies want documented method continuity.
Gross Margin: 49-52%

Molecular Panels and Rapid Susceptibility

Molecular syndromic panels and rapid phenotypic susceptibility platforms sold against stewardship mandates and sepsis pathway economics. Pricing holds at a large premium wherever reimbursement permits, and collapses to nothing wherever payers have declined coverage outright.
Gross Margin: 62-65%
urinary-tract-infection-uti-testing-market-portfolio-architecture-1787641119167

High-value Sub-segments and Strategic Watch-out

Molecular Syndromic Panels

Highest margin per test in the category and the most policy exposed position in it. Growth of 9.6% comes despite narrowing coverage rather than because of support, and any further payer restriction converts this from the fastest segment into a specialist niche quickly. Interpretation remains the obstacle.
Gross Margin: 60-63%

Rapid Phenotypic Susceptibility Platforms

The only genuine premium left in this market, sold on bed day economics rather than laboratory budget. Growth runs at 8.4% and the technology sits mainly with small independent developers, which makes this the most likely area for acquisition activity over the forecast period. Placement remains concentrated.
Gross Margin: 63-66%

Automated Screening and Flow Cytometry

The workhorse position and the one that decides which supplier owns the laboratory. Growth of 5.6% is unremarkable, but each placement carries an eight year reagent stream and sits upstream of every other decision the laboratory makes about workflow. Defending it matters more than the growth rate suggests.
Gross Margin: 49-52%

Dipstick and Rapid Urinalysis Strips

Growth of 3.2% and no defensible position anywhere in the product. Point of care platforms priced for the clinic could either revive this format or replace it entirely, depending on whether community guidance keeps pushing treatment without testing at all. Nobody should be investing here without that answer.
Gross Margin: 24-27%

How Testing Demand Actually Recurs

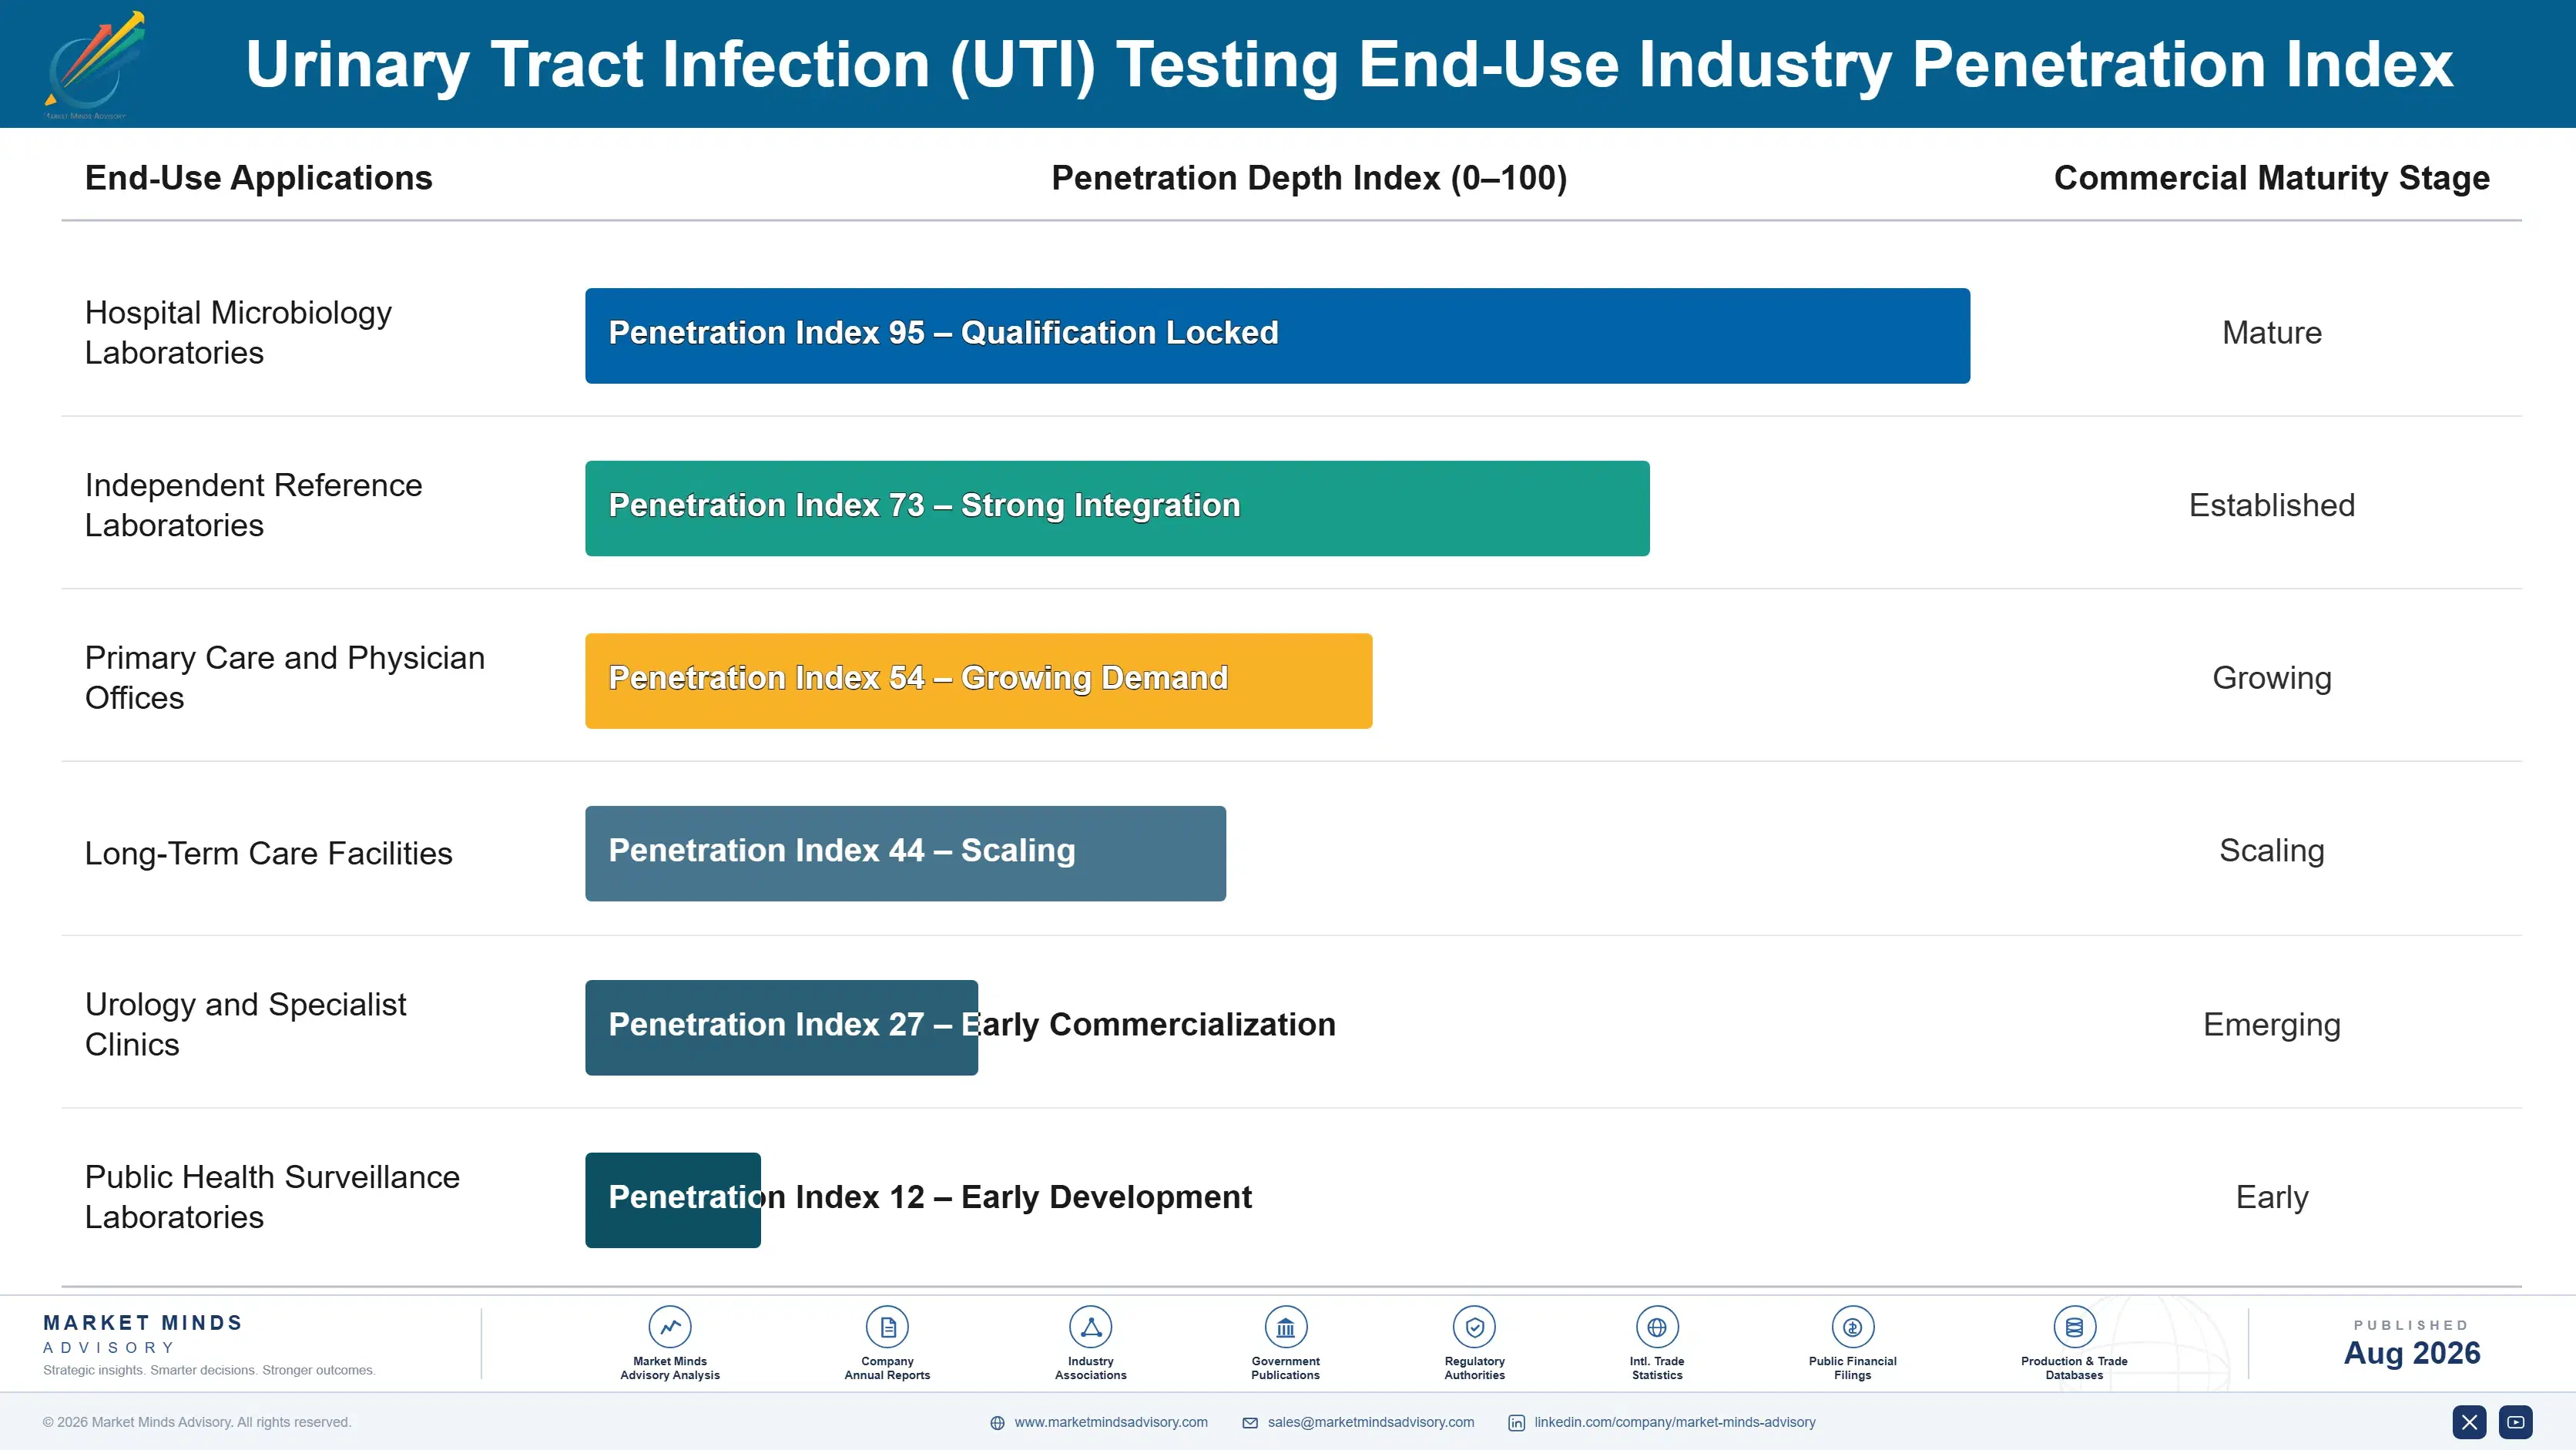
Almost none of the revenue in this market comes from selling instruments. An analyser placed in 2026 generates reagent, control and consumable purchasing every working day for eight years, and 72% of supplier revenue arrives that way. The purchase decision happens once and the revenue recurs daily, which is why placement share matters more than any single tender outcome.
Stickiness varies sharply by setting. Hospital microbiology laboratories are the deepest hold, since accreditation requires documented method continuity and a change of platform triggers revalidation against local organisms that takes months of bench time nobody has. Large reference laboratories are stickier still on volume grounds but far more aggressive on price at renewal. Community clinics and physician offices are the loosest, buying strips on price with no validation obligation.

The buyer has changed within a decade. Purchasing once sat with a laboratory director who cared about analytical performance and knew every supplier's field engineer by name. It now sits with procurement professionals and group purchasing organisations who evaluate price per reportable result, contract terms and service level guarantees. Stewardship committees have become a second buying centre entirely, and they answer to the chief medical officer rather than the laboratory.
urinary-tract-infection-uti-testing-market-end-use-penetration-index-1787641119658

Where To Compete And Why

These are among the four positions where our research anticipates prominent divergence between winners and laggards over the coming forecast period. Each is grounded in the demand model, the regulatory perimeter, and the announced capacity pipeline.
01 / WORKFLOW POSITION STRATEGY

Own the screening step or own nothing at all

Roughly 80% of urine specimens grow nothing, and the instrument that removes them before plating sits upstream of every other purchasing decision the laboratory makes. Screening placements carry validated cut-offs that take months to revalidate for a competitor, which is the closest thing to a genuine switching cost anywhere in this market. Suppliers that hold the screening bench also hold the culture consumables behind it, and the ones that do not are selling into somebody else's account on somebody else's terms.
02 / REIMBURSEMENT RISK MANAGEMENT

Molecular growth depends on policy, not on performance

Syndromic panels grow at 9.6%, half again the market rate of 6.4%, and they do so while payers actively narrow coverage on the argument that detecting an organism is not diagnosing an infection. That argument has not been answered by any assay improvement and probably cannot be. Any commercial plan built on this segment needs a coverage scenario rather than a performance claim, because the constraint sits entirely with policy committees and not with the technology itself, which is an unfamiliar position for diagnostics companies.
03 / SUSCEPTIBILITY TESTING PRIORITY

Resistance is the unanswered question worth paying for

Around 22% of urinary Escherichia coli isolates no longer respond to first line oral agents, and identification alone does nothing about that. Rapid phenotypic platforms compress susceptibility from 48 hours to about six and grow at 8.4%, and the technology sits mostly with small loss-making developers rather than with the established diagnostics groups. Acquisition is the obvious route for anyone who wants a defensible premium position in this market before the price of entry rises further than it already has this year.
04 / GEOGRAPHIC CAPITAL ALLOCATION

Follow surveillance funding rather than clinical demand

India grows at 10.4%, faster than any other country covered, and South Asia and Pacific at 8.6% leads the seven regions, both driven by national surveillance programmes funding laboratories that did not previously exist. That demand is created by public budget rather than by clinical ordering behaviour, which makes it forecastable in a way that physician demand never is. Winning it requires local manufacturing or genuine distributor depth, because tender pricing sits well below developed market levels almost everywhere in the region.

Engagement Snapshot From the Field

A live engagement with an industry participant carrying material or product regulatory and market exposure ahead of a defining policy shift, showing how our research translates into a defensible multi-year portfolio strategy.
MARKET MINDS ADVISORY · CLIENT ENGAGEMENT SUMMARY
Urinary Tract Infection (UTI) Testing Producer Strategic Portfolio Review and Transition Roadmap 2026·Investment Scenario on Urinary Tract Infection (UTI) Testing Exposure Evaluation 2025-26
CLIENT PROFILE
A diagnostics manufacturer with an established position in culture media and identification consumables, selling into hospital and reference laboratories across three continents. Annual revenue in the microbiology division was approximately 480 million dollars (client-reported, unverified by MMA), with the majority arriving through consumable pull-through on an ageing installed analyser base. No molecular urinary capability existed internally.
STRATEGIC CHALLENGE
Tender pricing had eroded conventional culture margin for six consecutive years and the installed screening base was approaching replacement age. The board wanted to know whether to buy into molecular panels, buy into rapid susceptibility, or defend the screening position with a next generation platform. Internal opinion was split three ways and the capital available funded only one.
MMA APPROACH
MMA modelled reagent pull-through economics across the client's installed base by account age and contract terms, then mapped reimbursement policy for urinary molecular panels across eleven national payers. Forty-seven expert interviews with laboratory directors and stewardship pharmacists tested which purchase decisions each group actually controls. A separate workstream valued rapid susceptibility developers against likely acquisition multiples.
KEY FINDINGS
  1. Molecular panel reimbursement had narrowed in seven of the eleven payer systems examined, and three more had active reviews underway, making the segment considerably less forecastable than the growth rate suggested.
  2. Screening analyser accounts older than six years renewed with the incumbent 84% of the time, but renewal price fell an average of 19% at each cycle (client-reported, unverified by MMA).
  3. Stewardship committees, not laboratory directors, controlled the purchase decision for rapid susceptibility platforms in 31 of the 47 institutions interviewed, and the client had no commercial relationship with them.
  4. Acquisition multiples for rapid susceptibility developers had risen for three consecutive years, and two of the four credible targets were already in discussions with larger diagnostics groups.
CLIENT PROFILE
A diagnostics manufacturer with an established position in culture media and identification consumables, selling into hospital and reference laboratories across three continents. Annual revenue in the microbiology division was approximately 480 million dollars (client-reported, unverified by MMA), with the majority arriving through consumable pull-through on an ageing installed analyser base. No molecular urinary capability existed internally.
STRATEGIC CHALLENGE
Tender pricing had eroded conventional culture margin for six consecutive years and the installed screening base was approaching replacement age. The board wanted to know whether to buy into molecular panels, buy into rapid susceptibility, or defend the screening position with a next generation platform. Internal opinion was split three ways and the capital available funded only one.
MMA APPROACH
MMA modelled reagent pull-through economics across the client's installed base by account age and contract terms, then mapped reimbursement policy for urinary molecular panels across eleven national payers. Forty-seven expert interviews with laboratory directors and stewardship pharmacists tested which purchase decisions each group actually controls. A separate workstream valued rapid susceptibility developers against likely acquisition multiples.
KEY FINDINGS
  1. Molecular panel reimbursement had narrowed in seven of the eleven payer systems examined, and three more had active reviews underway, making the segment considerably less forecastable than the growth rate suggested.
  2. Screening analyser accounts older than six years renewed with the incumbent 84% of the time, but renewal price fell an average of 19% at each cycle (client-reported, unverified by MMA).
  3. Stewardship committees, not laboratory directors, controlled the purchase decision for rapid susceptibility platforms in 31 of the 47 institutions interviewed, and the client had no commercial relationship with them.
  4. Acquisition multiples for rapid susceptibility developers had risen for three consecutive years, and two of the four credible targets were already in discussions with larger diagnostics groups.
RECOMMENDED STRATEGY
Phase 1: Phase one: defend the screening base with a refreshed platform and multi-year reagent rental terms, converting the 19% renewal price erosion into committed volume instead. Phase 2: Phase two: build a stewardship facing commercial team within twelve months, since that committee controls the premium purchase and the client had no route to it. Phase 3: Phase three: pursue a rapid susceptibility acquisition rather than molecular panels, accepting a higher entry multiple in exchange for a position payers are not restricting.
OUTCOME
The client abandoned the molecular panel plan and moved capital to rapid susceptibility, completing a minority investment with a call option inside nine months. Screening renewals under the new rental structure held price flat across the first eighteen accounts, against the 19% decline previously typical (client-reported, unverified by MMA).

Frequently Asked Questions

Foundational context covering the market sizes, CAGR, scope, country, region and competition that inform every finding below. This section is provided to cover basics and most often pre-purchase conversations, answered from the MMA Primary Research Dataset.

What is the current size of the Urinary Tract Infection (UTI) Testing Market?

The market was valued at 2.6 billion dollars in 2025, covering dipstick, screening, culture, susceptibility and molecular testing for urinary infection. It reaches an estimated 2.77 billion dollars during 2026.

How large will the Urinary Tract Infection (UTI) Testing Market be by 2036?

MMA forecasts 5.15 billion dollars by 2036, an increase of 2.38 billion dollars over the 2026 base. That represents an expansion multiple of 1.86 times across the forecast period.

What is the CAGR for the Urinary Tract Infection (UTI) Testing Market 2026 to 2036?

The base case compound annual growth rate is 6.4%, with a bull case of 7.6% and a bear case of 5.2%. Payer policy on molecular panels separates those scenarios.

Which segment is growing fastest?

Molecular syndromic panels grow at 9.6%, half again the market rate of 6.4%, driven by hospital emergency and complicated infection use. Rapid phenotypic susceptibility platforms follow at 8.4%.

Who are the major companies in the Urinary Tract Infection (UTI) Testing Market?

bioMerieux, Danaher, Siemens Healthineers, Roche Diagnostics and Becton Dickinson lead on installed analyser base and reagent shipment volume. Together they account for 46% of the market.

Which country is growing fastest?

India grows fastest at 10.4%, driven by national antimicrobial resistance surveillance funding that is adding microbiology capability to public hospital laboratories which previously had none at all.

Report Segmentation Architecture

The full report scope spans multiple orthogonal segmentation dimensions, with cross-tabulated demand data provided for each dimension pair. Coverage extends further to regional breakdowns, trend trajectories, and the competitive detail needed to support segment-level decision-making.

By Test Methodology

  • Dipstick and Rapid Urinalysis Strips
  • Automated Screening and Flow Cytometry
  • Conventional Culture and Susceptibility
  • Rapid Phenotypic Susceptibility Platforms
  • Molecular Syndromic Panels

By End-Use Industry

  • Hospital Microbiology Laboratories
  • Independent Reference Laboratories
  • Primary Care and Physician Offices
  • Long-Term Care Facilities
  • Urology and Specialist Clinics
  • Public Health Surveillance Laboratories

By Commercial Dimension

  • Reagent Rental Contracts
  • Public Tender Procurement
  • Group Purchasing Agreements
  • Direct Instrument Sales
  • Distributor Supply
  • Programme and Donor Funded Supply

By Region

  • North America
  • Western Europe
  • East Asia
  • South Asia and Pacific
  • Latin America
  • Middle East and Africa
  • Eastern Europe

Scope, Methodology, and Coverage

Every figure in this report is reproducible from documented input assumptions. The scope below maps the historical period, the forecast horizon, the segmentation dimensions, and the countries covered, alongside the underlying primary and qualitative methodology.
Historical Period
2020 to 2025
Forecast Period
2026 to 2036
Base Year
2025 (USD billions; MMA Primary Research Dataset, August 2026)
Market Definition
Diagnostic products used to detect, identify and characterise urinary tract infection, covering dipstick and rapid urinalysis strips, automated screening by flow cytometry and digital microscopy, conventional culture with organism identification and antimicrobial susceptibility testing, rapid phenotypic susceptibility platforms, and molecular syndromic panels. Measured at supplier selling value across instruments, reagents and consumables. Urodynamic testing, urinary tract imaging, renal function chemistry, catheters and drainage products, and therapeutic antimicrobials are excluded from scope.
Quantitative Units
USD billions (current prices); tests performed; USD per reportable result by methodology
Segmentation Dimensions
Test methodology; end-use industry; commercial dimension; region
Regions Covered
North America, Western Europe, East Asia, South Asia and Pacific, Latin America, Middle East and Africa, Eastern Europe
Countries Covered
United States, Canada, United Kingdom, Germany, France, Italy, Spain, Sweden, Japan, China, South Korea, Taiwan, India, Australia, Indonesia, Brazil, Mexico, Saudi Arabia, South Africa, Poland
Key Companies Profiled
bioMerieux, Danaher, Siemens Healthineers, Roche Diagnostics, Becton Dickinson, Thermo Fisher Scientific, Abbott Laboratories, QuidelOrtho, Bio-Rad Laboratories, Sysmex Corporation, Arkray, 77 Elektronika, Qiagen, Hologic, Copan Diagnostics, Accelerate Diagnostics, T2 Biosystems, Seegene, Bruker, Meridian Bioscience
Quantitative Methodology
Primary survey, n=3,800 respondents, Q4 2025, six countries; demand-side model with trade association cross-validation
Qualitative Methodology
47 expert interviews, Q4 2025; applied to validate demand model assumptions, identify emerging dynamics, and assess competitive positioning
Report Format
PDF and XLSX data workbook (Word format preview document)
Publisher
Market Minds Advisory
Report Code
MMA-2026-HLT-143
Published
August 2026
Contact
sales@marketmindsadvisory.com | www.marketmindsadvisory.com

Purchase the full Urinary Tract Infection (UTI) Testing Market Report (2026 to 2036).

The full report treats urine testing as a workflow problem rather than an assay problem, which is why screening position matters more than analytical performance in every commercial outcome we examined. It sizes all five methodologies independently through 2036, quantifies reagent pull-through economics across the analyser service life, and maps molecular panel reimbursement policy across eleven national payer systems. Regional chapters cover all seven regions, with public surveillance funding assessed separately from clinical ordering demand. Competitive profiling covers 20 participants on one consistent installed base and shipment volume basis.
Five test methodologies sized independently through 2036
Reagent pull-through economics quantified across analyser service life
Molecular panel reimbursement mapped across eleven national payers
Surveillance programme funding assessed separately from clinical demand
Rapid susceptibility placement tracked by hospital pathway type
Twenty participants profiled on one consistent evaluation basis

Built For The People Who Decide

From boardroom strategy to bench-side execution, this report is read cover-to-cover by leaders shaping the next decade of their industry, turning demand scenarios, market dynamics and valuation benchmarks into decisions.
CXOs/ Presidents/ VPs/ Managers
M&A and Corporate Development
Strategy Teams and R&D Heads
Procurement and Product Directors
Regulatory and Compliance Leaders
Investor Relations and Equity Analysts