

Market Minds Advisory
Urinary Tract Infection (UTI) Treatment Market

Urinary Tract Infection (UTI) Treatment Market: Three Percent Of Cases Carry The Cost

Around three in every hundred community episodes escalate to admission and those cases consume most of the spending, yet nobody in the system is actually paid to prevent that escalation happening.

Lead Analyst

Published

September 2026

Make Smarter Decisions with Customized Research Insights

Request a free sample report and evaluate market opportunities, growth trends, and competitive dynamics relevant to your business needs.

2025 MARKET VALUE$14.8BMarket Size 2025
2036 FORECAST VALUE$36.7BBase Case , 2026 to 2036
CAGR 2026 TO 20368.6 %Bull 9.8% / Bear 7.4%
INCREMENTAL OPPORTUNITY$20.6BNet 10- year value creation
EXPANSION MULTIPLE2.28x2036 value over 2026 base
Strategic Levers
M&A Pipeline
Regional Outlook
Country Rankings
Competitive Intelligence
Segmental Deep-dive
Call-Us : 91 93563 13602

Executive Snapshot and Market Trajectory

Roughly 78% of episodes are uncomplicated cystitis treated for a few dollars in the community. Around 3.1% escalate to admission, and those cases carry most of the spending at some 28,400 dollars each. The disease is cheap almost everywhere and ruinous in a very small number of places.
East Asia takes 27% of value on episode volume and inpatient admission numbers concentrated across the region, where Chinese cases alone account for roughly 24% of treated episodes globally. Urosepsis and bloodstream infection grows at 12.9%, half again the market rate of 8.6%, driven by ageing populations, resistance and the atypical presentation that delays recognition in frail older patients. Resistance moves the cost curve upward through escalation rather than pricing.
Concentration reaches 41% and the commercial structure follows the cost, not the patients. Hospital agents for resistant infection carry the revenue while community generics carry the episodes. Meanwhile roughly 44% of older adults with bacteriuria and no symptoms are treated anyway, which is the largest single source of avoidable antibiotic use here. Diagnostic stewardship removes the finding that prompts it, which restriction alone has never achieved. Guidance is tightening around that practice steadily everywhere.
Market Definition
The market covers treatment of urinary tract infection across community and hospital settings, including uncomplicated cystitis, complicated urinary tract infection, catheter-associated urinary tract infection, acute pyelonephritis, recurrent urinary tract infection, and urosepsis and bloodstream infection. Prostatitis and epididymitis, sexually transmitted infection, urological surgical intervention, diagnostic and susceptibility testing products, and catheters and urological devices are excluded from scope.
Base Year Value
$14.8B in 2025 (MMA Primary Research Dataset, August 2026)
Forecast Period
2026 to 2036, eleven discrete annual values
CAGR
8.6% base case. Bull 9.8%. Bear 7.4%.
Fastest Growth Segment
Urosepsis and Bloodstream Infection: 12.9% CAGR
Fastest Growth Country
India: 10.7% CAGR
Fastest Growth Region
South Asia and Pacific: 10.8% CAGR
Largest Region
East Asia: 27% of 2025 global value
Market Leaders
Pfizer, Merck & Co, Shionogi, AbbVie, GSK. Source: MMA Analysis based on disclosed anti-infective franchise revenue across community and hospital settings, company annual reports 2025.
Primary Survey
n=3,800 procurement and R&D decision-makers, Q4 2025, six countries
Methodology
Demand-side build-up, cross-validated against public data, 47 expert interviews

Urinary Tract Infection (UTI) Treatment Market Forecast Scenarios

urinary-tract-infection-tratment-market-size-forecast-scenario-1787702375073
Growth from 2020 to 2025 ran at 7.4% and hospital treatment of resistant infection drove almost all of it while community episode volume moved very little. Newer beta-lactamase inhibitor combinations reached approval and reimbursement across major markets for complicated infection and pyelonephritis. Catheter-associated infection received sustained attention as reimbursement penalties made it a financial rather than purely clinical problem for hospitals across several health systems.
The 8.6% base case rests on three mechanisms. Resistance keeps pushing community failures into hospital, and the cost of that escalation dwarfs any drug price difference at either end. Ageing populations keep increasing the frail patient group where atypical presentation delays recognition and urosepsis follows. And Asian hospital capacity keeps expanding, which brings severe infection into formal treatment that previously went unmanaged or unrecorded. None of the three depends on episode volume growing.
The bull case at 9.8% assumes newer hospital agents gain earlier positioning in complicated infection rather than waiting for documented failure of established therapy. The bear case at 7.4% is stewardship restricting those agents more tightly while community prescribing improves, which would reduce escalation volume and compress exactly the hospital segment that carries most of the revenue in this disease.

Where The Cost Actually Sits

Almost every episode is cheap and almost all the money is spent on the few that are not. Around 78% of cases are uncomplicated cystitis treated in the community for the price of a sandwich, while roughly 3.1% escalate to admission at some 28,400 dollars for a severe episode. Whatever prevents escalation is worth more than every community antibiotic decision combined. Nobody is paid to prevent it, which is the central commercial fact here.
FIVE-FIRM CONCENTRATION41%Share of treatment revenue held by the leading pharmaceutical companies
UROSEPSIS ADMISSION COST$28,400Typical hospital cost of an episode progressing to bloodstream infection
TOP EPISODE COUNTRYChina 24%Chinese share of global treated urinary infection episodes
UNCOMPLICATED EPISODE SHARE78%Episodes that are uncomplicated cystitis managed in the community
ESCALATION TO ADMISSION3.1%Community episodes that eventually progress to hospital admission
ASYMPTOMATIC TREATMENT RATE44%Older adults treated despite having no urinary symptoms
Older adults are where recognition fails in both directions at once. Urinary infection in frail patients frequently presents as confusion, falls or reduced function rather than urinary symptoms, which delays diagnosis of genuinely severe infection. The same ambiguity drives treatment of asymptomatic bacteriuria in roughly 44% of older patients who have bacteria in urine and no infection at all. One error kills people and the other drives resistance.
Catheter-associated infection sits in a category of its own because money changed the incentive. Reimbursement penalties for hospital-acquired conditions turned it from a clinical concern into a balance sheet item, which redirected investment toward catheter avoidance and removal protocols rather than toward treatment. It demonstrates that this disease responds whenever somebody is financially responsible for prevention.
"Everything in this disease is about the three percent that escalate. And there is not a single line in any budget, anywhere, that belongs to the person who stops that happening."
Principal, Anti-Infectives and Acute Care Practice · MMA Healthcare Practice · August 2026

Market Trends

Escalation Economics Dwarf Every Community Drug Decision

A community episode treated for a few dollars costs roughly 28,400 dollars once it reaches hospital as urosepsis, and about 3.1% of episodes make that journey. The entire commercial and clinical value in this disease sits in that transition, and no reimbursement structure anywhere pays anybody for preventing it. Growth at 12.9% in the severe segment reflects escalation happening rather than anything improving. Manufacturers arguing drug price against escalation cost are making an argument payers have not yet built a mechanism to hear. Escalation is where the value is created or destroyed, and no reimbursement structure recognises it.
Market Impact: Delays recognition in 2 directions

Reimbursement Penalties Redirected Catheter Infection Spending

Catheter-associated infection became a hospital-acquired condition attracting reimbursement penalties, which turned a clinical problem into a balance sheet item and moved investment toward catheter avoidance and early removal rather than toward treatment. Infection rates fell measurably where those protocols were implemented properly. That is the clearest demonstration available that this disease responds when somebody is held financially responsible for prevention, and it is also the only segment where that has actually happened. It is also the only segment anywhere in this disease where prevention carries a financial consequence, which is why it moved when nothing else did.
Market Impact: Covers 24% of global episodes

Market Opportunities and Growth Drivers

Ageing Populations Expand The Atypical Presentation Group

Urinary infection in frail older patients frequently presents as confusion, falls or functional decline rather than urinary symptoms, which delays recognition of severe infection until it has already progressed considerably. Growing older populations across every developed market expand that group directly. Urosepsis growth at 12.9% follows demographic change together with resistance rather than any change in the organism. Recognition tools and clinical pathways address it, and almost nobody is commercially organised to sell either of those things. Ageing populations expand that group faster than any clinical improvement reduces it. Nobody sells either.
Market Impact: Prevents 0 reimbursed escalations

Asian Hospital Capacity Brings Severe Infection Into Treatment

Inpatient capacity across China, India and Southeast Asia has expanded considerably, bringing severe urinary infection into formal treatment where it previously went unmanaged or simply unrecorded in health statistics. Chinese episodes alone account for roughly 24% of the global treated total. India grows fastest of any country at 10.7% as hospital access widens. Resistance rates in these populations are higher than Western levels, which raises the proportion of episodes requiring hospital agents rather than community therapy. Surveillance across those markets remains limited, so the true burden is almost certainly understated.
Market Impact: Treats 44% without symptoms

Market Restraints and Challenges

Nobody Is Reimbursed For Preventing Escalation

About 3.1% of community episodes escalate to admission costing roughly 28,400 dollars, and every party involved is paid for the activity they perform rather than the admission they avoid. Root cause is fee-for-service payment structures that reward treating rather than preventing. The commercial impact is that the most valuable intervention in this disease has no purchaser at all, so nobody builds it. Mitigation runs through capitated and value-based arrangements, which cover a small fraction of episodes globally. The most valuable intervention has no buyer. Value-based arrangements are the only route.
Market Impact: Escalates 3.1% into admission

Asymptomatic Bacteriuria Treatment Drives Avoidable Antibiotic Use

Roughly 44% of older adults with bacteria in urine and no symptoms receive antibiotics anyway, which treats a laboratory finding rather than an infection. Root cause is that atypical presentation in frail patients makes clinicians reluctant to withhold treatment when a positive culture is available. The commercial impact is substantial avoidable prescribing that stewardship targets directly and that will be removed as guidelines tighten. Mitigation runs through diagnostic stewardship, meaning testing fewer patients rather than treating fewer results. Guidelines are tightening around this practice everywhere. Testing less is the practical answer.
Market Impact: Penalises 1 preventable condition category
3 additional market trends, 4 additional growth drivers, and 2 additional restraints and challenges are covered in the full report. Contact sales@marketmindsadvisory.com to access the complete intelligence.

Segment CAGR and Growth Architecture

Segmentation follows infection classification: how the infection presents clinically and where it is managed, rather than which agent treats it or how that agent is paid for. Six clinical categories cover the disease without overlap, from uncomplicated cystitis through to bloodstream infection. Therapeutic class and payment route are separate dimensions. Causative organism cuts across every classification here.
urinary-tract-infection-tratment-market-market-share-analysis-1787702375338

Urosepsis and Bloodstream Infection

Growth at 12.9%, half again the market rate of 8.6%, follows ageing populations and resistance together rather than any change in the organism causing it. An episode reaching this stage costs roughly 28,400 dollars against a few dollars in the community, which means around 3.1% of episodes carry the majority of total disease spending. Atypical presentation in frail older patients delays recognition until progression has already occurred. Hospital agents for resistant organisms carry the revenue here, and community prescribing decisions made weeks earlier largely determine who arrives. Prevention would be worth more than any treatment and nobody is paid for it. Community decisions made weeks earlier determine who arrives at hospital.
CAGR 12.9%

Recurrent Urinary Tract Infection

Patients experiencing repeated episodes were historically managed with continuous low-dose antibiotics, which stewardship now discourages in precisely the group requiring the most exposure to treatment. Growth at 10.2% follows non-antibiotic prophylaxis, vaccine development and behavioural management filling that gap. It is also the only segment producing a continuing patient relationship, since acute treatment ends in days and generates nothing afterwards. Commercially it behaves far more like a chronic condition than an infection, which most anti-infective organisations are not built to serve. Vaccines in development, non-antibiotic prophylaxis and structured management compete in a space stewardship itself opened up by discouraging continuous antibiotics. Acute organisations serve it badly. The relationship lasts years.
CAGR 10.2%
Full segment breakdown across 6 segments available in the complete report.

Regional Architecture and Country Demand Map

Geography follows episode volume and hospital admission numbers together rather than pricing alone, because severe cases dominate spending everywhere. East Asia leads on volume, North America follows on inpatient pricing, and India grows fastest. Resistance rates and escalation vary enormously between regions and drive most of the difference in spending.

North America

Catheter-associated infection carries reimbursement penalties as a hospital-acquired condition, which turned prevention into a financial priority and produced measurable rate reductions where protocols were implemented properly. Inpatient pricing for severe episodes is the highest globally, so a smaller share of episodes generates a large share of value. Asymptomatic bacteriuria treatment in older adults remains widespread despite guidance against it. Newer hospital agents for resistant infection reach approval and formulary listing here first, though stewardship restriction follows quickly behind approval. Escalation prevention has no purchaser here either, despite the catheter penalty demonstrating clearly that this disease responds when somebody is held responsible. Prevention still has no budget line anywhere. Penalties changed one thing only.
Share: 26% | CAGR: 7.8% (2026 to 2036)

Western Europe

National stewardship programmes are more coordinated than American formulary restriction and reduce both community over-prescribing and inappropriate treatment of asymptomatic bacteriuria more effectively. Escalation to admission is monitored more systematically through national surveillance across several countries. Hospital agents for resistant infection face health technology assessment that frequently requires documented failure of established therapy first. Ageing populations across the region expand the frail patient group where atypical presentation delays recognition, which is the main driver of severe episode growth here. Recurrent infection prophylaxis has moved toward non-antibiotic options faster here than anywhere, following guidance that discourages continuous antibiotic exposure. Coordinated stewardship has reduced avoidable prescribing more effectively than formulary restriction manages elsewhere.
Share: 22% | CAGR: 7.0% (2026 to 2036)
Regional intelligence for 5 additional markets available in the complete report: East Asia, South Asia and Pacific, Latin America, Middle East and Africa, Eastern Europe. Contact sales@marketmindsadvisory.com.
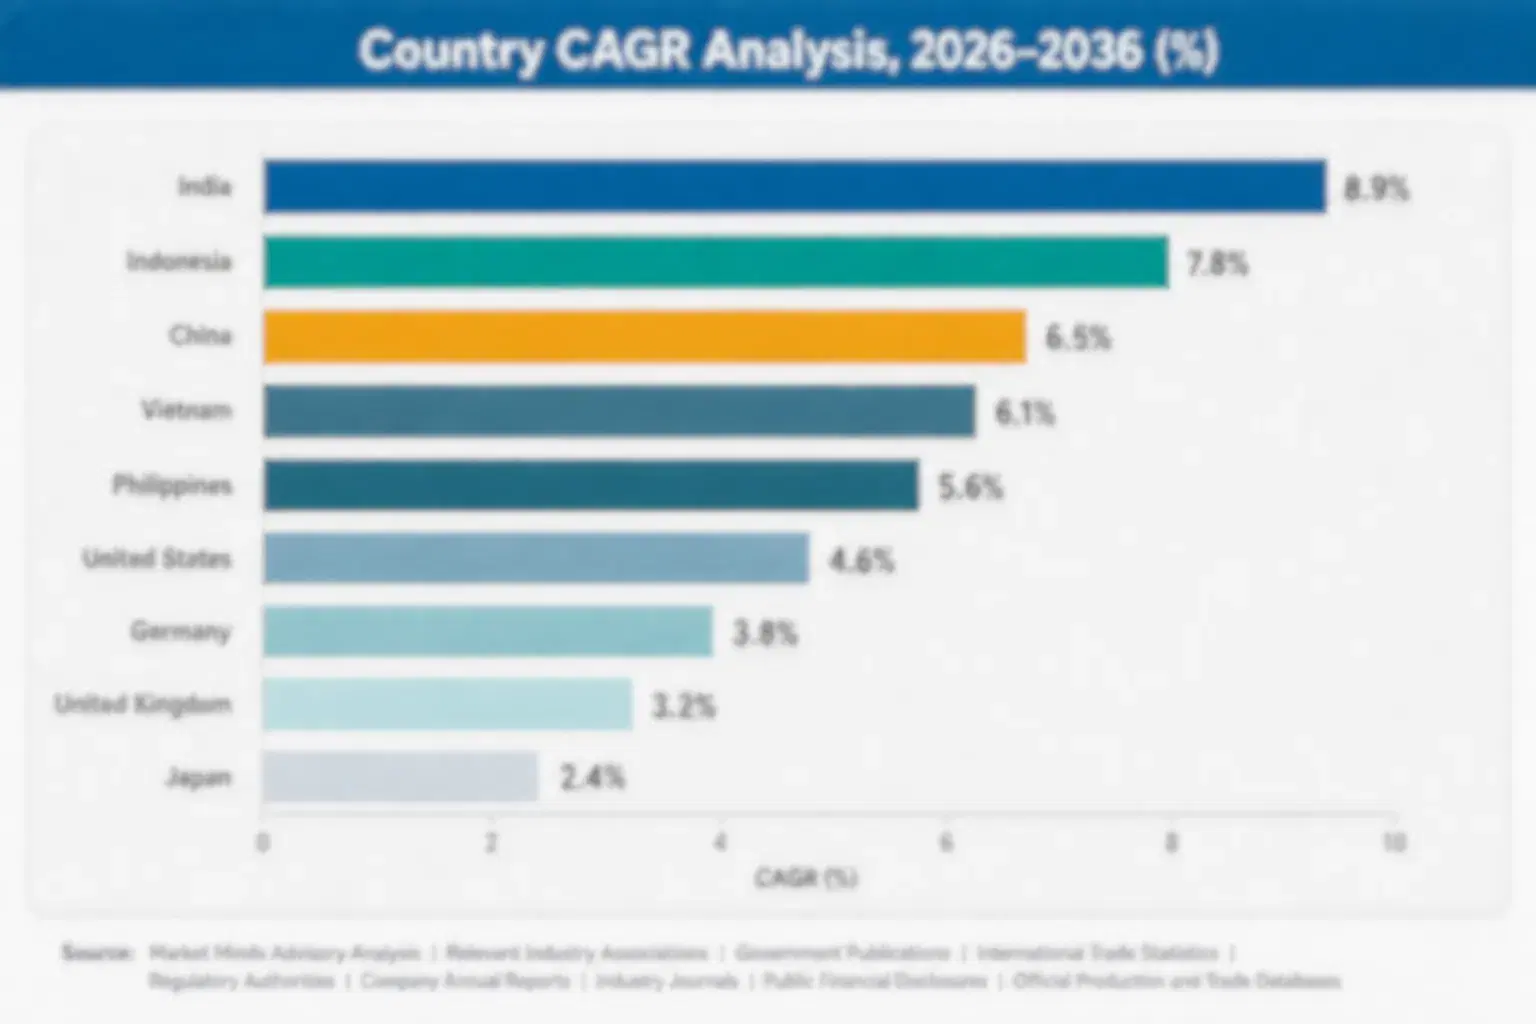
urinary-tract-infection-tratment-market-country-cagr-analysis-1787702375623

Selling Against The Escalation Curve

Around 78% of episodes are cheap community cystitis, roughly 3.1% escalate to admission at some 28,400 dollars, 44% of asymptomatic older adults are treated anyway, and nobody is paid for prevention. Four levers work on escalation economics, recognition, diagnostic stewardship and recurrent care rather than on drug pricing. Drug price is economically trivial beside it.

Build Escalation Cost Evidence For Payer Conversations

About 3.1% of community episodes escalate to admission costing roughly 28,400 dollars, which makes every community treatment decision economically consequential in a way drug pricing never captures. Manufacturers arguing agent price against agent price are having the wrong conversation entirely. Building evidence that links initial therapy choice to escalation rates reframes the discussion around total episode cost, which is where the money actually sits and where payers can eventually be persuaded to act. Payers have no mechanism to hear it yet, which is precisely why the manufacturer that builds the evidence first shapes how the argument eventually gets made.
Market Impact: Addresses the $28,400 cost of each escalated episode

Support Recognition Pathways For Atypical Presentation

Urinary infection in frail older patients presents as confusion, falls or functional decline rather than urinary symptoms, which delays recognition until severe infection has progressed considerably. Roughly 2 opposing errors follow from the same ambiguity, since the group is simultaneously over-treated for asymptomatic bacteriuria and under-recognised for genuine sepsis. Manufacturers supporting recognition pathways and clinical decision tools reach clinicians before the escalation their products then treat expensively. Recognition tools and clinical pathways address it directly, and almost nobody is commercially organised to supply either of those things today. The gap is entirely open.
Market Impact: Addresses the 2 opposing clinical recognition errors together

Promote Diagnostic Stewardship Over Treatment Restriction

Roughly 44% of older adults with bacteriuria and no symptoms receive antibiotics, and the practical fix is testing fewer patients rather than persuading clinicians to ignore positive results they have already obtained. Diagnostic stewardship removes the finding that prompts unnecessary treatment. Manufacturers of appropriate agents benefit because the resulting prescribing is better targeted, and those relying on avoidable volume lose ground as guidelines tighten around this practice everywhere. A clinician holding a positive culture finds withholding treatment genuinely difficult to justify, which is why restriction has failed and why removing the test succeeds where argument does not.
Market Impact: Removes 44% of all the unnecessary treatment prompts

Serve Recurrent Infection As A Chronic Condition

Recurrent infection growing at 10.2% is the only segment here producing a continuing patient relationship, since acute treatment ends within days and generates nothing afterwards at all. Non-antibiotic prophylaxis, vaccine development and structured management fill a gap stewardship created by discouraging continuous antibiotics. Commercially this behaves like a chronic condition rather than an infection, and anti-infective organisations built entirely around acute courses are poorly equipped to serve it properly. Vaccines in development and structured management fill that space, and the commercial skills required are chronic rather than acute ones entirely. Very few competitors hold them.
Market Impact: Serves the whole 10.2% of recurrent segment growth

Who Controls the Margin Pool

Measured on disclosed anti-infective franchise revenue across community and hospital settings, the five largest companies hold a CR5 of 41%, which reflects a market split between genericised community treatment and a concentrated hospital segment. Pfizer, Merck and Shionogi hold the leading positions in agents for resistant complicated infection, AbbVie carries an established beta-lactamase inhibitor position, and GSK brought a newer oral agent to approval. The volume and the value sit in entirely different settings.
Three contests define activity. Community treatment competes on generic price and supply reliability among manufacturers with negligible revenue per course. Hospital agents for resistant infection compete on stewardship access and on evidence in the specific organisms driving escalation. And recurrent infection competes through prophylaxis and prevention, which is a chronic condition business inside an acute disease. A company organised for one contest is rarely equipped for the others.

Pressure builds as stewardship restricts hospital agents while resistance simultaneously increases the need for them. Rankings shift toward whoever links initial therapy choice to escalation outcomes convincingly. Nobody is currently paid to prevent escalation, and that gap defines what the market cannot yet reward. No mechanism exists yet.
urinary-tract-infection-tratment-market-company-positioning-matrix-1787702375921

Competitive Moat and Risk Dimensions

PFIZER

Moat: Resistant Organism Portfolio Breadth

Pfizer holds multiple agents active against the resistant organisms that drive escalation to hospital care, which lets it serve a patient through changing susceptibility rather than losing them at the first treatment failure. Anti-infective development at this scale requires infrastructure very few companies still maintain, since most exited the field entirely over the past two decades.
PFIZER

Risk: Stewardship Volume Restriction

Hospital agents for resistant infection are reserved deliberately, which means clinical strength converts directly into restricted volume under conventional pricing. Portfolio breadth secures the patient without securing the prescription count that funds development. The restriction tightens as guidelines mature rather than easing over time. Development cost cannot be recovered across deliberately limited use.
SHIONOGI

Moat: Difficult Organism Clinical Position

Shionogi holds a position in agents active against organisms where alternatives are genuinely scarce, which places its products at the point where clinicians have very few remaining options available to them. That scarcity gives the position durability that broader spectrum agents do not have. Guideline placement in last-line use is difficult for any competitor to dislodge.
SHIONOGI

Risk: Last-Line Positioning Volume Limits

Reserved last-line positioning delivers very low volume by design, and stewardship exists precisely to keep it that way for as long as possible. Revenue depends on resistance worsening, which is an uncomfortable commercial position and one that payers understand perfectly well. Availability-based payment addresses it and exists in very few markets.

Players Tracked

Prominent Players

Pfizer
Merck & Co
Shionogi
AbbVie
GSK

Other Key Players

Melinta Therapeutics
Iterum Therapeutics
Spero Therapeutics
Venatorx Pharmaceuticals
Basilea Pharmaceutica
Menarini
Teva Pharmaceutical Industries
Viatris
Sun Pharmaceutical Industries
Cipla
Aurobindo Pharma
Hikma Pharmaceuticals
Sandoz
Utility Therapeutics
Zambon

Recent Developments

JANUARY 2025

Health system links community prescribing data to admission outcomes

A national health system published analysis connecting community urinary infection prescribing with subsequent hospital admission rates, an analytical and policy development rather than any corporate transaction. Initial therapy appropriateness correlated with escalation, which had been widely assumed and rarely demonstrated at population scale before. Population scale gave it weight.
Signal: Linking initial therapy to escalation gives manufacturers an economic argument payers have not previously had. Nobody had it before.
MAY 2025

Guidance strengthens against treating asymptomatic bacteriuria in older adults

Clinical guidance was strengthened against treating bacteriuria without symptoms in older patients, a clinical guidance development rather than any commercial event. Roughly two in five such patients receive antibiotics despite existing recommendations, and diagnostic stewardship was emphasised over prescribing restriction as the practical route. Restriction alone had not worked.
Signal: Testing fewer patients removes the finding that prompts treatment, which restriction alone has never achieved. Removing the test works.
SEPTEMBER 2025

Hospital network reports sustained catheter infection rate reduction

A hospital network reported sustained reductions in catheter-associated urinary infection following avoidance and early removal protocols, a clinical outcome disclosure rather than any transaction. Reimbursement penalties for hospital-acquired conditions had made prevention a financial priority alongside the clinical one across the whole network. Rates fell measurably throughout.
Signal: This disease responds quickly whenever somebody is actually held financially responsible for preventing it. Incentives change outcomes here.

What Treatment Costs Overall

Cost structure separates almost completely between settings, which is what makes this disease commercially unusual. Community treatment is generic manufacturing where active ingredient and formulation account for 64 to 74% of a course costing a few dollars. Hospital treatment of severe infection is dominated by bed days, nursing and intensive care rather than by any antimicrobial, with the drug a small fraction of an episode costing tens of thousands.
The volatility that mattered was hospital labour and capacity cost rather than any pharmaceutical input. Nursing and intensive care staffing costs rose sharply through 2022 and 2023 across most health systems, which raised the cost of every escalated episode substantially. Generic ingredient supply interruptions also occurred, which Teva and Viatris disclosures reference, and IEA data records the manufacturing cost pressure. Every escalated episode became more expensive as a result.

Exposure divides by setting rather than by scale. Manufacturers weighted toward community generics carry ingredient and supply risk on products with no pricing power at all. Those with hospital agents carry development cost amortised across stewardship-restricted volume. Health systems carry the escalation cost entirely, and no manufacturer can be paid for reducing it. That gap defines what this market cannot yet reward.
urinary-tract-infection-tratment-market-cost-volatility-analysis-1787702376223

Build total episode cost evidence not drug comparisons

An escalated episode costs roughly 28,400 dollars against a few dollars for community treatment, which makes drug price comparisons economically trivial next to escalation rates. Evidence linking initial therapy to admission reframes the argument onto ground where the numbers are large. It requires linked prescribing and admission data that manufacturers rarely assemble but health systems increasingly hold.

Pursue availability payment for reserved hospital agents

Agents held in reserve for resistant infection generate very low volume by design, and stewardship exists deliberately to keep it that way for as long as possible. Conventional pricing cannot recover development cost across that volume. Availability-based arrangements paying for guaranteed supply rather than prescriptions exist in a handful of systems and must be negotiated before launch terms are settled.

Support diagnostic stewardship rather than resisting it

Roughly two in five older adults with bacteriuria and no symptoms receive antibiotics, which is avoidable volume that guidelines are removing regardless of any manufacturer's preference. Supporting diagnostic stewardship improves targeting of the prescribing that remains. Manufacturers depending on that avoidable volume lose it either way, and are better served by improving the quality of what is left.

Portfolio Architecture for Margin Defence

Margin follows setting and reservation status rather than clinical importance. Community generic treatment earns almost nothing per course despite covering most episodes. Catheter-associated infection treatment earns modestly and is actively being prevented rather than grown. Complicated infection and pyelonephritis agents earn well in hospital. Reserved agents for resistant organisms earn the highest gross margin on the smallest volume. Recurrent infection prophylaxis earns steadily across a genuinely continuing patient relationship.
The tension is that the highest margin products depend on the disease getting worse. Reserved agents earn on resistance, and stewardship exists specifically to slow the resistance that creates their market, which makes commercial planning genuinely awkward. Recurrent infection prophylaxis is the one position aligned with better outcomes, and it requires chronic condition commercial skills that anti-infective organisations built around acute courses generally do not possess at all.

High-value pools sit in three places. Reserved hospital agents supported by availability-based payment rather than volume pricing. Recurrent infection prophylaxis and prevention, which produces the only continuing patient relationship in the disease. And escalation-linked evidence, which has no purchaser yet and would be worth more than either if a payment mechanism existed for it.

Volume / Commodity-Adjacent

Generic community treatment for uncomplicated cystitis and established oral therapy for mild complicated infection. The 9-point range is wide because integrated manufacturers and those purchasing active ingredients face entirely different cost positions on identical products.
Gross Margin: 11-20%

Premium / Certified

Hospital agents for complicated infection and pyelonephritis holding established positions in treatment guidance. The 10-point spread separates agents with first-line hospital placement from those reimbursed only after documented failure of established alternatives.
Gross Margin: 48-58%

Sustainability / Regulatory / Next-Generation

Reserved agents for resistant organisms and non-antibiotic prophylaxis for recurrent infection. The 26-point range is wide because reserved agent margins sit on deliberately restricted volume while prophylaxis carries continuous chronic condition economics.
Gross Margin: 58-84%
urinary-tract-infection-tratment-market-portfolio-architecture-1787702376513

High-value Sub-segments and Strategic Watch-out

Reserved Resistant Organism Agents

Highest gross margin on the smallest volume by design, positioned where alternatives are genuinely scarce and clinicians have few options. The risk is that revenue depends on resistance worsening, which is a commercially awkward position that payers understand entirely and increasingly price accordingly. Payment reform is overdue.
Gross Margin: 76-84%

Recurrent Infection Prophylaxis

Strong growth at 10.2% and the only continuing patient relationship anywhere in this disease, since acute treatment ends in days. The risk is that reaching it requires chronic condition commercial skills that anti-infective organisations built around acute courses do not generally hold. Chronic skills are required.
Gross Margin: 60-68%

Community Generic Treatment

The volume core, covering roughly four fifths of episodes at a few dollars each with negligible margin per course. Manufacturers hold the position because health systems depend on continuity of supply, and because scale supports the wider anti-infective portfolio around it. Nobody exits it deliberately.
Gross Margin: 12-18%

Unpurchased Escalation Prevention

The strategic watch-out and the largest unaddressed value. Roughly 3.1% of episodes escalate at some 28,400 dollars each, and no reimbursement structure pays anybody for preventing that. The risk is that value this large stays unclaimed simply because no mechanism exists. No mechanism exists yet.
Gross Margin: 20-26%

Episodes And The Few That Escalate

Demand is overwhelmingly episodic and overwhelmingly cheap, with the exception that determines everything. A course lasts days, ends, and generates nothing further for the roughly 78% of patients whose uncomplicated infection resolves. The 3.1% who escalate generate an admission costing tens of thousands. The commercial architecture of this disease is therefore shaped by a small tail rather than by the volume that dominates every episode count anybody publishes.
Stickiness exists only in recurrent infection and in hospital formulary position. A patient on prophylaxis that works continues for years and rarely changes. A hospital agent written into empirical treatment protocols for severe infection stays there because changing protocols in acute care requires evidence and committee time nobody spends casually. Community treatment is not sticky in any respect and moves entirely on tender price at every renewal.

The decision maker changes completely with severity. Community treatment is chosen by general practitioners prescribing empirically within a few minutes and by procurement setting what is stocked. Hospital treatment is decided by microbiology, infectious disease and stewardship committees working from local resistance data. Prophylaxis is decided by urologists and guideline committees. Manufacturers organised for one of those settings are absent from the others entirely.
urinary-tract-infection-tratment-market-end-use-penetration-index-1787702376808

Where The Money Actually Moves

These are among the four positions where our research anticipates prominent divergence between winners and laggards over the coming forecast period. Each is grounded in the demand model, the regulatory perimeter, and the announced capacity pipeline.
01 / ESCALATION EVIDENCE BUILDING

Three percent of episodes carry the whole cost

Roughly 78% of all episodes are uncomplicated cystitis treated in the community for a few dollars, while around 3.1% of them escalate to admission costing some 28,400 dollars for a severe case. Manufacturers arguing one agent price against another are therefore having an economically trivial conversation, when set next to the escalation numbers themselves. Building evidence that links initial therapy choice directly to subsequent admission rates reframes the whole discussion onto ground where the sums involved are genuinely very large.
02 / ATYPICAL RECOGNITION SUPPORT

Confusion and falls, not urinary symptoms

Urinary infection in frail older patients frequently presents as confusion, falls or functional decline rather than as anything recognisably urinary, which routinely delays any diagnosis until severe infection has already progressed considerably further. That same ambiguity also produces the opposite error, with roughly 44% of asymptomatic older adults treated for bacteriuria that is not an infection. Manufacturers who support recognition pathways reach clinicians well before the escalation that their own products will then be used to treat at very great expense.
03 / DIAGNOSTIC STEWARDSHIP ALIGNMENT

Test fewer patients rather than treat fewer results

Roughly 44% of all older adults with bacteria in urine and no symptoms receive antibiotics anyway, because a clinician holding a positive culture result finds withholding treatment genuinely difficult to justify to anybody at all. The practical fix is testing fewer patients rather than persuading clinicians to disregard results they already have in front of them. Manufacturers depending on that avoidable volume will lose it as guidance tightens regardless, and are far better served improving the quality of whatever remains.
04 / RECURRENT CARE POSITIONING

The only segment with a returning patient

Recurrent infection growing at 10.2% annually is the single segment in this disease that produces a genuinely continuing patient relationship, because acute treatment ends within a few days and generates nothing at all afterwards. Non-antibiotic prophylaxis and structured management now fill a gap that stewardship itself created, by discouraging continuous antibiotic use in exactly this patient group. Commercially that segment behaves far more like a chronic condition, and organisations built entirely around acute courses of treatment serve it very poorly indeed.

Engagement Snapshot From the Field

A live engagement with an industry participant carrying material or product regulatory and market exposure ahead of a defining policy shift, showing how our research translates into a defensible multi-year portfolio strategy.
MARKET MINDS ADVISORY · CLIENT ENGAGEMENT SUMMARY
Urinary Tract Infection (UTI) Treatment Producer Strategic Portfolio Review and Transition Roadmap 2026·Investment Scenario on Urinary Tract Infection (UTI) Treatment Exposure Evaluation 2025-26
CLIENT PROFILE
An anti-infective developer with hospital agents for complicated urinary infection and a community generic portfolio across European and Asian markets, reporting anti-infective revenue of 890 million dollars (client-reported, unverified by MMA). Hospital agents were positioned entirely on comparative microbiological activity. No escalation or total episode cost evidence existed and recurrent infection was not addressed at all.
STRATEGIC CHALLENGE
Hospital agent uptake had stalled as stewardship committees restricted use to documented failure of established therapy, and community generics were losing tenders on price. Management was preparing further microbiological comparison studies and a manufacturing cost programme. Neither addressed why access decisions were being made on grounds the company was not arguing.
MMA APPROACH
MMA linked the company's prescribing data to published escalation and admission cost benchmarks across five markets, an analysis nobody internally had attempted. Twenty expert interviews with stewardship committee members, hospital microbiologists, general practitioners and urologists established how access and prescribing decisions are actually reached. The analysis treated escalation economics and stewardship access, rather than microbiological activity, as the causes.
KEY FINDINGS
  1. Stewardship committees interviewed had never been presented with escalation or total episode cost evidence, and every submission the company had made argued microbiological activity alone.
  2. Community tender losses had turned entirely on price and supply reliability, and no argument connecting appropriate initial therapy to reduced admission had ever been made.
  3. Recurrent infection was managed by urologists the company had never called on, in a segment growing considerably faster than the acute portfolio it was defending.
  4. Availability-based reimbursement had been discussed by two payers approached during the review, and both indicated it was negotiable only before launch pricing was settled.
CLIENT PROFILE
An anti-infective developer with hospital agents for complicated urinary infection and a community generic portfolio across European and Asian markets, reporting anti-infective revenue of 890 million dollars (client-reported, unverified by MMA). Hospital agents were positioned entirely on comparative microbiological activity. No escalation or total episode cost evidence existed and recurrent infection was not addressed at all.
STRATEGIC CHALLENGE
Hospital agent uptake had stalled as stewardship committees restricted use to documented failure of established therapy, and community generics were losing tenders on price. Management was preparing further microbiological comparison studies and a manufacturing cost programme. Neither addressed why access decisions were being made on grounds the company was not arguing.
MMA APPROACH
MMA linked the company's prescribing data to published escalation and admission cost benchmarks across five markets, an analysis nobody internally had attempted. Twenty expert interviews with stewardship committee members, hospital microbiologists, general practitioners and urologists established how access and prescribing decisions are actually reached. The analysis treated escalation economics and stewardship access, rather than microbiological activity, as the causes.
KEY FINDINGS
  1. Stewardship committees interviewed had never been presented with escalation or total episode cost evidence, and every submission the company had made argued microbiological activity alone.
  2. Community tender losses had turned entirely on price and supply reliability, and no argument connecting appropriate initial therapy to reduced admission had ever been made.
  3. Recurrent infection was managed by urologists the company had never called on, in a segment growing considerably faster than the acute portfolio it was defending.
  4. Availability-based reimbursement had been discussed by two payers approached during the review, and both indicated it was negotiable only before launch pricing was settled.
RECOMMENDED STRATEGY
Phase 1: Phase one: build escalation and total episode cost evidence linking initial therapy to admission, and lead stewardship submissions with it rather than with activity data. Phase 2: Phase two: open availability-based reimbursement discussions for reserved agents before any further launch pricing is publicly settled anywhere. Sequence decides the outcome. Phase 3: Phase three: establish a recurrent infection presence with urologists, since that segment produces the only continuing patient relationship available. Acute treatment ends in days.
OUTCOME
Escalation evidence was assembled across three markets and used in two stewardship submissions, one of which broadened access materially (client-reported, unverified by MMA). Availability-based discussions opened with one national payer ahead of the next launch. A recurrent infection commercial programme was established, reaching urologists the company had never previously contacted at any account.

Frequently Asked Questions

Foundational context covering the market sizes, CAGR, scope, country, region and competition that inform every finding below. This section is provided to cover basics and most often pre-purchase conversations, answered from the MMA Primary Research Dataset.

What is the current size of the Urinary Tract Infection (UTI) Treatment Market?

The market was worth 14.8 billion dollars in 2025, covering uncomplicated, complicated, catheter-associated, pyelonephritis, recurrent and bloodstream infection treatment. It reaches 16.07 billion dollars in 2026.

How large will the Urinary Tract Infection (UTI) Treatment Market be by 2036?

MMA forecasts 36.67 billion dollars by 2036, an increase of 20.60 billion dollars over the 2026 base. That represents an expansion multiple of 2.28 times across the forecast period.

What is the CAGR for the Urinary Tract Infection (UTI) Treatment Market 2026 to 2036?

The base case compounds at 8.6% annually. The bull case reaches 9.8% if hospital agents gain earlier positioning, while the bear case sits at 7.4% on tighter stewardship and improved community prescribing.

Which segment is growing fastest?

Urosepsis and bloodstream infection, at 12.9%, half again the market rate of 8.6%. Ageing populations, resistance and delayed recognition in frail patients drive that growth together.

Who are the major companies in the Urinary Tract Infection (UTI) Treatment Market?

Pfizer, Merck, Shionogi, AbbVie and GSK lead on disclosed anti-infective franchise revenue. Melinta, Venatorx and several Indian generic manufacturers hold significant segment or regional positions.

Which country is growing fastest?

India at 10.7%, as hospital access widens and severe infection enters formal treatment for the first time. China carries roughly 24% of all globally treated episodes.

Report Segmentation Architecture

The full report scope spans multiple orthogonal segmentation dimensions, with cross-tabulated demand data provided for each dimension pair. Coverage extends further to regional breakdowns, trend trajectories, and the competitive detail needed to support segment-level decision-making.

By Infection Classification

  • Uncomplicated Cystitis
  • Complicated Urinary Tract Infection
  • Catheter-Associated Urinary Tract Infection
  • Acute Pyelonephritis
  • Recurrent Urinary Tract Infection
  • Urosepsis and Bloodstream Infection

By End-Use Setting

  • General Practice and Primary Care
  • Emergency Departments
  • Hospital Inpatient Wards
  • Intensive Care Units
  • Long-Term Care Facilities
  • Urology Outpatient Clinics

By Commercial Dimension

  • Empirical Community Prescribing
  • Culture-Directed Hospital Therapy
  • Reserved Agent Restricted Access
  • Availability-Based Subscription Supply
  • Prophylaxis and Prevention Supply
  • National Tender Generic Supply

By Region

  • North America
  • Western Europe
  • East Asia
  • South Asia and Pacific
  • Latin America
  • Middle East and Africa
  • Eastern Europe

Scope, Methodology, and Coverage

Every figure in this report is reproducible from documented input assumptions. The scope below maps the historical period, the forecast horizon, the segmentation dimensions, and the countries covered, alongside the underlying primary and qualitative methodology.
Historical Period
2020 to 2025
Forecast Period
2026 to 2036
Base Year
2025 (USD billions; MMA Primary Research Dataset, August 2026)
Market Definition
Scope covers pharmacological treatment of urinary tract infection across community and hospital settings in adult and paediatric populations, spanning uncomplicated cystitis, complicated urinary tract infection, catheter-associated urinary tract infection, acute pyelonephritis, recurrent urinary tract infection, and urosepsis and bloodstream infection. Prostatitis and epididymitis, sexually transmitted infection, urological surgical and interventional procedures, diagnostic and susceptibility testing products, and catheters, stents and urological devices are excluded from the market size and all derived figures. Community uncomplicated infection and urinary-specific pharmaceutical chemistry are examined in greater depth in separate MMA reports.
Quantitative Units
USD billions (current prices, net of rebates); treated episodes; escalation to admission rate; episode cost by setting; resistance rate in isolates
Segmentation Dimensions
By Infection Classification; By End-Use Setting; By Commercial Dimension; By Region
Regions Covered
North America, Western Europe, East Asia, South Asia and Pacific, Latin America, Middle East and Africa, Eastern Europe
Countries Covered
China, USA, India, Germany, Japan, France, UK, Brazil, Italy, Spain, South Korea, Canada, Australia, Turkey, Poland
Key Companies Profiled
Pfizer, Merck & Co, Shionogi, AbbVie, GSK, Melinta Therapeutics, Iterum Therapeutics, Spero Therapeutics, Venatorx Pharmaceuticals, Basilea Pharmaceutica, Menarini, Teva Pharmaceutical Industries, Viatris, Sun Pharmaceutical Industries, Cipla, Aurobindo Pharma, Hikma Pharmaceuticals, Sandoz, Utility Therapeutics, Zambon
Quantitative Methodology
Primary survey, n=3,800 respondents, Q4 2025, six countries; demand-side model with trade association cross-validation
Qualitative Methodology
47 expert interviews, Q4 2025; applied to validate demand model assumptions, identify emerging dynamics, and assess competitive positioning
Report Format
PDF and XLSX data workbook (Word format preview document)
Publisher
Market Minds Advisory
Report Code
MMA-2026-HLT-123
Published
August 2026
Contact
sales@marketmindsadvisory.com | www.marketmindsadvisory.com

Purchase the full Urinary Tract Infection (UTI) Treatment Market Report (2026 to 2036).

The full report runs to 186 pages and covers all six infection classification segments, seven regions and 20 profiled companies in detail. It includes the complete segment CAGR set, regional resistance and escalation comparison, and total episode cost modelling across community and hospital settings. Company profiles carry evaluation on disclosed anti-infective franchise revenue, with moat and risk assessment for the top five companies. The competitive section extends to 16 tracked clinical, regulatory and reimbursement developments across 2024 and 2025. Primary research inputs include a quantitative survey of 3,800 respondents and 47 expert interviews conducted in Q4 2025.
Six infection classification segments with individual CAGR forecasts
Seven regional markets with resistance and escalation rate comparison
Twenty company profiles on consistent franchise revenue evaluation basis
Sixteen tracked clinical and reimbursement developments with commercial interpretation
Total episode cost modelling across community and hospital care settings
Escalation pathway analysis linking initial therapy to admission outcomes

Built For The People Who Decide

From boardroom strategy to bench-side execution, this report is read cover-to-cover by leaders shaping the next decade of their industry, turning demand scenarios, market dynamics and valuation benchmarks into decisions.
CXOs/ Presidents/ VPs/ Managers
M&A and Corporate Development
Strategy Teams and R&D Heads
Procurement and Product Directors
Regulatory and Compliance Leaders
Investor Relations and Equity Analysts