Market Minds Advisory
Urgent Care Market

Urgent Care Market: A Property Business With Clinicians In It

Site selection decides volume, payer mix decides margin, and both are settled before a single clinician is hired, which means the medicine is rarely what separates a profitable centre from a failing one.

Lead Analyst

Published

September 2026

Make Smarter Decisions with Customized Research Insights

Request a free sample report and evaluate market opportunities, growth trends, and competitive dynamics relevant to your business needs.

2025 MARKET VALUE$48.0BMarket Size 2025
2036 FORECAST VALUE$116.6BBase Case , 2026 to 2036
CAGR 2026 TO 20368.4 %Bull 9.6% / Bear 7.2%
INCREMENTAL OPPORTUNITY$64.5BNet 10- year value creation
EXPANSION MULTIPLE2.24x2036 value over 2026 base
Strategic Levers
M&A Pipeline
Regional Outlook
Country Rankings
Competitive Intelligence
Segmental Deep-dive
Call-Us : 91 93563 13602

Executive Snapshot and Market Trajectory

Two decisions made before opening determine whether a centre works: where it sits and who insures the people around it. Commercially insured patients reimburse at a multiple of public coverage, and catchment radius runs to about six kilometres. Neither is fixable by practising better medicine afterwards.
North America takes 44% of value, far above the usual band, because urgent care exists as a distinct commercial setting largely on account of American insurance structure and emergency department pricing. Virtual and hybrid urgent care grows at 12.6%, half again the market rate of 8.4%, and it attacks precisely the straightforward complaints that carry a physical centre through its quieter months. Nobody planned it that way.
Concentration is very low at 18% and the most dangerous competitor is not another operator. Health systems buy urgent care networks for downstream referral capture rather than visit margin, which means an independent competes against somebody willing to lose money on the visit deliberately and recover it in imaging and surgery. Virtual providers attack from the other side on price and immediacy. Both pressures are arriving at once. Nothing here is fixable later.
Market Definition
The market covers walk-in urgent care delivered outside emergency departments and scheduled primary care, including acute episodic illness and injury visits, occupational health and employer services, on-site diagnostics and imaging, preventive, screening and vaccination services, virtual and hybrid urgent care, and chronic condition bridge and follow-up care. Hospital emergency departments, freestanding emergency facilities, scheduled primary care, retail pharmacy dispensing, and ambulance services are excluded.
Base Year Value
$48.0B in 2025 (MMA Primary Research Dataset, August 2026)
Forecast Period
2026 to 2036, eleven discrete annual values
CAGR
8.4% base case. Bull 9.6%. Bear 7.2%.
Fastest Growth Segment
Virtual and Hybrid Urgent Care: 12.6% CAGR
Fastest Growth Country
India: 10.5% CAGR
Fastest Growth Region
South Asia and Pacific: 10.6% CAGR
Largest Region
North America: 44% of 2025 global value
Market Leaders
Concentra, Optum, CityMD, NextCare Urgent Care, American Family Care. Source: MMA Analysis based on disclosed urgent care and ambulatory clinic revenue, company annual reports 2025.
Primary Survey
n=3,800 procurement and R&D decision-makers, Q4 2025, six countries
Methodology
Demand-side build-up, cross-validated against public data, 47 expert interviews

Urgent Care Market Forecast Scenarios

urgent-care-market-size-forecast-scenario-1787702368124
Growth from 2020 to 2025 ran at 8.0% and the composition shifted more than the headline suggests. Respiratory testing and vaccination volumes distorted the early years considerably before normalising. Virtual consultation arrived permanently across the same period and took a meaningful share of the simplest complaints. Health system acquisition accelerated throughout, driven by referral capture rather than anything inside the centres.
The 8.4% base case rests on three mechanisms. Employer occupational health contracts keep expanding because they deliver predictable volume that smooths the seasonal collapse every centre suffers between respiratory seasons. On-site diagnostics keep growing because they raise revenue per visit without adding a visit. And Asian and Latin American markets keep developing walk-in models as private ambulatory capacity expands. All three work on utilisation and revenue per visit rather than on attracting more patients.
The bull case at 9.6% assumes employer and payer contracting expands enough to smooth seasonality materially, which would change the staffing economics of the whole model. The bear case at 7.2% is virtual care taking the straightforward complaints faster than physical centres replace them with diagnostics and procedures, leaving fixed property and staffing costs spread across a shrinking and more complex visit mix.

Location Before Medicine

This is a retail business that happens to employ clinicians. Patients choose the nearest visible option within roughly six kilometres, so frontage, parking and traffic pattern decide volume in a way clinical quality never does. Payer mix then decides whether that volume is worth having at all. Both are fixed when the lease is signed and no later improvement changes either.
FIVE-FIRM CONCENTRATION18%Share of urgent care revenue held by the largest operators
AVERAGE VISIT REIMBURSEMENT$186Typical payment received for a standard urgent care visit
TOP MARKET COUNTRYUS 71%American share of global urgent care centre visit revenue
SEASONAL VISIT CONCENTRATION41%Annual visits arriving during the respiratory illness months
COMMERCIAL PAYER THRESHOLD62%Commercially insured share needed for standalone centre viability
MEDIAN CATCHMENT RADIUS6 kmDistance beyond which patients choose a nearer alternative
Seasonality is the operational problem nobody solves elegantly. Roughly 41% of annual visits arrive in the respiratory months, against a property and staffing base that costs the same all year. Staffing to the peak wastes money for two thirds of the year. Staffing to the average produces waits that destroy the one thing patients came for, which is speed. Employer contracts are attractive because that volume ignores the curve.
The most dangerous competitor is a health system rather than another operator. Networks are acquired for downstream referral capture into imaging, specialist care and surgery, which means the visit itself need not be profitable at all. An independent competing on visit economics faces somebody treating it as acquisition cost. Virtual providers attack from the other direction on price and immediacy.
"Show me the lease and the payer mix and I will tell you how the centre performs. Nobody wants to hear that the medicine is the least variable part of this business."
Director, Ambulatory Care Services Practice · MMA Healthcare Services Practice · August 2026

Market Trends

Virtual Care Takes The Simplest Complaints First

Virtual consultation handles a substantial share of the straightforward presentations that used to fill quieter weeks at a physical centre, and it does so at a fraction of the cost with no travel involved. Growth at 12.6% comes largely at the expense of the visit mix that made off-season economics survivable. Operators responding with hybrid models capture some of it back, while those treating virtual as a separate channel find it competing directly with their own centres for the same patients. Delivery costs a fraction of an in-person visit, so preference for it is rational.
Market Impact: Smooths 41% seasonal concentration

Health Systems Buy Networks For Referral Capture

Hospital groups acquire urgent care networks to feed imaging, specialist consultation and surgical volume rather than to earn margin on the visit, which changes what the asset is for entirely. An independent operator competing on visit economics faces somebody who has treated the visit as a customer acquisition cost and priced accordingly. Roughly 62% commercial payer mix is needed for standalone viability, and a health system owner does not need the centre to clear that threshold at all. Independents therefore lose site auctions to buyers valuing the asset on an entirely different basis.
Market Impact: Develops across 3 urbanising systems

Market Opportunities and Growth Drivers

Employer Contracts Deliver Volume Outside Respiratory Season

Occupational health work including injury management, pre-employment screening and drug testing arrives on a schedule unrelated to the respiratory curve that concentrates roughly 41% of ordinary visits into four months. That volume smooths staffing and property utilisation across the rest of the year, which is why operators pursue employer contracts well beyond what the direct margin alone would justify. Growth at 7.2% in that segment understates its commercial value to a business with entirely fixed costs. Operators pricing those contracts on direct margin alone consistently turn away work they actually need.
Market Impact: Needs 62% commercial coverage

Asian Ambulatory Capacity Develops Walk-In Care Models

Private ambulatory capacity across India, China and Southeast Asia is expanding in cities where hospital outpatient departments are heavily overloaded and waiting times are long, which creates demand for the same convenience proposition urgent care serves in North America. India grows fastest of any country at 10.5% as private hospital groups and clinic chains extend walk-in provision. Payment runs largely through self-pay and private insurance, so payer mix works differently from the American model. Self-pay and private insurance carry most of the volume across those markets. Payer mix works quite differently there.
Market Impact: Concentrates 41% into 4 months

Market Restraints and Challenges

Payer Mix Excludes The Areas With Greatest Need

Standalone viability generally requires around 62% commercially insured patients, since public coverage reimburses a visit at a fraction of commercial rates against an identical cost to deliver. Root cause is a reimbursement structure that pays differently for the same service depending on who is covering it. The commercial impact is centres clustering in insured suburbs and avoiding areas with the most unmet need. Mitigation runs through value-based contracting, which very few operators have built capability for. Value-based arrangements change the arithmetic and few operators can execute them. The clustering is a payment artefact.
Market Impact: Diverts visits across 8 quiet months

Fixed Costs Meet Radically Variable Visit Volume

Property and core staffing cost the same every month while roughly 41% of visits arrive across four of them, which leaves an operator choosing between paying for idle capacity and producing waits that defeat the purpose of the visit. Root cause is that the value proposition is speed and speed requires slack. The commercial impact is thin annual margins on strong seasonal peaks. Mitigation involves employer contracts and flexible clinical staffing models that most operators implement badly. Employer contracts are the practical answer most operators underuse. Slack is what the proposition requires.
Market Impact: Requires 62% commercial payer mix
3 additional market trends, 4 additional growth drivers, and 2 additional restraints and challenges are covered in the full report. Contact sales@marketmindsadvisory.com to access the complete intelligence.

Segment CAGR and Growth Architecture

Segmentation follows the service delivered at or through the centre: what care the patient receives, rather than who operates the site or how the visit is funded. Six service categories cover the market without overlap, spanning in-person and virtual delivery. Ownership model and payment route are treated as separate commercial dimensions here. Acuity cuts across every service category.
urgent-care-market-market-share-analysis-1787702368410

Virtual and Hybrid Urgent Care

Growth at 12.6%, half again the market rate of 8.4%, comes largely from the simplest presentations moving off site, which are exactly the visits that carried physical centres through quieter months. Delivery costs a fraction of an in-person visit and requires no travel, so patient preference for it is entirely rational. Operators running hybrid models capture some of that volume back, while those treating virtual as a separate business discover it competing directly against their own centres for identical patients within the same catchment. Hybrid design rather than channel separation is what determines whether an operator captures the shift or simply loses to it. Channel separation loses to the operator's own centres.
CAGR 12.6%

Chronic Condition Bridge and Follow-Up Care

Patients unable to obtain timely primary care appointments increasingly use urgent care for medication continuation, results review and interim management of stable chronic conditions, which is not what the model was designed for and is now a meaningful share of visits. Growth at 10.2% follows primary care access constraints rather than any deliberate strategy. It also produces visits with lower acuity and better payer mix than acute presentations, and it builds a returning patient relationship the walk-in model otherwise entirely lacks. Primary care access constraints rather than any operator strategy created this segment, and it is now too large to treat as incidental. Returning patients are otherwise rare here. Payer mix is better too.
CAGR 10.2%
Full segment breakdown across 6 segments available in the complete report.

Regional Architecture and Country Demand Map

Geography follows healthcare payment structure rather than population, because urgent care exists as a separate commercial setting only where insurance and emergency pricing make it necessary. North America dominates, and India grows fastest. Two regions sit outside the standard bands for the same reason. Structure decides everything.

North America

The 44% share sits far above the standard band because urgent care exists as a distinct commercial setting largely on account of American insurance structure and emergency department pricing, which together create a gap that this model was built to fill. Roughly 71% of global visit revenue is American. Health system acquisition of networks for downstream referral capture is well advanced and reshapes competitive conditions for independents. Payer mix determines site selection more than population health need does, which concentrates centres in commercially insured suburbs. Virtual providers and health system owned networks now squeeze independent operators from opposite directions simultaneously, which is reshaping ownership across most metropolitan markets. Independents are being squeezed out.
Share: 44% | CAGR: 7.6% (2026 to 2036)

Western Europe

Public health systems provide the same function through general practice out-of-hours services, minor injury units and hospital outpatient departments, so a separate commercial urgent care category is much smaller here than population would suggest. Private walk-in provision exists in the United Kingdom and parts of Germany and Spain, serving insured and self-paying patients who value speed. Occupational health is a more established commercial category than acute walk-in care. Growth follows private insurance penetration rather than any change in public provision. Seasonality affects private walk-in provision in the same way it does elsewhere, and employer contracts provide the same utilisation smoothing. Public provision covers the function largely, which caps how far commercial walk-in care can expand here.
Share: 18% | CAGR: 6.8% (2026 to 2036)
Regional intelligence for 5 additional markets available in the complete report: East Asia, South Asia and Pacific, Latin America, Middle East and Africa, Eastern Europe. Contact sales@marketmindsadvisory.com.
urgent-care-market-country-cagr-analysis-1787702368748

Fixing What The Lease Cannot

Catchment runs to about six kilometres, viability needs roughly 62% commercial payer mix, 41% of visits arrive in four months, and health systems buy networks for referral rather than margin. Four levers work on seasonality, revenue per visit, contracting capability and site discipline rather than on clinical quality. Clinical quality is not the variable here.

Contract Employer Volume To Fill Quiet Months

Roughly 41% of ordinary visits arrive across four respiratory months against a property and staffing base that costs the same all year, which is the central operational problem in this business. Occupational health work arrives on a schedule unrelated to that curve. Operators pursuing employer contracts for utilisation rather than for direct margin value them correctly, and those assessing them on visit profitability alone consistently underprice their own capacity and turn work away. Idle capacity costs the same as busy capacity. Utilisation is the real prize here. Margin is the wrong test.
Market Impact: Fills 8 quiet months of idle centre capacity

Raise Revenue Per Visit Through On-Site Diagnostics

Imaging, point-of-care laboratory testing and minor procedures raise what a visit is worth without requiring an additional patient through the door, which matters enormously when the patient count is the variable an operator cannot control. Average visit reimbursement near 186 dollars rises substantially where diagnostics are available on site. Capital and staffing requirements are real, and the alternative is competing for volume in a catchment of about six kilometres against everyone else doing the same. Geography caps the patient count permanently. Everyone competes for the same patients. Visit value is the controllable one.
Market Impact: Lifts revenue above the $186 average visit value

Build Value-Based Contracting To Escape Payer Mix

Standalone viability generally requires around 62% commercially insured patients because public coverage reimburses the identical service at a fraction of the rate, which is why centres cluster in insured suburbs and avoid areas of greatest need. Capitated and value-based arrangements pay for population outcomes rather than per visit, which changes where a centre can viably operate. Very few operators have built the analytics and risk capability those contracts require, and the ones that have face far less competition. It also opens locations that current economics simply exclude, which is where unmet need actually sits.
Market Impact: Removes the whole 62% commercial payer mix requirement

Underwrite Sites On Payer Mix Not Population

Catchment runs to roughly 6 kilometres and patients choose the nearest visible option, so a site decision is effectively irreversible and fixes both volume and payer mix before any clinician is hired. Operators underwriting on population density alone open centres that cannot clear the commercial coverage threshold and then attempt to fix them operationally, which never works. Disciplined site underwriting on insurance data prevents more losses than any subsequent operational programme recovers. Closing a bad site beats rescuing it. Underwriting prevents what operations cannot fix. Insurance data is the right input.
Market Impact: Underwrites within a 6 kilometre catchment radius properly

Who Controls the Margin Pool

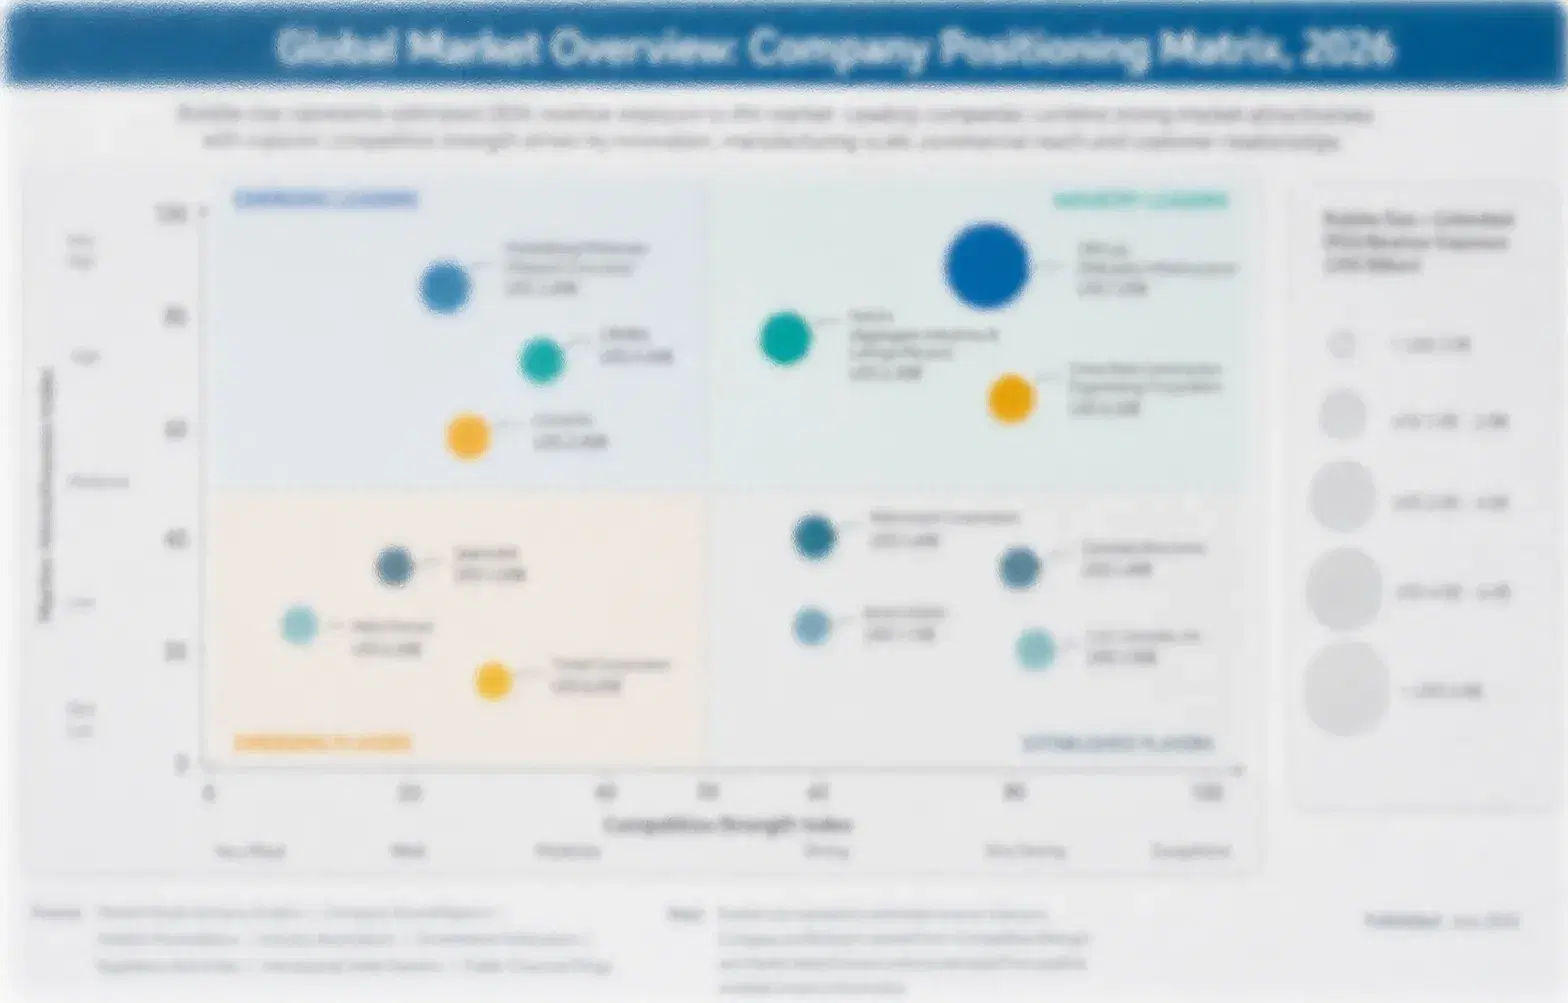
Measured on disclosed urgent care and ambulatory clinic revenue, the five largest operators hold a CR5 of just 18%, which reflects a business where every site is a separate local decision and scale confers surprisingly little. Concentra holds a strong occupational health position, Optum and CityMD operate substantial backed networks, and thousands of independents hold the remainder. Scale confers almost nothing in a business decided lease by lease.
Three contests define activity. Site competition is local and effectively decided by lease terms and visibility within a catchment of a few kilometres. Employer occupational health competes on contract terms and geographic coverage across multiple sites. And virtual providers compete on price and immediacy for the simplest complaints, which is a different business with a different cost structure entirely. An operator built for one contest is rarely equipped for the others.

Pressure builds from both directions simultaneously. Health systems acquire networks for referral capture and accept visit economics independents cannot match, while virtual care takes the straightforward volume that made off-season months survivable. Rankings shift toward operators with employer contracts and diagnostic capability rather than toward those with more sites. Site count is not the variable.
urgent-care-market-company-positioning-matrix-1787702369041

Competitive Moat and Risk Dimensions

CONCENTRA

Moat: Employer Contract Network Coverage

Concentra built its position around occupational health contracts with national employers, which requires geographic coverage no regional operator can offer and delivers volume unrelated to the respiratory curve that governs everyone else's utilisation. That coverage took decades to assemble. An employer needing consistent injury management across many states has very few alternatives to consider.
CONCENTRA

Risk: Employment Cycle Volume Exposure

Occupational health volume tracks employment levels and industrial activity, which move with economic cycles the company does not influence at all. A downturn reduces injury and screening volume simultaneously across the whole network. Contract coverage protects the relationship without protecting the underlying volume that makes it worth having.
OPTUM

Moat: Payer And Provider Integration

Optum operates urgent care within a broader payer and provider organisation, which means a visit can be valued for its effect on total cost of care rather than on visit reimbursement alone. That allows site economics no independent operator can replicate. It also permits value-based arrangements that escape the commercial payer mix threshold constraining standalone centres entirely.
OPTUM

Risk: Regulatory And Integration Scrutiny

Combining payer, provider and ambulatory assets attracts sustained regulatory attention in several jurisdictions, and integration commitments frequently constrain how freely those assets can be operated together. The advantage depends on arrangements that policy could restrict. An advantage that rests on permitted integration is exposed to a decision made elsewhere.

Players Tracked

Prominent Players

Concentra
Optum
CityMD
NextCare Urgent Care
American Family Care

Other Key Players

FastMed
GoHealth Urgent Care
Carbon Health
WellNow Urgent Care
Patient First
MultiCare Indigo
ZoomCare
Physicians Immediate Care
Nao Medical
Aspen Medical
Practice Plus Group
Ramsay Health Care
Apollo Hospitals
Raffles Medical Group
IHH Healthcare

Recent Developments

MARCH 2025

Health system acquires regional urgent care network for referral capture

A hospital group acquired a regional urgent care network, an acquisition rather than any joint venture or management agreement. The stated rationale centred on downstream imaging, specialist and surgical referral rather than on visit margin, which is a valuation the independent seller could not have justified alone.
Signal: Referral capture lets a health system pay more for a network than visit economics alone could ever support.
JULY 2025

Operator expands on-site diagnostic imaging across centre network

An urgent care operator installed diagnostic imaging across a substantial portion of its network, an organic capital investment rather than any acquisition. Revenue per visit rather than visit count had become the controllable variable, given that catchment radius limits how many patients any single site can realistically attract.
Signal: Revenue per visit is controllable where visit count is largely fixed by catchment geography and competition.
OCTOBER 2025

National employer consolidates occupational health onto single provider

A national employer consolidated injury management and screening services onto one urgent care provider across its sites, a contracting decision rather than any corporate transaction. Geographic coverage rather than price had been the deciding factor, since inconsistent local arrangements had created administrative burden. Coverage decided the award outright.
Signal: Employer contracts reward geographic coverage, which regional operators simply cannot offer national customers. Scale finally matters somewhere.

What A Visit Costs To Deliver

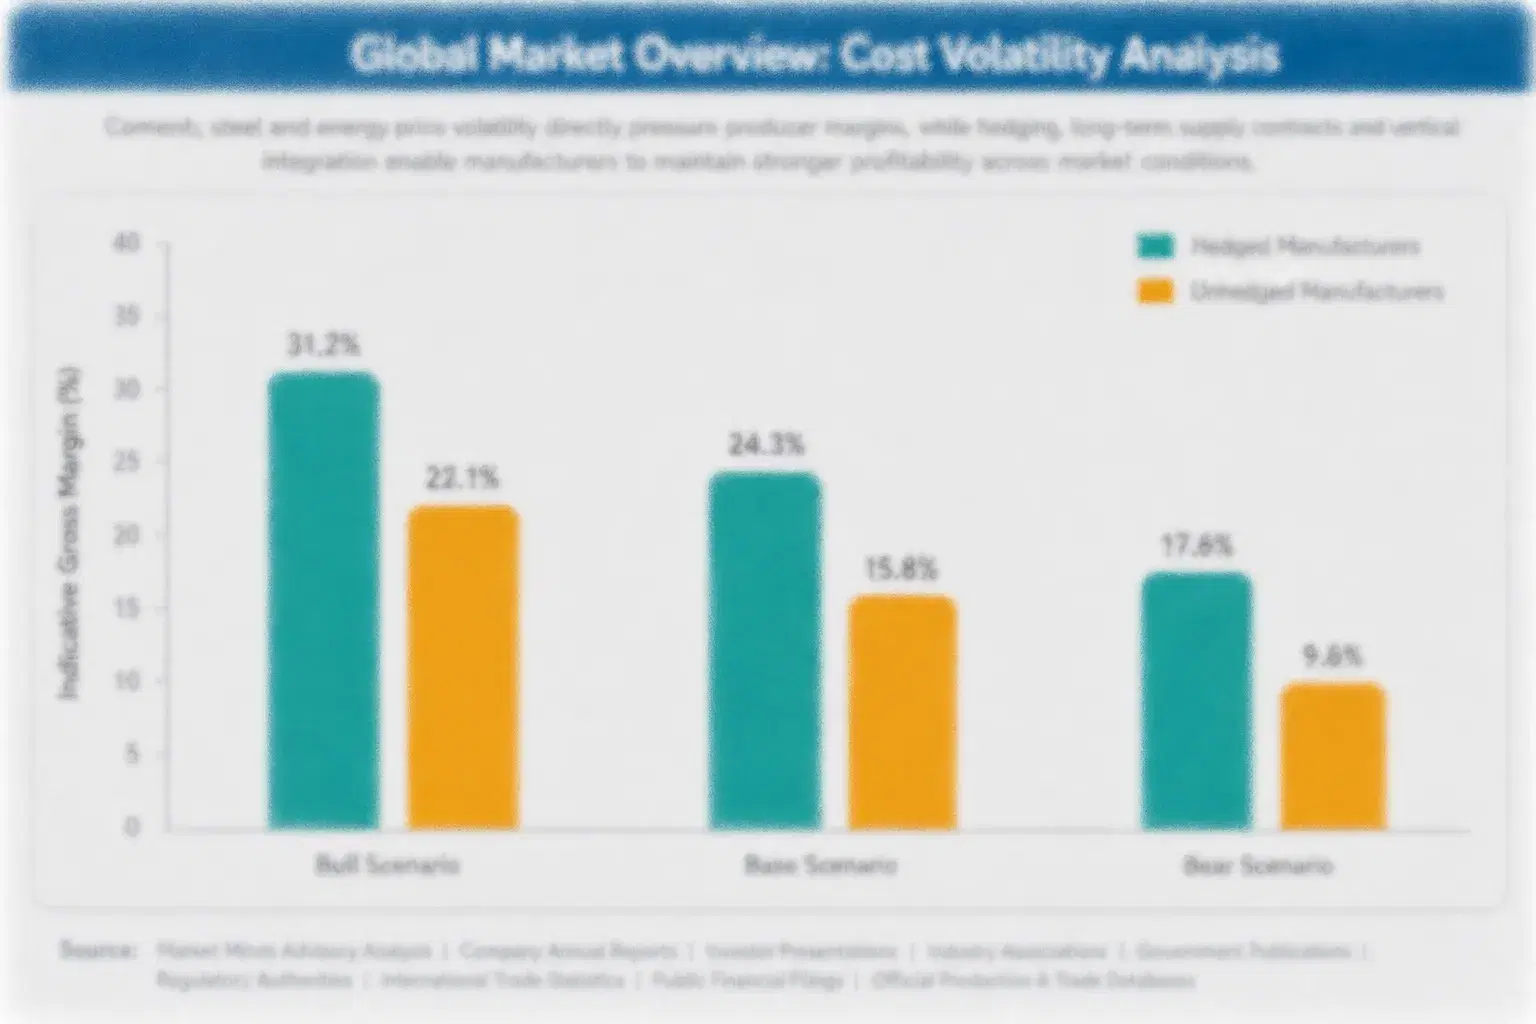
Clinical labour and property dominate and both are fixed against variable volume, which is the defining cost characteristic of this business. Physician, advanced practice provider and support staffing account for 44 to 53% of centre operating cost, with property and occupancy adding substantially more. Neither scales down when volume halves between seasons, which is why annual margin looks nothing like peak month margin.
The volatility that mattered was clinical labour cost through 2022 and 2023. Wage inflation for nursing and advanced practice providers ran well ahead of reimbursement growth across most markets, compressing margins on a cost line that cannot be reduced without closing hours. Property and utility costs rose alongside, which IEA data records, and lease renewals reset occupancy upward. Both cost lines moved against reimbursement that did not follow.

Exposure divides by payer mix and contract structure rather than by scale. Operators weighted toward commercial insurance absorb cost increases within reimbursement that adjusts, however slowly. Those with heavier public coverage face rates set administratively and adjusted rarely, on identical delivery costs. Health system owned centres carry the same costs against a referral benefit that independents cannot count, which changes what an acceptable centre margin even looks like.
urgent-care-market-cost-volatility-analysis-1787702369342

Contract employer volume for utilisation not margin

Property and core staffing cost the same in every month while roughly two fifths of visits arrive across four of them, which leaves capacity idle for much of the year at almost every centre. Occupational health volume ignores that curve. Valuing those contracts on utilisation rather than margin prices them correctly. Operators judging them on margin alone turn work away.

Flex clinical staffing against forecast seasonal demand

Staffing to the seasonal peak wastes money for two thirds of the year and staffing to the average produces waits that defeat the only thing patients came for, which is speed of access. Flexible arrangements including seasonal contracts and shared regional staffing address that directly. Most operators implement this poorly, and the cost shows either way.

Underwrite leases on insurance data not footfall

Payer mix is fixed by location and standalone viability typically needs around three fifths commercial coverage, which no operational improvement can subsequently change once a lease is signed. Underwriting sites on local insurance composition rather than on population or traffic prevents losses that no later programme recovers. Operators learn this expensively and generally only once.

Portfolio Architecture for Margin Defence

Margin follows what happens during the visit rather than the visit itself. Straightforward acute presentations earn thinly and are exactly what virtual care is taking. Preventive and vaccination services earn modestly on high throughput. Occupational health earns well and delivers utilisation worth more than its own margin. On-site diagnostics earn best per visit because they raise revenue without requiring another patient. Chronic bridge care earns steadily with better payer mix and returning patients.
The tension is between volume the operator cannot control and revenue per visit that it can. Catchment radius and competition fix how many patients arrive, and no marketing programme meaningfully changes that within a few kilometres. What an operator does control is what a visit is worth once the patient is inside. Operators focused on patient acquisition push against geography; those focused on visit value do not.

High-value pools sit in three places. On-site diagnostics and procedures, which raise revenue without requiring additional footfall. Employer occupational health contracts, which fill capacity that would otherwise sit idle for most of the year. And value-based contracting capability, which escapes the commercial payer mix threshold that dictates where centres can currently operate at all.

Volume / Commodity-Adjacent

Straightforward acute episodic visits and vaccination or screening services delivered at high throughput. The 9-point range is wide because payer mix varies enormously between sites and identical delivery costs produce very different realised revenue per visit.
Gross Margin: 12-21%

Premium / Certified

Occupational health and employer service contracts together with chronic condition bridge and follow-up care. The 9-point spread separates operators with national employer coverage from those holding only local contracts at considerably weaker terms.
Gross Margin: 26-35%

Sustainability / Regulatory / Next-Generation

On-site diagnostics and imaging, minor procedures, and virtual and hybrid delivery models. The 23-point range is wide because imaging carries capital-intensive economics while virtual delivery carries almost no marginal cost per consultation.
Gross Margin: 31-54%
urgent-care-market-portfolio-architecture-1787702369669

High-value Sub-segments and Strategic Watch-out

On-Site Diagnostics And Imaging

Highest value per visit and growing at 8.4%, because it raises what a patient is worth without requiring another patient through a door that catchment geography already limits. The risk is capital intensity and utilisation, since imaging equipment sitting idle carries cost through every quiet month.
Gross Margin: 47-54%

Employer Occupational Health

Steady margins and volume arriving independently of the respiratory curve, which makes it worth considerably more than its direct margin suggests. The risk is that this volume tracks employment and industrial activity, so a downturn removes exactly the utilisation the model depends upon. Cycles decide it.
Gross Margin: 31-37%

Acute Episodic Visits

The volume core, thin on margin and heavily seasonal, and precisely what virtual providers are taking at a fraction of the delivery cost. Operators hold it because it is what a centre is for, and because losing it removes the reason patients know the site exists.
Gross Margin: 13-19%

Health System Referral Economics

The strategic watch-out. Hospital groups value networks for downstream imaging, specialist and surgical capture rather than visit margin, and can therefore outbid and outlast independents. The risk is competing on visit economics against somebody who has stopped counting them. Valuations reflect that, and independents cannot match them on any site.
Gross Margin: 20-26%

Visits Without Relationships

Urgent care demand is episodic and largely anonymous, which distinguishes it from almost every other healthcare setting. A patient arrives once, is treated and may never return, and the operator carries a property and staffing base sized for volume it cannot predict beyond seasonal averages. There is no panel and no recurring revenue except through employer contracts or bridge care.
Stickiness is geographic rather than clinical. Patients return to the nearest visible option within a few kilometres, so a competitor opening closer takes volume regardless of prior experience or quality. Employer contracts are genuinely sticky because switching means renegotiating coverage across many sites. Chronic bridge care builds returning patients almost by accident, which is why it matters commercially far more than its share of visits suggests.

The decision maker splits between the patient choosing where to go and the employer or payer deciding where care is funded. Patients choose on proximity, visible wait time and whether the site accepts their coverage. Employers choose on geographic coverage and administrative simplicity across their whole footprint. Payers increasingly steer patients through networks and cost sharing. Operators built only for walk-in patients are absent from the two channels that provide predictable volume.
urgent-care-market-end-use-penetration-index-1787702369951

Where Site Economics Decide

These are among the four positions where our research anticipates prominent divergence between winners and laggards over the coming forecast period. Each is grounded in the demand model, the regulatory perimeter, and the announced capacity pipeline.
01 / SITE UNDERWRITING DISCIPLINE

The lease decides more than the medicine

Catchment runs to roughly six kilometres and patients simply choose whichever visible option is nearest, so a single site decision fixes both volume and payer mix long before any clinician has been hired anywhere. Standalone viability typically requires around 62% commercially insured patients, because public coverage reimburses the identical service at a small fraction of the commercial rate. Operators who underwrite sites on population density rather than on insurance composition open centres that no subsequent operational programme will ever rescue.
02 / SEASONALITY VOLUME CONTRACTING

Buy utilisation not visit margin from employers

Roughly 41% of ordinary visits arrive across four respiratory months, while property and core staffing cost exactly the same in every single month of the year. Occupational health work arrives on a schedule that is entirely unrelated to that seasonal curve, which makes that work worth considerably more to an operator than its own direct margin would ever suggest. Operators assessing those contracts on visit profitability alone therefore underprice their own idle capacity consistently, and turn away work they genuinely need.
03 / VISIT VALUE ENGINEERING

Footfall is fixed and revenue per visit is not

Catchment geography and local competition between operators together fix how many patients arrive at any given centre, and no marketing programme changes that in any meaningful way within a radius of a few kilometres. What an operator genuinely does control is what each visit is worth once that patient is already inside the building. On-site diagnostics, point-of-care laboratory testing and minor procedures all raise the average visit reimbursement well above the typical figure, without ever requiring any additional footfall whatsoever.
04 / REFERRAL ECONOMICS AWARENESS

Your competitor stopped counting the visit

Health systems acquire urgent care networks in order to capture downstream imaging, specialist consultation and surgical volume, rather than to earn any margin at all on the visit itself. An independent operator competing on visit economics is therefore competing against somebody who has quietly reclassified that same visit as a customer acquisition cost instead. That competitor is then able to outbid on sites, outlast on pricing, and accept a payer mix that would close an independent centre inside a single year.

Engagement Snapshot From the Field

A live engagement with an industry participant carrying material or product regulatory and market exposure ahead of a defining policy shift, showing how our research translates into a defensible multi-year portfolio strategy.
MARKET MINDS ADVISORY · CLIENT ENGAGEMENT SUMMARY
Urgent Care Producer Strategic Portfolio Review and Transition Roadmap 2026·Investment Scenario on Urgent Care Exposure Evaluation 2025-26
CLIENT PROFILE
A regional urgent care operator running thirty-one centres across three states, with reported revenue of 168 million dollars (client-reported, unverified by MMA). Roughly 88% of revenue came from acute episodic visits. Occupational health contracts existed at eight sites and on-site diagnostics were limited to basic point-of-care testing. No value-based arrangements were in place with any payer.
STRATEGIC CHALLENGE
Eleven centres were operating below contribution targets and two health systems had acquired competing networks in the same markets at valuations management could not understand. Management was preparing a patient acquisition marketing programme and a service quality initiative. Neither addressed why the underperforming sites differed from the profitable ones. Site quality had never been examined.
MMA APPROACH
MMA analysed site-level performance against local insurance composition and competitive proximity, using data the company held across separate property and billing systems. Nineteen expert interviews with operators, employer benefits managers and health system ambulatory leads established how site and contracting decisions are made. The analysis treated payer mix, seasonality and referral economics rather than service quality as the causes.
KEY FINDINGS
  1. All eleven underperforming centres sat below the commercial coverage threshold that separated profitable from unprofitable sites, and none had been underwritten on insurance composition.
  2. Occupational health contracts at eight sites were priced on direct margin, and three had been declined entirely because the margin looked thin against acute visit revenue.
  3. Health system acquisitions had valued networks on downstream referral capture, which explained valuations that visit economics alone could not possibly have justified.
  4. Average revenue per visit varied by nearly half across the network, and the variation tracked on-site diagnostic availability rather than case mix or clinical staffing.
CLIENT PROFILE
A regional urgent care operator running thirty-one centres across three states, with reported revenue of 168 million dollars (client-reported, unverified by MMA). Roughly 88% of revenue came from acute episodic visits. Occupational health contracts existed at eight sites and on-site diagnostics were limited to basic point-of-care testing. No value-based arrangements were in place with any payer.
STRATEGIC CHALLENGE
Eleven centres were operating below contribution targets and two health systems had acquired competing networks in the same markets at valuations management could not understand. Management was preparing a patient acquisition marketing programme and a service quality initiative. Neither addressed why the underperforming sites differed from the profitable ones. Site quality had never been examined.
MMA APPROACH
MMA analysed site-level performance against local insurance composition and competitive proximity, using data the company held across separate property and billing systems. Nineteen expert interviews with operators, employer benefits managers and health system ambulatory leads established how site and contracting decisions are made. The analysis treated payer mix, seasonality and referral economics rather than service quality as the causes.
KEY FINDINGS
  1. All eleven underperforming centres sat below the commercial coverage threshold that separated profitable from unprofitable sites, and none had been underwritten on insurance composition.
  2. Occupational health contracts at eight sites were priced on direct margin, and three had been declined entirely because the margin looked thin against acute visit revenue.
  3. Health system acquisitions had valued networks on downstream referral capture, which explained valuations that visit economics alone could not possibly have justified.
  4. Average revenue per visit varied by nearly half across the network, and the variation tracked on-site diagnostic availability rather than case mix or clinical staffing.
RECOMMENDED STRATEGY
Phase 1: Phase one: reprice and pursue employer occupational health contracts on utilisation value rather than direct margin, filling capacity idle for most of the year. Phase 2: Phase two: extend on-site diagnostics across viable sites, since revenue per visit is controllable where footfall is fixed by catchment. Phase 3: Phase three: rebuild site underwriting around local insurance composition and stop attempting operational rescue of permanently unviable centres. Closure beats operational rescue.
OUTCOME
Employer contracting was repriced and three previously declined contracts were secured, improving off-season utilisation measurably. On-site diagnostics were extended to fourteen further centres and revenue per visit rose materially at those sites (client-reported, unverified by MMA). Four centres below the coverage threshold were closed rather than subjected to a further operational programme.

Frequently Asked Questions

Foundational context covering the market sizes, CAGR, scope, country, region and competition that inform every finding below. This section is provided to cover basics and most often pre-purchase conversations, answered from the MMA Primary Research Dataset.

What is the current size of the Urgent Care Market?

The market was worth 48.0 billion dollars in 2025, covering acute visits, occupational health, diagnostics, preventive services, virtual care and chronic bridge care. It reaches 52.03 billion dollars in 2026.

How large will the Urgent Care Market be by 2036?

MMA forecasts 116.58 billion dollars by 2036, an increase of 64.55 billion dollars over the 2026 base. That represents an expansion multiple of 2.24 times across the forecast period.

What is the CAGR for the Urgent Care Market 2026 to 2036?

The base case compounds at 8.4% annually. The bull case reaches 9.6% if employer contracting smooths seasonality materially, while the bear case sits at 7.2% on virtual care taking simple visits faster.

Which segment is growing fastest?

Virtual and hybrid urgent care, at 12.6%, half again the market rate of 8.4%. It takes the straightforward complaints that previously carried physical centres through quieter months.

Who are the major companies in the Urgent Care Market?

Concentra, Optum, CityMD, NextCare Urgent Care and American Family Care lead on disclosed urgent care and ambulatory revenue. GoHealth, Carbon Health and Patient First hold significant regional networks.

Which country is growing fastest?

India at 10.5%, as private hospital groups and clinic chains extend walk-in provision into overloaded urban markets. The United States accounts for roughly 71% of global visit revenue.

Report Segmentation Architecture

The full report scope spans multiple orthogonal segmentation dimensions, with cross-tabulated demand data provided for each dimension pair. Coverage extends further to regional breakdowns, trend trajectories, and the competitive detail needed to support segment-level decision-making.

By Service Delivered

  • Acute Episodic Illness and Injury Visits
  • Occupational Health and Employer Services
  • On-Site Diagnostics and Imaging
  • Preventive, Screening and Vaccination Services
  • Virtual and Hybrid Urgent Care
  • Chronic Condition Bridge and Follow-Up Care

By End-Use Setting

  • Freestanding Urgent Care Centres
  • Retail and Shopping Centre Locations
  • Health System Owned Networks
  • Employer On-Site Clinics
  • Hybrid Virtual and Physical Networks
  • Rural and Underserved Access Points

By Commercial Dimension

  • Commercial Insurance Reimbursement
  • Public Coverage Reimbursement
  • Employer Contract Services
  • Value-Based and Capitated Arrangements
  • Self-Pay and Direct Payment
  • Health System Referral Integrated

By Region

  • North America
  • Western Europe
  • East Asia
  • South Asia and Pacific
  • Latin America
  • Middle East and Africa
  • Eastern Europe

Scope, Methodology, and Coverage

Every figure in this report is reproducible from documented input assumptions. The scope below maps the historical period, the forecast horizon, the segmentation dimensions, and the countries covered, alongside the underlying primary and qualitative methodology.
Historical Period
2020 to 2025
Forecast Period
2026 to 2036
Base Year
2025 (USD billions; MMA Primary Research Dataset, August 2026)
Market Definition
Scope covers walk-in urgent care delivered outside hospital emergency departments and scheduled primary care, spanning acute episodic illness and injury visits, occupational health and employer services, on-site diagnostics and imaging, preventive, screening and vaccination services, virtual and hybrid urgent care, and chronic condition bridge and follow-up care. Hospital emergency departments and freestanding emergency facilities, scheduled primary care and general practice, retail pharmacy dispensing and pharmacist services, ambulance and pre-hospital care, and specialist outpatient clinics are excluded from the market size and all derived figures.
Quantitative Units
USD billions (current prices); patient visits; revenue per visit; commercial payer mix percentage; catchment radius in kilometres
Segmentation Dimensions
By Service Delivered; By End-Use Setting; By Commercial Dimension; By Region
Regions Covered
North America, Western Europe, East Asia, South Asia and Pacific, Latin America, Middle East and Africa, Eastern Europe
Countries Covered
USA, Canada, UK, Germany, India, China, Japan, Australia, Brazil, Mexico, Spain, South Korea, Saudi Arabia, Poland, Turkey
Key Companies Profiled
Concentra, Optum, CityMD, NextCare Urgent Care, American Family Care, FastMed, GoHealth Urgent Care, Carbon Health, WellNow Urgent Care, Patient First, MultiCare Indigo, ZoomCare, Physicians Immediate Care, Nao Medical, Aspen Medical, Practice Plus Group, Ramsay Health Care, Apollo Hospitals, Raffles Medical Group, IHH Healthcare
Quantitative Methodology
Primary survey, n=3,800 respondents, Q4 2025, six countries; demand-side model with trade association cross-validation
Qualitative Methodology
47 expert interviews, Q4 2025; applied to validate demand model assumptions, identify emerging dynamics, and assess competitive positioning
Report Format
PDF and XLSX data workbook (Word format preview document)
Publisher
Market Minds Advisory
Report Code
MMA-2026-HLT-121
Published
August 2026
Contact
sales@marketmindsadvisory.com | www.marketmindsadvisory.com

Purchase the full Urgent Care Market Report (2026 to 2036).

The full report runs to 170 pages and covers all six service segments, seven regions and 20 profiled operators in detail. It includes the complete segment CAGR set, regional payment structure comparison, and site-level economics modelling across payer mix and catchment scenarios. Company profiles carry evaluation on disclosed urgent care and ambulatory clinic revenue, with moat and risk assessment for the top five operators. The competitive section extends to 15 tracked corporate, contracting and regulatory developments across 2024 and 2025. Primary research inputs include a quantitative survey of 3,800 respondents and 47 expert interviews conducted in Q4 2025.
Six service segments with individual CAGR forecasts and drivers
Seven regional markets with payment structure and provision comparison
Twenty operator profiles on consistent revenue evaluation basis
Fifteen tracked corporate and contracting developments with commercial interpretation
Site economics modelling across payer mix and catchment scenarios
Seasonality and utilisation analysis across service line combinations

Built For The People Who Decide

From boardroom strategy to bench-side execution, this report is read cover-to-cover by leaders shaping the next decade of their industry, turning demand scenarios, market dynamics and valuation benchmarks into decisions.
CXOs/ Presidents/ VPs/ Managers
M&A and Corporate Development
Strategy Teams and R&D Heads
Procurement and Product Directors
Regulatory and Compliance Leaders
Investor Relations and Equity Analysts