Market Minds Advisory
Upstream Bioprocessing Equipment Market

Upstream Bioprocessing Equipment Market: Cell and Gene Therapy Manufacturing Meets Continuous Processing Economics

Cell and gene therapy bioreactors and continuous perfusion systems are pulling category growth beyond traditional stainless steel vessels, even as stainless steel bioreactors remain the largest established segment across biomanufacturing worldwide.

Lead Analyst

Alice Ballenger

Published

September 2026

Make Smarter Decisions with Customized Research Insights

Request a free sample report and evaluate market opportunities, growth trends, and competitive dynamics relevant to your business needs.

2025 MARKET VALUE$9.8BMarket Size 2025
2036 FORECAST VALUE$31.5BBase Case , 2026 to 2036
CAGR 2026 TO 203611.2 %Bull 12.4% / Bear 10.0%
INCREMENTAL OPPORTUNITY$20.6BNet 10- year value creation
EXPANSION MULTIPLE2.89x2036 value over 2026 base
Strategic Levers
M&A Pipeline
Regional Outlook
Country Rankings
Competitive Intelligence
Segmental Deep-dive
Call-Us : 91 93563 13602

Executive Snapshot and Market Trajectory

Cell and gene therapy bioreactors and continuous perfusion systems are pulling incremental volume away from traditional stainless steel vessels, even as stainless steel bioreactors still anchor most established category revenue across biomanufacturing facilities worldwide. Buyers increasingly reward manufacturers that can prove reliable clinical-grade performance.
Cell and gene therapy and perfusion formats now drive the fastest growth as biomanufacturers respond to rising clinical pipeline demand and adopt continuous processing beyond routine batch cultivation, while stainless steel bioreactors still represent the largest single segment by volume given decades of entrenched biologics manufacturing demand. North America anchors the largest share of demand, tied closely to established biotech and CDMO manufacturing capacity. This shapes producer investment priorities considerably.
Sartorius and Cytiva dominate through established single-use bioreactor expertise and integrated bioprocessing platform reach that smaller equipment makers cannot easily replicate at comparable clinical validation scale. Cell and gene therapy manufacturing expansion and continuous processing adoption are the two forces most likely to reshape category allocation over the next decade, according to underlying survey data collected across six countries. Producers moving early capture disproportionate share of incremental value. Early movers here gain lasting competitive advantage.
Market Definition
The upstream bioprocessing equipment market covers commercial production and sale of stainless steel bioreactors, single-use bioreactors and cell culture systems, fermenters, media preparation and mixing systems, perfusion and continuous processing systems, and cell and gene therapy manufacturing bioreactors used in biopharmaceutical cell culture and cultivation. It excludes downstream purification, filling, and packaging equipment sold under separate manufacturing equipment classifications.
Base Year Value
$9.8B in 2025 (MMA Primary Research Dataset, August 2026)
Forecast Period
2026 to 2036, eleven discrete annual values
CAGR
11.2% base case. Bull 12.4%. Bear 10.0%.
Fastest Growth Segment
Cell and Gene Therapy Manufacturing Bioreactors: 18.5% CAGR
Fastest Growth Country
China: 14.5% CAGR
Fastest Growth Region
South Asia and Pacific: 13.2% CAGR
Largest Region
North America: 32% of 2025 global value
Market Leaders
Sartorius AG, Cytiva, Thermo Fisher Scientific Inc, Merck KGaA, Danaher Corporation. Source: MMA Analysis based on company annual reports.
Primary Survey
n=3,800 procurement and R&D decision-makers, Q4 2025, six countries
Methodology
Demand-side build-up, cross-validated against public data, 47 expert interviews

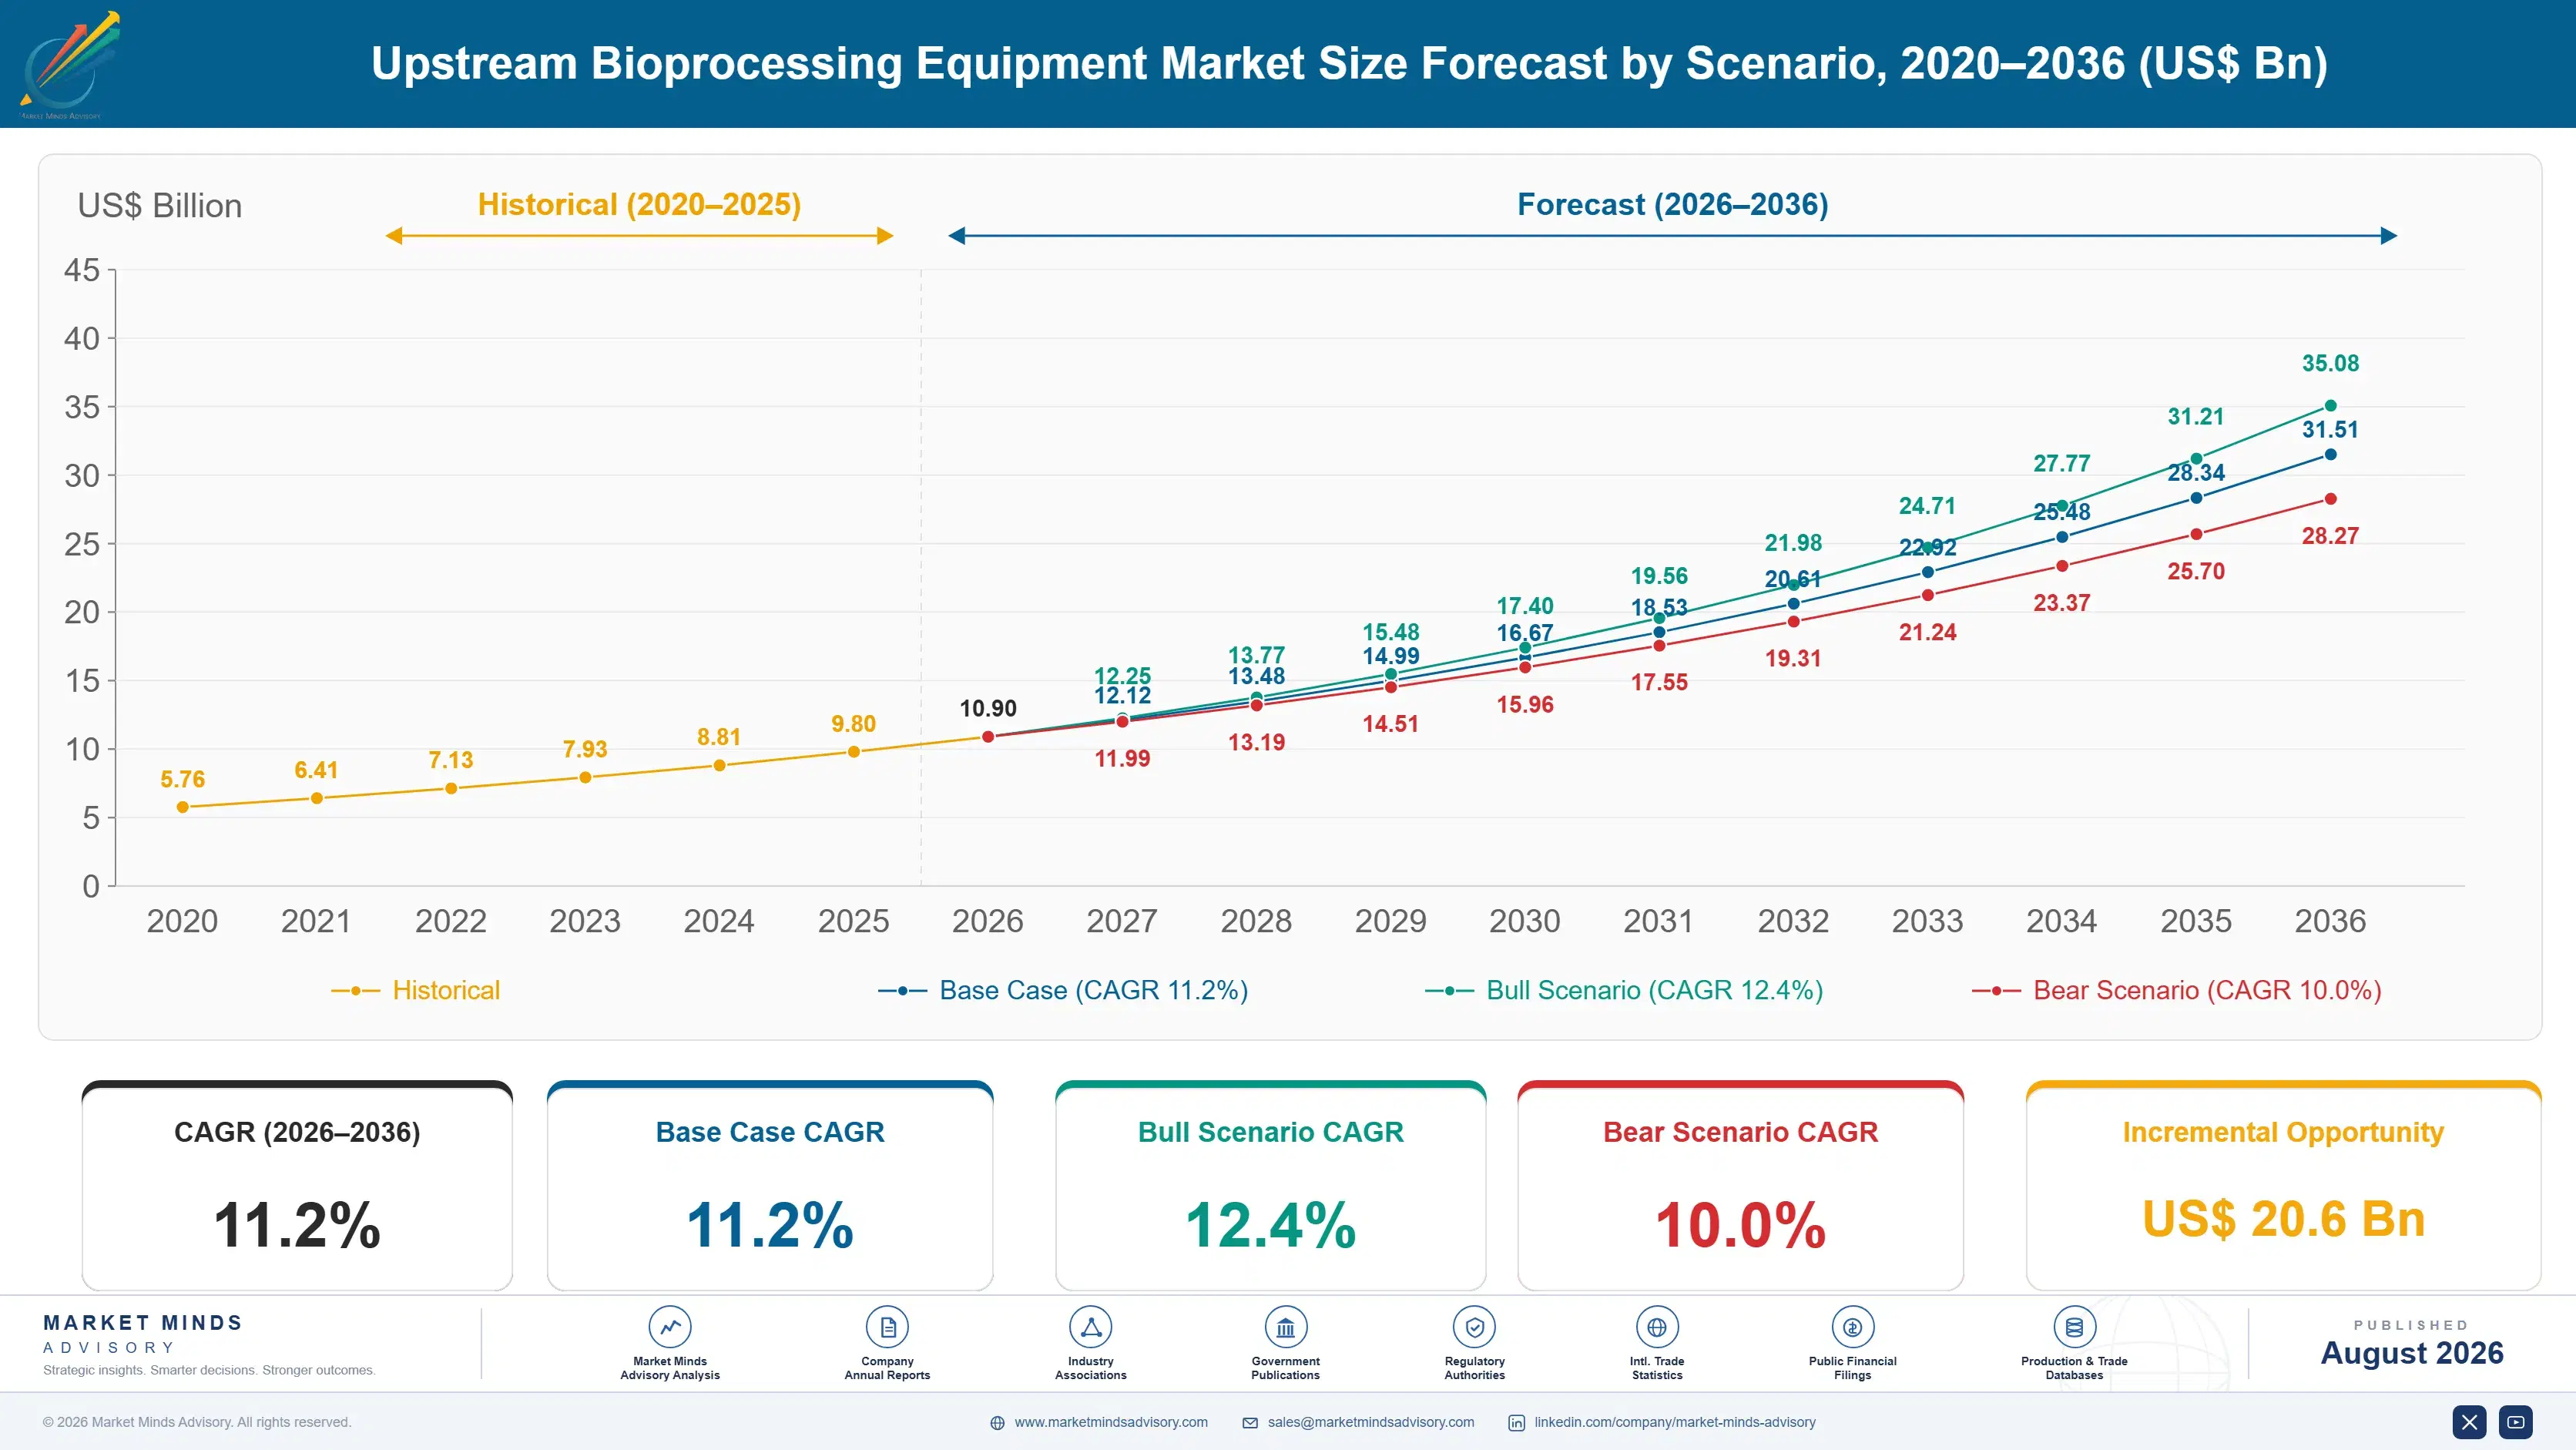
Upstream Bioprocessing Equipment Market Forecast Scenarios

upstream-bioprocessing-equipment-market-size-forecast-scenario-1787640632804
Between 2020 and 2025 the market grew rapidly as biologics manufacturing capacity expanded across established and emerging biotech hubs while single-use system adoption gained meaningful traction across facility construction projects. Cell and gene therapy manufacturing investment provided further steady support throughout this period. This rapid pace reflects the category's underlying resilience even through a period of shifting biomanufacturing investment priorities.
The base case through 2036 rests on three mechanisms: continued biologics manufacturing capacity sustaining core stainless steel and single-use demand across established markets, expanding single-use system adoption broadening facility flexibility across biomanufacturer categories, and rising cell and gene therapy manufacturing investment tied to clinical pipeline expansion across major markets. These dynamics support continued category growth even as individual segments diverge meaningfully in pace. Buyers should expect this pattern to persist barring a significant regulatory or supply disruption industry-wide.
The bull case turns on cell and gene therapy manufacturing capacity expanding faster than currently expected, pulling premium bioreactor volume well above base case assumptions across several biomanufacturing markets. The bear risk is intensifying specialty polymer supply constraints forcing costly production delays that could meaningfully slow near-term category revenue growth. Both scenarios remain plausible given genuine uncertainty in demand pace.

Single-Use Adoption Meets Continuous Processing Economics

Two forces are shaping bioprocessing equipment at once: rising cell and gene therapy and perfusion demand pulling volume toward premium continuous manufacturing, and continued stainless steel bioreactor production sustaining the category's largest established volume base. Each pulls manufacturer investment priorities in a somewhat different direction, splitting the category into distinct margin tiers with genuinely separate engineering economics. Buyers evaluate each tier on its own terms rather than treating bioprocessing equipment as a single undifferentiated commodity category.
MARKET CONCENTRATIONCR5 52%reflects a moderately concentrated life sciences producer base
AVERAGE SELLING PRICE$185000/systemcell and gene therapy bioreactors command a substantial premium
TOP PRODUCING COUNTRY SHAREUSA 26%reflects concentrated biomanufacturing equipment capacity across the country
SINGLE-USE ADOPTION RATE58%share of installed capacity using disposable bioreactor systems
FEEDSTOCK COST SHARE36%specialty polymers and stainless steel components dominate cost
FACILITY QUALIFICATION TIME14 monthsaverage interval between equipment order and facility validation
Commercially, bioprocessing equipment supply behaves like a specialized clinical relationship rather than a pure commodity equipment trade. Biomanufacturers qualify producers against exacting reliability and regulatory standards before committing to multi-year procurement agreements, and cell therapy pricing has held even through periods when standard stainless steel volume faced margin pressure from component cost swings. This dynamic has held steady across recent cycles, reinforcing incumbent manufacturer relationships considerably.
The next decade will be shaped by how fast cell and gene therapy manufacturing capacity scales across clinical pipeline-driven facility construction, whether continuous perfusion processing continues expanding beyond batch cultivation, and how quickly producers can scale single-use capacity while maintaining exacting regulatory standards across applications. Laggards risk ceding contract share to faster-moving competitors within a few short years.
"Stainless steel vessels built this industry's volume, but single-use and cell therapy bioreactors are where the interesting margin story sits now."
Director, Biomanufacturing Equipment Practice · MMA Biopharmaceutical Manufacturing Equipment Practice · August 2026

Market Trends

Cell and Gene Therapy Manufacturing Capacity Expands Rapidly

Cell and gene therapy manufacturing capacity is expanding rapidly as biotech companies scale production to meet growing clinical pipeline demand across autologous and allogeneic therapy platforms. Several biotech industry associations have documented continued cell therapy facility construction growth tied directly to expanding clinical trial pipelines across major markets. This shift gives producers with established cell therapy bioreactor expertise a genuine advantage over competitors reliant purely on standard stainless steel production. Adoption is expected to accelerate through 2029 across most major biomanufacturing markets. This trend should broaden as more biotech companies commit to similar facility expansion programs.
Market Impact: Adds 8 percent volume growth
Continuous Perfusion Processing Gains Manufacturer Adoption

Continuous perfusion processing is gaining manufacturer adoption as biopharmaceutical companies scale production of higher-density cell cultures requiring reduced facility footprint and improved yield consistency. Several leading biomanufacturers have documented perfusion adoption growth tied directly to facility efficiency initiatives over recent years. This shift raises engineering complexity for producers investing in continuous processing capability, though early movers report improved manufacturer qualification success rates. Smaller specialty producers have led this transition faster than legacy incumbents, forcing established players to accelerate their own investment timelines considerably. This transition is expected to continue accelerating as facility efficiency demand keeps rising steadily.
Market Impact: Adds 10 percent revenue growth

Market Opportunities and Growth Drivers

Rising Biologics Manufacturing Capacity Sustains Core Demand

Rising biologics manufacturing capacity across North America, Europe, and East Asia continues to drive steady demand for bioprocessing equipment as biopharmaceutical companies scale production to meet growing therapeutic demand across established and emerging markets. Several national health agencies have documented continued biologics manufacturing growth tied directly to rising chronic disease treatment demand across these markets. This demand base gives producers a durable multi-year volume foundation across biomanufacturing categories, supporting steady capacity utilization at production facilities. Established manufacturers favor biomanufacturer partners who document consistent order volume across successive quarters reliably. Reliability matters.
Market Impact: Adds 6 percent supply risk

Single-Use System Adoption Expands Facility Flexibility

Single-use system adoption continues to expand facility flexibility as biomanufacturers increasingly favor disposable bioreactor systems that reduce cross-contamination risk and facility changeover time between production campaigns. Several biomanufacturing industry associations have documented continued single-use adoption growth tied directly to multi-product facility investment across these markets. This demand base gives producers a durable, flexibility-driven revenue channel that complements traditional stainless steel demand considerably. Producers who serve both large biopharma and CDMO channels benefit from smoother production scheduling and capacity utilization overall across geographies. This benefit compounds steadily as multi-product facility investment continues expanding across additional biomanufacturing regions.
Market Impact: Adds 5 percent cost pressure

Market Restraints and Challenges

Specialty Polymer Supply Constraints Limit Production Scaling

Specialty polymer supply constraints continue to limit production scaling, driven by concentrated polymer manufacturing capacity and biocompatibility testing requirements affecting single-use component availability across major sourcing regions. The root cause traces to a limited number of qualified polymer suppliers globally, where disruption at any single facility can meaningfully tighten global production capacity. The commercial impact falls hardest on producers serving price-sensitive biomanufacturer customers reluctant to absorb sourcing cost increases. Several producers are exploring multi-supplier sourcing agreements to mitigate this exposure, though the process takes considerable time to complete. This trend should ease gradually as sourcing diversification matures across the industry.
Market Impact: Adds 720 million dollars demand

Facility Qualification Delays Compress Producer Margins

Facility qualification delays continue to compress producer margins, driven by extended regulatory validation timelines required before biomanufacturers can commit to expanded equipment orders across major markets. The root cause traces to increasingly rigorous regulatory scrutiny of biomanufacturing facility validation, a pattern healthcare regulators in several major markets have flagged for closer monitoring. The commercial impact shows up fastest in fixed-price manufacturer contracts, where producers carry limited pricing flexibility once agreements are confirmed. Several producers are exploring accelerated validation partnerships to dampen this exposure over time. This trend should ease gradually as accelerated validation programs mature across the industry.
Market Impact: Adds 9 percent volume growth
4 additional market trends, 4 additional growth drivers, and 4 additional restraints and challenges are covered in the full report. Contact sales@marketmindsadvisory.com to access the complete intelligence.

Segment CAGR and Growth Architecture

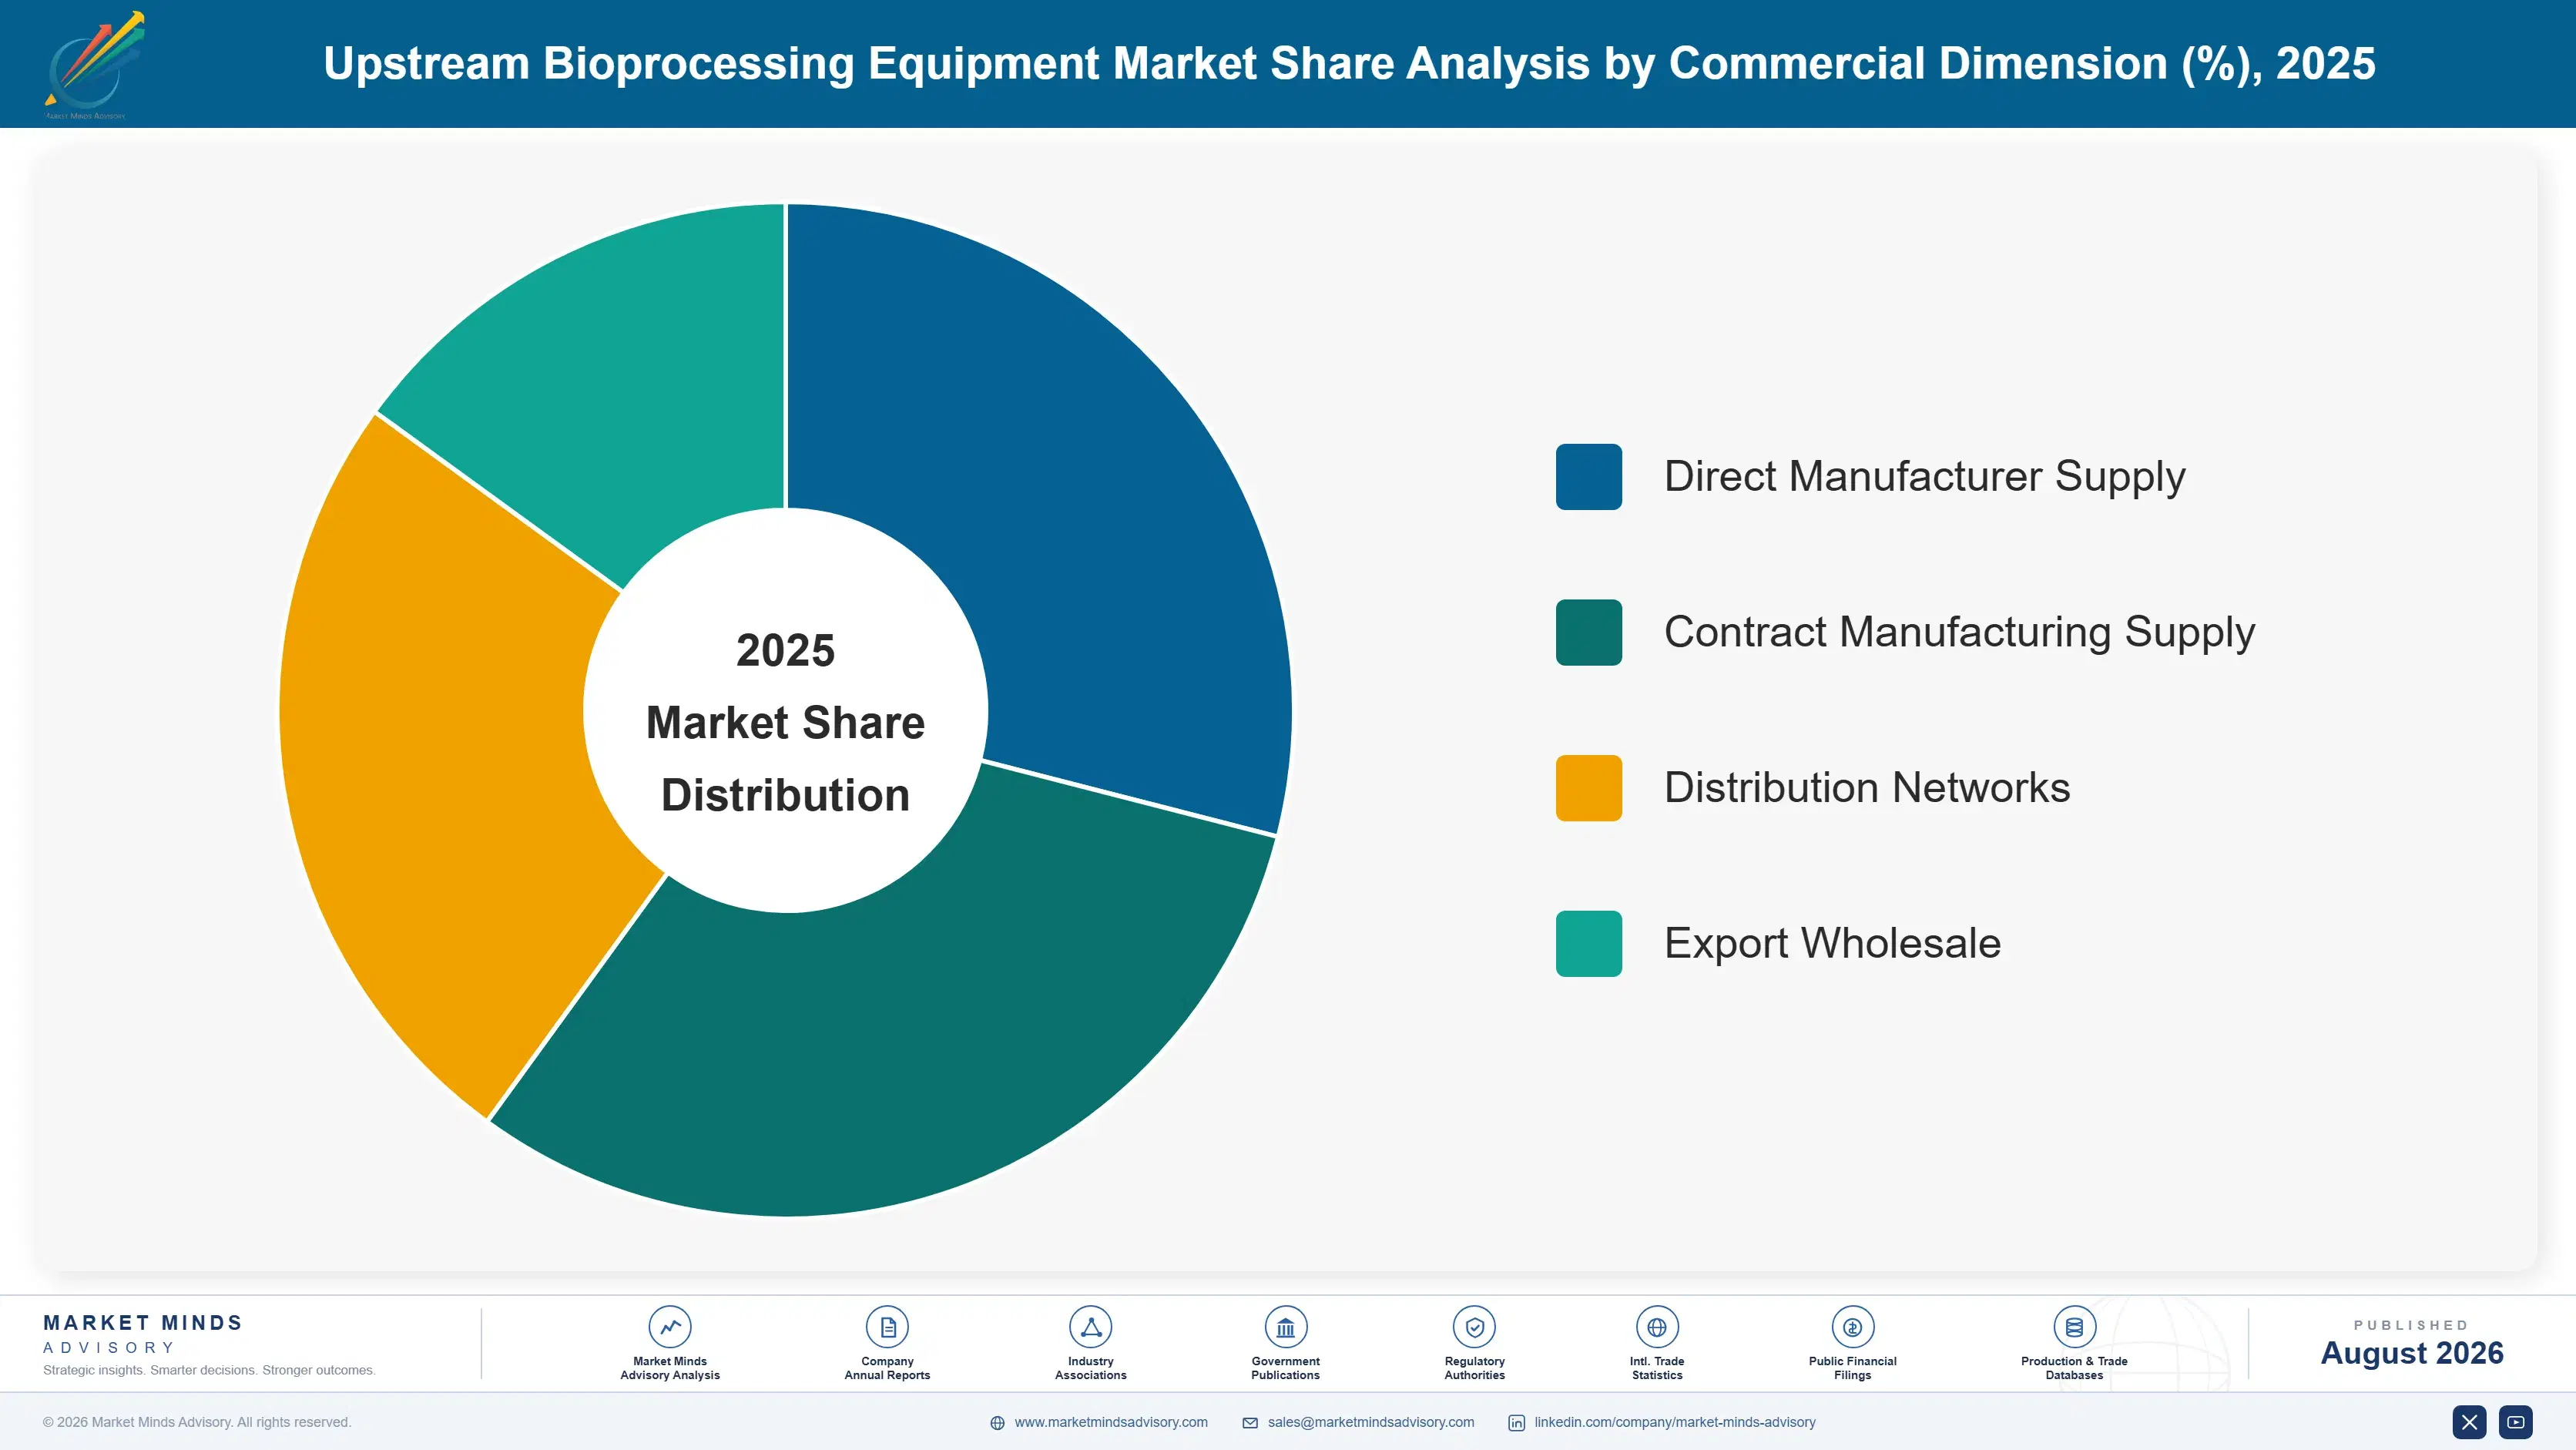
Bioprocessing equipment is segmented here by product type rather than by distribution channel or end-use industry, since stainless steel, single-use, and cell therapy bioreactors each require genuinely distinct engineering and validation science. Buyers evaluate categories separately, weighing reliability against price. Upstream feedstock and polymer sourcing sits apart from downstream facility integration engineering entirely. Timing matters.
upstream-bioprocessing-equipment-market-market-share-analysis-1787640633342

Cell and Gene Therapy Manufacturing Bioreactors

Cell and gene therapy manufacturing bioreactors are growing fastest as biotech companies respond to sustained clinical pipeline expansion requiring small-batch, high-flexibility cultivation systems. Sartorius and several specialty producers lead this segment, benefiting from established cell therapy engineering expertise that smaller regional competitors lack entirely, particularly around closed-system design and contamination control optimization. This segment faces less price sensitivity than standard stainless steel systems, since flexibility carries genuine clinical value that biomanufacturers increasingly recognize across successive procurement cycles. Margins here remain comfortably above standard formulations given the specialized engineering these products require. Manufacturers continue expanding dedicated engineering programs for this category as clinical pipeline demand keeps rising steadily nationwide. overall nationwide.
CAGR 18.5%

Perfusion and Continuous Processing Systems

Perfusion and continuous processing systems are growing rapidly as biomanufacturers respond to rising demand for higher-density cell cultures requiring reduced facility footprint. Cytiva and several specialty producers dominate this segment, benefiting from established continuous processing relationships that smaller regional competitors struggle to match at comparable reliability. This segment commands a meaningful premium over standard batch systems, since continuous processing complexity and validation requirements both carry considerably higher production costs. Demand should stay durable given sustained facility efficiency momentum across most developed biomanufacturing markets broadly. Manufacturers increasingly treat continuous processing partnerships as a strategic sourcing decision rather than a routine procurement exercise, reinforcing incumbent advantage across renewal cycles across most biomanufacturing markets.
CAGR 15.5%
Full segment breakdown across 6 segments available in the complete report.

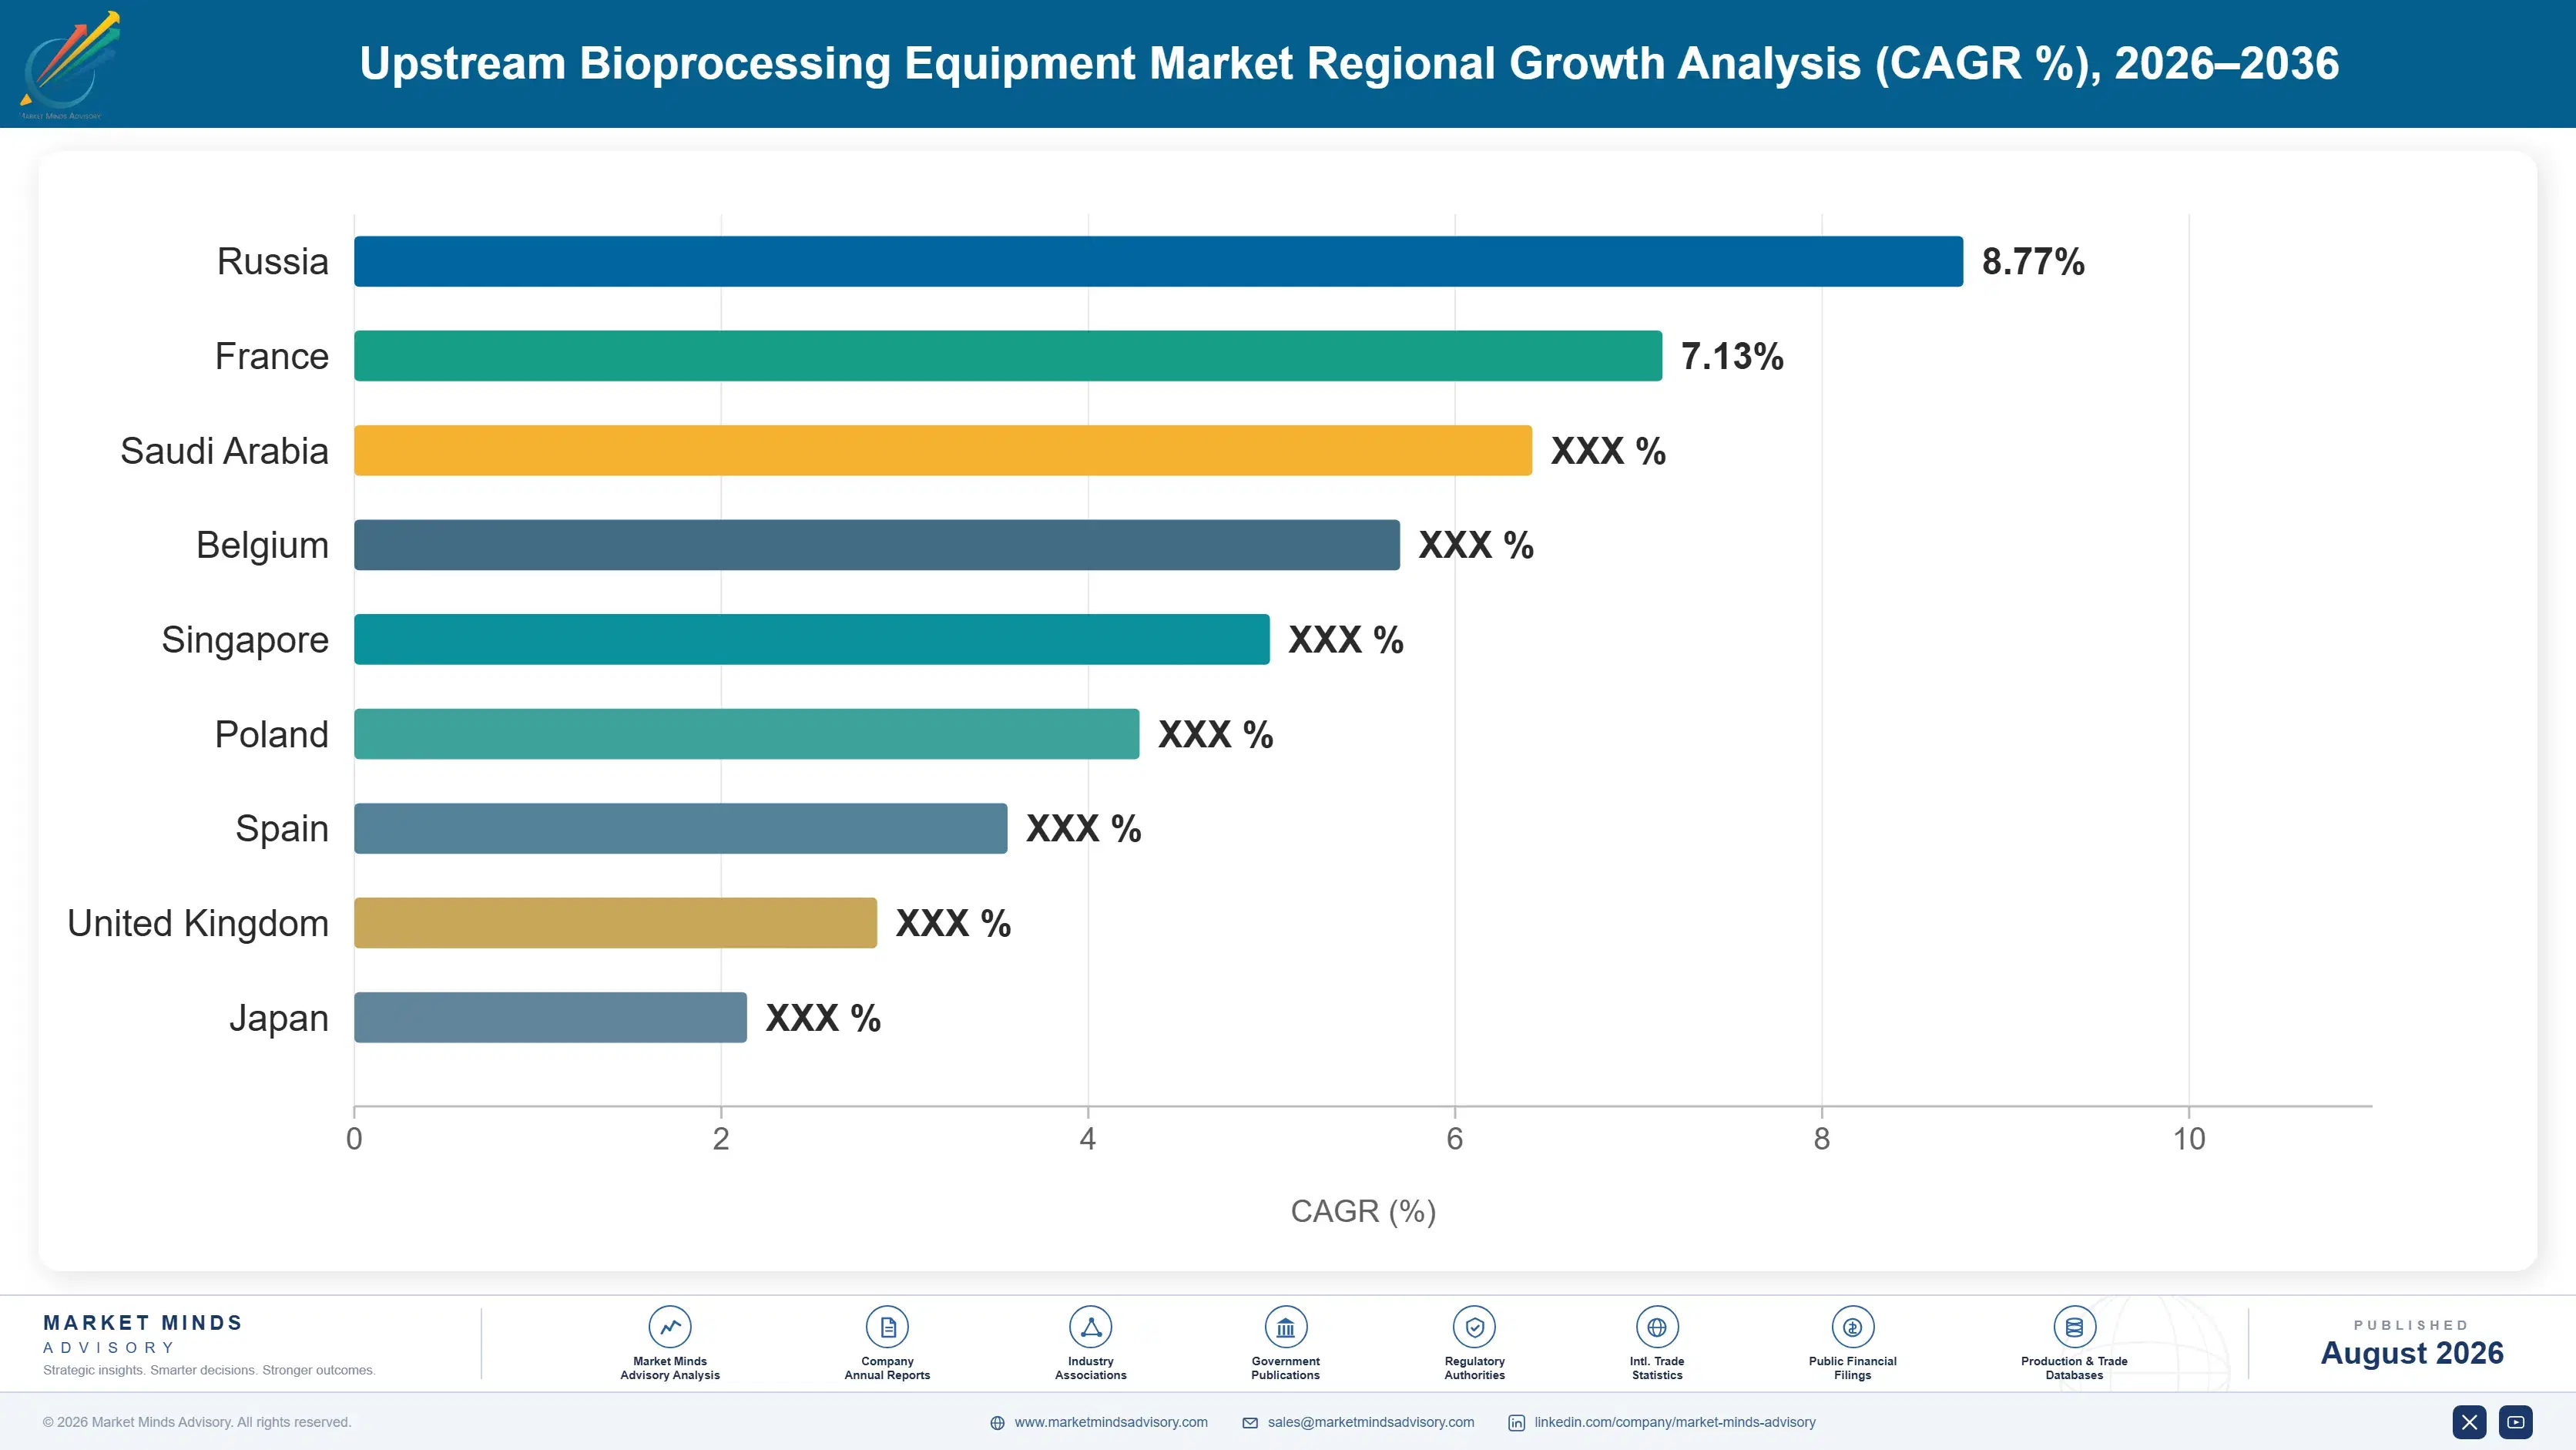
Regional Architecture and Country Demand Map

North America represents the largest share of global bioprocessing equipment demand given its established biotech and CDMO manufacturing base, while South Asia and Pacific posts the fastest regional growth on the strength of expanding biomanufacturing investment. This split reflects genuinely distinct commercial drivers. Buyers weigh regional dynamics carefully.

North America

Bioprocessing equipment demand across North America centers on established stainless steel and single-use deployment rather than emerging cell therapy categories alone, reflecting decades of entrenched biomanufacturer procurement relationships and established biotech infrastructure. Manufacturers in the United States increasingly favor cell and gene therapy bioreactor partnerships to defend clinical relationships against digitally-native challengers, a shift that has accelerated meaningfully over the past several years. Canada contributes a smaller but stable base of demand, anchored by established biomanufacturer procurement capacity serving both domestic and cross-border markets. Manufacturers headquartered in this region maintain strong biomanufacturer distribution networks, a factor buyers weigh heavily given clinical validation competition. Capital investment in single-use infrastructure remains comparatively accessible here relative to developing markets.
Share: 32% | CAGR: 10.2% (2026 to 2036)

Western Europe

Bioprocessing equipment demand across Western Europe reflects a mature biomanufacturing base with established biotech infrastructure already well developed, limiting incremental volume growth relative to newer biomanufacturing markets. Germany and Ireland host meaningful regional manufacturer headquarters, supplying both domestic biomanufacturers and export markets across Europe and beyond. Regulatory scrutiny of biomanufacturing facility validation across the European Union continues to drive compliance investment, a regulatory dynamic that sustains steady demand for certified alternatives even as new manufacturer entrants remain limited. Biomanufacturers here favor producers with proven qualification track records over newer entrants, reinforcing incumbent manufacturer relationships. Growth here should continue at a measured pace given the region's already-mature biomanufacturing infrastructure. today. overall.
Share: 24% | CAGR: 9.5% (2026 to 2036)
Regional intelligence for 5 additional markets available in the complete report: East Asia, South Asia and Pacific, Latin America, Middle East and Africa, Eastern Europe. Contact sales@marketmindsadvisory.com.
upstream-bioprocessing-equipment-market-country-cagr-analysis-1787640633852

Where Equipment Makers Can Capture More Margin

Manufacturers can lift margin capture by shifting mix toward cell and gene therapy and continuous processing systems, expanding biomanufacturer partnerships, and diversifying polymer sourcing to protect against volatility. These moves typically pay back within two to three years. Sequencing these moves correctly determines how quickly manufacturers realize the full margin benefit available across categories.

Cell and Gene Therapy Bioreactor Investment Program

Manufacturers who invest in cell and gene therapy bioreactor capability capture meaningfully better margins from biotech companies, since customers pay a premium of 24 to 30 percent for validated closed-system reliability that reduces overall contamination risk across multi-year procurement contracts. Sartorius, which made this investment earliest, now commands pricing consistently above manufacturers still weighted toward standard stainless steel production. The engineering investment required is significant, but payback has compressed as cell therapy demand continues expanding across additional biotech categories. Second movers typically capture a smaller fraction of this upside once manufacturer qualification slots fill.
Market Impact: Adds 20 to 26 points of margin uplift

Continuous Processing Platform Expansion Rollout Program

Manufacturers who build dedicated continuous processing platform partnerships capture supply contract advantages from biomanufacturers actively reallocating supplier relationships toward high-density cultivation providers. Several specialty manufacturers report winning 13 to 17 percent more facility contracts after completing capability programs. Building credible continuous processing positioning takes twelve to eighteen months of platform integration before this lever converts fully into meaningful new revenue across categories. Manufacturers pursuing this earlier than competitors tend to lock in stronger biomanufacturer loyalty and pricing power overall. This edge compounds further as biomanufacturers consolidate purchasing around fewer, more reliable partners.
Market Impact: Adds 13 to 17 percent more contract wins

Specialty Polymer Sourcing Diversification Rollout Program

Manufacturers who diversify specialty polymer sourcing across multiple regions capture supply reliability advantages that competitors reliant purely on single-region sourcing cannot credibly match during production disruption periods. Several manufacturers report winning 10 to 14 percent more long-term biomanufacturer contracts after completing this diversification. Building credible multi-region sourcing relationships takes two to four years before this lever converts fully into meaningful new revenue across manufacturing categories. Manufacturers pursuing this earlier than competitors tend to secure better long-term component pricing terms. This advantage compounds further as manufacturers consolidate purchasing around fewer, more reliable supply partners.
Market Impact: Adds 10 to 14 percent in contract wins

Long-Term Biomanufacturer Partnership Rollout Program Strategy

Locking multi-year supply agreements with major biomanufacturers trades some spot-market pricing upside for guaranteed volume and considerably reduced customer acquisition cost, an arrangement biomanufacturers increasingly prefer since it insulates production schedules from manufacturer capacity disruption during peak demand phases. Manufacturers with such agreements report churn rates roughly 15 percent lower than those competing primarily on individual contract bids, supporting more confident capacity planning years ahead. Biomanufacturers value this predictability enough to accept modestly higher pricing in exchange for reliable delivery. This advantage compounds further as biomanufacturers consolidate purchasing around fewer, more reliable partners.
Market Impact: Adds roughly 15 points of overall retention gain

Who Controls the Margin Pool

The top five manufacturers hold roughly 52 percent of category revenue on a consolidated shipment-volume basis, leaving a meaningful gap between Sartorius and Cytiva at the top and a long tail of specialty manufacturers competing mainly on niche cell therapy validation rather than distribution scale. Sartorius's single-use bioreactor expertise and Cytiva's integrated bioprocessing platform reach together anchor most category volume across North American and European biomanufacturing channels.
Current competitive activity centers on three dimensions: cell and gene therapy bioreactor launches targeting clinical pipeline demand, continuous processing platform expansion to capture facility efficiency demand, and expanded biomanufacturer network partnerships as manufacturers seek deployment scale. Several mid-tier players have also pursued selective acquisitions of digital diagnostics specialty producers to accelerate capability entry. Several producers have expanded pilot programs to broaden manufacturer reach.

Emerging pressure comes from Chinese challenger manufacturers expanding aggressively through cost-competitive equipment pricing and domestic biomanufacturer partnerships, challenging incumbents in deployment channels they once controlled. Regional specialists in China are also steadily closing the formulation capability gap with global incumbents, particularly around single-use bioreactor manufacturing techniques that once required extensive proprietary expertise. Global incumbents remain comparatively cautious in responding to these emerging competitive threats across most biomanufacturing markets.
upstream-bioprocessing-equipment-market-company-positioning-matrix-1787640634413

Competitive Moat and Risk Dimensions

SARTORIUS AG

Moat: Established single-use bioreactor expertise

Sartorius benefits from decades of accumulated single-use bioreactor expertise across bioprocessing categories that standalone challengers cannot easily replicate, giving it negotiating leverage with major biomanufacturers and distributors that smaller regional manufacturers simply lack across most markets. This depth of expertise took decades to accumulate and remains genuinely difficult for rivals to shortcut.
SARTORIUS AG

Risk: Exposure to biomanufacturer capital cycles

Sartorius's exposure remains heavily weighted toward biomanufacturer capital expenditure cycles, leaving it more exposed than diversified digital health competitors to any single budget cycle's decision to move sharply against established procurement patterns during shifting biotech spending priorities. Losing even a modest share of that segment would matter considerably to overall revenue.
CYTIVA

Moat: Integrated bioprocessing platform reach

Cytiva's extensive integrated bioprocessing platform reach gives it durable biomanufacturer shelf placement across upstream and downstream channels that standalone specialty manufacturers lacking equivalent scale cannot easily replicate, informing long-term purchasing decisions across comparable manufacturing relationships worldwide. Competitors attempting to replicate this reach still lag by several years in most manufacturer relationships.
CYTIVA

Risk: Lower dedicated cell therapy focus

Cytiva's broad bioprocessing portfolio means upstream equipment receives comparatively less dedicated brand management attention than at focused specialty competitors, a complexity that gives nimble challenger manufacturers an opening among biomanufacturers seeking highly specialized clinical credibility. A sharp shift in biotech budget priorities would expose this thinner focus fairly quickly.

Players Tracked

Prominent Players

Sartorius AG
Cytiva
Thermo Fisher Scientific Inc
Merck KGaA
Danaher Corporation

Other Key Players

Eppendorf SE
Applikon Biotechnology B.V.
Getinge AB
Pall Corporation
Repligen Corporation
Corning Incorporated
Solaris Biotechnology Srl
Infors AG
ABEC Inc
PBS Biotech Inc
Univercells Technologies
Distek Inc
Zeta Biopharma GmbH
GE HealthCare Technologies Inc
Meissner Filtration Products Inc

Recent Developments

MARCH 2026

Sartorius Launches New Cell Therapy Bioreactor Platform

Sartorius AG launched a new cell therapy bioreactor platform designed for biotech companies facing clinical pipeline expansion demand, incorporating closed-system technology validated through clinical research partnerships. The launch followed growing biomanufacturer demand across cell therapy categories. Analysts viewed the move as validating continued cell therapy demand nationally.
Signal: Confirms cell therapy capability is becoming a key competitive differentiator industry-wide ahead of confirmed long-term biomanufacturer adoption trends
NOVEMBER 2025

Cytiva Signs Biomanufacturer Partnership Agreement

Cytiva signed a multi-year biomanufacturer partnership agreement with a major biopharmaceutical company, securing reliable deployment access ahead of planned capacity expansion across its continuous processing product lines. Executives cited rising demand as the primary motivation. Analysts framed the agreement as a competitive necessity. overall considerably.
Signal: Signals manufacturers locking in deployment security ahead of expected demand growth and reshaping customer acquisition economics industry-wide overall
JUNE 2025

Thermo Fisher Commissions New Single-Use Production Facility

Thermo Fisher Scientific Inc commissioned a new single-use production facility, materially increasing domestic capacity to serve both biomanufacturer demand and export markets seeking reliable supply. Executives cited rising domestic biotech investment as a key motivation. Analysts noted the facility targets export markets directly. overall considerably.
Signal: Signals producers locking in feedstock security ahead of expected demand growth even as pricing pressure intensifies further nationwide

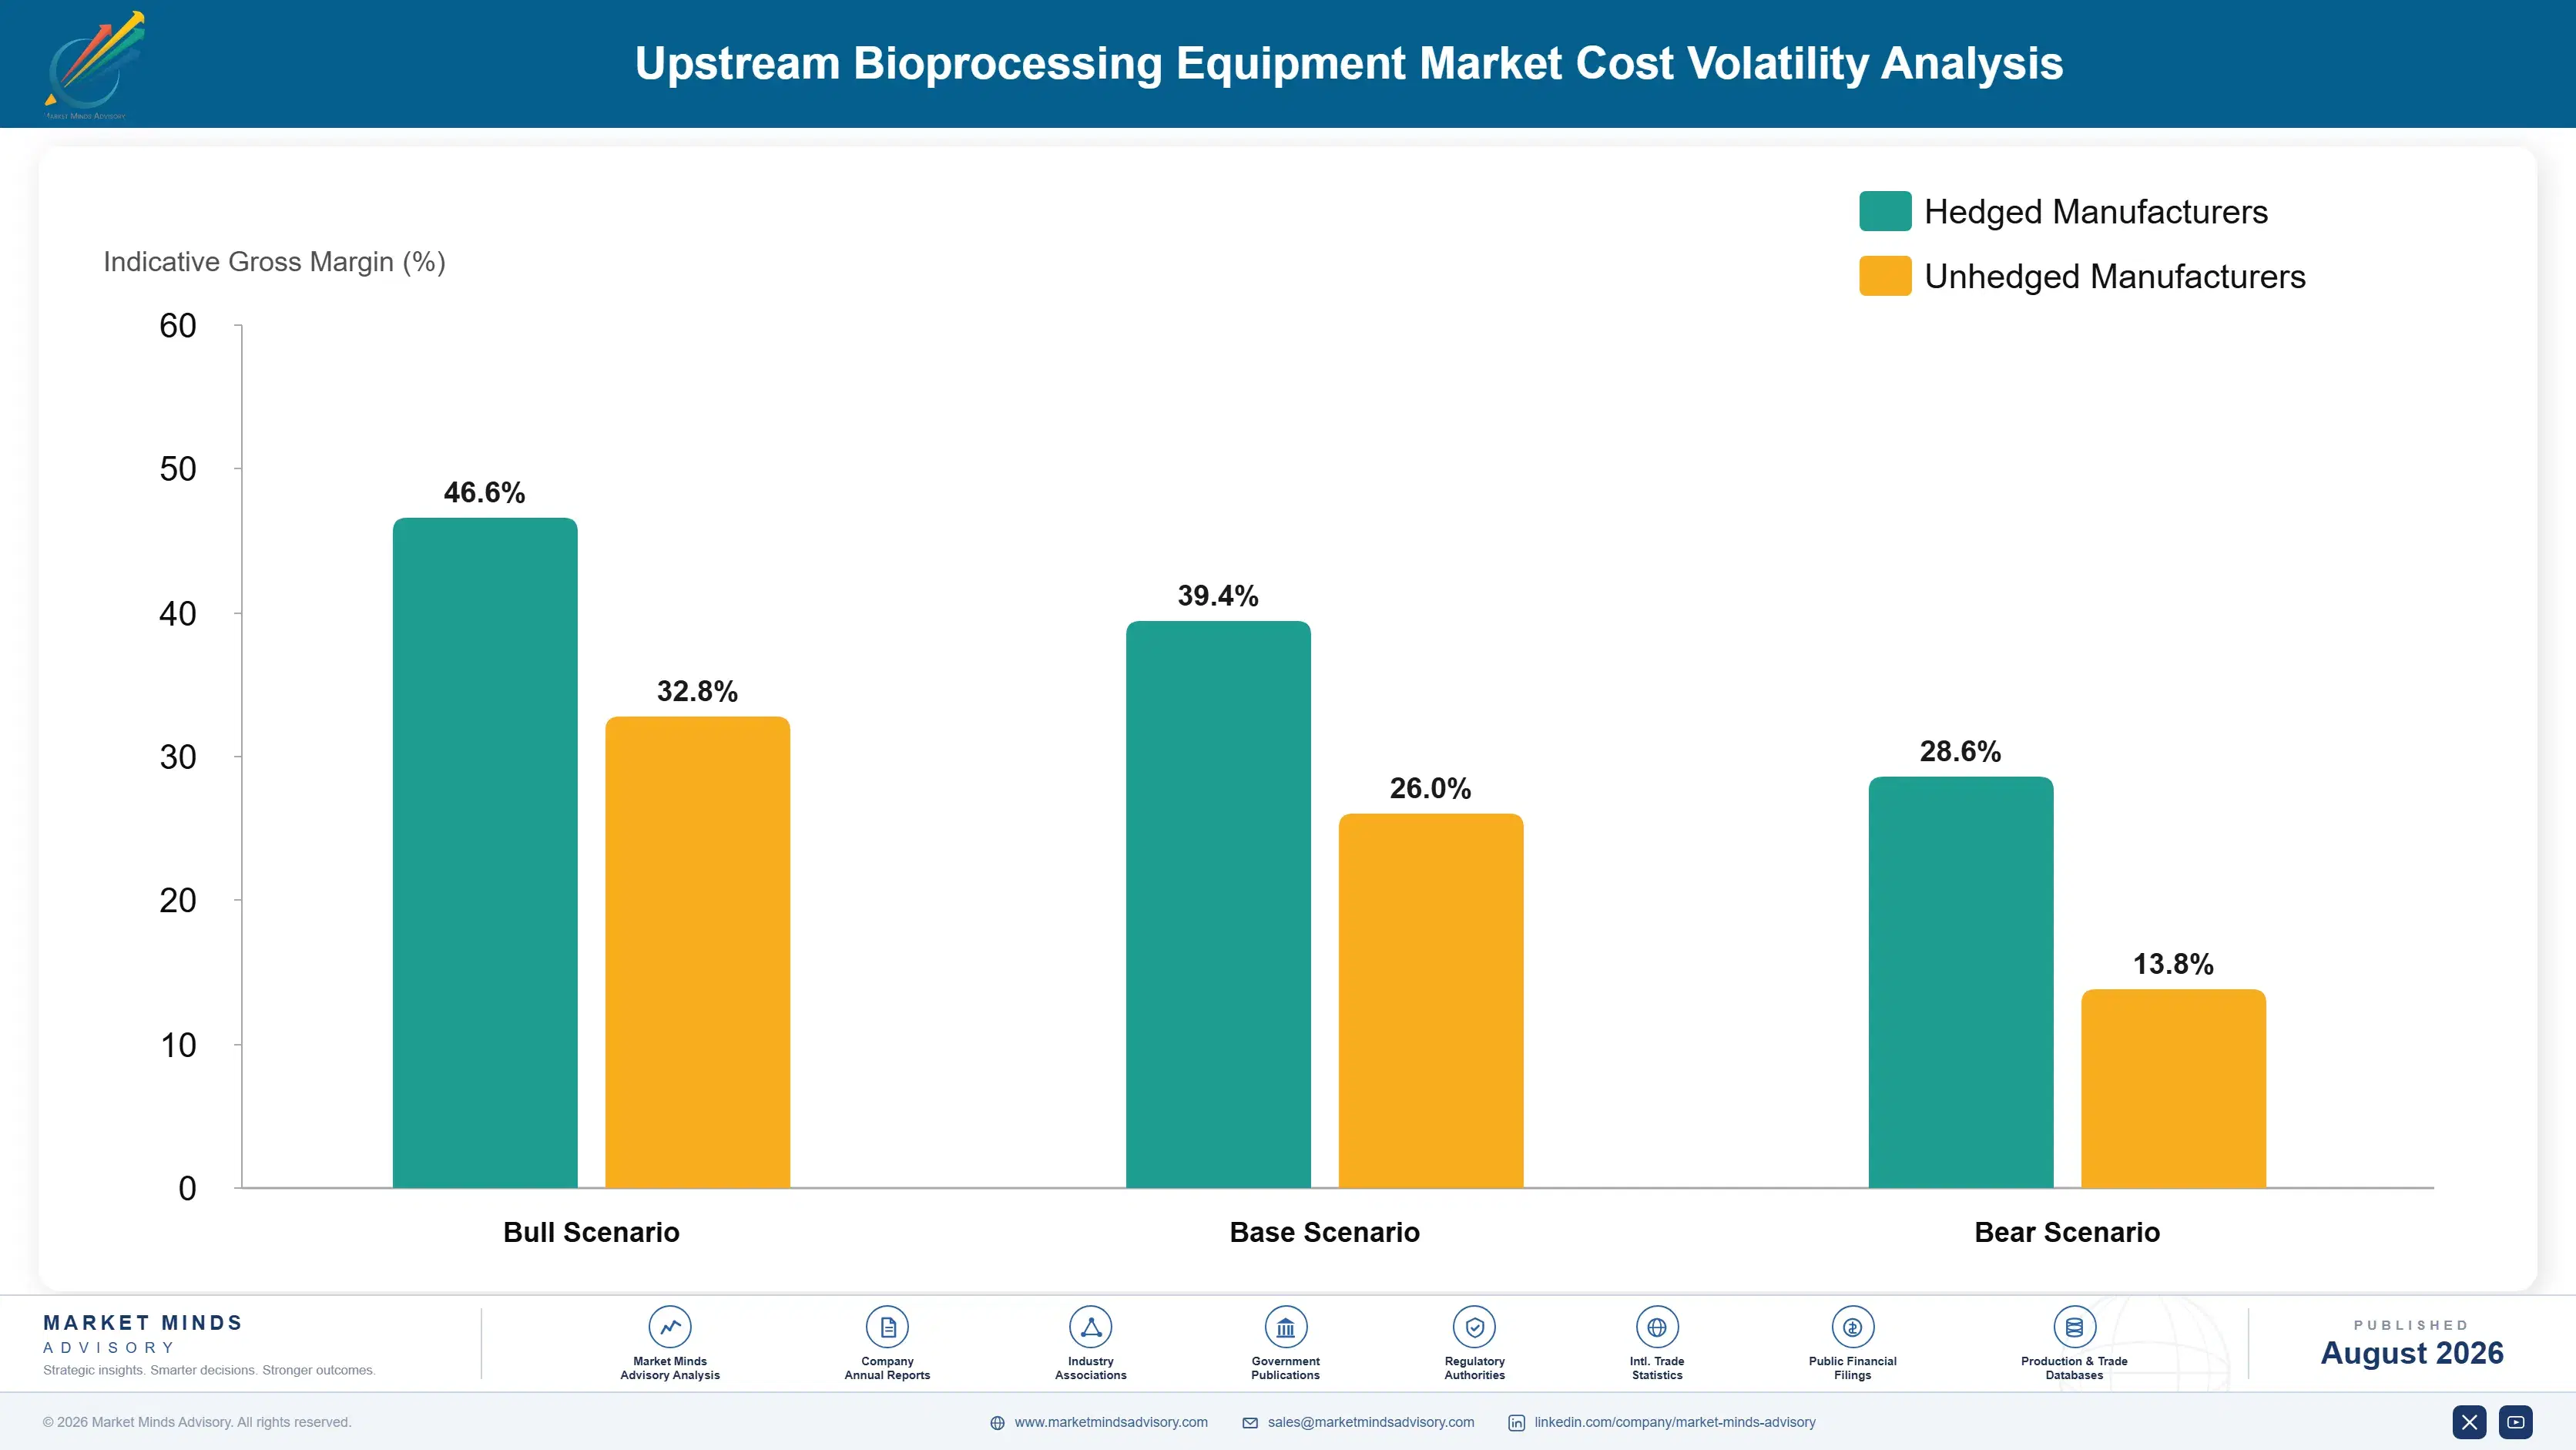
Specialty Polymer and Stainless Steel Sourcing Risk

Specialty polymers and stainless steel components together account for roughly thirty-six percent of production cost of goods sold for most bioprocessing equipment manufacturers, sourced primarily from specialty chemical and metal fabrication regions in the United States, Germany, and Japan. Sensor and control system costs add a further meaningful input, particularly for manufacturers producing continuous processing systems requiring precise process monitoring.
Global specialty polymer prices spiked sharply during 2021 to 2022 following supply chain disruption documented in FDA medical device reporting, pushing production costs up by an estimated twenty-two percent within a single year before gradually easing through 2023 and 2024. Several mid-tier manufacturers reported margin compression severe enough to delay planned product launches during this period, according to company annual reports filed at the time.

Cost exposure varies considerably by manufacturer scale and vertical integration. Large diversified manufacturers like Sartorius, which maintain long-term polymer supply contracts, absorb volatility more easily than standalone specialty manufacturers reliant on spot market purchasing. Geographically, manufacturers with diversified sourcing across multiple countries benefit from more stable costs, while smaller regional manufacturers face higher exposure during periods of sharp price appreciation.
upstream-bioprocessing-equipment-market-cost-volatility-analysis-1787640634611

Multi-Year Polymer Supply Agreements

Several manufacturers have moved to multi-year specialty polymer purchase agreements with major chemical suppliers, trading some pricing flexibility for protection against the kind of sharp spikes documented during the 2021 to 2022 disruption, reducing quarter-to-quarter cost unpredictability meaningfully for finance teams and biomanufacturer partners alike. This approach has grown more common since the 2021 disruption reshaped procurement strategy industry-wide.

Backward Integration Into Polymer Production

The largest manufacturers are integrating backward into polymer production and initial processing operations, capturing margin previously paid to third-party suppliers while also gaining direct visibility into feedstock cost trends ahead of broader market-wide price movements affecting smaller competitors. Smaller manufacturers typically cannot justify this capital investment on their own without confirmed long-term demand. overall.

Geographic Feedstock Sourcing Diversification

Manufacturers are diversifying specialty polymer and stainless steel sourcing across multiple countries and suppliers to reduce dependence on any single region's supply disruption, trading some sourcing complexity for meaningfully improved delivery security across cycles and geographies going forward. This diversification takes years to build fully but pays off substantially during periods of acute regional disruption.

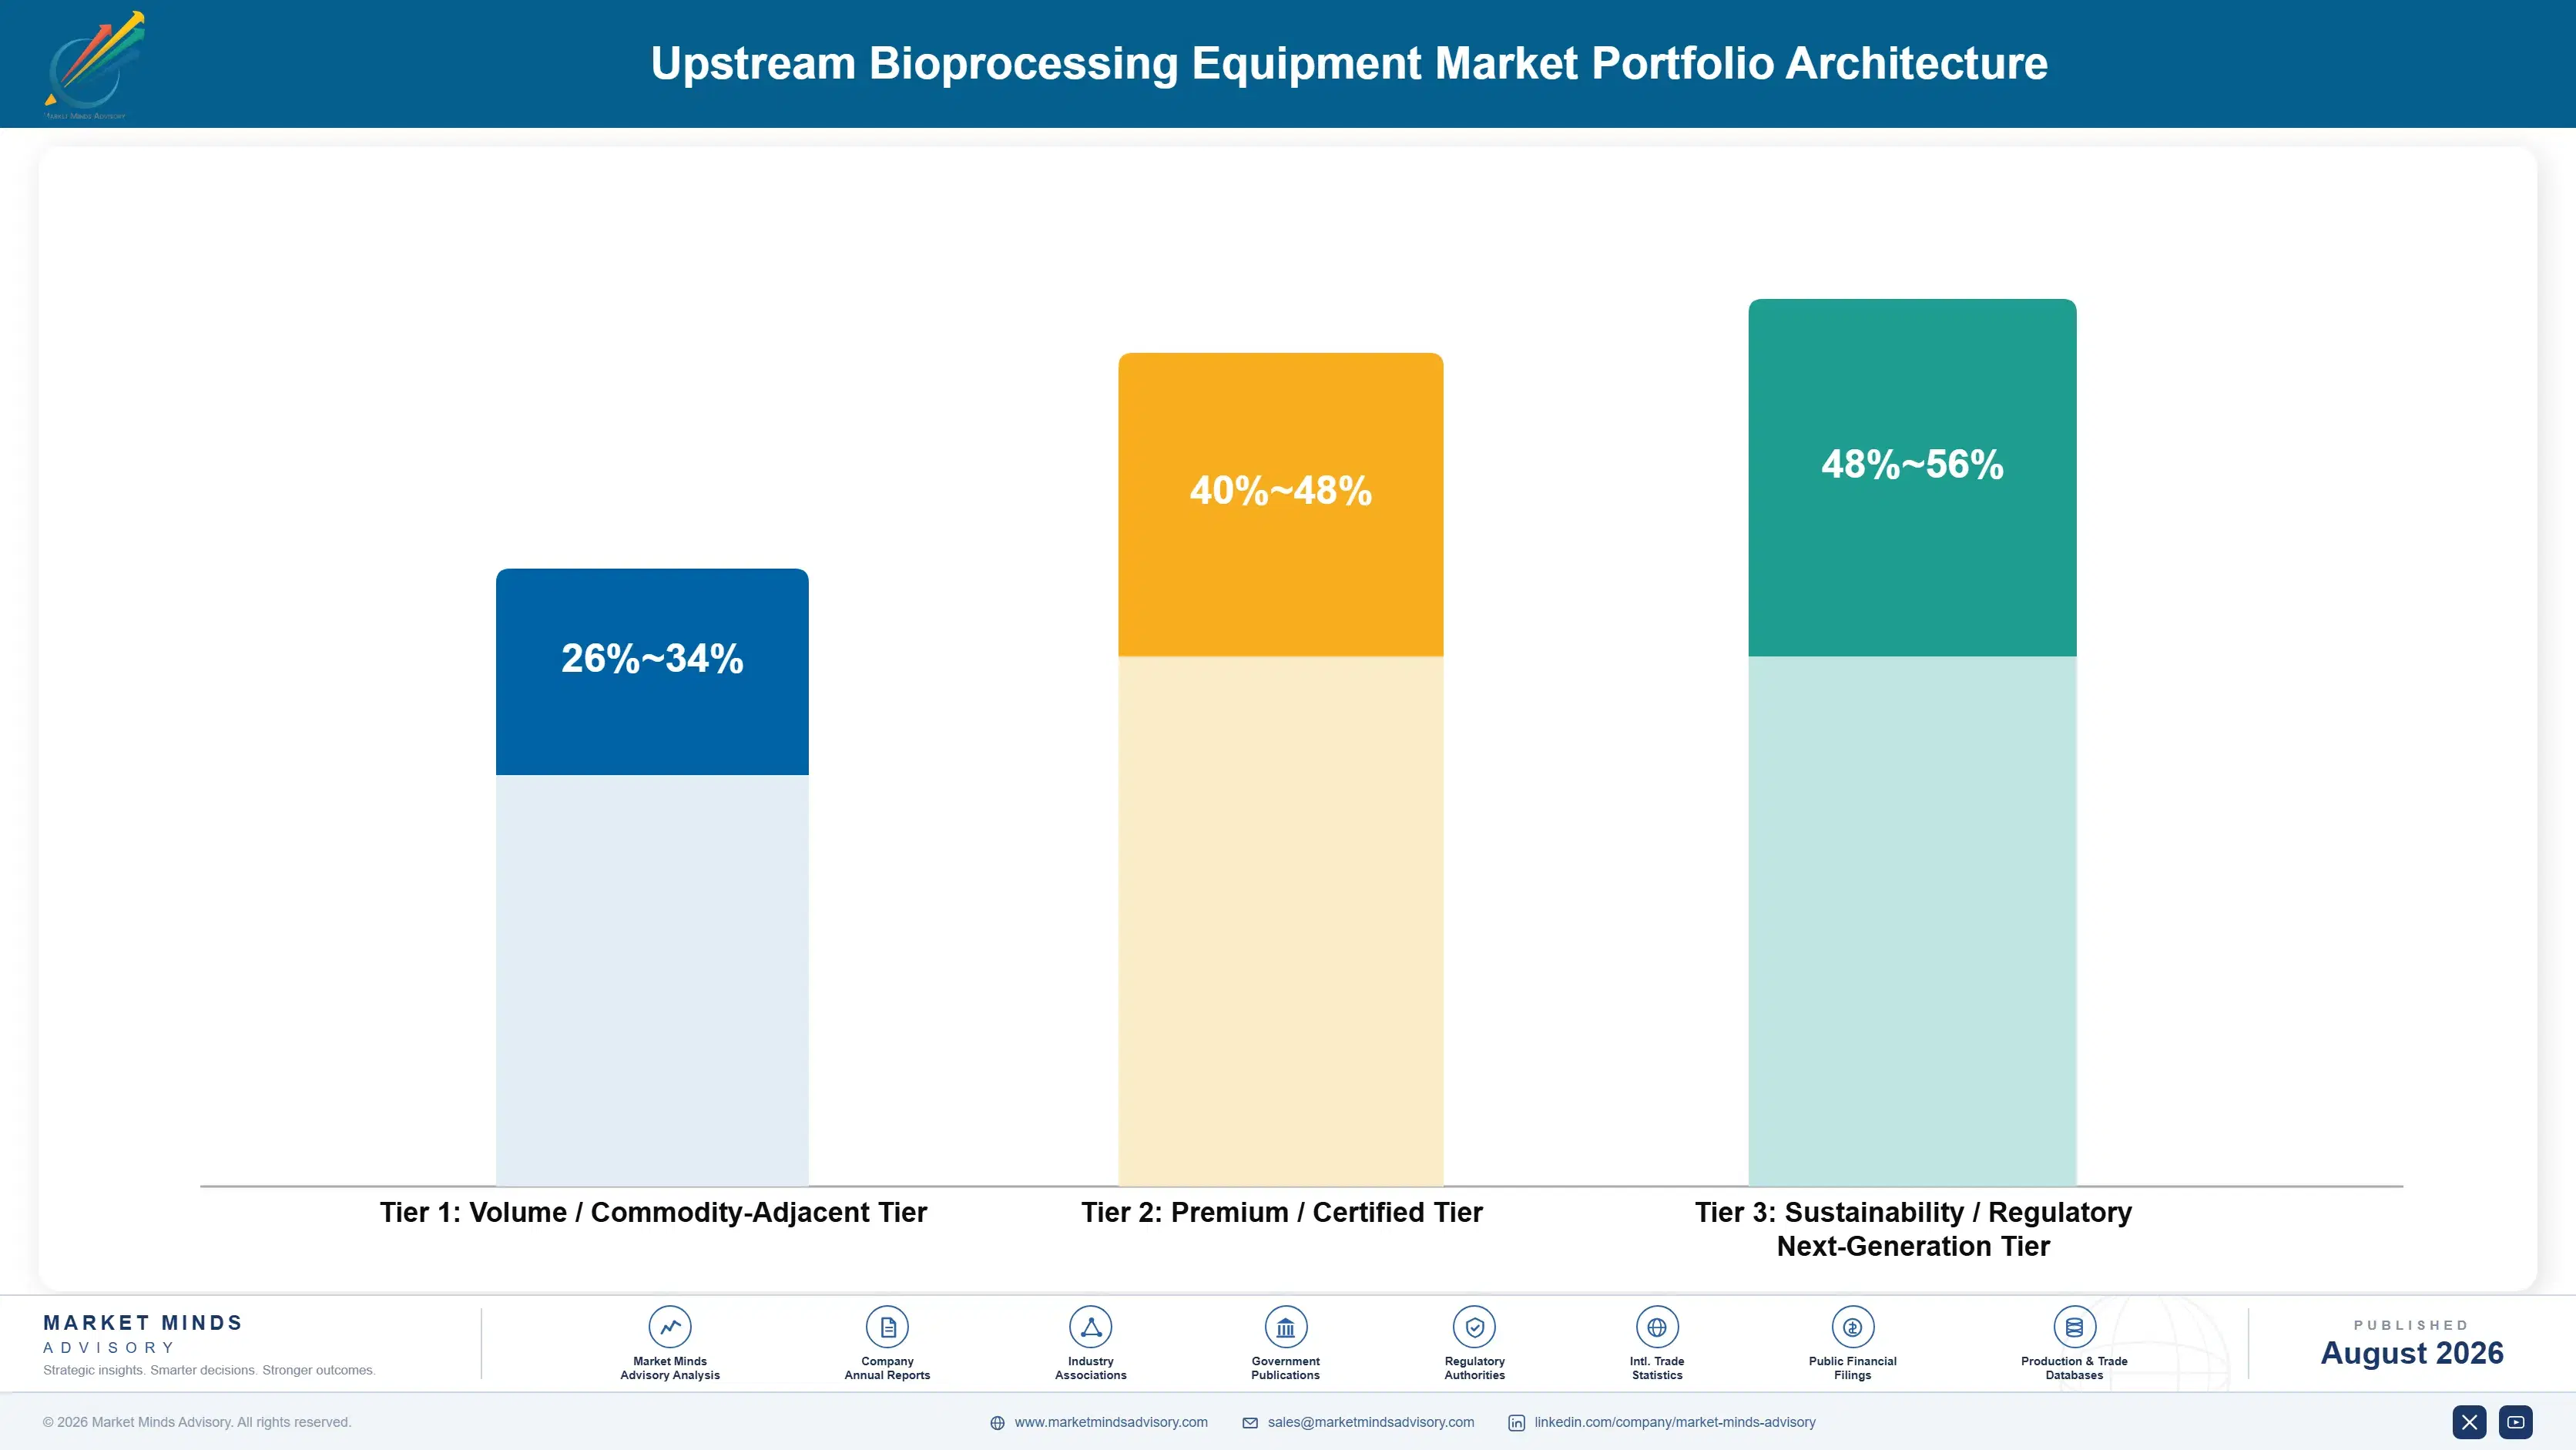
Portfolio Architecture for Margin Defence

Bioprocessing equipment portfolios split into three tiers with genuinely different margin economics. Volume commodity-adjacent standard stainless steel systems carry the thinnest margins but the broadest biomanufacturing deployment base, premium certified single-use formats command meaningfully wider margins on lower absolute volume, and next-generation cell therapy and continuous processing platforms sit at the top of the pricing ladder despite modest overall volume relative to standard stainless steel systems. This structure has held stable across recent cycles. Producers overlooking this risk mispricing capacity.
The tension between volume and premium positioning shapes most manufacturer investment decisions. Standard stainless steel systems still generate meaningful category revenue given their broad biomanufacturing deployment base, but margin growth increasingly concentrates in premium and next-generation tiers where manufacturers can differentiate on clinical validation rather than competing purely on price against regional challengers. Biomanufacturers reward manufacturers straddling both tiers. This dynamic has held steady.

High-value margin pools concentrate in cell therapy and continuous processing premium formats, where biotech companies actively expand capital budgets and demonstrate genuine willingness to pay above standard category pricing. Manufacturers positioned early in these tiers are best placed to capture disproportionate profit growth over the coming decade. This concentration is likely to deepen further.

Volume / Commodity-Adjacent Tier

Standard stainless steel bioreactors sold primarily on price and basic reliability, where biomanufacturing procurement teams dominate purchasing decisions and margins stay comparatively thin despite substantial overall volume. Manufacturers here compete mainly on cost efficiency and reliable delivery rather than formulation differentiation.
Gross Margin: 26-34%

Premium / Certified Tier

Single-use bioreactor formats sold to biomanufacturers seeking validated flexibility beyond standard stainless steel systems, commanding a meaningful and durable pricing premium across most manufacturing markets. Manufacturers here differentiate through documented performance consistency rather than price competition alone.
Gross Margin: 40-48%

Sustainability / Regulatory / Next-Generation Tier

Cell therapy and continuous processing platforms serving biomanufacturers with the most demanding reliability and validation requirements, commanding the category's widest margins on comparatively modest current volume. Manufacturers here invest heavily in regulatory validation and specialized manufacturing infrastructure.
Gross Margin: 48-56%
upstream-bioprocessing-equipment-market-portfolio-architecture-1787640635128

High-value Sub-segments and Strategic Watch-out

Cell and Gene Therapy Manufacturing Bioreactors

This segment combines the fastest volume growth with the strongest margins in the category, driven by clinical pipeline demand and rewarding manufacturers with dedicated engineering capability already in place today. This lead is unlikely to narrow soon given the qualification barriers involved for new entrants.
Gross Margin: 48-56%

Perfusion and Continuous Processing Systems

Biomanufacturers increasingly demand validated continuous processing performance here, supporting strong margins in the category, though volume remains smaller than standard stainless steel systems across the broader industry base currently. Early movers gain a durable competitive edge here. Manufacturers increasingly demand documented evidence before committing to multi-year contracts.
Gross Margin: 42-50%

Stainless Steel Bioreactors

This remains the largest volume base in the category, with pricing under continuous competitive pressure, leaving margins thinner than premium and next-generation tiers by a wide margin overall. Manufacturers largely view this as a stable revenue floor rather than a growth priority worth chasing. today.
Gross Margin: 26-34%

Single-Use Bioreactors and Cell Culture Systems

A strategic watch-out segment where prolonged specialty polymer shortages in major sourcing markets could delay reformulation investment currently supporting above-average category growth across facility upgrade channels. Manufacturers who diversify supply chains proactively reduce this exposure considerably over time. This threat merits close ongoing monitoring by producers.
Gross Margin: 36-44%

Facility Qualification Meets Manufacturer Loyalty

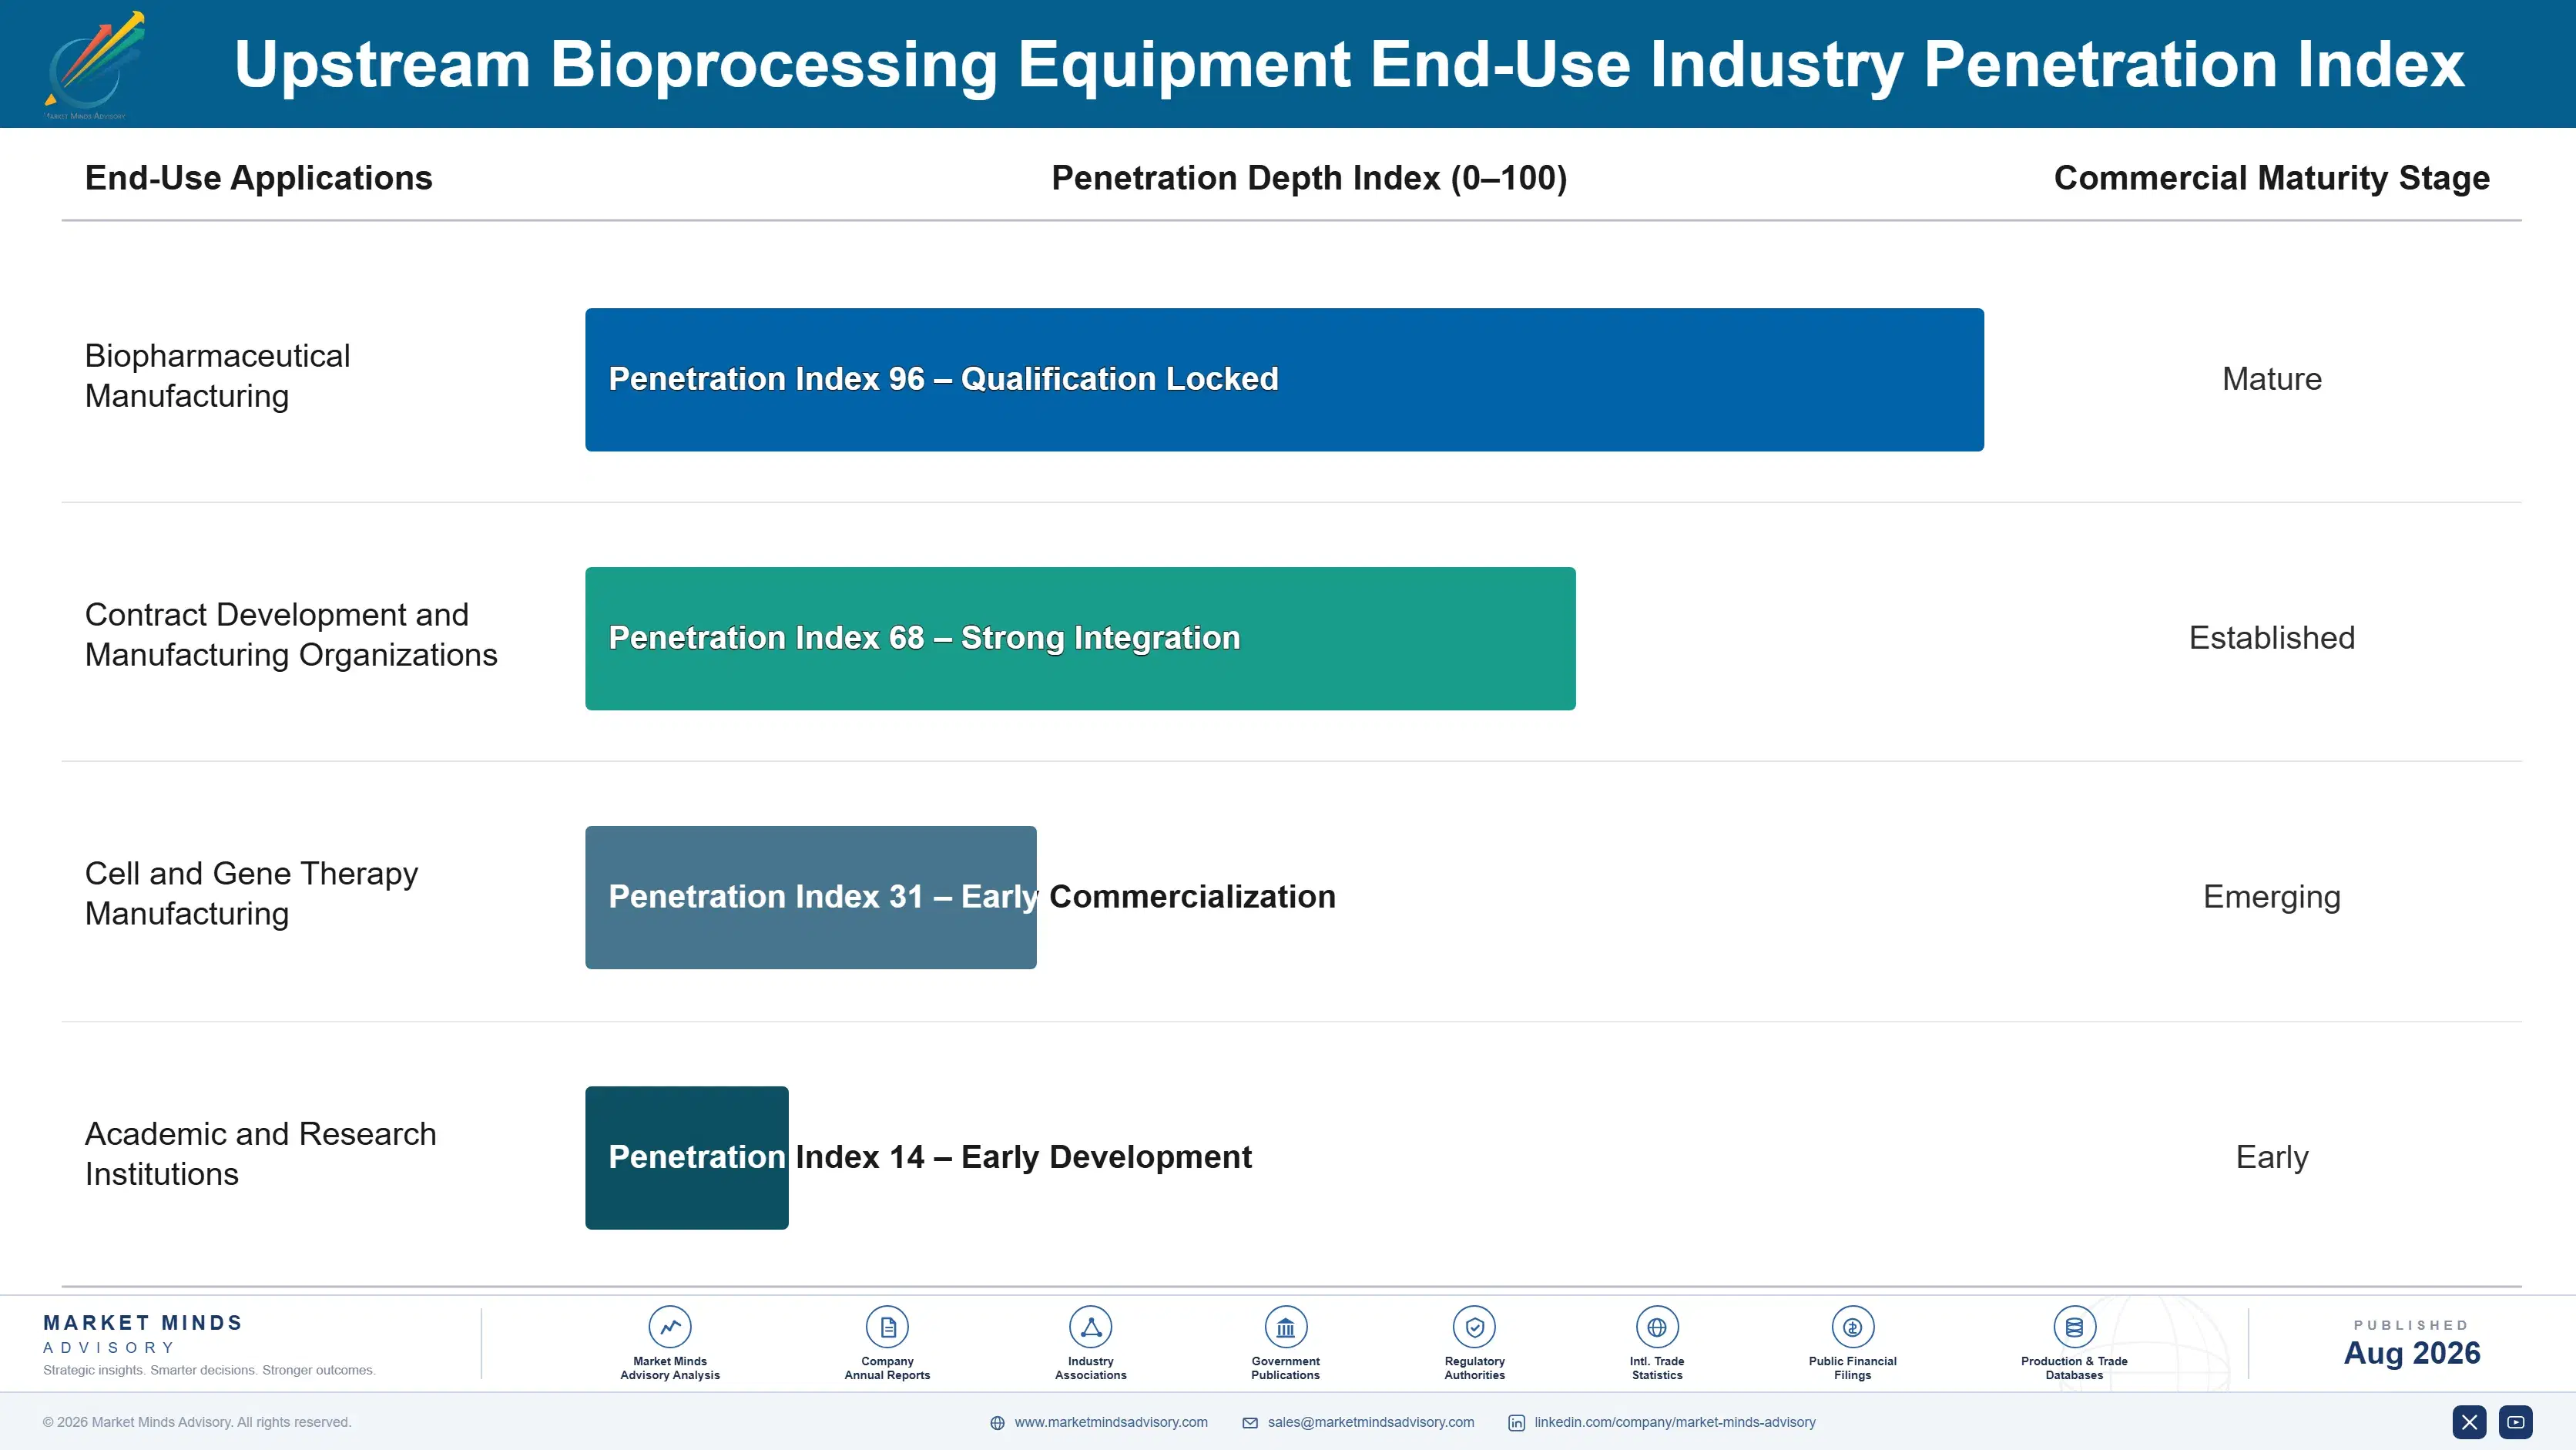
Bioprocessing equipment demand behaves like an annuity for established manufacturers, since biomanufacturer qualification cycles lock in supplier relationships for three to five years once facility validation is secured. This recurring qualification pattern gives manufacturers a durable revenue base that smooths out the volatility component cost swings otherwise introduce into quarterly earnings. Manufacturers who invest early in qualification infrastructure are rewarded with multi-year contract stability few competitors can easily disrupt.
Adoption depth varies meaningfully by end-use vertical. Biopharmaceutical manufacturing remains the deepest and most stable channel, contract development and manufacturing organizations have grown steadily as a stable base demand channel, and cell and gene therapy manufacturing represents the shallowest but fastest-growing vertical as clinical pipeline expansion accelerates across markets. This layered pattern shapes distribution and capacity investment priorities for manufacturers weighing where to allocate scarce capital.

Generational buyer shifts are reshaping category expectations meaningfully. Younger process engineers increasingly treat single-use validation and continuous processing documentation as baseline requirements rather than optional upgrades, favoring manufacturers who offer validated performance data over legacy suppliers their predecessors were comfortable purchasing from without such scrutiny. This shift is already visible in procurement specifications issued across several major biomanufacturing regions.
upstream-bioprocessing-equipment-market-end-use-penetration-index-1787640635621

Where Manufacturers Should Focus Now

These are among the four positions where our research anticipates prominent divergence between winners and laggards over the coming forecast period. Each is grounded in the demand model, the regulatory perimeter, and the announced capacity pipeline.
01 / CELL THERAPY INVESTMENT PRIORITY

Build cell and gene therapy bioreactor capability ahead of demand

Biotech companies increasingly require validated closed-system reliability that only manufacturers with dedicated cell therapy engineering capability can credibly demonstrate ahead of expanding clinical pipeline demand. Manufacturers without this capability risk losing meaningful contract share as competitors finalize cell therapy platforms over the coming several years across every major biomanufacturing market and adjacent digital health segment. This window will not stay open indefinitely, particularly as ambitious regional rivals accelerate their own investment programs, narrowing the gap considerably across every major market and geography.
02 / POLYMER SOURCING RESILIENCE

Diversify specialty polymer sourcing across regions

Specialty polymer and stainless steel price volatility tied to concentrated fabrication supply chains remains the category's most persistent and recurring margin risk across nearly every manufacturer type. Manufacturers who diversify sourcing across multiple regions and countries meaningfully reduce their exposure to any single supply disruption or export restriction affecting availability. Building this resilience takes years of supplier relationship development, but it increasingly separates durable margin performers from manufacturers exposed to sharp quarterly cost swings across successive supply cycles and shortages.
03 / GEOGRAPHIC EXPANSION FOCUS

Prioritize South Asia and Pacific ahead of slower regions

South Asia and Pacific is growing faster than every other region tracked in this report, on the strength of India's rapidly expanding biomanufacturing investment and rising government biotech programs. Manufacturers sequencing capacity expansion should weight this region ahead of slower-growing Eastern Europe or Western Europe markets, where bioprocessing equipment demand growth remains comparatively muted for now and unlikely to accelerate soon. Early positioning here compounds this advantage meaningfully over the coming years across the broader category, well before slower-moving competitors can respond.
04 / CONTINUOUS PROCESSING TIMING URGENCY

Accelerate perfusion platform development before rivals close gap

Specialty manufacturers have led continuous processing platform development considerably faster than legacy incumbents, forcing established players to respond quickly or risk losing contracts during rising facility efficiency cycles nationwide. Manufacturers who delay continuous processing investment risk ceding premium contract share entirely to smaller, more agile competitors already several steps ahead on platform integration and biomanufacturer trust. This urgency will only intensify as biomanufacturers continue reallocating supplier relationships toward validated continuous processing formats, rewarding early movers disproportionately over the coming several years.

Engagement Snapshot From the Field

A live engagement with an industry participant carrying material or product regulatory and market exposure ahead of a defining policy shift, showing how our research translates into a defensible multi-year portfolio strategy.
MARKET MINDS ADVISORY · CLIENT ENGAGEMENT SUMMARY
Upstream Bioprocessing Equipment Producer Strategic Portfolio Review and Transition Roadmap 2026·Investment Scenario on Upstream Bioprocessing Equipment Exposure Evaluation 2025-26
CLIENT PROFILE
The client is a mid-tier North American bioprocessing equipment maker with an established standard stainless steel product line but limited presence in the faster-growing cell therapy segment. Annual revenue was approximately 230 million dollars at the time of engagement (client-reported, unverified by MMA), concentrated heavily in traditional biomanufacturer distribution. The client had begun evaluating cell therapy capability but lacked confidence in projected payback timelines.
STRATEGIC CHALLENGE
The client faced declining margins on standard stainless steel systems amid intensifying digitally-native competition, while lacking the technical expertise to evaluate cell therapy engineering opportunities and negotiate favorable biomanufacturer partnerships. Leadership needed independent, data-driven clarity before committing capital to any single channel investment pathway this planning cycle. Leadership also worried that continued delay would let digitally-native rivals lock in the best biomanufacturer relationships first.
MMA APPROACH
MMA conducted primary interviews with biomanufacturer process engineers and clinical research partners, benchmarked the client's engineering capability against leading cell therapy brand competitors, and modeled realistic margin uplift scenarios across three investment pathways. The engagement combined quantitative survey data with qualitative expert interviews to triangulate a defensible recommendation overall for leadership.
KEY FINDINGS
  1. Cell therapy conversion offered a projected margin improvement of roughly 23 percentage points compared to the client's existing stainless steel portfolio (client-reported, unverified by MMA).
  2. Biomanufacturer process engineers indicated willingness to pay a validated reliability premium of up to 29 percent for clinically-supported cell therapy formulations overall.
  3. Cell therapy engineering infrastructure required a minimum thirteen-month development timeline before meaningful recurring revenue materialized fully. a longer runway than the client initially assumed for planning purposes.
  4. Competing manufacturers who delayed cell therapy investment lost an estimated 12 percent of customer share during the most recent channel shift cycle.
CLIENT PROFILE
The client is a mid-tier North American bioprocessing equipment maker with an established standard stainless steel product line but limited presence in the faster-growing cell therapy segment. Annual revenue was approximately 230 million dollars at the time of engagement (client-reported, unverified by MMA), concentrated heavily in traditional biomanufacturer distribution. The client had begun evaluating cell therapy capability but lacked confidence in projected payback timelines.
STRATEGIC CHALLENGE
The client faced declining margins on standard stainless steel systems amid intensifying digitally-native competition, while lacking the technical expertise to evaluate cell therapy engineering opportunities and negotiate favorable biomanufacturer partnerships. Leadership needed independent, data-driven clarity before committing capital to any single channel investment pathway this planning cycle. Leadership also worried that continued delay would let digitally-native rivals lock in the best biomanufacturer relationships first.
MMA APPROACH
MMA conducted primary interviews with biomanufacturer process engineers and clinical research partners, benchmarked the client's engineering capability against leading cell therapy brand competitors, and modeled realistic margin uplift scenarios across three investment pathways. The engagement combined quantitative survey data with qualitative expert interviews to triangulate a defensible recommendation overall for leadership.
KEY FINDINGS
  1. Cell therapy conversion offered a projected margin improvement of roughly 23 percentage points compared to the client's existing stainless steel portfolio (client-reported, unverified by MMA).
  2. Biomanufacturer process engineers indicated willingness to pay a validated reliability premium of up to 29 percent for clinically-supported cell therapy formulations overall.
  3. Cell therapy engineering infrastructure required a minimum thirteen-month development timeline before meaningful recurring revenue materialized fully. a longer runway than the client initially assumed for planning purposes.
  4. Competing manufacturers who delayed cell therapy investment lost an estimated 12 percent of customer share during the most recent channel shift cycle.
RECOMMENDED STRATEGY
Phase 1: Phase 1 (0-6 months): Commission a detailed engineering and channel capability assessment across product lines while also mapping realistic capital requirements Phase 2: Phase 2 (6-13 months): Launch pilot cell therapy products and begin phased biomanufacturer validation partnerships prioritizing formulations with the clearest biomanufacturer demand Phase 3: Phase 3 (13-27 months): Scale successful formulations and evaluate expansion into additional biomanufacturing categories while tracking realized margin gains closely
OUTCOME
Thirteen months after implementation, the client reported launching two new cell therapy product lines and expanding validated-format revenue by approximately 25 percent (client-reported, unverified by MMA). Leadership credited the phased validation approach with reducing formulation risk during the transition. The client also reported improved confidence among its board in pursuing further specialty investment.

Frequently Asked Questions

Foundational context covering the market sizes, CAGR, scope, country, region and competition that inform every finding below. This section is provided to cover basics and most often pre-purchase conversations, answered from the MMA Primary Research Dataset.

What is the current size of the Upstream Bioprocessing Equipment Market?

The global upstream bioprocessing equipment market reached approximately 9.8 billion dollars in 2025, with the United States as the single largest producing country. Demand remains anchored by stainless steel bioreactor applications.

How large will the Upstream Bioprocessing Equipment Market be by 2036?

The market is projected to reach approximately 31.50 billion dollars by 2036, roughly 2.89 times its 2026 value. This reflects rapid biomanufacturing demand across most regions.

What is the CAGR for the Upstream Bioprocessing Equipment Market 2026 to 2036?

The market is projected to grow at a compound annual rate of 11.2 percent through 2036, up modestly from its historical pace. Bull and bear scenarios range from 10.0 to 12.4 percent respectively.

Which segment is growing fastest?

Cell and gene therapy manufacturing bioreactors are growing fastest, at roughly 18.5 percent annually, well ahead of standard stainless steel formulations. This outpaces the overall market's 11.2 percent rate considerably.

Who are the major companies in the Upstream Bioprocessing Equipment Market?

Leading companies include Sartorius, Cytiva, Thermo Fisher Scientific, Merck, and Danaher, together holding roughly 52 percent of category revenue. A long tail of specialty manufacturers competes on innovation.

Which country is growing fastest?

China is growing fastest among countries tracked, at approximately 14.5 percent annually, outpacing every other market covered. Expanding biomanufacturing capacity and biotech investment drive this acceleration.

Report Segmentation Architecture

The full report scope spans multiple orthogonal segmentation dimensions, with cross-tabulated demand data provided for each dimension pair. Coverage extends further to regional breakdowns, trend trajectories, and the competitive detail needed to support segment-level decision-making.

By Product Type

  • Stainless Steel Bioreactors
  • Single-Use Bioreactors and Cell Culture Systems
  • Fermenters and Microbial Cultivation Systems
  • Cell Culture Media Preparation and Mixing Systems
  • Perfusion and Continuous Processing Systems
  • Cell and Gene Therapy Manufacturing Bioreactors

By End-Use Industry

  • Biopharmaceutical Manufacturing
  • Contract Development and Manufacturing Organizations
  • Cell and Gene Therapy Manufacturing
  • Academic and Research Institutions

By Commercial Dimension

  • Direct Manufacturer Supply
  • Contract Manufacturing Supply
  • Distribution Networks
  • Export Wholesale

By Region

  • North America
  • Western Europe
  • East Asia
  • South Asia and Pacific
  • Latin America
  • Middle East and Africa
  • Eastern Europe

Scope, Methodology, and Coverage

Every figure in this report is reproducible from documented input assumptions. The scope below maps the historical period, the forecast horizon, the segmentation dimensions, and the countries covered, alongside the underlying primary and qualitative methodology.
Historical Period
2020 to 2025
Forecast Period
2026 to 2036
Base Year
2025 (USD billions; MMA Primary Research Dataset, August 2026)
Market Definition
The upstream bioprocessing equipment market covers commercial production and sale of stainless steel bioreactors, single-use bioreactors and cell culture systems, fermenters, media preparation and mixing systems, perfusion and continuous processing systems, and cell and gene therapy manufacturing bioreactors used in biopharmaceutical cell culture and cultivation. It excludes downstream purification, filling, and packaging equipment sold under separate manufacturing equipment classifications.
Quantitative Units
USD billions (current prices); unit shipments for volume-referenced commentary
Segmentation Dimensions
By Product Type; By End-Use Industry; By Commercial Dimension; By Region
Regions Covered
North America, Western Europe, East Asia, South Asia and Pacific, Latin America, Middle East and Africa, Eastern Europe
Countries Covered
USA, China, Germany, France, UK, Japan, South Korea, India, Australia, Canada, Brazil, Mexico, Singapore, Ireland, Switzerland, UAE, Saudi Arabia, South Africa, Turkey, Poland, Netherlands, Italy, Spain, Sweden, and additional markets relevant to this sector
Key Companies Profiled
Sartorius AG, Cytiva, Thermo Fisher Scientific Inc, Merck KGaA, Danaher Corporation, Eppendorf SE, Applikon Biotechnology B.V., Getinge AB, Pall Corporation, Repligen Corporation, Corning Incorporated, Solaris Biotechnology Srl, Infors AG, ABEC Inc, PBS Biotech Inc, Univercells Technologies, Distek Inc, Zeta Biopharma GmbH, GE HealthCare Technologies Inc, Meissner Filtration Products Inc
Quantitative Methodology
Primary survey, n=3,800 respondents, Q4 2025, six countries; demand-side model with trade association cross-validation
Qualitative Methodology
47 expert interviews, Q4 2025; applied to validate demand model assumptions, identify emerging dynamics, and assess competitive positioning
Report Format
PDF and XLSX data workbook (Word format preview document)
Publisher
Market Minds Advisory
Report Code
MMA-2026-MED-105
Published
August 2026
Contact
sales@marketmindsadvisory.com | www.marketmindsadvisory.com

Purchase the full Upstream Bioprocessing Equipment Market Report (2026 to 2036).

This report delivers a complete assessment of the global upstream bioprocessing equipment market through 2036, covering demand drivers, competitive dynamics, and segmentation across six product categories. It includes detailed regional analysis across all seven world regions, profiles of twenty leading manufacturers, and quantified revenue lever analysis for margin improvement. The report draws on primary survey data from 3,800 respondents and 47 expert interviews conducted in the fourth quarter of 2025. Readers gain a defensible, data-driven view of where category investment should concentrate over the coming decade ahead.
Seven-region demand and CAGR breakdown analysis
Twenty-company competitive profile matrix with moat details
Quantified revenue lever impact modeling and ROI ranges
Primary survey data across six countries
Forty-seven expert interview synthesis summary insights
Anonymized client case study application and outcome

Built For The People Who Decide

From boardroom strategy to bench-side execution, this report is read cover-to-cover by leaders shaping the next decade of their industry, turning demand scenarios, market dynamics and valuation benchmarks into decisions.
CXOs/ Presidents/ VPs/ Managers
M&A and Corporate Development
Strategy Teams and R&D Heads
Procurement and Product Directors
Regulatory and Compliance Leaders
Investor Relations and Equity Analysts