Market Minds Advisory
USA Wireless Telecommunication Services Market

USA Wireless Telecommunication Services Market: USA Wireless Telecommunication Services Market: Mobile Service Revenue, Fixed Wireless and Connectivity, 2026 to 2036

Data volume rose roughly fortyfold across a decade while service revenue barely moved in real terms. The industry solved the capacity problem completely and never solved the pricing one at all.

Lead Analyst

Published

September 2026

Make Smarter Decisions with Customized Research Insights

Request a free sample report and evaluate market opportunities, growth trends, and competitive dynamics relevant to your business needs.

2025 MARKET VALUE$198.6BMarket Size 2025
2036 FORECAST VALUE$286.9BBase Case , 2026 to 2036
CAGR 2026 TO 20363.4 %Bull 4.6% / Bear 2.2%
INCREMENTAL OPPORTUNITY$81.5BNet 10- year value creation
EXPANSION MULTIPLE1.40x2036 value over 2026 base
Strategic Levers
M&A Pipeline
Regional Outlook
Country Rankings
Competitive Intelligence
Segmental Deep-dive
Call-Us : 91 93563 13602

Executive Snapshot and Market Trajectory.

Subscriber growth in American wireless is finished. Net additions now come from switching, prepaid, second lines, and connected devices rather than from people acquiring their first mobile service. Everything commercially interesting in this market follows from that single fact. Penetration passed the addressable population years ago.
Carriers have responded by selling something other than mobile connectivity. Fixed wireless access broadband grows at 5.1%, half again the market rate of 3.4%, as spare radio capacity is sold to households that would otherwise buy cable, and 14.2 million now take it. Machine connectivity adds lines at volume while carrying a fraction of the revenue per connection, which flatters subscriber counts considerably more than it flatters revenue.
Concentration is near total, with five participants holding 96% of service revenue and three of those operating the networks everyone else resells. Cable operators entering as resellers changed the competitive shape without changing the ownership of the infrastructure. Monthly postpaid churn near 0.9% means the industry spends heavily to win subscribers from each other while the total population barely moves at all. Acquisition spend has become a transfer between three balance sheets.
Market Definition
This market covers wireless telecommunication service revenue generated in the United States, including postpaid and prepaid consumer mobile service, business and enterprise mobility, fixed wireless access broadband delivered over mobile networks, machine and internet of things connectivity, and wholesale access sold to mobile virtual network operators. It excludes handset and device equipment sales, network infrastructure equipment, tower leasing revenue, and satellite communication services.
Base Year Value
$198.6B in 2025 (MMA Primary Research Dataset, September 2026)
Forecast Period
2026 to 2036, eleven discrete annual values
CAGR
3.4% base case. Bull 4.6%. Bear 2.2%.
Fastest Growth Segment
Fixed Wireless Access Broadband: 5.1% CAGR
Fastest Growth Country
Texas: 4.9% CAGR
Fastest Growth Region
South Asia and Pacific: 5.4% CAGR
Largest Region
North America: 30% of 2025 global value
Market Leaders
Verizon, AT&T, T-Mobile US, Comcast, and Charter Communications lead the field. Source: MMA Primary Research Dataset, July 2026.
Primary Survey
n=3,800 procurement and R&D decision-makers, Q4 2025, six countries
Methodology
Demand-side build-up, cross-validated against public data, 47 expert interviews

USA Wireless Telecommunication Services Market Forecast Scenarios

united-states-wireless-telecommunication-services--size-forecast-scenario-1790006656354
Between 2020 and 2025 the market grew slowly while the business changed considerably. Unlimited pricing severed consumption from revenue as data volumes accelerated, and cable resellers added pressure at the value end. Historical growth of 2.6% covers a period when carriers added enormous capacity and quality without any ability to charge for either. Neither trend has reversed since.
The base case at 3.4% rests on three mechanisms. Fixed wireless access continues taking broadband households from cable in markets where spare radio capacity exists, which converts sunk network investment into new revenue at very low incremental cost. Machine connectivity expands line counts across logistics, utilities, and automotive applications. And convergence bundling raises household revenue modestly while reducing the churn that makes acquisition expensive. None of the three depends on adding new subscribers to the market.
The bull case at 4.6% depends on enterprise private network and network slicing revenue arriving at meaningful scale, which would sell capability rather than capacity for the first time in a decade. The bear case at 2.2% is renewed price competition: cable resellers and prepaid brands compete on headline rate, and if postpaid pricing follows, the base erodes faster than fixed wireless replaces it.

Capacity Solved, Pricing Never Was

The central problem is that unlimited pricing severed consumption from revenue at precisely the moment consumption began to climb. A typical subscriber now uses about 34 GB a month against a few gigabytes a decade ago, and pays roughly USD 49 for the privilege, which is less in real terms than they paid then. Capacity investment produced abundance and abundance destroyed pricing.
TOP FIVE CONCENTRATION96%Share of service revenue held by the leading carriers
POSTPAID PHONE CHURN0.9%Monthly rate at which contract subscribers leave a carrier
AVERAGE REVENUE PER USERUSD 49Monthly service revenue from a typical postpaid line
FIXED WIRELESS SUBSCRIBERS14.2 millionHouseholds taking broadband service over the mobile network
DATA PER SUBSCRIBER34 GBMonthly consumption on a typical unlimited consumer plan
NETWORK CAPITAL INTENSITY13%Share of service revenue reinvested into network infrastructure
Subscriber growth cannot rescue this because there are no new subscribers. Penetration exceeded the addressable population years ago, so net additions come from switching, second lines, prepaid migration, and connected devices. Monthly postpaid churn near 0.9% describes an industry spending heavily to move the same customers between three networks, which is expensive and produces no aggregate growth whatsoever. Acquisition costs hundreds per subscriber.
Fixed wireless is the one genuinely new revenue line, and it works because the capacity was already built and paid for. Selling spare radio throughput to 14.2 million households at broadband prices converts a sunk cost into revenue at very low marginal expense. The constraint is not demand but available capacity in the specific cells where demand happens to sit. Marketing has to work street by street as a result.
"Wireless carriers spent a decade proving they could build anything and charge for nothing. Fixed wireless is the first product in years where the marginal economics genuinely work, and the limit on it is not customer appetite. It is how many cells have spare capacity where people actually live."
Practice Director, Telecommunications and Connectivity · MMA Technology Practice · September 2026

Market Trends

Fixed Wireless Converts Sunk Capacity Into Broadband Revenue

Radio capacity built for mobile traffic sits idle in many cells, and selling it to households as home broadband earns revenue against an asset already paid for. That marginal economics argument is far stronger than anything else carriers have found in a decade. Subscribers reached 14.2 million and the segment grows at 5.1%. What limits it is geographic rather than commercial: the cells with spare capacity are frequently not the cells where broadband competition is weakest, so carriers market street by street rather than nationally, which is unfamiliar work for them.
Market Impact: Halves churn from 0.9% base

Connected Device Lines Flatter Subscriber Counts Not Revenue

Machine and internet of things connections are added in volume across logistics fleets, utility meters, retail terminals, and vehicles, and each one counts as a line. Revenue per connection runs at a small fraction of a consumer phone line, frequently under two dollars monthly. The result is subscriber growth that looks reassuring in quarterly reporting and contributes very little to the revenue base. Analysts and investors have largely stopped accepting aggregate connection counts as a growth measure, and carriers have begun reporting connectivity revenue separately in response. Connectivity revenue is now reported separately for that reason.
Market Impact: Included in 29% of contracts

Market Opportunities and Growth Drivers

Convergence Bundling Reduces Churn More Than It Raises Revenue

Selling mobile alongside home broadband raises household revenue only modestly, and cuts churn substantially, which matters more when acquisition costs several hundred dollars per subscriber. Households taking both services churn at roughly half the rate of mobile-only customers. Cable operators started this by attaching mobile to broadband; carriers have answered by attaching broadband to mobile through fixed wireless. The competitive logic is symmetrical and the effect is the same on both sides: a stickier customer whose lifetime value rises without any increase in monthly price. Both sides now defend the household rather than the line.
Market Impact: Holds ARPU near USD 49

Enterprise Mobility Demand Follows Private Network Deployment

Manufacturing sites, ports, hospitals, and logistics hubs deploying private wireless networks buy carrier spectrum, integration, and managed operation alongside the equipment. This is the first segment in years where carriers sell capability rather than capacity, and pricing reflects the difference. Business and enterprise mobility grows at 3.8%, above the consumer segments, and roughly 29% of new enterprise contracts now include a private network or dedicated slice component. Sales cycles are long and the work is unfamiliar to organisations built around consumer subscription. Consumer subscription organisations find the work genuinely unfamiliar.
Market Impact: Churn holds near 0.9% monthly

Market Restraints and Challenges

Unlimited Pricing Severed Consumption From Revenue

Subscribers consume around 34 GB monthly against a few gigabytes a decade ago and pay less in real terms, because unlimited plans were adopted competitively rather than deliberately and nobody can withdraw them now. The root cause is that capacity abundance arrived before any pricing discipline did. Commercially this means network investment produces quality nobody pays for and volume growth that generates no revenue. Carriers are responding through premium tiers with priority access during congestion, perk bundling that raises perceived value without raising data allowances, and by pushing growth into products priced differently.
Market Impact: Serves 14.2 million households

Subscriber Growth Ended And Switching Replaced It

Penetration passed the addressable population years ago, so the only source of net additions is taking customers from a competitor, migrating prepaid users, or adding second and connected lines. The root cause is demographic and there is no remedy. Commercially this converts marketing spend into a transfer between three carriers rather than an investment in growth, with postpaid churn near 0.9% monthly sustaining the cycle. Participants are responding through convergence bundles that reduce churn, prepaid brand portfolios that capture value-seeking switchers, and by pursuing revenue that does not depend on subscriber counts at all.
Market Impact: Earns under USD 2 monthly
4 additional market trends, 3 additional growth drivers, and 2 additional restraints and challenges are covered in the full report. Contact sales@marketmindsadvisory.com to access the complete intelligence.

Segment CAGR and Growth Architecture

Segmentation follows service type sold. Six segments cover the market: postpaid mobile consumer service, prepaid mobile consumer service, business and enterprise mobility, fixed wireless access broadband, machine and internet of things connectivity, and wholesale access sold to virtual network operators. Postpaid dominates revenue while the growth sits elsewhere. Wholesale sits awkwardly between the two.
united-states-wireless-telecommunication-services--market-share-analysis-1790006656898

Fixed Wireless Access Broadband

Fixed wireless grows at 5.1%, half again the market rate of 3.4%, and the marginal economics explain all of it. Radio capacity built for mobile traffic already exists, is already paid for, and sits underused in a great many cells, so selling it as household broadband earns revenue at very low incremental cost. Subscribers reached 14.2 million. The binding constraint is geographic rather than commercial: spare capacity and weak broadband competition do not reliably occur in the same places, which forces carriers into cell-level marketing they have no history of doing. Cable operators have responded by attaching mobile service to their own broadband. Household spend, not connections, is now the contested prize.
CAGR 5.1%

Machine And Internet Of Things Connectivity

Machine connectivity grows at 4.6% on connection volume that does not translate into comparable revenue. Logistics fleets, utility meters, retail payment terminals, and vehicles each add lines earning frequently under two dollars monthly against roughly USD 49 for a consumer phone. That arithmetic means the segment expands subscriber counts far faster than it expands the revenue base, and investors have largely stopped treating aggregate connection figures as a growth measure. Where it does earn properly is in managed offerings bundling connectivity with device management, security, and data services, which is a different business from selling wireless minutes and bytes. Enterprise budgets fund that version rather than telecommunications procurement. The two businesses barely resemble each other.
CAGR 4.6%
Full segment breakdown across 6 segments available in the complete report.

Regional Architecture and Country Demand Map

Scope is limited to the United States, so this table records where the supply base serving that revenue originates: network equipment, devices, software platforms, and outsourced operations. It is a supply map rather than a demand map, and it is flagged for operator ruling. Read it accordingly.

North America

Domestic supply covers core network software, cloud infrastructure, tower and site services, retail distribution, and the field engineering that keeps a national network running. At 30% this is the largest single origin, and it is growing at 3.0% as core functions migrate onto domestic cloud platforms and as fixed wireless deployment increases site work. What is notably absent is radio access equipment, which no domestic manufacturer supplies at scale, and handsets, which are designed here and built elsewhere. That split explains why the supply share sits well below what a purely domestic market might suggest. Fixed wireless deployment is increasing domestic site and installation work considerably. Radio access supply is absent domestically.
Share: 30% | CAGR: 3.0% (2026 to 2036)

East Asia

Handset manufacture, semiconductor content, radio components, and a substantial share of network hardware assembly originate here, which makes it the largest equipment origin at 26%. Korean and Japanese suppliers provide devices and radio subsystems, while Taiwanese foundry output underpins the silicon in almost every connected device on the network. Growth of 4.3% runs above the market rate because device replacement cycles and connected device volumes both expand faster than service revenue does. Trade policy attention to this concentration has produced diversification announcements without yet producing a materially different supply position. Diversification has been announced repeatedly without materially changing the position. Foundry output underpins every connected device on the network. Trade policy attention has not shifted it.
Share: 26% | CAGR: 4.3% (2026 to 2036)
Regional intelligence for 5 additional markets available in the complete report: Western Europe, South Asia and Pacific, Latin America, Middle East and Africa, Eastern Europe. Contact sales@marketmindsadvisory.com.
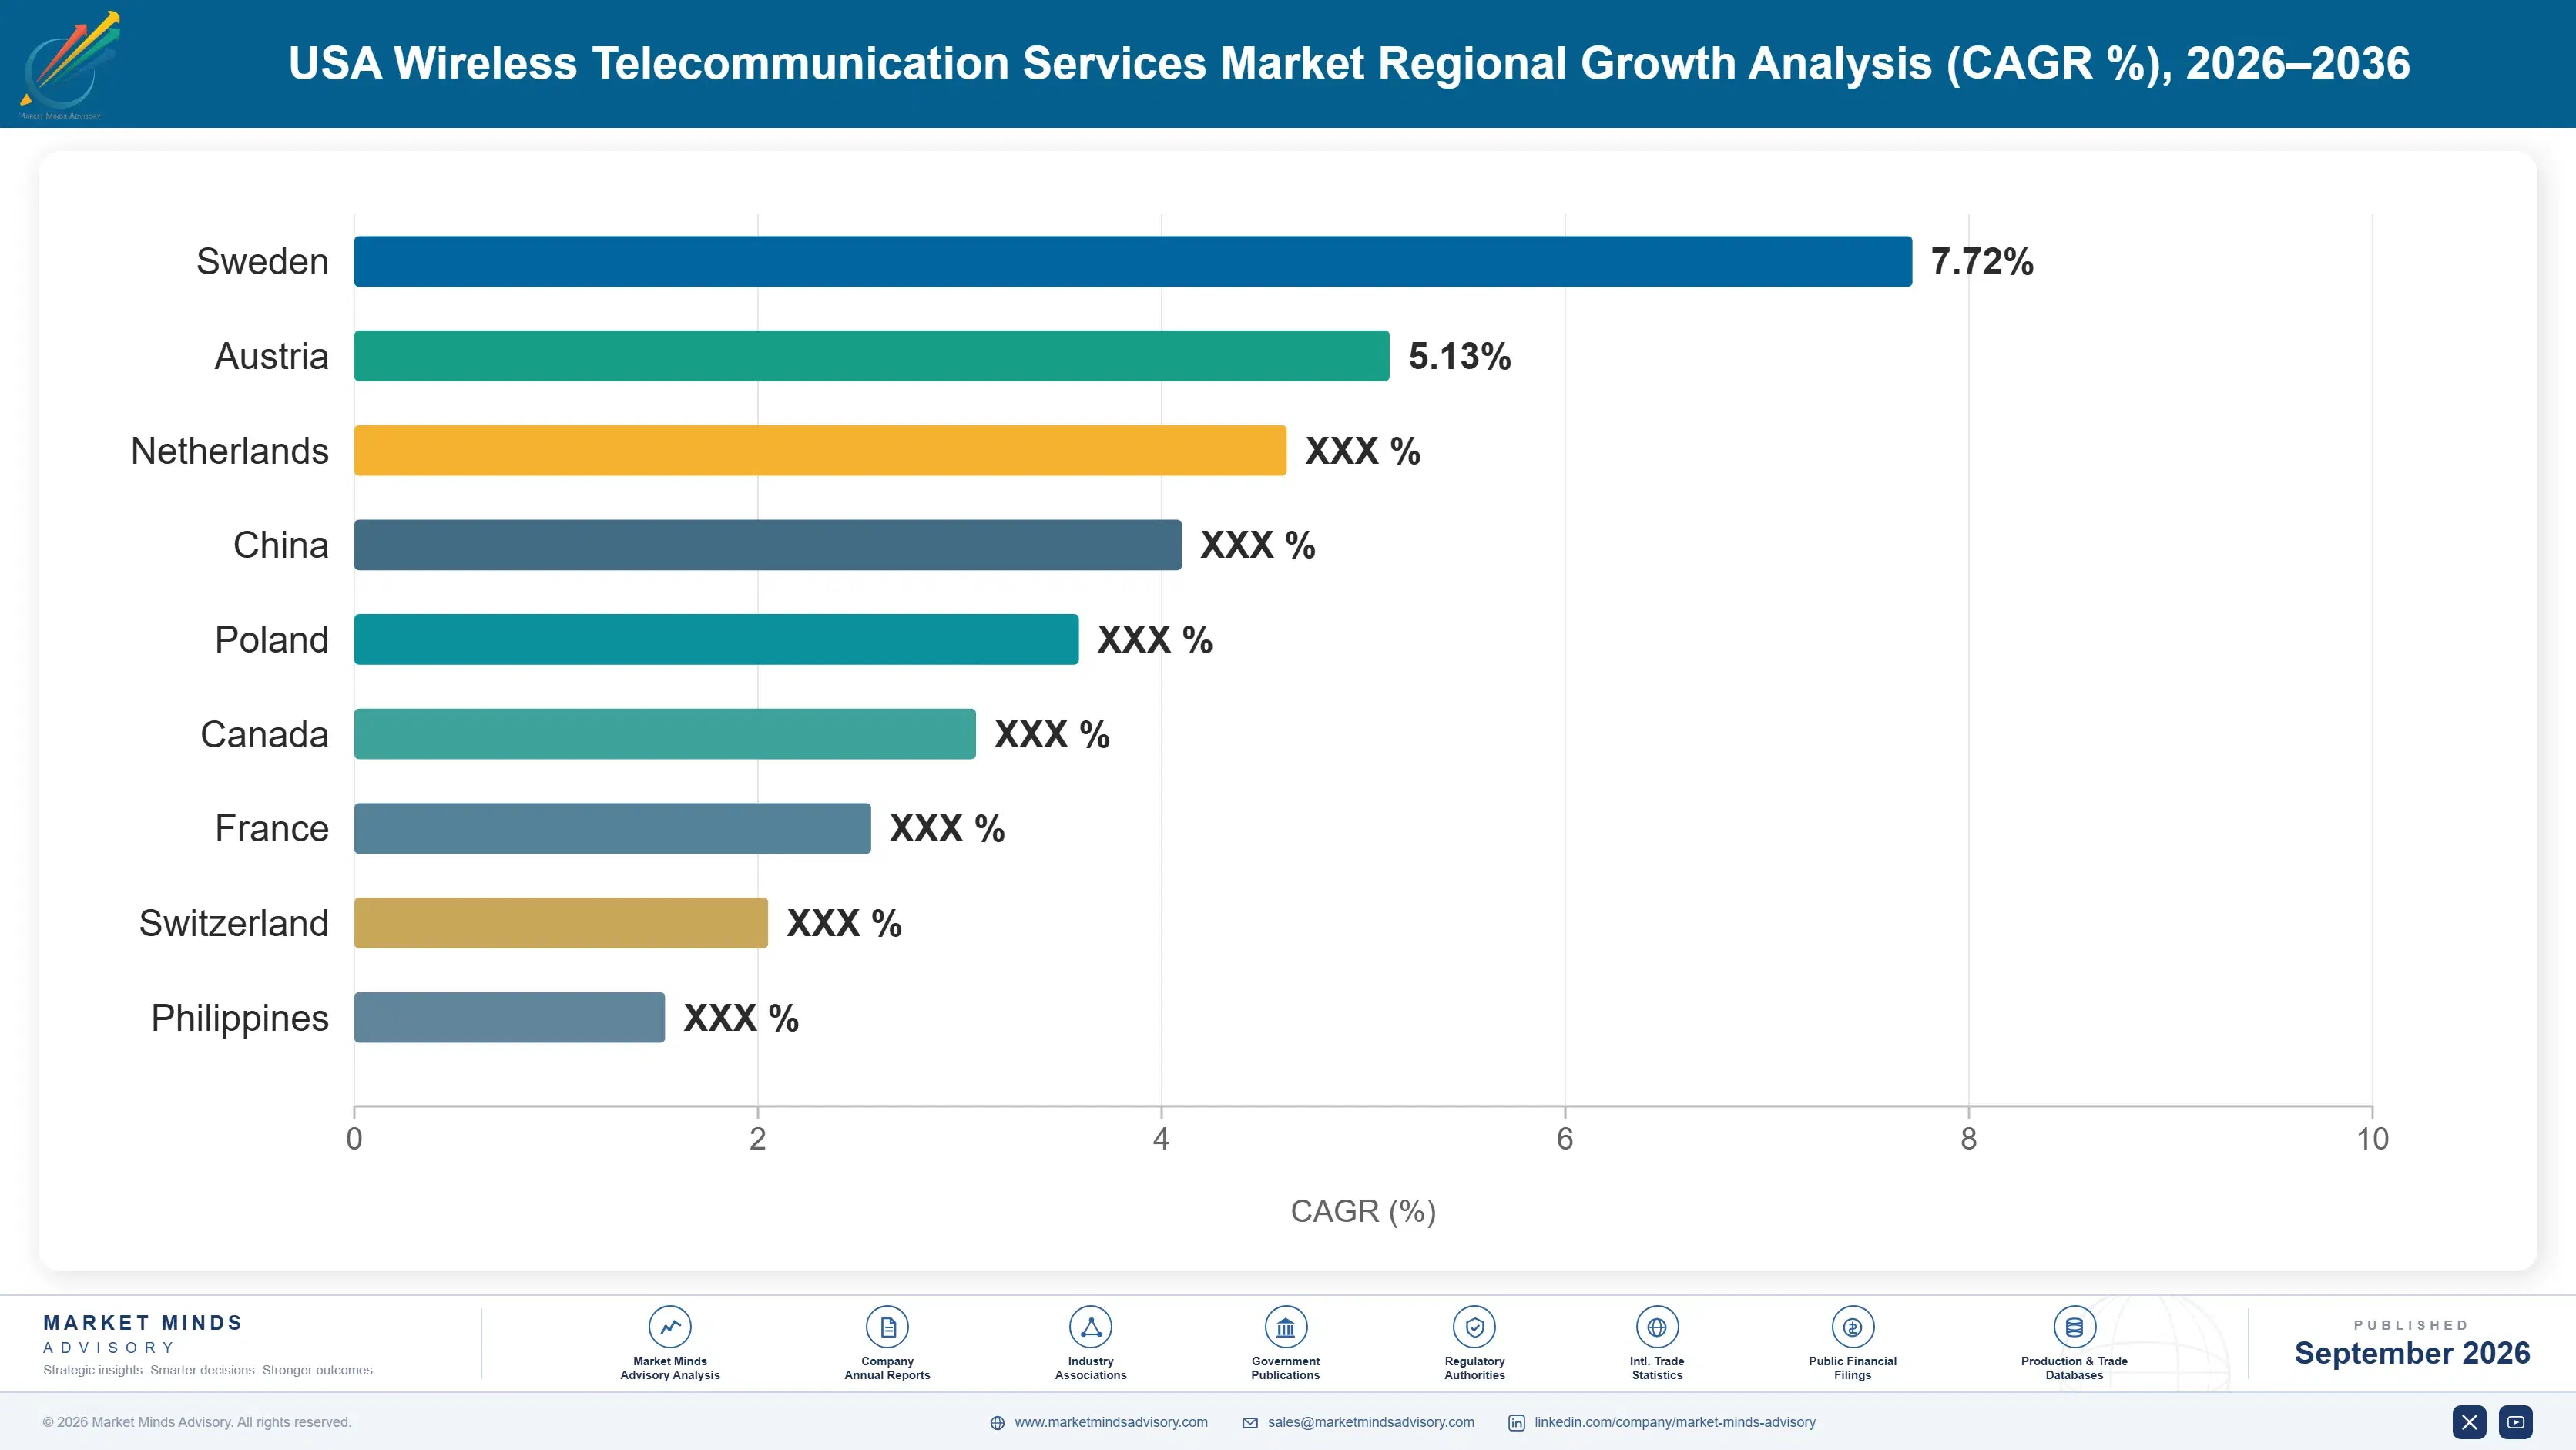
united-states-wireless-telecommunication-services--country-cagr-analysis-1790006657449

Where Carriers Can Still Grow

Four commercial moves matter in a market where subscriber growth has ended and pricing power has not recovered. Each accepts the same premise: selling more mobile connectivity to more people is no longer available, so growth must come from products priced on a different basis entirely. Selling more connectivity to more people is finished.

Market Fixed Wireless At Cell Level Not Nationally

Spare radio capacity exists in specific cells, and broadband competition is weakest in different ones, so national campaigns waste spend on households the network cannot serve. Carriers marketing at cell level convert 2.7 times more addressable households per marketing dollar and avoid the service quality complaints that follow overselling a congested site. The operational work is unfamiliar, requiring capacity data to drive marketing decisions in near real time, and it is the difference between fixed wireless as a growth engine and fixed wireless as a support problem. Capacity data has to drive marketing in near real time.
Market Impact: Converts 2.7 times more addressable households per dollar

Bundle Convergence For Churn Rather Than Revenue

Attaching home broadband to mobile raises household revenue modestly and halves churn against a 0.9% monthly base, which is worth far more given acquisition costs running into hundreds of dollars per subscriber. Carriers pricing the bundle for retention rather than for incremental revenue see lifetime value rise 30% to 45% even where monthly billing barely moves. The instinct to price the bundle upward is exactly wrong here, because the entire commercial value sits in the customer staying rather than in what they pay each month. Retention carries the entire commercial value here.
Market Impact: Raises customer lifetime value by 30% to 45%

Sell Managed Connectivity Not Raw Machine Lines

Machine connections earning under two dollars monthly do not justify the operational cost of supporting them, and adding them in volume flatters subscriber counts while diluting revenue quality. Offerings that bundle connectivity with device management, security, and data services earn 6 to 9 times more per connection and attach to enterprise budgets rather than to telecommunications procurement. The capability required is closer to enterprise software than to network operations, which is why carriers have generally acquired it rather than built it themselves. Carriers have generally acquired the capability rather than building it.
Market Impact: Earns 6 to 9 times more per connection

Price Priority Access Rather Than Data Allowance

Unlimited plans cannot be withdrawn, but network behaviour during congestion can be sold. Premium tiers offering priority access when cells are loaded monetise a quality difference subscribers actually notice, without any return to metered pricing that competitors would immediately undercut. Carriers with clearly differentiated priority tiers report 18% to 26% higher revenue per user in those cohorts. The approach works only where congestion is genuine, which means it monetises exactly the dense urban capacity that costs the most to build. It monetises exactly the dense urban capacity that cost most to build.
Market Impact: Lifts revenue per user by 18% to 26%

Who Controls the Margin Pool

Concentration is close to total. Five participants hold 96% of service revenue, measured consistently on that basis across all participants, and only three of them own the radio networks that carry every connection in the market. The gap between the leading three and everyone else is a matter of asset ownership rather than competitive performance, since resellers operate on the far side of that boundary and always will. No fourth network is in prospect.
Competition currently turns on three things: network quality where it is genuinely noticeable, convergence bundling that reduces churn, and pricing at the value end where cable resellers and prepaid brands compete hardest. Headline price competition has been restrained among the three network owners, and considerably less restrained among everyone reselling their capacity. Resellers price aggressively because they carry no network cost.

Pressure comes from two directions at once. Cable operators reselling mobile alongside broadband have taken meaningful subscriber share without building any network. Meanwhile fixed wireless has carriers attacking cable broadband in return. Rankings will shift toward whoever converts spare radio capacity into broadband households fastest, since that is the only genuinely incremental revenue available.
united-states-wireless-telecommunication-services--company-positioning-matrix-1790006657975

Competitive Moat and Risk Dimensions

T-MOBILE US

Moat: Mid-Band Spectrum Depth Advantage

A deeper mid-band spectrum position than either competitor provides the spare capacity that fixed wireless requires, which is why the company converted that advantage into broadband subscribers faster than anyone else. Spectrum depth is not replicable in any reasonable timeframe, since the relevant licences are already allocated and further auctions are neither scheduled nor certain.
T-MOBILE US

Risk: Capacity Sold To Households

Every fixed wireless household consumes capacity that mobile subscribers may later need, and the crossover point is difficult to forecast because household broadband consumption grows faster than mobile does. Managing that trade requires withdrawing service from cells or degrading it, and both options carry commercial consequences the company has not yet had to face at scale.
VERIZON

Moat: Enterprise And Government Relationships

Long-established enterprise and public sector accounts provide access to private network, dedicated slice, and managed connectivity revenue that consumer-focused competitors reach far less easily. These relationships sell capability rather than capacity, which is the one part of this market where pricing power still exists in any meaningful form.
VERIZON

Risk: Consumer Growth Momentum Weak

Consumer postpaid net additions have trailed the strongest competitor for several years, and in a market where growth comes entirely from switching, losing that contest compounds. Recovering position requires either price action that damages the revenue base or network differentiation that subscribers can actually perceive, and neither has worked reliably so far.

Players Tracked

Prominent Players

Verizon
AT&T
T-Mobile US
Comcast
Charter Communications

Other Key Players

EchoStar
UScellular
Altice USA
Consumer Cellular
Google Fi
Ting
Twigby
Red Pocket
Lycamobile
TruConnect
Q Link Wireless
Tracfone
Gen Mobile
PureTalk
Patriot Mobile

Recent Developments

FEBRUARY 2026

T-Mobile US Expands Fixed Wireless Availability Using Cell Level Targeting

T-Mobile US extended fixed wireless availability into additional markets using capacity data to determine eligibility cell by cell rather than by postal region, addressing the service quality problems that follow selling broadband into already congested sites. Eligibility is recalculated as traffic patterns change across the network.
Signal: Capacity data now drives marketing decisions directly, which is genuinely unfamiliar operational work for consumer carriers.
OCTOBER 2025

Verizon Signs Wholesale Access Agreement With Regional Cable Operator

Verizon entered a multi-year wholesale access agreement supplying network capacity to a regional cable operator launching mobile service, adding wholesale revenue while enabling a competitor in the consumer segment the carrier serves directly. Terms run several years and include volume commitments on both sides. Both parties disclosed the arrangement publicly.
Signal: Wholesale revenue and direct consumer competition arrive in the same agreement, which carriers now accept knowingly.
JUNE 2025

EchoStar Completes Spectrum Licence Sale To National Carrier

EchoStar completed a sale of spectrum licences to a national carrier, transferring capacity rather than any operating business, and reducing the number of participants holding spectrum sufficient to operate an independent nationwide network. No operating business or subscriber base transferred alongside the licences. Regulatory review preceded the completion.
Signal: Spectrum keeps consolidating toward the three network owners, which narrows any remaining prospect of a fourth.

What Carrying The Traffic Costs

Three inputs dominate carrier cost of service. Network operations, backhaul, and site energy run 24% to 30% of cost of goods sold, tower and site lease obligations take 18% to 24%, and device subsidy carried against subscriber contracts adds a further 22% to 28%. Tower leases are payable to a few independent site owners, which concentrates that exposure narrowly.
Electricity costs at network sites rose materially through 2024 and 2025, and EIA electricity data documents the retail price movement behind it across the relevant commercial rate classes. Several carriers described the resulting operating cost pressure in their annual reports for those years. Site energy is difficult to hedge because consumption is distributed across tens of thousands of locations under different utility tariffs entirely. Distributed site consumption is impractical to hedge.

The competitive disadvantage mechanism runs through spectrum depth rather than through operating cost. A carrier with less mid-band spectrum carries more sites to deliver the same capacity, which raises lease, energy, and backhaul cost per unit of traffic permanently. Exposure varies by participant type. Network owners carry the full cost structure. Resellers carry none of it, buying capacity at wholesale rates.
united-states-wireless-telecommunication-services--cost-volatility-analysis-1790006658172

Deploy Additional Spectrum Rather Than Additional Sites

Adding capacity through spectrum on existing sites avoids the lease, energy, and backhaul cost that a new site carries permanently. Carriers with spectrum depth therefore operate at a lower cost per unit of traffic indefinitely, and the advantage compounds as traffic grows. It is the clearest reason spectrum position matters more than any operational efficiency programme.

Negotiate Master Lease Agreements Across Site Portfolios

Site owners hold a concentrated position and price accordingly against individual renewals. Portfolio-level master agreements covering thousands of sites at once change the negotiation entirely, and carriers who consolidated their lease exposure this way report escalator terms materially below what site by site renewal produced previously. Concentration among site owners makes individual renewals expensive.

Move Device Subsidy Into Structured Instalment Financing

Carrying handset subsidy against service revenue obscures the underlying economics and consumes working capital. Structured instalment arrangements separate the device from the service commercially, which clarifies margin, reduces balance sheet exposure, and removes an accounting distortion that made service profitability difficult to read for years. Service profitability became readable again once the two were separated.

Portfolio Architecture for Margin Defence

Margin architecture follows whether the revenue uses capacity that already exists. Wholesale access sold to resellers earns least, since it prices capacity directly and the buyer competes with the seller. Postpaid consumer service earns solidly but statically. Fixed wireless earns most on an incremental basis, because the capacity is already built and the only additional cost is customer premises equipment and support. Incremental cost, not headline price, sets the ladder.
The tension between volume and premium is unusually clear here. Machine connections add lines at under two dollars monthly against real support cost, so volume growth in that segment actively dilutes revenue quality. Enterprise managed connectivity and private networks earn several times more per connection but scale with sales capability and deployment engineering rather than with network reach.

High-value pools concentrate where capability rather than capacity is being sold: private networks at industrial sites, dedicated slices for public safety and healthcare, and managed connectivity bundling device and security services. These share a buyer purchasing an outcome rather than a data allowance. Everywhere else, the product is bytes, the competitor sells identical bytes, and pricing behaves accordingly. Byte pricing converges toward the cheapest participant every time.

Volume / Commodity-Adjacent

Wholesale access, prepaid consumer service, and raw machine connectivity. Capacity is priced directly, buyers frequently compete with the seller, and per-connection revenue is low. The eleven-point range reflects wide variation in whether the participant owns the network or resells it.
Gross Margin: 31% to 42%

Premium / Certified

Postpaid consumer service and fixed wireless access broadband. Both use built capacity, and fixed wireless in particular earns against an asset already funded. The nine-point range separates carriers with mid-band spectrum depth from those carrying more sites for the same delivered capacity.
Gross Margin: 52% to 61%

Sustainability / Regulatory / Next-Generation

Private networks, dedicated network slices, and managed enterprise connectivity with device and security services. Capability rather than capacity is sold, and pricing reflects that difference. The eleven-point range reflects how differently carriers structure integration and managed service scope.
Gross Margin: 63% to 74%
united-states-wireless-telecommunication-services--portfolio-architecture-1790006658673

High-value Sub-segments and Strategic Watch-out

Fixed Wireless Access Broadband

Fastest growth at 5.1% and the strongest incremental economics available, since capacity is already built and paid for. Reach is limited by which cells have spare throughput rather than by household demand. The ten-point range reflects differences in spectrum depth and customer premises equipment cost.
Gross Margin: 58% to 68%

Enterprise Private Network Services

High value with steady growth, appearing in roughly 29% of new enterprise contracts and selling capability rather than capacity. Sales cycles are long and the engineering is unfamiliar to consumer-built organisations. Pricing power here is the strongest anywhere in the market. Deployment engineering is the constraint.
Gross Margin: 64% to 73%

Postpaid Consumer Mobile Service

The revenue core, generating most of the market against churn near 0.9% monthly and revenue per user held near USD 49. Growth trails the market rate and comes entirely from switching. Convergence bundling is the main defensive tool available to participants. Switching produces no aggregate growth.
Gross Margin: 50% to 59%

Raw Machine Connectivity Lines

The strategic watch-out. Connections earning under two dollars monthly carry real support cost and flatter subscriber counts while diluting revenue quality. The thirteen-point range reflects the gap between managed offerings and bare connectivity sold on price alone into competitive tenders. Support cost is entirely real.
Gross Margin: 26% to 39%

How This Revenue Holds Together

This is among the most durable subscription revenue in any industry, and its durability is entirely defensive. Monthly postpaid churn near 0.9% means a subscriber stays roughly nine years on average, which sounds like loyalty and is closer to inertia reinforced by device instalment balances, family plan entanglement, and the genuine irritation of switching. Growth within an account comes from added lines rather than from higher pricing.
Adoption depth varies sharply by household type. Converged households taking mobile and broadband together churn at roughly half the mobile-only rate, and multi-line family accounts are stickier still because switching requires coordinating several people. Single-line prepaid customers behave completely differently, moving on headline price with little friction, which is why the value end of the market is where price competition actually happens.

The buyer relationship has changed more than carriers acknowledge. Consumers once chose on coverage, which was genuinely differentiated. Coverage differences are now imperceptible to most subscribers in most places, so the decision has moved to price, bundle composition, and device financing terms. Carriers still advertising network superiority are making an argument their customers can no longer verify from experience.
united-states-wireless-telecommunication-services--end-use-penetration-index-1790006659212

Where This Market Rewards

These are among the four positions where our research anticipates prominent divergence between winners and laggards over the coming forecast period. Each is grounded in the demand model, the regulatory perimeter, and the announced capacity pipeline.
01 / SPARE CAPACITY MONETISATION

Fixed wireless is the only genuinely incremental revenue

Radio capacity built for mobile traffic already exists and is already funded, so selling it to households as broadband earns revenue at very low marginal cost, which no other product in this market can claim. Subscribers reached 14.2 million and the segment grows at 5.1% against a market rate of 3.4%. The constraint is geographic rather than commercial, and carriers marketing at cell level convert 2.7 times more addressable households per dollar spent, which is a marketing discipline carriers have never needed before.
02 / RETENTION OVER PRICING

Bundle for churn, not for incremental monthly revenue

Attaching home broadband to mobile halves churn against a 0.9% monthly base, and with acquisition costing hundreds of dollars per subscriber that retention is worth far more than any price increase the bundle could carry. Carriers pricing convergence for retention rather than revenue see lifetime value rise 30% to 45% while monthly billing barely moves. The instinct to price the bundle upward destroys exactly the advantage it was assembled to create, and competitors reprice against it immediately anyway, and quickly.
03 / CONNECTION QUALITY DISCIPLINE

Line counts are not a growth measure any more

Machine connections earning under two dollars monthly against roughly USD 49 for a consumer phone expand subscriber counts far faster than they expand revenue, and investors have largely stopped accepting aggregate connection figures as evidence of growth. Managed offerings bundling device management, security, and data services earn 6 to 9 times more per connection. That capability sits closer to enterprise software than to network operations, which is why it is usually acquired rather than developed internally by most carriers here.
04 / CAPABILITY PRICING ACCESS

Private networks restore pricing power capacity lost

Private wireless at industrial sites, ports, hospitals, and logistics hubs sells integration, spectrum, and managed operation rather than a data allowance, and roughly 29% of new enterprise contracts now include such a component. This is the one place in American wireless where pricing still reflects value delivered rather than competitive matching. Sales cycles are long and the engineering unfamiliar, and the alternative is competing on bytes indefinitely, against competitors selling identical bytes at declining prices for the foreseeable future at all.

Engagement Snapshot From the Field

A live engagement with an industry participant carrying material or product regulatory and market exposure ahead of a defining policy shift, showing how our research translates into a defensible multi-year portfolio strategy.
MARKET MINDS ADVISORY · CLIENT ENGAGEMENT SUMMARY
USA Wireless Telecommunication Services Producer Strategic Portfolio Review and Transition Roadmap 2026·Investment Scenario on USA Wireless Telecommunication Services Exposure Evaluation 2025-26
CLIENT PROFILE
A regional cable operator serving 2.7 million broadband households across nine states, with annual revenue above USD 4.3 billion (client-reported, unverified by MMA). The company had watched national cable competitors add mobile subscribers profitably through wholesale arrangements and was evaluating whether to follow, build a hybrid network, or remain broadband only. Wholesale terms available to the company were untested at that point.
STRATEGIC CHALLENGE
Broadband subscriber losses to fixed wireless had accelerated for six consecutive quarters, concentrated in exactly the suburban markets where the carrier network had spare capacity. Management could not tell whether launching mobile would defend broadband or simply add a low-margin business alongside a declining one. Wholesale terms available were untested.
MMA APPROACH
MMA modelled broadband retention effects of a mobile attachment using observed convergence churn data, tested wholesale economics against three carrier term sheets, and mapped fixed wireless competitive intensity cell by cell across the footprint to identify where losses were actually originating and where they were likely to continue. Wireless offload potential was measured across the served footprint.
KEY FINDINGS
  1. Broadband losses concentrated in 14% of the footprint, all of it in cells where a national carrier held spare mid-band capacity that could serve fixed wireless customers.
  2. Households taking both broadband and mobile from a cable operator churned at roughly 47% the rate of broadband-only households across comparable regional operators studied.
  3. Wholesale terms from the three carriers varied by more than 40% on effective cost per gigabyte, and the cheapest carrier held the weakest network position within the footprint.
  4. Offloading mobile traffic onto existing wireless access points would reduce wholesale volume by an estimated 62%, which materially changed the economics of every term sheet reviewed.
CLIENT PROFILE
A regional cable operator serving 2.7 million broadband households across nine states, with annual revenue above USD 4.3 billion (client-reported, unverified by MMA). The company had watched national cable competitors add mobile subscribers profitably through wholesale arrangements and was evaluating whether to follow, build a hybrid network, or remain broadband only. Wholesale terms available to the company were untested at that point.
STRATEGIC CHALLENGE
Broadband subscriber losses to fixed wireless had accelerated for six consecutive quarters, concentrated in exactly the suburban markets where the carrier network had spare capacity. Management could not tell whether launching mobile would defend broadband or simply add a low-margin business alongside a declining one. Wholesale terms available were untested.
MMA APPROACH
MMA modelled broadband retention effects of a mobile attachment using observed convergence churn data, tested wholesale economics against three carrier term sheets, and mapped fixed wireless competitive intensity cell by cell across the footprint to identify where losses were actually originating and where they were likely to continue. Wireless offload potential was measured across the served footprint.
KEY FINDINGS
  1. Broadband losses concentrated in 14% of the footprint, all of it in cells where a national carrier held spare mid-band capacity that could serve fixed wireless customers.
  2. Households taking both broadband and mobile from a cable operator churned at roughly 47% the rate of broadband-only households across comparable regional operators studied.
  3. Wholesale terms from the three carriers varied by more than 40% on effective cost per gigabyte, and the cheapest carrier held the weakest network position within the footprint.
  4. Offloading mobile traffic onto existing wireless access points would reduce wholesale volume by an estimated 62%, which materially changed the economics of every term sheet reviewed.
RECOMMENDED STRATEGY
Phase 1: Phase one: launch mobile service on wholesale terms in the 14% of the footprint where broadband losses are concentrated, before extending anywhere else. Phase 2: Phase two: deploy wireless access point offload across the served footprint, renegotiating wholesale volume commitments once actual offload rates are demonstrated in operation. Phase 3: Phase three: price the converged bundle explicitly for broadband retention rather than for mobile margin, accepting thin mobile economics as the cost of defence.
OUTCOME
Fourteen months after launch, broadband churn in the targeted markets fell by 38% and net broadband losses reversed in six of nine states (client-reported, unverified by MMA). Mobile margins remained thin as expected. Measured offload reached 58%, close to the model, and supported a renegotiated wholesale agreement in the second year.

Frequently Asked Questions

Foundational context covering the market sizes, CAGR, scope, country, region and competition that inform every finding below. This section is provided to cover basics and most often pre-purchase conversations, answered from the MMA Primary Research Dataset.

What is the current size of the USA Wireless Telecommunication Services Market?

The market was worth USD 198.6 billion in 2025 and reaches USD 205.4 billion in 2026. Value covers wireless service revenue only, excluding device equipment sales.

How large will the USA Wireless Telecommunication Services Market be by 2036?

MMA forecasts USD 286.9 billion by 2036, an increase of USD 81.5 billion across the forecast period. That represents 1.40 times the 2026 base of USD 205.4 billion.

What is the CAGR for the USA Wireless Telecommunication Services Market 2026 to 2036?

The base case compound annual growth rate is 3.4%, with a bull case at 4.6% and a bear case at 2.2%. Historical growth from 2020 to 2025 ran at 2.6%.

Which segment is growing fastest?

Fixed wireless access broadband grows at 5.1%, half again the market rate of 3.4%. It monetises radio capacity that was already built and already paid for.

Who are the major companies in the USA Wireless Telecommunication Services Market?

Verizon, AT&T, T-Mobile US, Comcast, and Charter Communications lead, holding 96% of service revenue between them. Only three of those five actually own radio networks.

Which country is growing fastest?

Scope is limited to the United States, so growth is compared within it. Texas leads at 4.9%, driven by household formation and fixed wireless availability in suburban markets.

Report Segmentation Architecture

The full report scope spans multiple orthogonal segmentation dimensions, with cross-tabulated demand data provided for each dimension pair. Coverage extends further to regional breakdowns, trend trajectories, and the competitive detail needed to support segment-level decision-making.

By Service Type

  • Postpaid Mobile Consumer Service
  • Prepaid Mobile Consumer Service
  • Business and Enterprise Mobility
  • Fixed Wireless Access Broadband
  • Machine and Internet of Things Connectivity
  • Wholesale and Virtual Network Access

By End-Use Industry

  • Residential Consumer Households
  • Small and Medium Business
  • Large Enterprise and Corporate
  • Government and Public Safety
  • Transportation and Logistics
  • Utilities and Industrial Operations

By Commercial Dimension

  • Direct Carrier Retail
  • Authorised Dealer Distribution
  • Cable Operator Reseller Channel
  • Virtual Network Operator Wholesale
  • Enterprise Direct Sales
  • Device Manufacturer Embedded Connectivity

By Region

  • North America
  • East Asia
  • Western Europe
  • South Asia and Pacific
  • Latin America
  • Middle East and Africa
  • Eastern Europe

Scope, Methodology, and Coverage

Every figure in this report is reproducible from documented input assumptions. The scope below maps the historical period, the forecast horizon, the segmentation dimensions, and the countries covered, alongside the underlying primary and qualitative methodology.
Historical Period
2020 to 2025
Forecast Period
2026 to 2036
Base Year
2025 (USD billions; MMA Primary Research Dataset, September 2026)
Market Definition
This market covers wireless telecommunication service revenue generated in the United States, including postpaid and prepaid consumer mobile service, business and enterprise mobility, fixed wireless access broadband delivered over mobile networks, machine and internet of things connectivity, and wholesale access sold to mobile virtual network operators. It excludes handset and device equipment sales, network infrastructure equipment, tower leasing revenue, and satellite communication services.
Quantitative Units
USD billions, wireless service revenue
Segmentation Dimensions
Service type, end-use industry, commercial dimension, supply origin
Regions Covered
North America, East Asia, Western Europe, South Asia and Pacific, Latin America, Middle East and Africa, Eastern Europe
Countries Covered
United States; supply origin analysis covers Canada, Mexico, China, Japan, South Korea, Taiwan, Vietnam, India, Australia, Sweden, Finland, Germany, France, United Kingdom, Netherlands, Spain, Brazil, Israel, Egypt, South Africa, Poland, Romania, Ukraine
Key Companies Profiled
Verizon, AT&T, T-Mobile US, Comcast, Charter Communications, EchoStar, UScellular, Altice USA, Consumer Cellular, Google Fi, Ting, Twigby, Red Pocket, Lycamobile, TruConnect, Q Link Wireless, Tracfone, Gen Mobile, PureTalk, Patriot Mobile
Quantitative Methodology
Primary survey, n=3,800 respondents, Q4 2025, six countries; demand-side model with trade association cross-validation
Qualitative Methodology
47 expert interviews, Q4 2025; applied to validate demand model assumptions, identify emerging dynamics, and assess competitive positioning
Report Format
PDF and XLSX data workbook (Word format preview document)
Publisher
Market Minds Advisory
Report Code
MMA-2026-TEC-441
Published
September 2026
Contact
sales@marketmindsadvisory.com | www.marketmindsadvisory.com

Purchase the full USA Wireless Telecommunication Services Market Report (2026 to 2036).

The full report sizes United States wireless service revenue across six service types with forecasts to 2036 under base, bull, and bear cases. It examines why data volume rose roughly fortyfold while revenue barely moved, what fixed wireless changes about carrier economics, and why machine connection counts mislead as a growth measure. Competitive analysis covers twenty participants evaluated consistently on service revenue, with detailed treatment of the network owner and reseller boundary and of convergence bundling economics. Cost structure, margin architecture by service type, and the supply origin map behind the market are analysed in full. Primary research includes 3,800 survey responses and 47 expert interviews.
Six service types sized and forecast separately
Twenty participants evaluated on service revenue consistently
Supply origin mapping across seven global geographies
Margin architecture by service type and network ownership
Fixed wireless capacity constraint analysis at cell level
Convergence bundling churn and lifetime value benchmarks

Built For The People Who Decide

From boardroom strategy to bench-side execution, this report is read cover-to-cover by leaders shaping the next decade of their industry, turning demand scenarios, market dynamics and valuation benchmarks into decisions.
CXOs/ Presidents/ VPs/ Managers
M&A and Corporate Development
Strategy Teams and R&D Heads
Procurement and Product Directors
Regulatory and Compliance Leaders
Investor Relations and Equity Analysts