Market Minds Advisory
Demand for Virtual Event Platforms in USA

Demand for Virtual Event Platforms in USA: Demand for Virtual Event Platforms in USA: Credit Finishes Sessions, Attribution Defends Budgets, and Everything Else Is Negotiable

About 76% of attendees finish a session carrying professional credit against 29% who finish one without, which tells you what actually holds an American audience in place for a full hour.

Lead Analyst

Published

September 2026

Make Smarter Decisions with Customized Research Insights

Request a free sample report and evaluate market opportunities, growth trends, and competitive dynamics relevant to your business needs.

2025 MARKET VALUE$5.9BMarket Size 2025
2036 FORECAST VALUE$14.0BBase Case , 2026 to 2036
CAGR 2026 TO 20368.2 %Bull 9.4% / Bear 7.0%
INCREMENTAL OPPORTUNITY$7.7BNet 10- year value creation
EXPANSION MULTIPLE2.20x2036 value over 2026 base
Strategic Levers
M&A Pipeline
Regional Outlook
Country Rankings
Competitive Intelligence
Segmental Deep-dive
Call-Us : 91 93563 13602

Executive Snapshot and Market Trajectory.

Two completion figures explain this market. Sessions carrying professional credit finish at about 76%; sessions carrying none finish at 29%. Attention is not something a platform produces. It is something a credential requirement compels, and American professions require a great deal of it. Attention is compelled here, not produced.
Credentialing and continuing education delivery grows at 12.3%, half again the market rate of 8.2%, on licensure requirements that nobody can satisfy any other way. Pipeline attribution tooling follows at 10.8%. North America takes 38% of value, because American marketing organisations reallocate budget quarterly and roughly 62% of programmes face that review every three months. Hybrid conference extension at 8.4% attaches to physical events that recovered completely and keep growing.
Concentration sits near 31% across the top five on measured platform subscription and service revenue. The number that decides renewals is attribution coverage at about 44%, since a programme that cannot trace an attendee into an opportunity is defending itself with session counts against channels that produce pipeline arithmetic. Session completion outside credentialed content sits at just 29%, which nobody ever puts in a case study.
Market Definition
This market covers software platforms used to deliver, register, credential and measure online and hybrid professional events, spanning credentialing and continuing education delivery, pipeline attribution and measurement tooling, webinar and demand generation programmes, hybrid conference extension, internal communications and training events, and virtual trade show and exhibition platforms. Revenue is measured as platform subscription, usage and attributable service value at supplier level, with the United States treated as the analytical centre within a global sizing frame. General video conferencing for internal meetings, physical venue and production services, learning management systems sold separately, and consumer streaming platforms are excluded.
Base Year Value
$5.9B in 2025 (MMA Primary Research Dataset, September 2026)
Forecast Period
2026 to 2036, eleven discrete annual values
CAGR
8.2% base case. Bull 9.4%. Bear 7.0%.
Fastest Growth Segment
Credentialing and Continuing Education Delivery: 12.3% CAGR
Fastest Growth Country
India: 11.2% CAGR
Fastest Growth Region
South Asia and Pacific: 10.4% CAGR
Largest Region
North America: 38% of 2025 global value
Market Leaders
Zoom Communications, Cvent, ON24, RingCentral and Bizzabo lead on measured platform subscription and service revenue. Source: MMA Primary Research Dataset, July 2026.
Primary Survey
n=3,800 procurement and R&D decision-makers, Q4 2025, six countries
Methodology
Demand-side build-up, cross-validated against public data, 47 expert interviews

Demand for Virtual Event Platforms in USA Market Forecast Scenarios

united-states-virtual-event-platforms-market-size-forecast-scenario-1788453076947
Growth ran at 6.8% from 2020 to 2025 and the American figure conceals the sharpest boom and correction anywhere. Virtual conference platforms raised more capital here than every other market combined, against 2021 demand that reversed once travel resumed, and several were wound down. What survived was continuing education delivery, which never depended on travel restrictions, and webinar programmes funded from marketing budgets.
The base case at 8.2% rests on three mechanisms. Professional licensure across medicine, law, accountancy, engineering and financial services requires documented continuing education that virtual delivery satisfies more cheaply than any alternative, and completion runs about 76% because the credit compels it. Attribution tooling grows because roughly 62% of American marketing programmes face quarterly reallocation review. Third, hybrid extension attaches platform spend to physical events that recovered fully and keep growing.
The bull case at 9.4% assumes attribution coverage improves beyond the roughly 44% of attendee records currently traceable into opportunities, which would let marketing defend this spend against paid channels on their own terms. The bear case at 7.0% is that session completion near 29% outside credentialed content becomes the number buyers report, at which point programme volumes fall faster than credentialing growth replaces them.

Credit Holds Attention, Nothing Else Does

Put the two completion numbers next to each other and the market explains itself. A session carrying professional credit finishes at around 76%. A session carrying none finishes at 29%. No platform feature accounts for that gap and no production quality closes it. What holds an American audience through an hour is a licensure requirement, and American professions impose many across medicine, law, accountancy and engineering.
TOP FIVE CONCENTRATION31%Fragmented across communication vendors and event platform specialists
CREDENTIAL COMPLETION RATE76%Registrants finishing sessions that carry professional credit requirements
QUARTERLY BUDGET REALLOCATION62%Marketing programmes reviewed against measured pipeline every quarter
COST PER QUALIFIED CONTACTUSD 118Spend attributable to each contact reaching sales acceptance
SESSION COMPLETION SHARE29%Attendees remaining through a full non-credit marketing session
ATTRIBUTION COVERAGE44%Attendee records traceable through into a pipeline opportunity
The other half of this market answers to a budget review rather than to an audience. Roughly 62% of American marketing programmes are reallocated quarterly against measured pipeline, a discipline European organisations apply far less aggressively, which means a webinar programme must match paid search numbers every ninety days. Attribution coverage near 44% is the constraint, since an untraceable attendee cannot appear in that comparison at all.
Cost per qualified contact around USD 118 is the figure that survives those reviews or does not. It compares directly against content syndication, paid search and outbound calling, and marketing leaders here run that comparison routinely. Platforms unable to produce the number are excluded from the conversation their spend is being judged in, which is a harsher environment than most vendors built for.
"American marketing runs on quarterly reallocation, which is brutal and honest in roughly equal measure. A webinar platform that cannot put a cost per qualified contact next to paid search is not losing an argument. It is not in the room where the argument happens."
Director, Marketing Technology and Professional Education Practice · MMA Technology Practice · September 2026

Market Trends

Credential Requirements Do What Production Quality Cannot

Sessions carrying professional credit finish at about 76% while sessions without finish at 29%, and no platform capability explains that gap because it has nothing to do with the platform. Licensure across medicine, law, accountancy, engineering and financial services obliges practitioners to complete documented education annually, and virtual delivery satisfies it at a fraction of the cost of attending in person. Credentialing delivery grows at 12.3%, faster than anything else here. The requirement rather than the content is what holds the audience. Content quality determines nothing measurable at all once credit is attached.
Market Impact: Completes at 76% of registrations
Quarterly Reallocation Punishes Untraceable Marketing Programmes

Roughly 62% of American marketing programmes are reviewed against measured pipeline every quarter, which is a discipline applied far less aggressively elsewhere and which turns attribution from a reporting nicety into survival. Attendee records traceable into opportunities sit near 44%, so more than half of a programme's output cannot appear in the comparison at all. Attribution tooling grows at 10.8% on that pressure. Vendors without integration into customer relationship systems are excluded from the conversation entirely. Registration and session counts are simply no longer accepted as evidence of anything in these reviews.
Market Impact: Costs around USD 118 per contact

Market Opportunities and Growth Drivers

American Licensure Requires Documented Annual Education

Physicians, attorneys, accountants, engineers and financial advisers all carry continuing education obligations enforced by state boards and professional bodies, with documentation requirements that virtual delivery satisfies more cheaply and more verifiably than conference attendance ever did. The obligation is annual and does not depend on anybody's enthusiasm. Completion runs about 76% because the credit compels finishing rather than because the content is compelling. That combination of mandatory demand and low delivery cost is rare in any software market. State boards audit those records, which makes reporting accuracy a genuine requirement rather than a feature.
Market Impact: Completes at 29% without credit

Pipeline Comparison Is Run Every Ninety Days

American marketing organisations reallocate budget quarterly against measured contribution, and roughly 62% of programmes face that review, which forces a webinar to produce a cost per qualified contact comparable to paid search and content syndication. That figure sits near USD 118 where it can be calculated at all. The discipline is harsher than European practice and it rewards platforms that integrate into customer relationship systems properly. Attribution capability rather than event quality decides which programmes survive a review. European organisations apply this discipline far less aggressively, which is why the same platforms behave differently there.
Market Impact: Traces 44% of attendee records

Market Restraints and Challenges

Non-Credentialed Sessions Lose Most of the Audience

Sessions without a credential requirement are completed by about 29% of attendees, and marketing teams report registrations because that figure is considerably more comfortable to present to anybody. The root cause is that finishing an hour of content requires a reason beyond interest, and interest fades within twenty minutes for most audiences. Commercially this makes non-credentialed programmes expensive per genuine engagement. Vendors mitigate by attaching content to credit where a profession allows it, which is not available in every category. Twenty minutes is roughly where an unincentivised audience starts leaving in real numbers.
Market Impact: Completes at 76% against 29%

Attribution Covers Less Than Half the Audience

Only around 44% of attendee records trace into a pipeline opportunity, because deduplication, consent handling and multi-touch modelling all break down between an event platform and a customer relationship system. The root cause is that these platforms were built to run events rather than to feed marketing systems, and integration was added afterwards. Commercially this leaves programmes defending themselves with session counts during quarterly reviews. Mitigation runs through deeper integration work, which is unglamorous and decides renewals. Integration engineering is unglamorous, invisible in a demonstration and decides more renewals than any feature. Nobody demonstrates it.
Market Impact: Reviews 62% of programmes quarterly
4 additional market trends, 3 additional growth drivers, and 2 additional restraints and challenges are covered in the full report. Contact sales@marketmindsadvisory.com to access the complete intelligence.

Segment CAGR and Growth Architecture

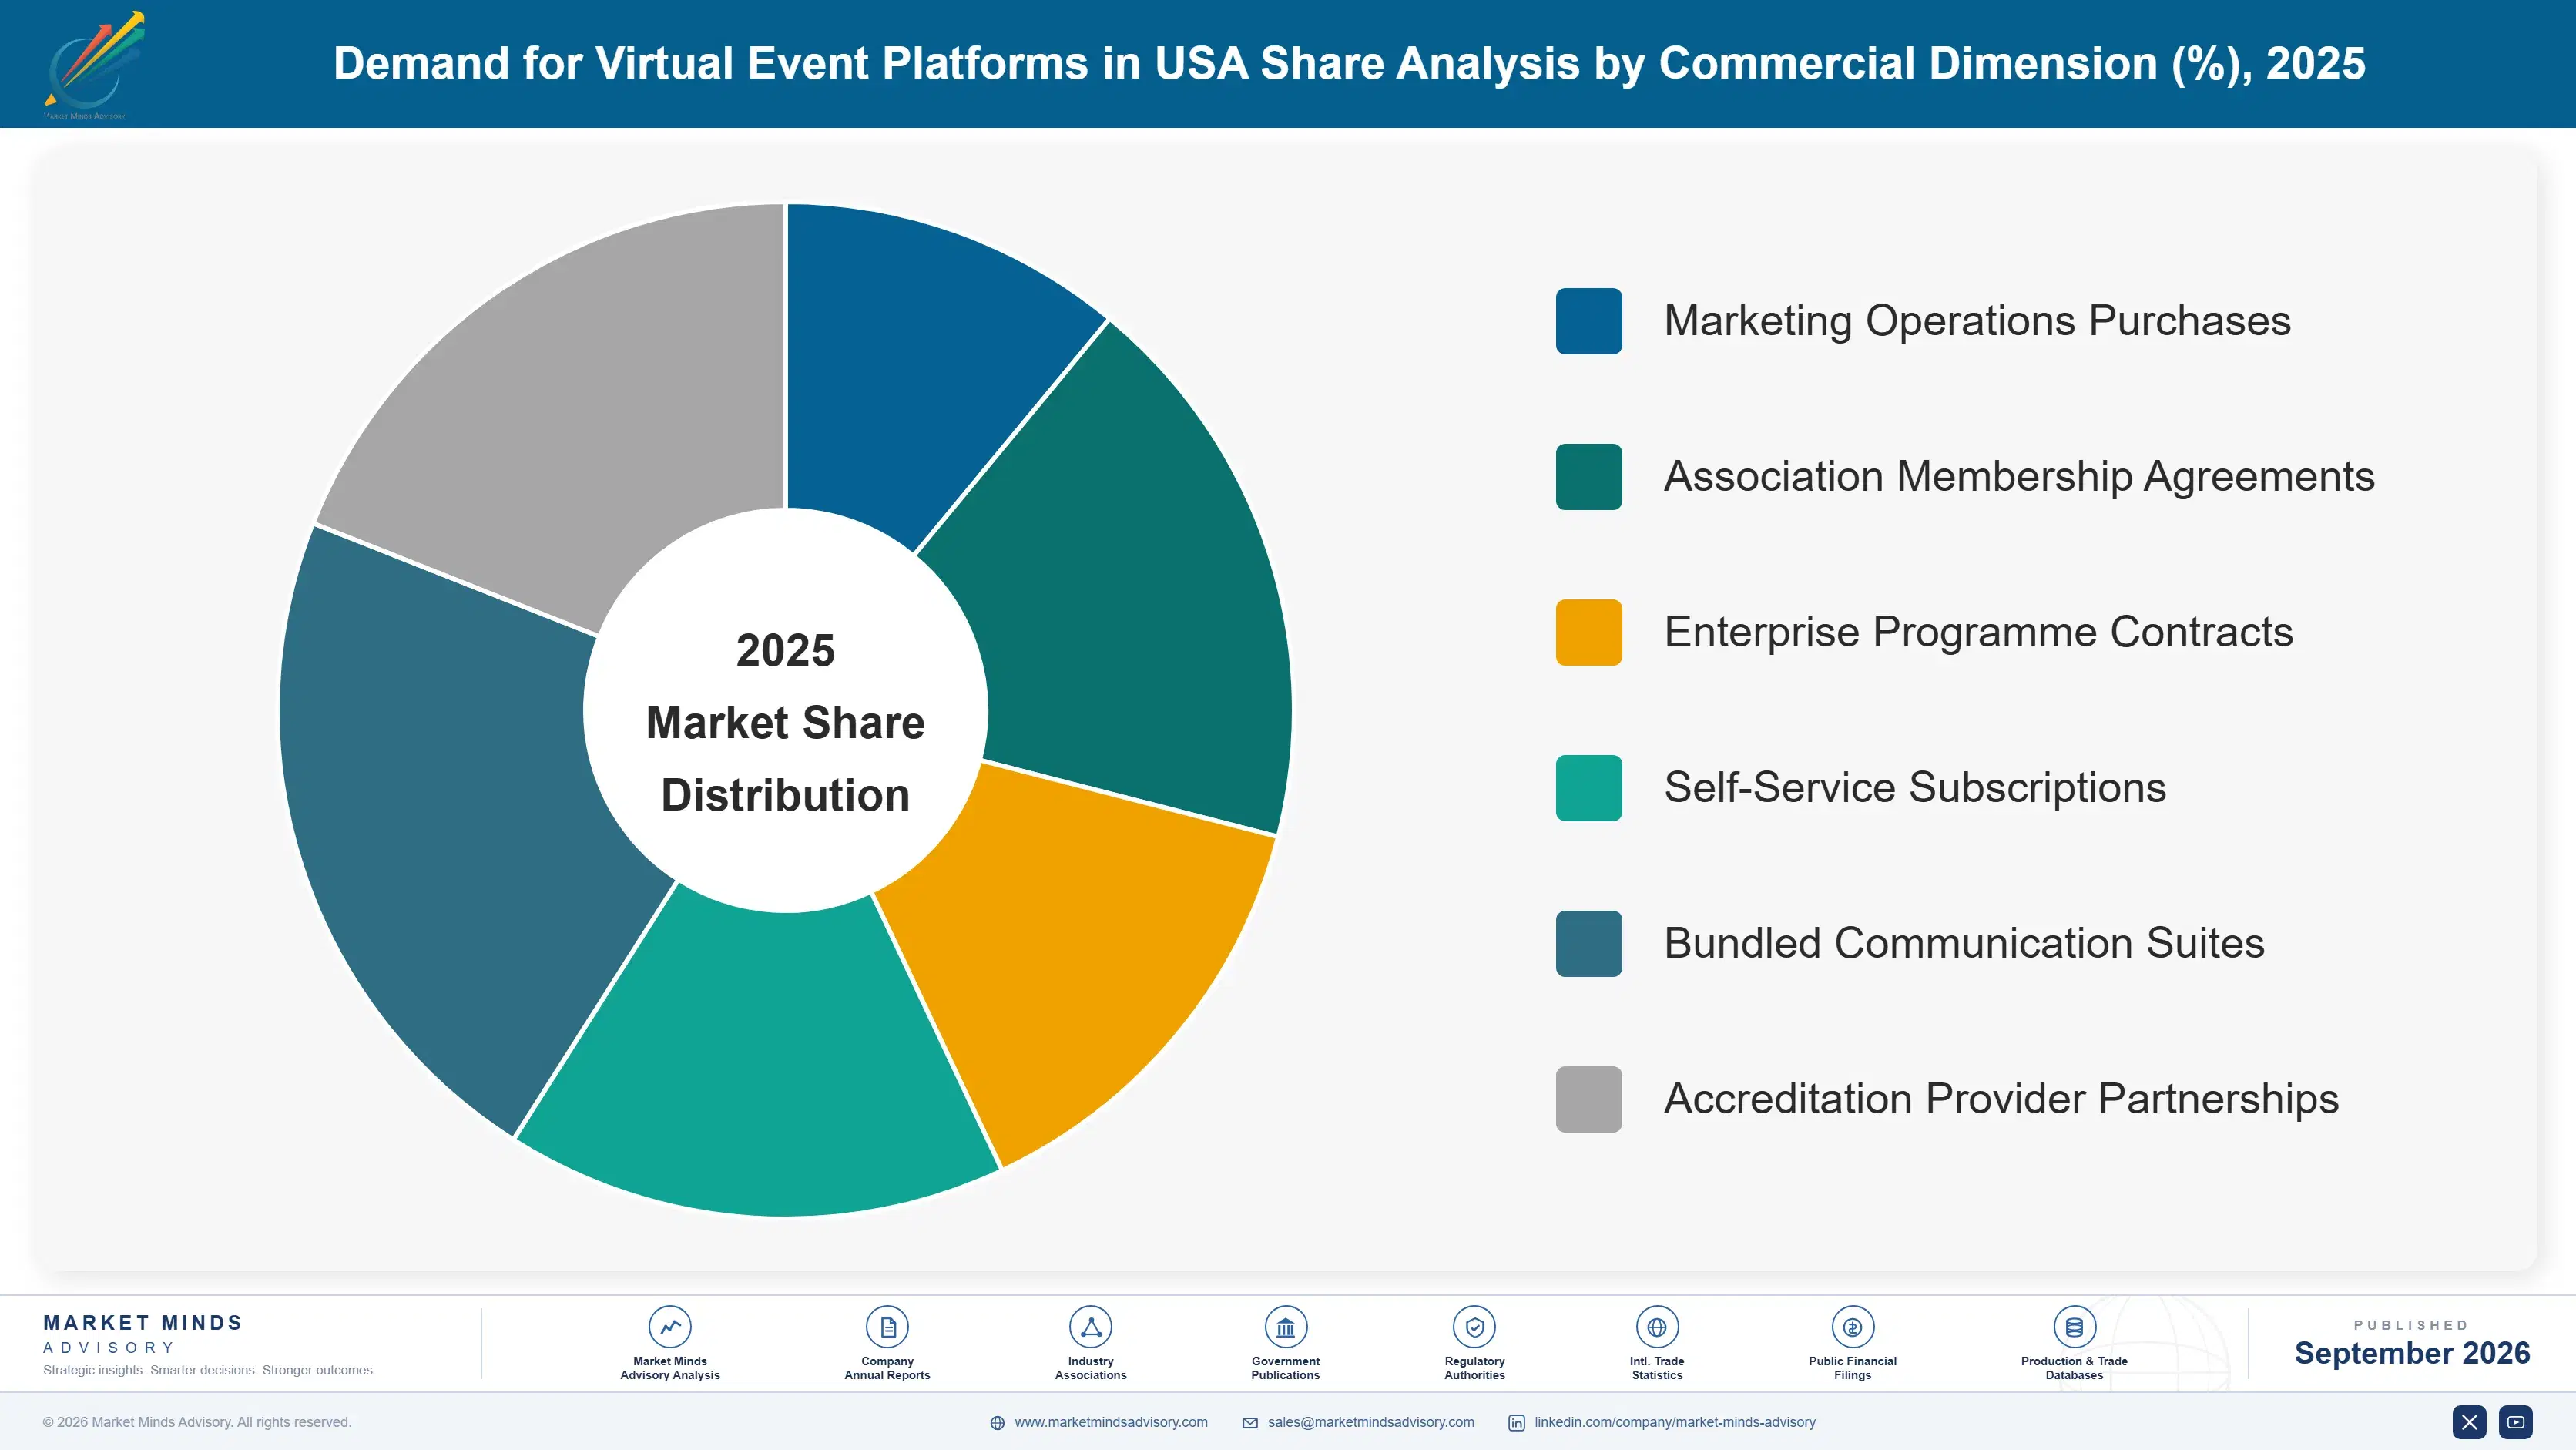
Segmentation follows what obliges somebody to attend and who pays for it, because those two facts determine whether a session finishes and whether the spend survives review. A credentialed hour and a marketing webinar use identical technology and answer to completely different pressures, and only one of them holds an audience without any effort at all.
united-states-virtual-event-platforms-market-market-share-analysis-1788453077485

Credentialing and Continuing Education Delivery

Credentialing delivery grows at 12.3%, half again the market rate of 8.2%, because American licensure across medicine, law, accountancy, engineering and financial services obliges practitioners to complete documented education every year regardless of enthusiasm. Sessions finish at about 76% against 29% for non-credentialed content, and the difference is the requirement rather than anything a platform provides. Professional associations and specialist education providers are the buyers, and they need credit tracking, attestation and reporting that general event platforms handle poorly. Demand follows licensure rules rather than marketing budgets, which makes it considerably steadier than anything else in this market. State board reporting requirements make accuracy a genuine obligation rather than a reporting convenience.
CAGR 12.3%

Pipeline Attribution and Measurement Tooling

Attribution tooling grows at 10.8% because roughly 62% of American marketing programmes face quarterly reallocation against measured pipeline, and a programme that cannot produce a cost per qualified contact near the USD 118 benchmark is excluded from the comparison rather than merely losing it. Coverage sits near 44% of attendee records, since deduplication and multi-touch modelling break between event platforms and customer relationship systems. The work is integration engineering rather than analytics presentation. Its awkwardness is that better attribution occasionally proves the channel underperforms, which vendors rarely mention while selling it. The buyers are marketing operations rather than event teams, and they evaluate against paid search rather than against other event platforms.
CAGR 10.8%
Full segment breakdown across 6 segments available in the complete report.

Regional Architecture and Country Demand Map

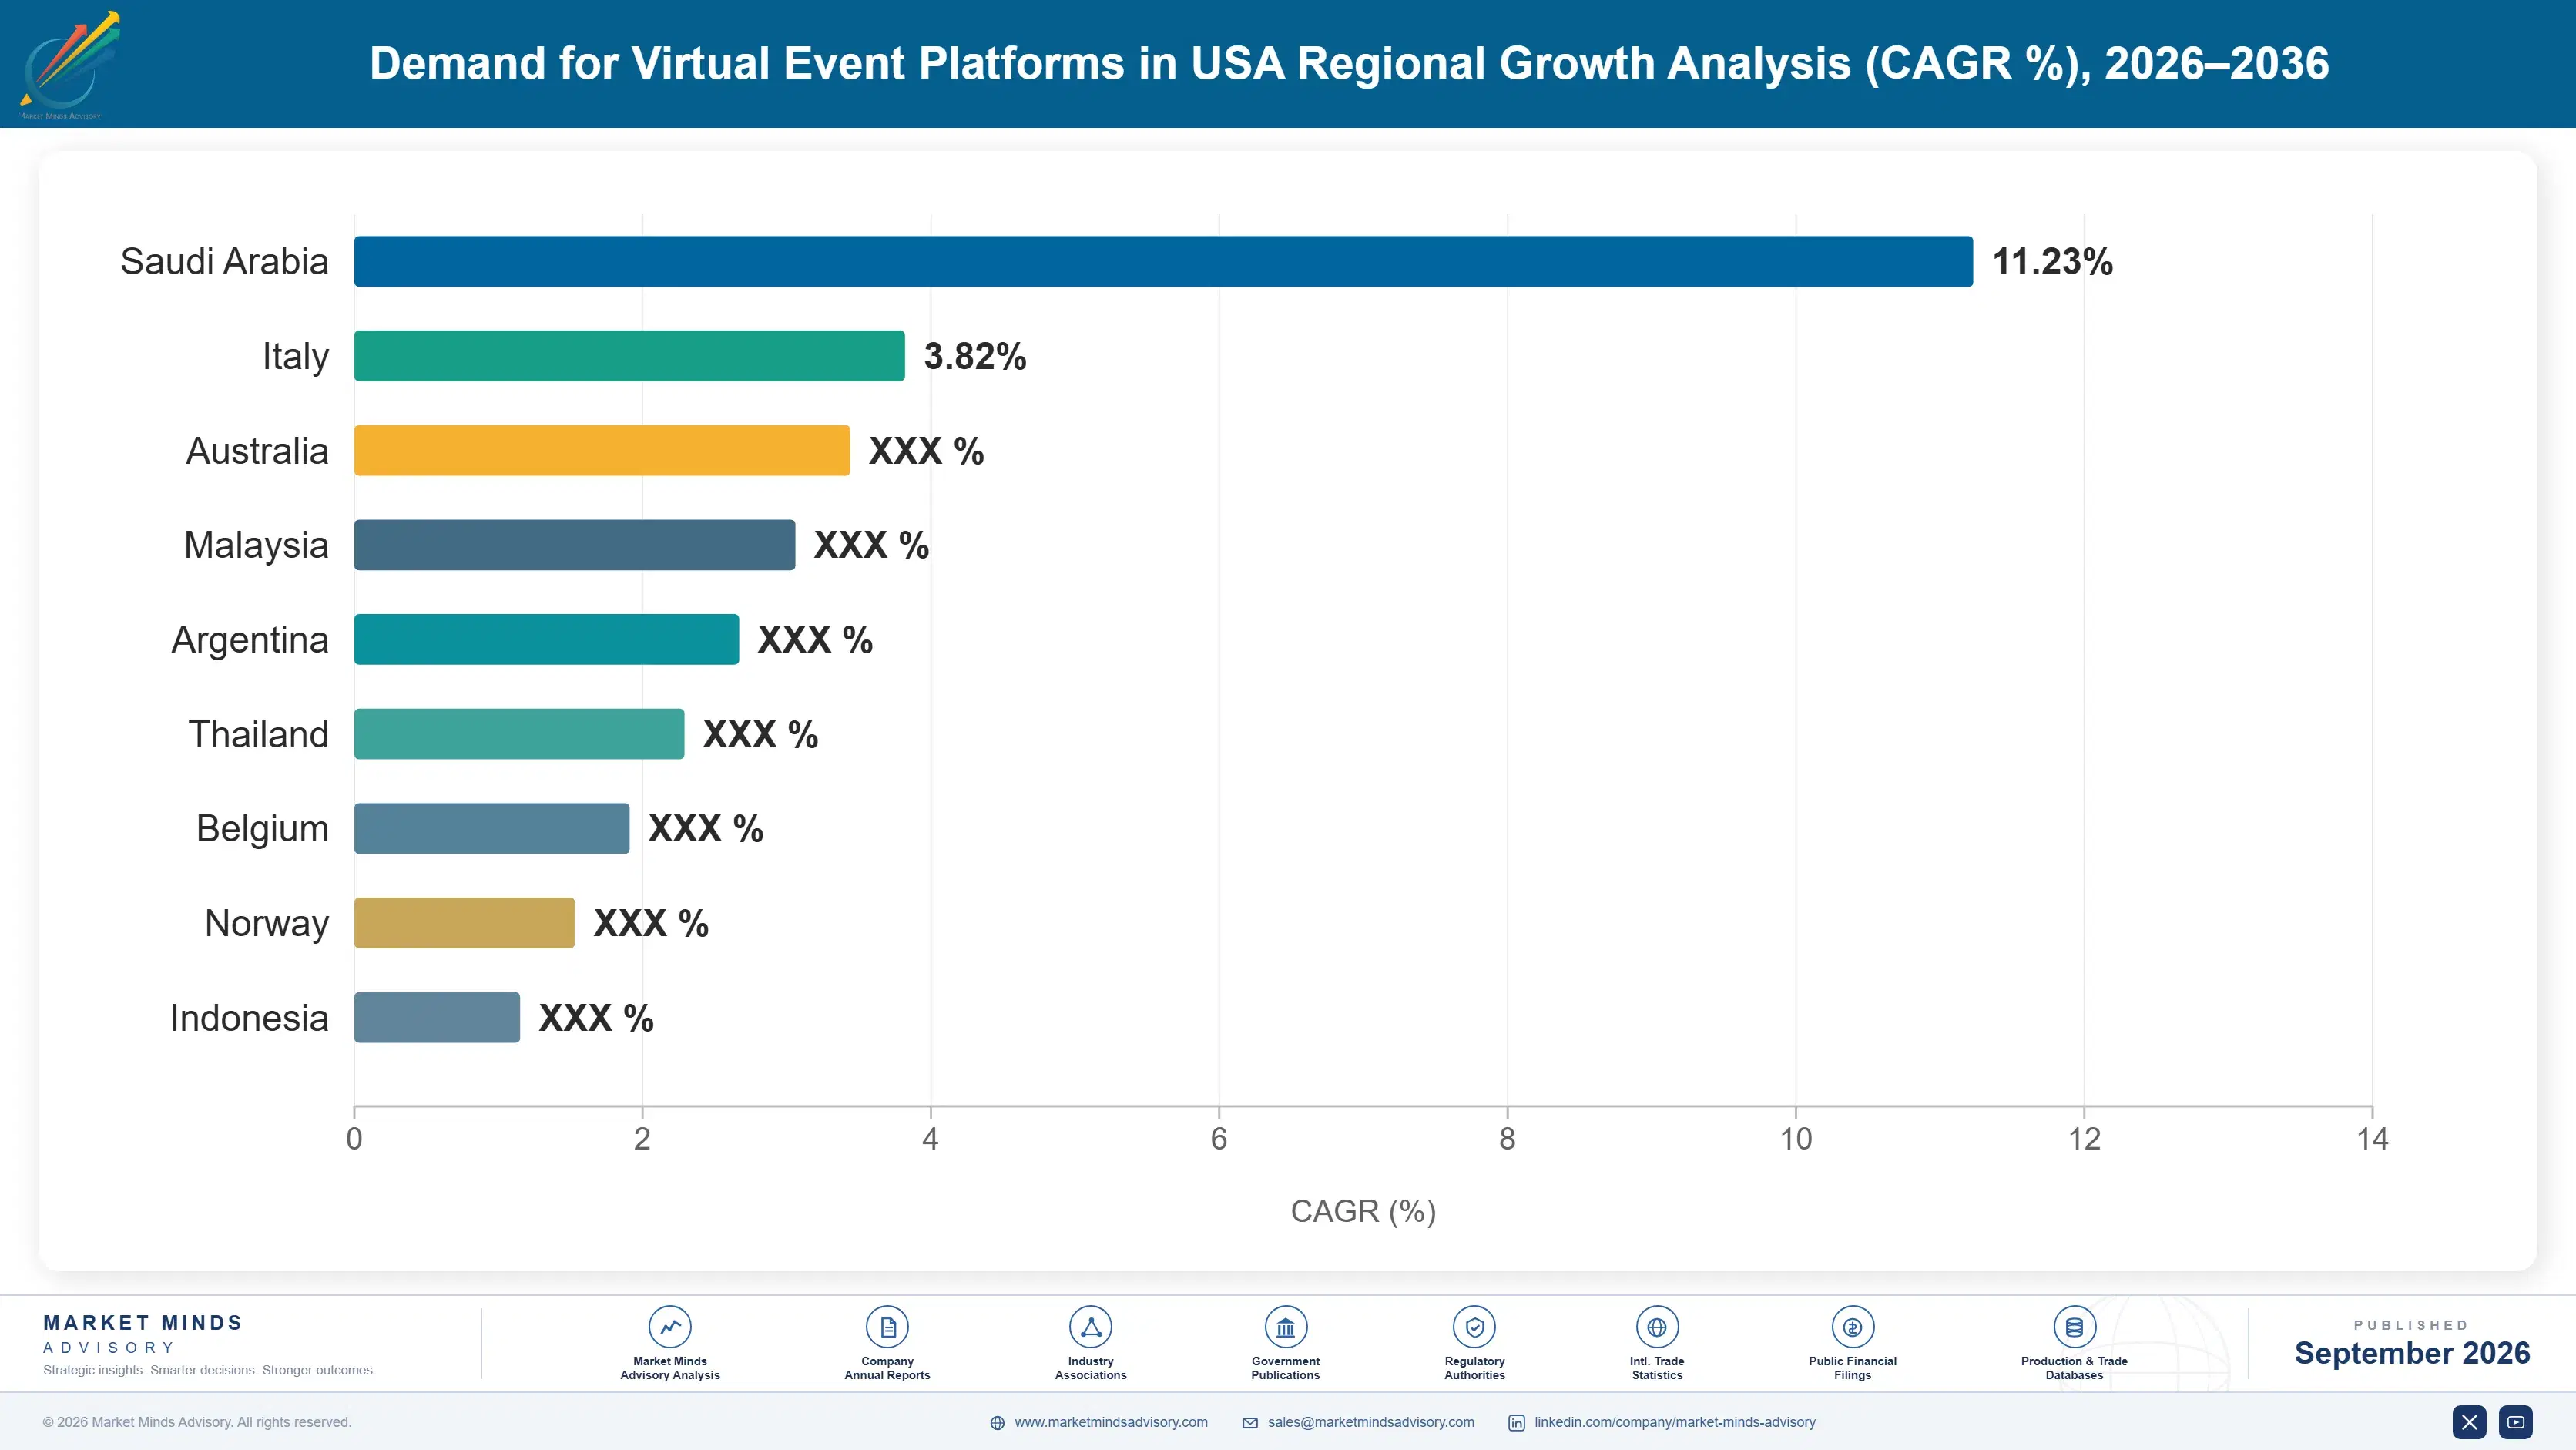
This report is United States centred within a global sizing frame, so regional shares describe where comparable platform value is bought worldwide. Licensure structure and marketing measurement discipline explain the pattern rather than business population does. Business population predicts remarkably little about where this spending actually lands.

North America

North America holds 38%, above the regional band, because American professional licensure imposes documented annual education across more regulated occupations than any comparable market, and because marketing measurement discipline here is the most aggressive anywhere. State boards and professional bodies enforce continuing education that virtual delivery satisfies cheaply and verifiably. Roughly 62% of marketing programmes face quarterly reallocation, which rewards attribution capability and punishes platforms that cannot produce pipeline figures. Association conferences combining physical events with credentialed content put both growth mechanisms inside a single customer relationship. Non-credentialed session completion near 29% is measured here more often than anywhere, which is putting pressure on programme volumes that credentialing growth is only partly offsetting.
Share: 38% | CAGR: 9.0% (2026 to 2036)

Western Europe

European demand rests on marketing programmes measured less aggressively than American ones and on professional education requirements that vary considerably between national bodies rather than following a single pattern. Consent regulation makes attendee data handling the decisive selection criterion, which differs sharply from the American emphasis on attribution volume. Physical event recovery has been strong and hybrid extension follows it. Growth at 6.6% is the slowest anywhere, reflecting fragmented professional requirements and slower budget reallocation rather than weaker underlying demand. Credentialing delivery is growing here too, though professional bodies set requirements nationally rather than through a common framework, which fragments the accreditation workflow vendors must support. Attribution coverage matters less, since reallocation happens annually.
Share: 24% | CAGR: 6.6% (2026 to 2036)
Regional intelligence for 5 additional markets available in the complete report: East Asia, South Asia and Pacific, Latin America, Middle East and Africa, Eastern Europe. Contact sales@marketmindsadvisory.com.
united-states-virtual-event-platforms-market-country-cagr-analysis-1788453078007

Surviving the Quarterly Budget Review

Two things decide outcomes in the American market and neither is production quality. Whether the content carries a credential, which determines if anybody finishes it, and whether the platform can produce a cost per qualified contact, which determines whether the programme survives its next budget review ninety days from now. Nothing else matters much.

Attach Content to Professional Credit Wherever Possible

Sessions carrying credit finish at about 76% against 29% without, and the difference has nothing to do with the platform or the presenter. Vendors helping customers obtain accreditation from professional bodies, and supporting the attestation and reporting that credit requires, lift completion by roughly 2.5 times on identical content. It requires understanding accreditation processes rather than event software. Most platform vendors treat credentialing as a feature checkbox and leave the accreditation work entirely to the customer. Accreditation is a paperwork discipline rather than a technical one, which is exactly why software vendors avoid it.
Market Impact: Lifts session completion by roughly 2.5 times overall

Build Attribution Into Customer Relationship Systems

Around 62% of American marketing programmes are reallocated quarterly against measured pipeline, and coverage near 44% of attendee records means most of a programme's output cannot enter that comparison at all. Deep integration raising coverage above 70% moves the renewal conversation from session counts onto pipeline arithmetic, which is the only ground where this spend reliably survives. Platforms with genuine integration retain roughly 30% better through reallocation cycles. The work is engineering rather than analytics presentation. Session counts are not evidence in a reallocation review, and every marketing operations leader knows it. Vendors keep sending them.
Market Impact: Retains roughly 30% better through each reallocation cycle

Publish Cost Per Qualified Contact Against Alternatives

American marketing leaders compare a webinar programme against paid search and content syndication routinely rather than occasionally, and a vendor who cannot produce the comparison is excluded from the discussion in which their spend is judged. Presenting cost per qualified contact near USD 118 alongside those alternatives, honestly, wins renewals where it is competitive and loses accounts that were leaving anyway. Vendors reporting registrations instead retain roughly 20 percentage points worse once buyers measure. Honest comparison also identifies which accounts were never going to renew, which is worth knowing early. Most vendors avoid it.
Market Impact: Shifts account retention by 20 percentage points overall

Serve Associations That Hold Both Motions

Professional associations run physical conferences, hybrid extension and credentialed education inside one organisation, which makes them the only buyer combining the growing segments of this market in a single relationship. They also renew on membership cycles rather than on marketing budgets, which removes the quarterly reallocation pressure entirely. Association accounts carry roughly 3 times the contract length of marketing accounts. Vendors organised around marketing buyers reach them through the wrong conversation altogether. Membership renewal cycles run annually or longer and are not reviewed against pipeline, which changes the entire commercial rhythm of the account.
Market Impact: Carries roughly 3 times the marketing contract length

Who Controls the Margin Pool

Concentration sits near 31% across the top five on measured platform subscription and service revenue, and the market is more contested than that figure suggests because three different kinds of supplier compete for the same budget. Communication vendors bundle webinar capability into subscriptions organisations already hold. Event specialists sell registration, credentialing and attribution depth. Education platform providers sell accreditation workflow that neither of the others handles properly.
Competition runs on three dimensions. Attribution integration is first among American marketing buyers, since a programme that cannot produce pipeline figures does not survive quarterly reallocation. Second is credentialing workflow, covering credit tracking, attestation and reporting to professional bodies, which general platforms handle badly. Third is bundling economics, where communication vendors offer adequate capability at effectively zero marginal cost to existing customers.

Two pressures will move positions. Credentialing growth at 12.3% rewards suppliers who understand accreditation processes rather than event software, which is a genuinely different capability most platform vendors have not built. Meanwhile bundling continues compressing the low end, and platforms positioned between free adequate tools and genuine attribution or credentialing depth are being squeezed from both directions with no obvious position to retreat to.
united-states-virtual-event-platforms-market-company-positioning-matrix-1788453078528

Competitive Moat and Risk Dimensions

CVENT

Moat: Registration and association depth

Cvent holds deep registration, attendee data and event programme capability across physical, hybrid and virtual formats, which suits professional associations running conferences and credentialed education inside one organisation. Its integration into marketing and customer relationship systems is established rather than aspirational. Association relationships renew on membership cycles rather than on quarterly marketing budgets, which removes reallocation pressure entirely.
CVENT

Risk: Bundled entry competition

Communication vendors meet the basic webinar requirement at effectively no incremental cost to customers already holding their subscriptions, which removes the entry-level business that historically introduced buyers to specialist platforms. Growth must come from buyers already sophisticated enough to need depth. Exposure to physical event cycles also remains, and those have historically proven sensitive to economic conditions.
ON24

Moat: Attribution and pipeline integration

ON24 built around demand generation measurement rather than event delivery, which matters because American marketing programmes face quarterly reallocation and need pipeline figures to survive it. Its integration into customer relationship and marketing automation systems reaches the teams controlling budget. Engagement data feeding directly into scoring models is what defends the spend in a review.
ON24

Risk: Credentialing workflow absence

Credentialing delivery grows at 12.3% and requires credit tracking, attestation and reporting to professional bodies, which is accreditation workflow rather than marketing measurement. The buyers are associations and education providers who purchase on membership cycles and evaluate entirely different capabilities. Building that workflow means competing with education platform providers on ground the company has not previously contested.

Players Tracked

Prominent Players

Zoom Communications
Cvent
ON24
RingCentral
Bizzabo

Other Key Players

Kaltura
GoTo
Webex by Cisco
Microsoft
Swapcard
Hubilo
Vimeo
Notified
Splash
Eventbrite
Whova
Airmeet
InEvent
Stova
Blue Sky eLearn

Recent Developments

FEBRUARY 2025

Marketing organisations exclude programmes lacking pipeline attribution

American marketing leaders removed webinar programmes from quarterly budget allocation where cost per qualified contact could not be produced against paid search and syndication comparisons. Session and registration reporting was no longer accepted as evidence of contribution in those reviews. Attribution had become a funding condition rather than a report.
Signal: A programme that cannot produce pipeline arithmetic is not losing the comparison, it is absent from it.
JUNE 2025

Associations expand credentialed virtual delivery against licensure requirements

Professional bodies across medicine, accountancy and engineering increased virtual continuing education delivery, citing completion rates far above non-credentialed content and delivery costs well below in-person conference attendance. Accreditation workflow rather than streaming capability determined platform selection. In-person conference attendance costs several multiples of virtual delivery per credit.
Signal: Credit compels completion, and accreditation workflow rather than event software decides who actually gets to supply it.
OCTOBER 2025

Bundled communication tools absorb entry level webinar programmes

Organisations already holding communication platform subscriptions moved basic webinar delivery onto those tools at no incremental cost, abandoning specialist platforms used for straightforward broadcast. Programmes requiring attribution or credentialing depth remained with specialists. Nobody was willing to keep paying twice for capability they already held elsewhere.
Signal: Free adequate tools are taking the simple work, which leaves specialists needing depth to justify existing anywhere.

What Delivery Costs Suppliers

Cost structure is dominated by integration and support rather than by streaming. Bandwidth, transcoding and content delivery together account for roughly 27% of revenue at typical scale, and those costs have been falling steadily. Customer relationship system integration, credentialing workflow configuration and event day support form the larger block, and each scales with customer count and event count rather than with attendee volume or minutes streamed.
Integration engineering labour has been the sharpest pressure. People who can connect an event platform properly into marketing automation and customer relationship systems are scarce, and demand rose through 2024 and 2025 as attribution became a renewal condition rather than a reporting feature. Zoom Communications and Cvent both referenced platform and services cost conditions in recent annual reporting. Vendors absorbed most of it, since integration is frequently bundled into subscription pricing agreed before scoping.

Exposure varies by customer type rather than by scale. Marketing accounts demand integration depth and renew quarterly against pipeline, which concentrates both cost and risk. Association and education accounts require credentialing workflow configuration once and renew on membership cycles, which is a considerably calmer revenue base. Vendors serving only marketing buyers carry reallocation exposure association-weighted competitors do not face.
united-states-virtual-event-platforms-market-cost-volatility-analysis-1788453078726

Prebuild connectors for common marketing systems

Most integration work connects the same handful of customer relationship and marketing automation platforms repeatedly, engineered fresh each time because every customer configured theirs differently. Prebuilt connectors with defined field mapping cut that effort by roughly 45% and raise attribution coverage faster, which is what actually protects the renewal. The engineering investment is modest against the labour it removes.

Package credentialing workflow rather than configuring bespoke

Accreditation requirements differ by profession and by state board, and vendors configuring each association separately repeat similar work indefinitely without building anything reusable. Packaged workflow for common professions converts repeated services effort into product capability. It requires understanding accreditation processes rather than event software, which is why most platform vendors leave the work with customers and lose the segment.

Price integration separately from platform subscription

Integration frequently gets bundled into subscription pricing agreed before anybody scopes the customer's systems, and marketing technology estates vary enough that the estimate is wrong more often than right. Separating integration into priced scope after a short discovery protects platform economics the business depends upon. Buyers accept it once somebody explains why coverage will otherwise stay near half.

Portfolio Architecture for Margin Defence

Margin architecture separates on what obliges the customer to keep paying. Basic webinar delivery competes against communication tools organisations already hold, which caps pricing regardless of quality. Attribution tooling earns considerably more because it decides whether a marketing programme survives quarterly reallocation. Credentialing workflow earns most, since accreditation requirements are complex, profession-specific and handled badly by general platforms.
The tension runs between marketing volume and association durability. Marketing accounts are numerous, spend generously and reallocate every ninety days against measured contribution, which makes revenue substantial and genuinely insecure. Association and education accounts are fewer, spend less per account and renew on membership cycles across multi-year relationships. Vendors weighted entirely to marketing carry reallocation exposure across their whole book, which few of them have priced properly.

High-value revenue concentrates in credentialing workflow and in attribution integration. Credentialing is defended by accreditation knowledge that competitors must acquire rather than build. Attribution is defended by integration depth into systems customers will not readily reconfigure. Basic webinar delivery is the volume base, contested by free bundled tools and increasingly difficult to price above nuisance value, which several vendors have simply stopped attempting.

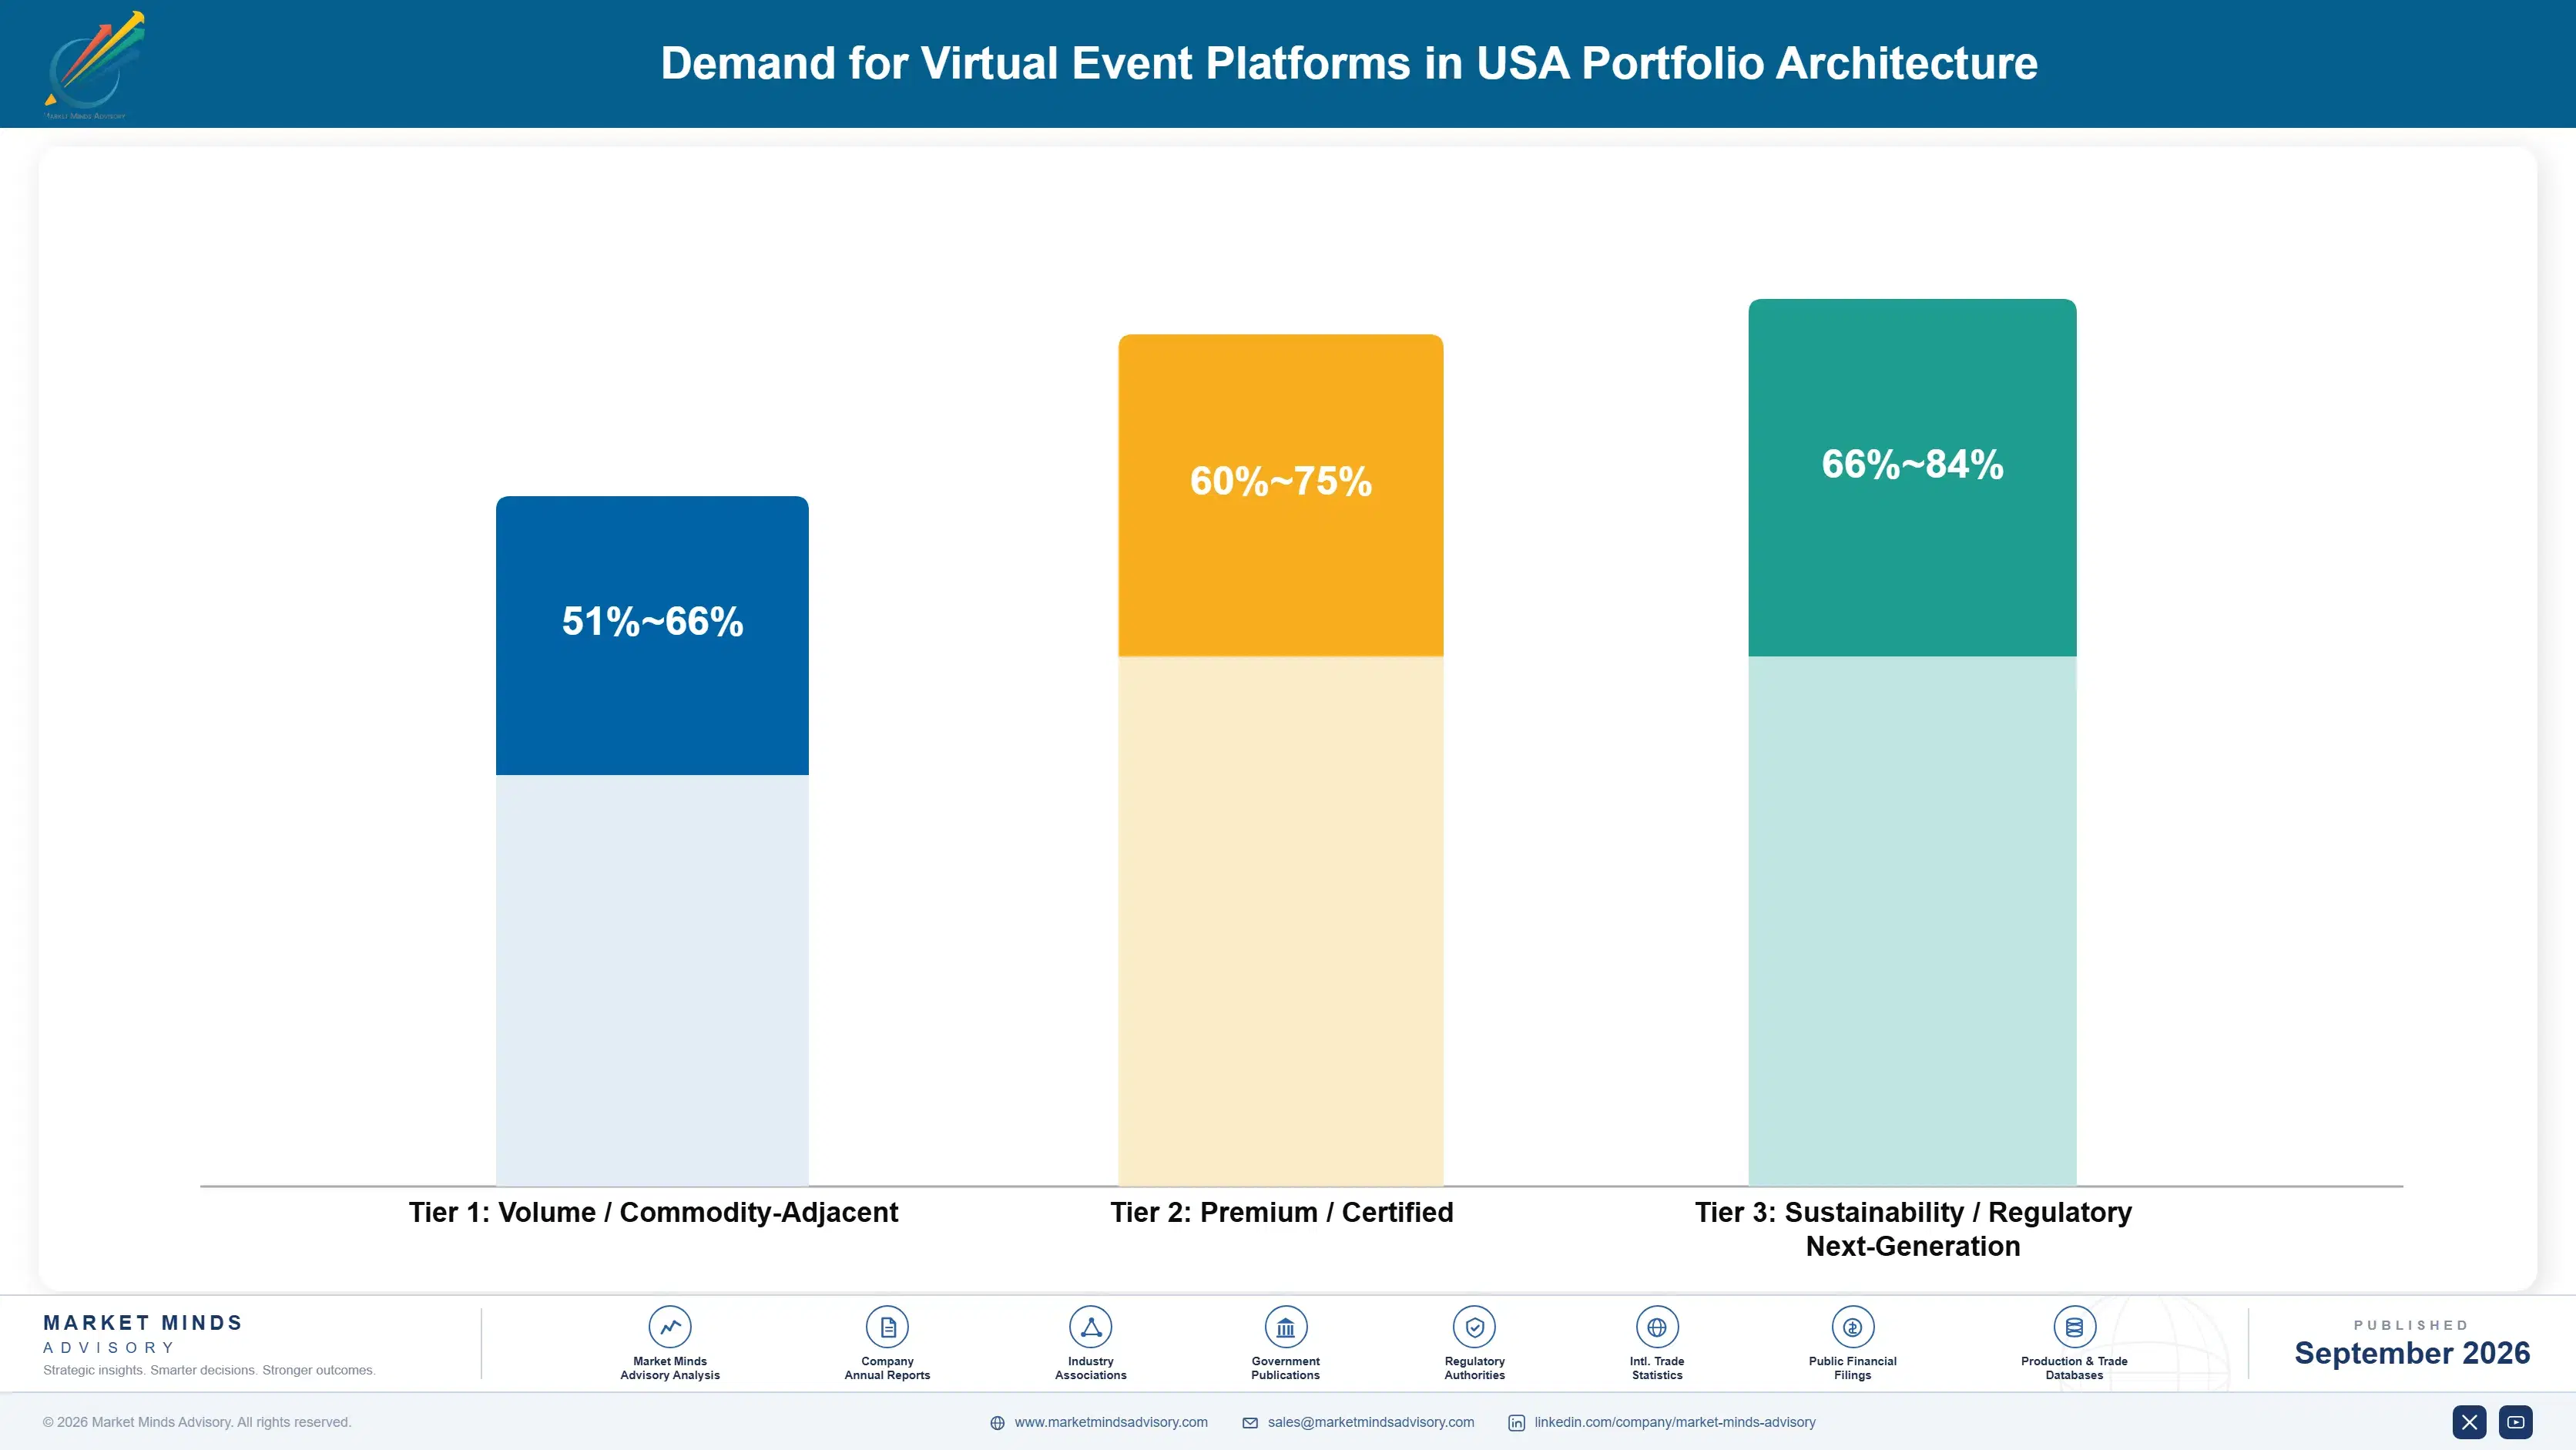
Volume / Commodity-Adjacent

Basic webinar and broadcast subscriptions competing against communication tools customers already pay for. The range reflects delivery efficiency and support automation. Pricing is capped by what those bundled tools do adequately rather than by any competitor's list.
Gross Margin: 51-66%

Premium / Certified

Attribution tooling and enterprise programme management integrated into marketing and customer relationship systems. Margin depends on prebuilt connector coverage rather than bespoke engineering. Renewal survives quarterly reallocation only where coverage is genuinely deep.
Gross Margin: 60-75%

Sustainability / Regulatory / Next-Generation

Credentialing workflow, accreditation reporting and continuing education delivery sold to professional associations and education providers. The widest range in the portfolio, reflecting profession coverage and attestation complexity. Highest margin and the calmest renewal cycle available.
Gross Margin: 66-84%
united-states-virtual-event-platforms-market-portfolio-architecture-1788453079230

High-value Sub-segments and Strategic Watch-out

Credentialing Workflow Delivery

High value with the fastest growth at 12.3%, defended by accreditation knowledge competitors must acquire rather than engineer. The range reflects profession and state board coverage. Sessions finish at about 76% because credit compels it, which makes outcome reporting genuinely comfortable for once in this market.
Gross Margin: 68-84%

Attribution and Pipeline Integration

High value with strong growth at 10.8%, deciding whether a marketing programme survives quarterly reallocation at all. The range reflects prebuilt connector coverage against bespoke work. Coverage near 44% of records is the constraint, and raising it is integration engineering rather than analytics presentation. Nobody demonstrates it.
Gross Margin: 62-77%

Basic Webinar Subscriptions

The volume base, contested directly by communication tools customers already pay for and increasingly hard to price above nuisance value. The range reflects support automation and delivery efficiency. It funds the customer base that attribution and credentialing capability is then sold into afterwards. Volume is the point.
Gross Margin: 50-65%

Virtual Trade Show Platforms

The strategic watch-out, growing at 2.4% against a demand condition that ended when American business travel resumed fully. Engineering written off would embarrass somebody, which is largely why several vendors still list it. Buyers stopped asking about it several years ago now and have not resumed since.
Gross Margin: 0-15%

What Survives Ninety Days

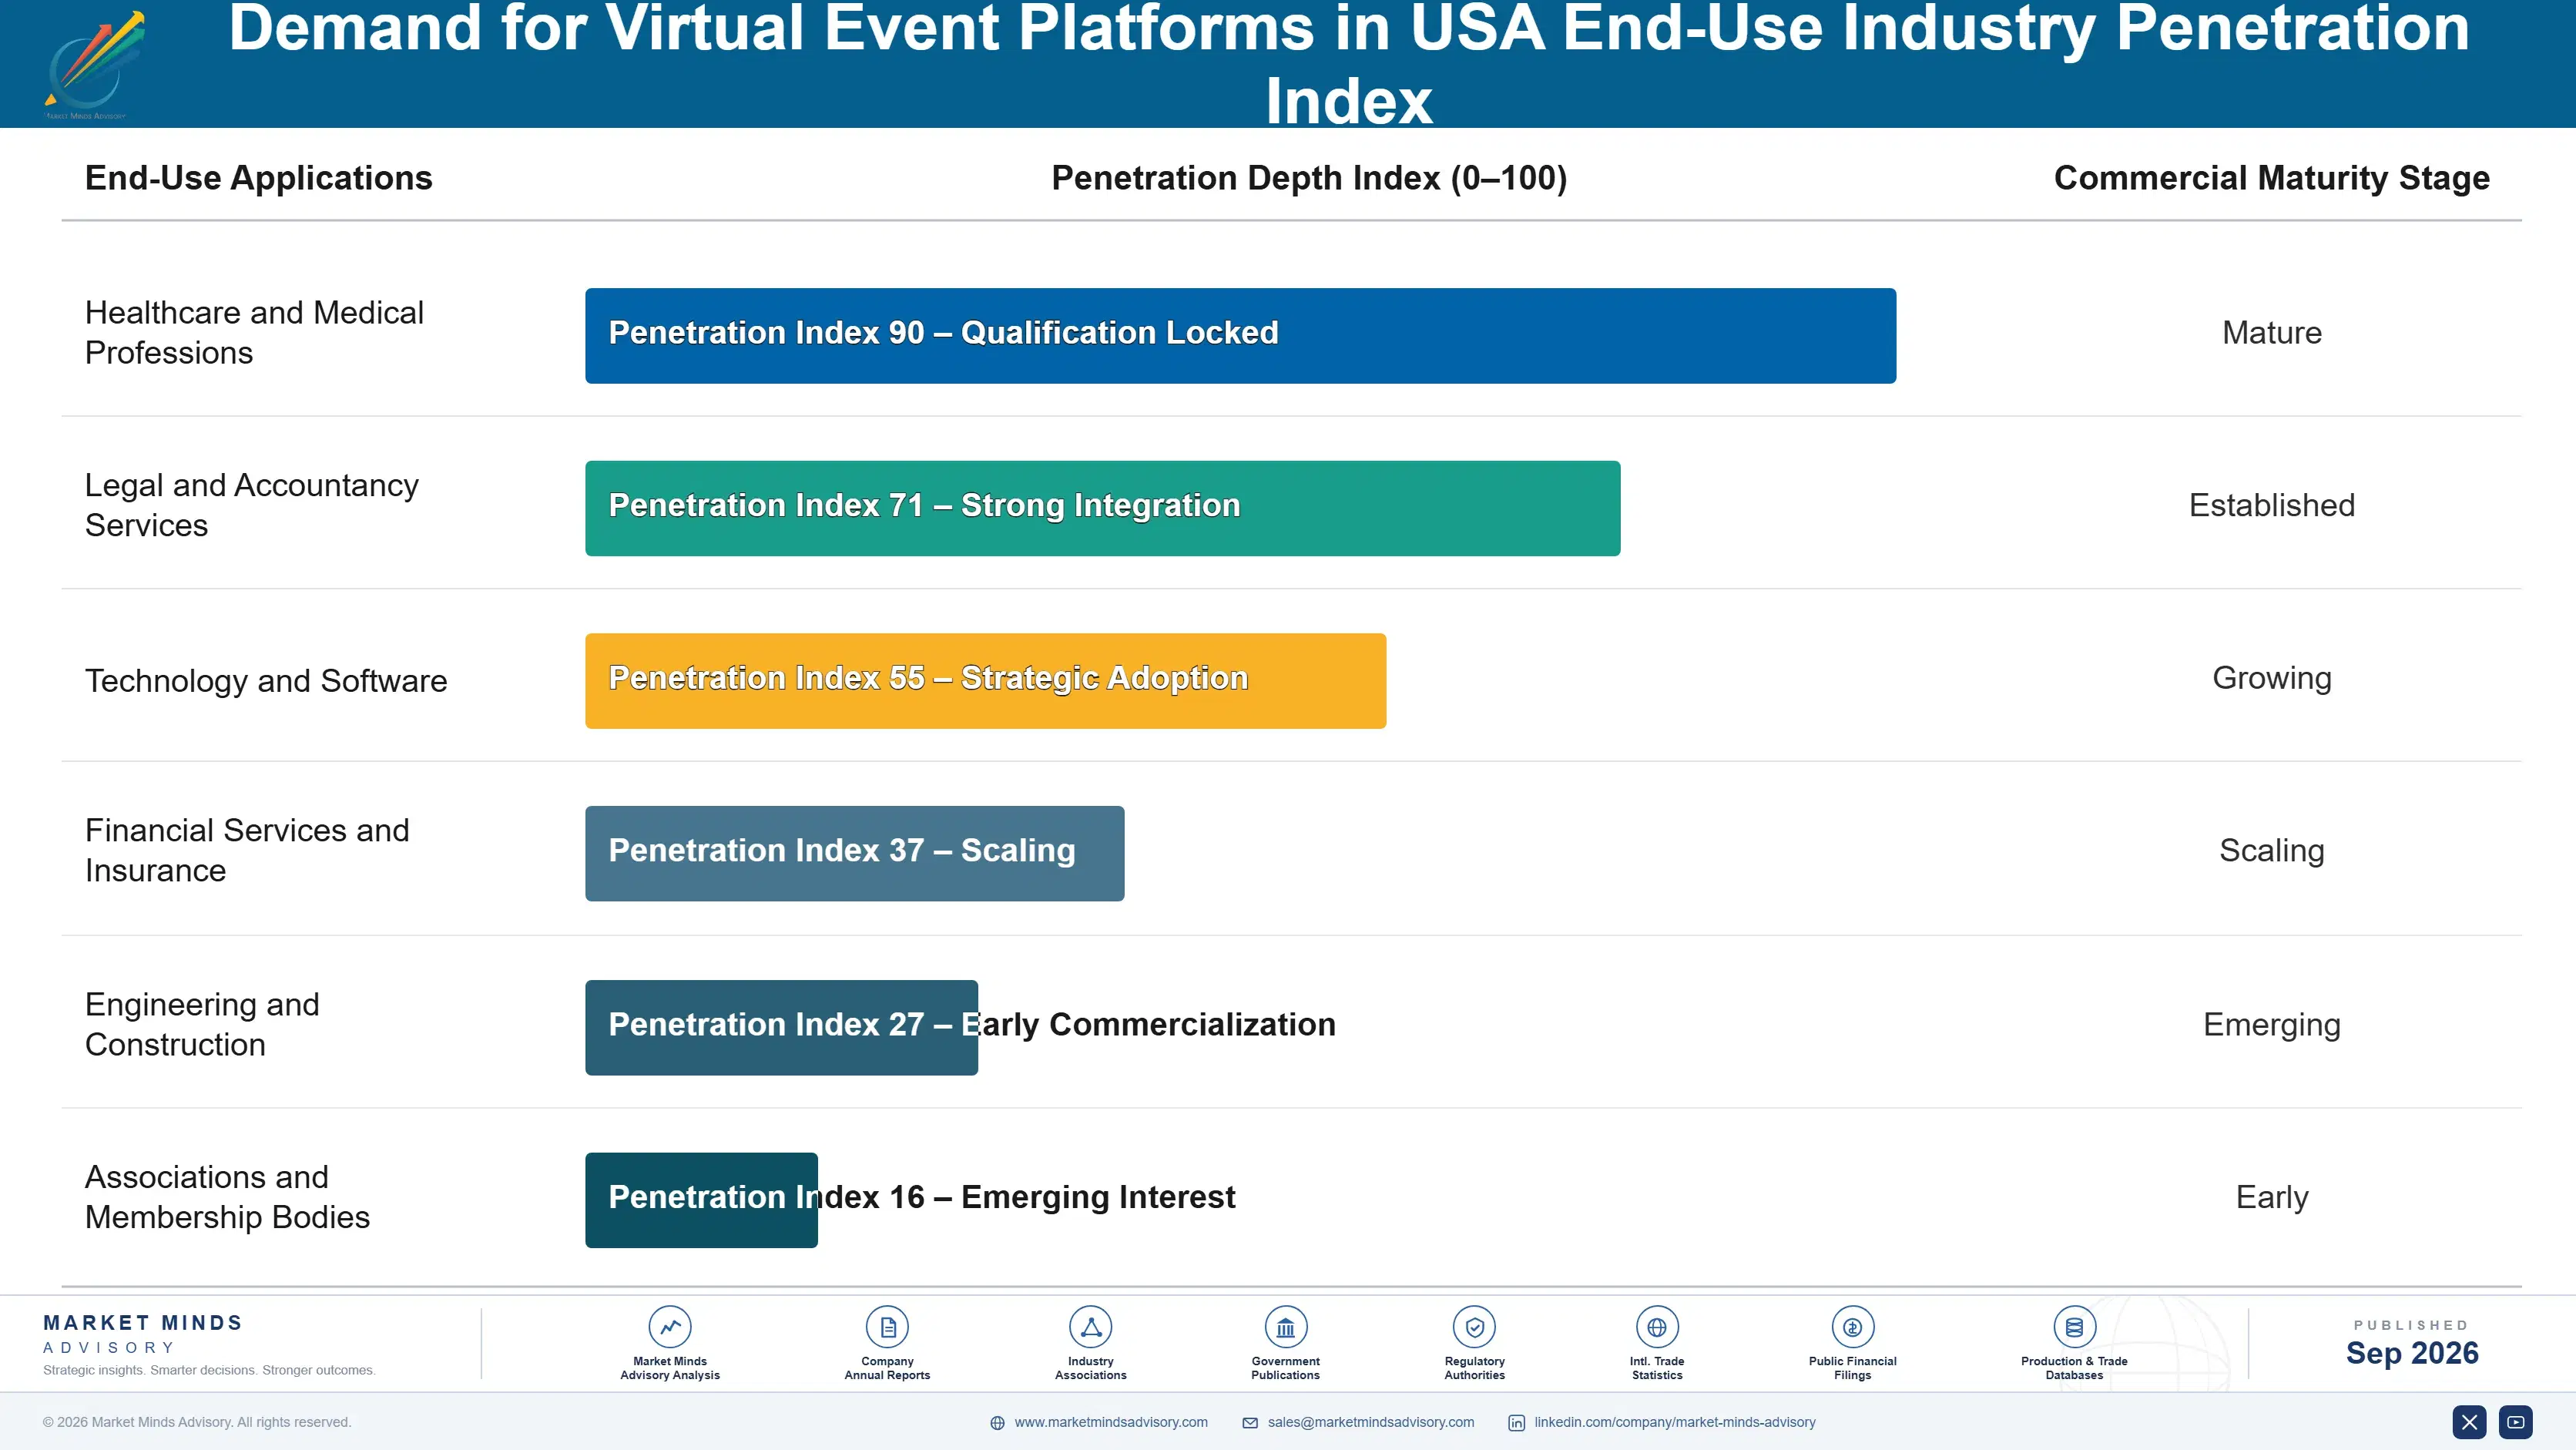
Recurrence divides between two entirely different rhythms. Marketing platform subscriptions renew annually and face reallocation review quarterly, which makes them among the least secure recurring revenue in enterprise software despite the contract length. Association and education subscriptions renew on membership and accreditation cycles measured in years, because the credentialing workflow is embedded in how a professional body serves its members. Very little else in this market recurs reliably.
Adoption depth varies with how much of an organisation's process runs through the platform. A marketing team using only broadcast can move to a bundled communication tool over a weekend and periodically does. An association whose credit tracking, attestation records and member reporting sit inside a platform cannot move without rebuilding compliance evidence its regulator expects. That distinction explains almost all the retention difference between vendors serving the two groups.

The buyer moved from event teams toward marketing operations, and in the fastest growing segment toward professional education directors instead. Marketing operations evaluate cost per qualified contact against paid alternatives. Education directors evaluate accreditation workflow, attestation reliability and reporting to state boards. Those are entirely different conversations, and vendors running one at both audiences reach half of what this market contains.
united-states-virtual-event-platforms-market-end-use-penetration-index-1788453079718

What Holds Attention and Budget

These are among the four positions where our research anticipates prominent divergence between winners and laggards over the coming forecast period. Each is grounded in the demand model, the regulatory perimeter, and the announced capacity pipeline.
01 / CREDENTIAL ATTACHMENT STRATEGY

Attach content to credit wherever a profession permits

Sessions carrying professional credit finish at about 76% against 29% for content without it, and that difference has nothing whatever to do with the platform, the presenter or the production quality applied to it. Vendors helping customers obtain accreditation and supporting the attestation and reporting credit requires lift completion by roughly 2.5 times on identical material and identical presenters. It demands understanding accreditation processes rather than event software, which is precisely why most platform vendors leave that work entirely with the customer instead.
02 / ATTRIBUTION INTEGRATION DEPTH

Reach the pipeline system or leave the conversation

Roughly 62% of American marketing programmes are reallocated every single quarter against measured pipeline contribution, and attribution coverage near 44% of attendee records means most of what a programme produces cannot enter that comparison at all in practice. Deep integration lifting coverage above 70% moves the renewal conversation from session counts onto pipeline arithmetic, and platforms with genuine integration retain roughly 30% better through reallocation cycles as a result. The work required is integration engineering rather than any kind of analytics presentation.
03 / COMPARISON NUMBER DISCLOSURE

Publish cost per contact against the paid alternatives

American marketing leaders compare a webinar programme against paid search and content syndication routinely rather than only occasionally, and a vendor unable to produce that comparison is simply absent from the discussion where their own spend gets judged each quarter. Presenting cost per qualified contact near USD 118 honestly alongside those alternatives wins the renewals where it competes and loses accounts that were leaving regardless of anything else. Vendors reporting registrations retain roughly 20 percentage points worse once buyers begin measuring properly.
04 / ASSOCIATION ACCOUNT FOCUS

Chase the buyers who renew on membership cycles

Professional associations run physical conferences, hybrid extension and credentialed education inside a single organisation, which makes them the only buyer combining every growing part of this market in one single commercial relationship. They renew on membership and accreditation cycles rather than on marketing budgets that get reviewed every ninety days, which removes quarterly reallocation exposure entirely from the account, and association accounts carry roughly 3 times the contract length of marketing ones. Vendors organised around marketing buyers reach them through entirely the wrong conversation altogether.

Engagement Snapshot From the Field

A live engagement with an industry participant carrying material or product regulatory and market exposure ahead of a defining policy shift, showing how our research translates into a defensible multi-year portfolio strategy.
MARKET MINDS ADVISORY · CLIENT ENGAGEMENT SUMMARY
Demand for Virtual Event Platforms in USA Producer Strategic Portfolio Review and Transition Roadmap 2026·Investment Scenario on Demand for Virtual Event Platforms in USA Exposure Evaluation 2025-26
CLIENT PROFILE
A professional association with approximately 94,000 members running an annual conference alongside a year-round webinar programme (client-reported, unverified by MMA). Two platforms were in use, selected separately by the events team and the marketing team, and neither group had ever examined what the other was paying for or achieving with it. Nobody had compared them.
STRATEGIC CHALLENGE
Combined platform spend approached USD 1.9 million annually and the board had questioned it (client-reported, unverified by MMA). Marketing reported registrations, events reported attendance, and neither reported completion or credit issuance. Continuing education revenue was growing steadily while the webinar programme's actual contribution had never once been established at all.
MMA APPROACH
MMA measured session completion, credit issuance and downstream member action rather than the registration counts that both teams already tracked exhaustively. We analysed platform session data across eighteen months, interviewed 22 staff across the events, marketing and education functions, and compared credentialed against non-credentialed session performance directly across both platforms in use.
KEY FINDINGS
  1. Credentialed sessions completed at about 79% while non-credentialed marketing webinars completed at 26%, on the same platform and with broadly similar content and presenters.
  2. Continuing education generated roughly 4.1 times the revenue per session of the marketing webinar programme, at lower production cost per session than the marketing programme required.
  3. Credit issuance and attestation were being handled manually in spreadsheets outside both platforms, consuming substantial staff time every single month across the education team.
  4. Neither platform integrated with the membership system, so no attendee record traced through to renewal, retention or any of the later education purchases.
CLIENT PROFILE
A professional association with approximately 94,000 members running an annual conference alongside a year-round webinar programme (client-reported, unverified by MMA). Two platforms were in use, selected separately by the events team and the marketing team, and neither group had ever examined what the other was paying for or achieving with it. Nobody had compared them.
STRATEGIC CHALLENGE
Combined platform spend approached USD 1.9 million annually and the board had questioned it (client-reported, unverified by MMA). Marketing reported registrations, events reported attendance, and neither reported completion or credit issuance. Continuing education revenue was growing steadily while the webinar programme's actual contribution had never once been established at all.
MMA APPROACH
MMA measured session completion, credit issuance and downstream member action rather than the registration counts that both teams already tracked exhaustively. We analysed platform session data across eighteen months, interviewed 22 staff across the events, marketing and education functions, and compared credentialed against non-credentialed session performance directly across both platforms in use.
KEY FINDINGS
  1. Credentialed sessions completed at about 79% while non-credentialed marketing webinars completed at 26%, on the same platform and with broadly similar content and presenters.
  2. Continuing education generated roughly 4.1 times the revenue per session of the marketing webinar programme, at lower production cost per session than the marketing programme required.
  3. Credit issuance and attestation were being handled manually in spreadsheets outside both platforms, consuming substantial staff time every single month across the education team.
  4. Neither platform integrated with the membership system, so no attendee record traced through to renewal, retention or any of the later education purchases.
RECOMMENDED STRATEGY
Phase 1: Consolidate onto the platform supporting accreditation workflow, since credit issuance is where both the revenue and the manual effort sit. Phase 2: Convert a portion of marketing webinars to credentialed sessions where the profession permits, given the completion difference measured across both categories of session. Phase 3: Integrate attendee records into the membership system, since no current data connects event participation to renewal or to education purchasing.
OUTCOME
Platform spend fell to roughly USD 1.2 million on consolidation, and continuing education revenue rose by about 28% within a year as credentialed session volume increased (client-reported, unverified by MMA). Manual credit administration was eliminated, and attendee records now trace into membership renewal for the first time.

Frequently Asked Questions

Foundational context covering the market sizes, CAGR, scope, country, region and competition that inform every finding below. This section is provided to cover basics and most often pre-purchase conversations, answered from the MMA Primary Research Dataset.

What is the current size of the Demand for Virtual Event Platforms in USA?

The market was worth USD 5.9 billion in 2025 and reaches USD 6.38 billion in 2026 on a global sizing frame. The United States is the analytical centre of this report.

How large will the Demand for Virtual Event Platforms in USA be by 2036?

MMA forecasts USD 14.03 billion by 2036, an expansion of 2.20 times over the forecast period. That represents USD 7.65 billion of incremental annual revenue against 2026.

What is the CAGR for the Demand for Virtual Event Platforms in USA 2026 to 2036?

The base case is 8.2% compound annual growth, with a bull case at 9.4% and a bear case at 7.0%. Whether attribution coverage improves separates the scenarios most clearly.

Which segment is growing fastest?

Credentialing and continuing education delivery grows at 12.3%, half again the market rate of 8.2%. American licensure obliges documented annual education that virtual delivery satisfies cheaply.

Who are the major companies in the Demand for Virtual Event Platforms in USA?

Zoom Communications, Cvent, ON24, RingCentral and Bizzabo lead on measured platform subscription and service revenue. Together they hold roughly 31% across three distinct supplier types.

Which country is growing fastest?

India grows fastest at 11.2%, on technology and services firms running webinar programmes aimed at American buyers, so demand originates there while audiences sit elsewhere.

Report Segmentation Architecture

The full report scope spans multiple orthogonal segmentation dimensions, with cross-tabulated demand data provided for each dimension pair. Coverage extends further to regional breakdowns, trend trajectories, and the competitive detail needed to support segment-level decision-making.

By Primary Market Dimension

  • Credentialing and Continuing Education Delivery
  • Pipeline Attribution and Measurement Tooling
  • Webinar and Demand Generation Programmes
  • Hybrid Conference Extension
  • Internal Communications and Training Events
  • Virtual Trade Show and Exhibition Platforms

By End-Use Industry

  • Healthcare and Medical Professions
  • Legal and Accountancy Services
  • Technology and Software
  • Financial Services and Insurance
  • Engineering and Construction
  • Associations and Membership Bodies

By Commercial Dimension

  • Marketing Operations Purchases
  • Association Membership Agreements
  • Enterprise Programme Contracts
  • Self-Service Subscriptions
  • Bundled Communication Suites
  • Accreditation Provider Partnerships

By Region

  • North America
  • Western Europe
  • East Asia
  • South Asia and Pacific
  • Latin America
  • Middle East and Africa
  • Eastern Europe

Scope, Methodology, and Coverage

Every figure in this report is reproducible from documented input assumptions. The scope below maps the historical period, the forecast horizon, the segmentation dimensions, and the countries covered, alongside the underlying primary and qualitative methodology.
Historical Period
2020 to 2025
Forecast Period
2026 to 2036
Base Year
2025 (USD billions; MMA Primary Research Dataset, September 2026)
Market Definition
This market covers software platforms used to deliver, register, credential and measure online and hybrid professional events, spanning credentialing and continuing education delivery, pipeline attribution and measurement tooling, webinar and demand generation programmes, hybrid conference extension, internal communications and training events, and virtual trade show and exhibition platforms. Revenue is measured as platform subscription, usage and attributable integration and service value at supplier level, with the United States treated as the analytical centre within a global sizing frame required by the seven-region reporting structure. General video conferencing for internal meetings, physical venue hire and audiovisual production, learning management systems sold separately, marketing automation suites, and consumer streaming and entertainment platforms are excluded from scope.
Quantitative Units
USD billions, platform subscription, usage and attributable service revenue at supplier level
Segmentation Dimensions
Platform function, end-use profession, commercial model, region
Regions Covered
North America, Western Europe, East Asia, South Asia and Pacific, Latin America, Middle East and Africa, Eastern Europe
Countries Covered
United States, Canada, Mexico, Brazil, Colombia, Argentina, Chile, United Kingdom, Germany, France, Netherlands, Ireland, Sweden, Spain, Italy, Poland, Czechia, Hungary, Japan, China, South Korea, Singapore, India, Australia, New Zealand, Philippines, Indonesia, United Arab Emirates, Saudi Arabia, Kenya, Nigeria, South Africa
Key Companies Profiled
Zoom Communications, Cvent, ON24, RingCentral, Bizzabo, Kaltura, GoTo, Webex by Cisco, Microsoft, Swapcard, Hubilo, Vimeo, Notified, Splash, Eventbrite, Whova, Airmeet, InEvent, Stova, Blue Sky eLearn
Quantitative Methodology
Primary survey, n=3,800 respondents, Q4 2025, six countries; demand-side model with trade association cross-validation
Qualitative Methodology
47 expert interviews, Q4 2025; applied to validate demand model assumptions, identify emerging dynamics, and assess competitive positioning
Report Format
PDF and XLSX data workbook (Word format preview document)
Publisher
Market Minds Advisory
Report Code
MMA-2026-TEC-181
Published
September 2026
Contact
sales@marketmindsadvisory.com | www.marketmindsadvisory.com

Purchase the full Demand for Virtual Event Platforms in USA Report (2026 to 2036).

The full MMA report separates the part of this market held together by professional credit from the part defending itself quarterly against paid search, and shows why those two run on entirely different economics. It sizes the market to 2036 across six platform functions, seven regions and 32 countries, with segment growth rates and regional demand mechanisms detailed. Competitive analysis covers 20 suppliers assessed on measured platform subscription and service revenue, with moat and risk assessment for the two leaders. The report quantifies integration cost structure, credentialing economics and margin architecture across three portfolio tiers. It closes with four verdicts and an anonymised professional association engagement.
Six platform functions sized through 2036
Seven regions with demand mechanism analysis
Twenty suppliers on consistent revenue basis
Completion, attribution and contact cost benchmarks
Margin architecture across three portfolio tiers
Anonymised professional association programme review engagement

Built For The People Who Decide

From boardroom strategy to bench-side execution, this report is read cover-to-cover by leaders shaping the next decade of their industry, turning demand scenarios, market dynamics and valuation benchmarks into decisions.
CXOs/ Presidents/ VPs/ Managers
M&A and Corporate Development
Strategy Teams and R&D Heads
Procurement and Product Directors
Regulatory and Compliance Leaders
Investor Relations and Equity Analysts