Market Minds Advisory
United States Stainless Steel IBC Market

United States Stainless Steel IBC Market: United States Stainless Steel IBC Market: Everything Depends On The Return Trip

A stainless container costs many times what plastic does and earns that back only across repeated trips, which makes empty return freight and asset loss the numbers deciding whether the model works.

Lead Analyst

Published

August 2026

Make Smarter Decisions with Customized Research Insights

Request a free sample report and evaluate market opportunities, growth trends, and competitive dynamics relevant to your business needs.

2025 MARKET VALUE$2.4BMarket Size 2025
2036 FORECAST VALUE$5.0BBase Case , 2026 to 2036
CAGR 2026 TO 20366.8 %Bull 8.0% / Bear 5.6%
INCREMENTAL OPPORTUNITY$2.4BNet 10- year value creation
EXPANSION MULTIPLE1.93x2036 value over 2026 base
Strategic Levers
M&A Pipeline
Regional Outlook
Country Rankings
Competitive Intelligence
Segmental Deep-dive
Call-Us : 91 93563 13602

Executive Snapshot and Market Trajectory.

A stainless intermediate bulk container is an asset rather than a package, and its economics live entirely in the return trip. Payback arrives somewhere around the fifth or sixth round trip in a year, so the fleet that turns quickly earns and the fleet that sits does not.
East Asia holds 30% of value on chemical and food processing volume concentrated across the region, with North America at 27% on hazardous goods requalification requirements that are unusually demanding. Tracked and instrumented containers grow at 10.2%, half again the market rate of 6.8%, because roughly 4.6% of deployed assets disappear annually into customer yards and scrap merchants, and stainless carries scrap value that plastic simply never has.
Concentration reaches 29% and the meaningful competition has moved from container manufacture toward cleaning capacity, requalification services and pooled fleet management. Wash stations rather than fabrication shops are the genuine constraint in food and pharmaceutical service. Whoever certifies the wash carries the cross-contamination liability, and that is a position competitors find very hard to attack on price alone. The wash certificate is worth more commercially than the welding behind it. Fabricators find that difficult.
Market Definition
The market covers stainless steel intermediate bulk containers supplied to chemical, food, pharmaceutical, cosmetic and industrial users, including standard non-pressure containers, UN rated hazardous goods containers, pressure rated and ASME certified containers, hygienic and pharmaceutical grade containers, insulated and jacketed containers, and tracked and instrumented containers. Plastic and composite IBCs, drums, road tankers, ISO tank containers, fixed process vessels, and filling and discharge equipment are excluded.
Base Year Value
$2.4B in 2025 (MMA Primary Research Dataset, August 2026)
Forecast Period
2026 to 2036, eleven discrete annual values
CAGR
6.8% base case. Bull 8.0%. Bear 5.6%.
Fastest Growth Segment
Tracked and Instrumented IBCs: 10.2% CAGR
Fastest Growth Country
India: 9.0% CAGR
Fastest Growth Region
South Asia and Pacific: 8.8% CAGR
Largest Region
East Asia: 30% of 2025 global value
Market Leaders
Hoover Ferguson Group, THIELMANN, Schäfer Container Systems, Müller GmbH, Precision IBC. Source: MMA Analysis based on disclosed bulk container and tank equipment revenue, company annual reports 2025.
Primary Survey
n=3,800 procurement and R&D decision-makers, Q4 2025, six countries
Methodology
Demand-side build-up, cross-validated against public data, 47 expert interviews

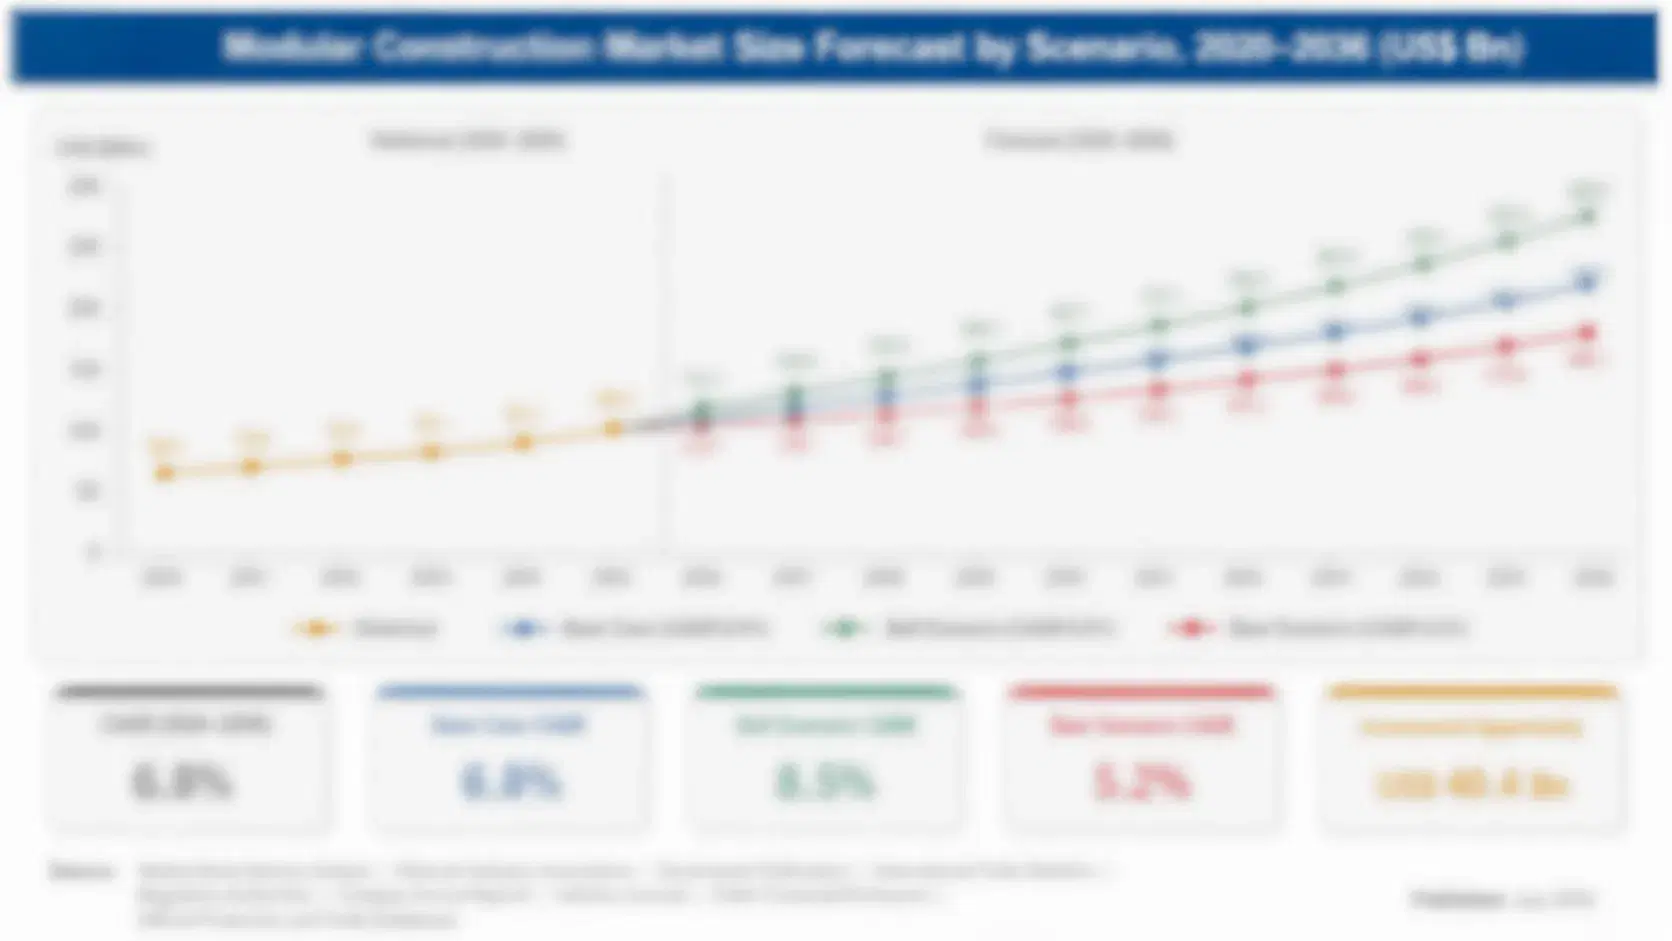
United States Stainless Steel IBC Market Forecast Scenarios

united-states-stainless-steel-ibc-market-size-forecast-scenario-1787696190788
Growth from 2020 to 2025 ran at 5.8% and stainless pricing moved reported value more than fleet additions did. Nickel and chromium surcharges swung sharply through 2022, which lifted container prices without lifting the number of assets deployed anywhere. Pooled and leased fleet arrangements expanded through the period as chemical and food users decided that owning containers was capital they would rather deploy elsewhere in their operations.
The 6.8% base case rests on three mechanisms. Hazardous goods requalification schedules generate a service annuity that grows with the deployed fleet rather than with new container sales, and every UN rated container returns for testing on a fixed interval. Hygienic and pharmaceutical service keeps expanding as contract manufacturing grows. And tracking adoption keeps rising because asset loss at 4.6% a year is a cost that finally became visible to finance departments.
The bull case at 8.0% assumes tracking adoption accelerates as loss rates get properly measured and pooled operators pass the savings into pricing. The bear case at 5.6% is chemical users reverting to composite IBCs for non-critical service, since a single-trip plastic container avoids return freight entirely and the stainless payback calculation collapses whenever turn rates fall below about four trips.

The Asset That Has To Come Back

The container costs many times what a composite IBC does and earns nothing until it comes back. Payback lands around the fifth or sixth round trip in a year against a fleet average of 7.4, which leaves less margin than the headline suggests. Empty return freight is the cost that kills it, because a returning container occupies a full trailer position while carrying nothing at all.
FIVE-FIRM CONCENTRATION29%Share of bulk container revenue held by leading suppliers
STANDARD CONTAINER PRICE$2,850Typical selling price for a standard stainless bulk container
TOP PRODUCING COUNTRYChina 24%Chinese share of global stainless bulk container manufacturing output
ANNUAL TURN RATE7.4 tripsRound trips a deployed container completes across a year
ASSET LOSS RATE4.6%Containers lost yearly to customer retention or scrap sale
REQUALIFICATION INTERVAL30 monthsPeriod between mandatory leak tests for hazardous goods service
Assets disappear at roughly 4.6% a year and the reason is uncomfortable. Stainless carries genuine scrap value, unlike plastic, so a container that goes missing is worth something to whoever has it. Some simply sit forgotten in customer yards for years. Tracking exists to fix this and adoption at 10.2% growth reflects finance departments finally seeing the number rather than any technical advance in the hardware itself.
Cleaning is the capacity constraint that fabrication is not. Food, pharmaceutical and cosmetic service requires certified cleaning between products, and whoever certifies that wash carries cross-contamination liability if a batch is later affected. Wash station capacity is limited and geographically uneven. Suppliers who built cleaning networks hold positions that container manufacturing quality does not threaten, since anybody can weld stainless and very few will accept the liability.
"Nobody buys these containers. They buy trips. Once you understand that, the whole industry stops looking like fabrication and starts looking like a rental fleet with a chemistry problem attached to it."
Director, Bulk Handling and Containment Practice · MMA Industrial Packaging Practice · August 2026

Market Trends

Pooled Fleet Models Displace Outright Container Ownership

Chemical and food users increasingly conclude that owning containers ties up capital that belongs elsewhere in the business, and pooled arrangements shift both the asset and the return logistics onto an operator who manages many fleets at once. That operator can balance flows between customers in ways a single user never can, which lifts turn rates above the seven or so a captive fleet achieves. Container manufacturers selling outright compete against a model that removes their customer's reason to buy anything. Ownership is the thing being displaced here. Fabricators lose the relationship.
Market Impact: Recurs every 30 months per container
Tracking Adoption Follows Loss Rate Measurement

Roughly 4.6% of deployed containers disappear annually into customer yards or scrap merchants, and stainless carries a scrap value that makes disappearance worth somebody's while. Most fleet owners never measured that rate before instrumentation made it visible, and finance departments respond quickly once they see it expressed in replacement capital. Growth at 10.2% therefore follows measurement rather than any advance in the tracking hardware, which has been technically adequate for years without being widely adopted. Loss expressed as replacement capital moves a budget conversation that a feature list never did. Finance signs it off.
Market Impact: Serves 3 regulated manufacturing categories

Market Opportunities and Growth Drivers

Requalification Schedules Create Recurring Service Revenue

United Nations rated containers in hazardous goods service require leak testing on a thirty month cycle and full periodic inspection at longer intervals, which is a legal obligation rather than a maintenance preference. That converts every deployed container into recurring service revenue that arrives on a schedule the fleet owner cannot renegotiate. Service providers with approved testing facilities capture that flow, and it grows with the installed fleet rather than with new container sales, which behave very differently. Testing capacity is limited and geographically uneven. That constrains who captures the annuity.
Market Impact: Doubles freight across 2 legs

Contract Manufacturing Expands Hygienic Container Demand

Pharmaceutical, nutraceutical and cosmetic contract manufacturing has grown steadily and those operations move intermediates between sites in containers that must be cleaned and certified between products. Hygienic and pharmaceutical grade containers with documented surface finish and drainability carry requirements ordinary industrial containers do not meet at all. Demand follows contract manufacturing capacity rather than end product volume, which means it concentrates wherever those facilities cluster and grows faster than the underlying consumer categories do. Documentation requirements exceed anything industrial service demands, and a container that cannot be validated clean has no value here whatsoever.
Market Impact: Limits capacity across 3 categories

Market Restraints and Challenges

Empty Return Freight Undermines The Payback Calculation

A returning container occupies a full trailer position while carrying nothing, so every trip is paid for twice on freight that generates no revenue at all. Root cause is that a rigid reusable asset cannot be collapsed or nested the way some returnable formats can. The commercial impact is that payback collapses whenever turn rates fall below roughly four trips a year, which happens on long-haul routes. Mitigation runs through pooled operators balancing flows between customers to shorten empty legs. Long-haul routes rarely support the economics. Pooling shortens the empty leg.
Market Impact: Lifts turn rates above 7 trips

Cleaning Certification Carries Cross-Contamination Liability Exposure

Food, pharmaceutical and cosmetic service requires certified cleaning between products, and whoever signs that certificate carries responsibility if a later batch is affected by residue. Root cause is that cleaning validation depends on the previous contents, which the wash station often knows only from a declaration form. The commercial impact is that many potential service providers decline the liability entirely, which limits wash capacity geographically. Mitigation involves dedicated container allocation by product family, which reduces flexibility considerably. Dedicated allocation makes the certificate defensible. Flexibility is the price paid for it.
Market Impact: Addresses 4.6% annual asset loss
3 additional market trends, 4 additional growth drivers, and 2 additional restraints and challenges are covered in the full report. Contact sales@marketmindsadvisory.com to access the complete intelligence.

Segment CAGR and Growth Architecture

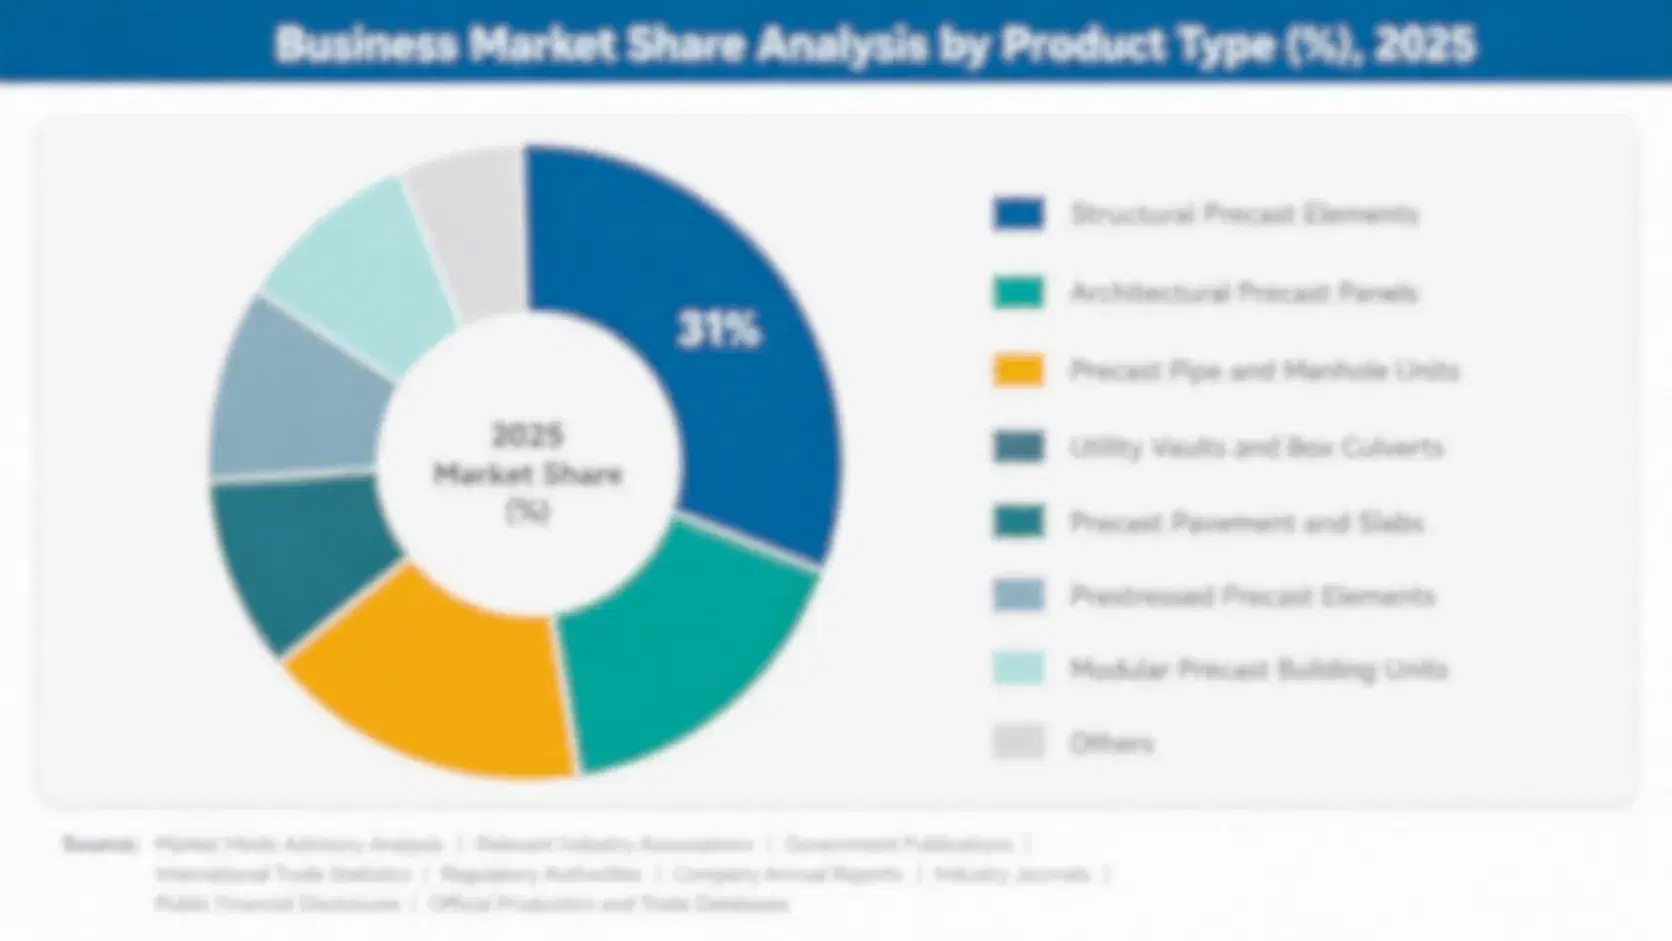
Segmentation follows container specification: what the vessel is built and certified to do, rather than which industry deploys it or how the fleet is commercially arranged. Six specifications cover the market without overlap, from standard non-pressure containers through to tracked and instrumented units. Service arrangement and end-use industry are treated as separate dimensions here.
united-states-stainless-steel-ibc-market-market-share-analysis-1787696190963

Tracked and Instrumented IBCs

Roughly 4.6% of deployed containers disappear each year into customer yards or scrap merchants, and stainless carries a scrap value that makes that disappearance worth somebody's trouble. Growth at 10.2%, half again the market rate of 6.8%, follows finance departments finally seeing the loss expressed as replacement capital rather than any advance in tracking hardware, which has been adequate for years. Temperature and fill monitoring add value beyond location for regulated products. What suppliers are genuinely selling here is measurement of a cost their customers previously carried without ever quantifying it. Fleet owners who never counted the loss were never going to buy the hardware, whatever its specification claimed. Measurement precedes purchase.
CAGR 10.2%

Hygienic and Pharmaceutical Grade IBCs

Contract manufacturing in pharmaceuticals, nutraceuticals and cosmetics moves intermediates between sites in containers that must be cleaned and certified between every product change. Surface finish, weld quality and complete drainability are specified and documented rather than assumed, and a container that cannot be validated clean is worthless in this service regardless of how well it was fabricated. Growth at 8.8% follows contract manufacturing capacity rather than end product volume. The cleaning certificate matters more commercially than the container, since liability for residue follows whoever signed it. Cleaning capacity rather than fabrication capacity is what actually limits how much of this work any supplier can take on. Validation decides everything. Fabrication quality is assumed rather than sold.
CAGR 8.8%
Full segment breakdown across 6 segments available in the complete report.

Regional Architecture and Country Demand Map

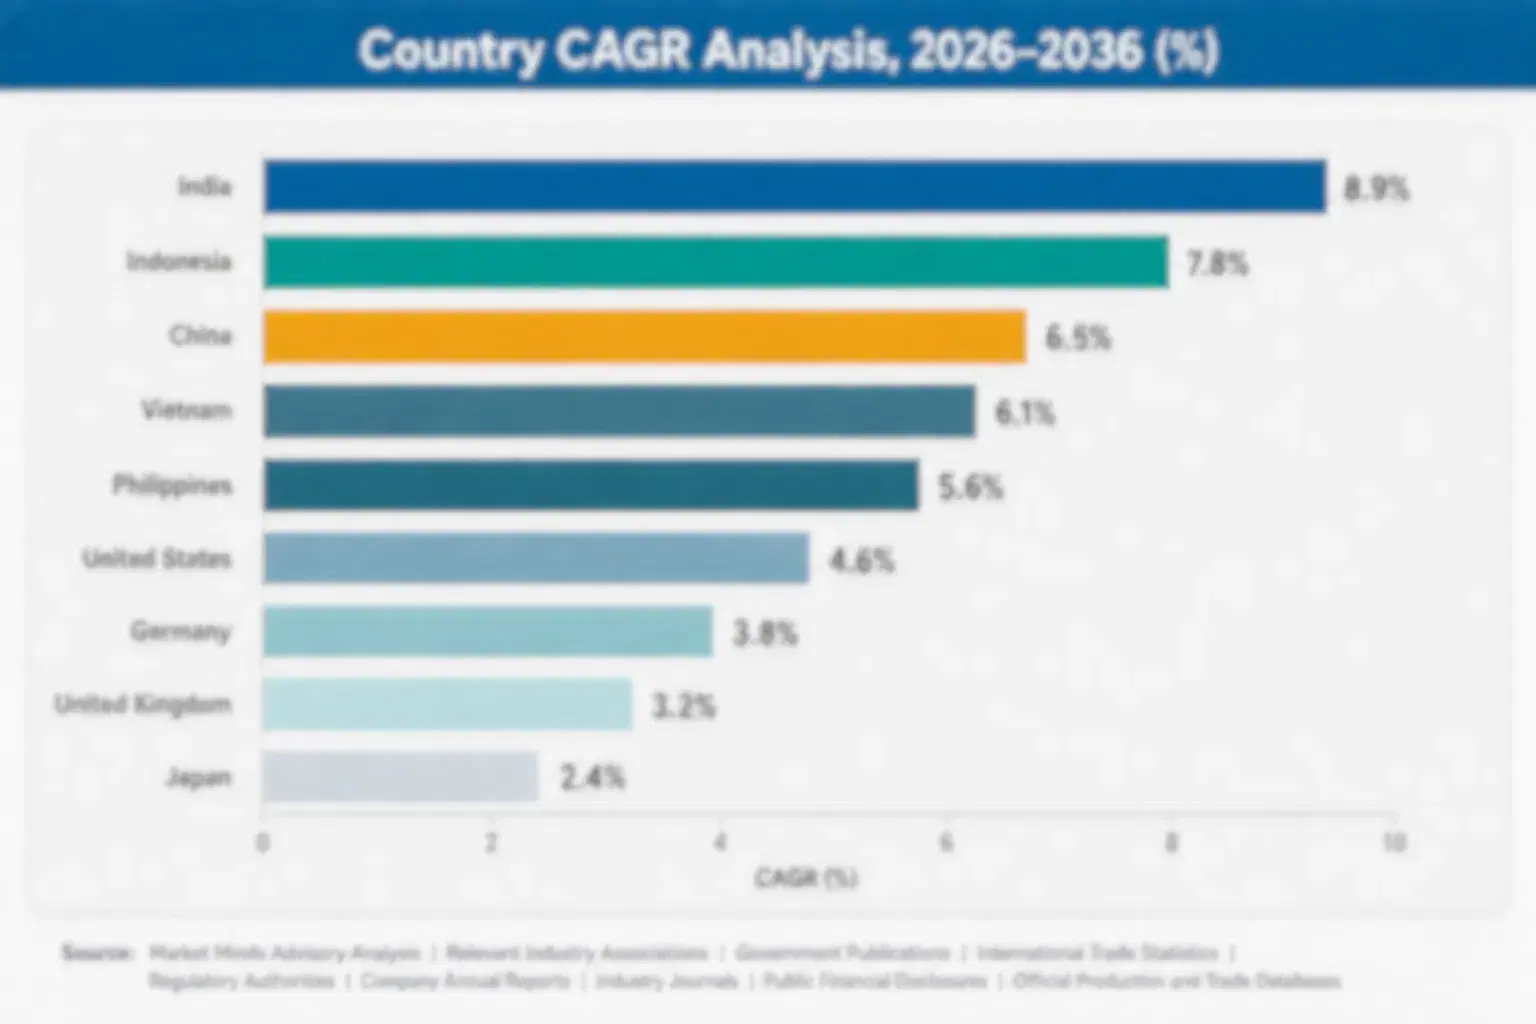
Geography follows chemical and food processing volume together with regulatory intensity around hazardous goods and hygienic service. East Asia leads on processing scale, North America follows on requalification requirements, and South Asia grows fastest across the forecast period. Turn rates vary enormously between regions. Payback follows accordingly.

North America

Hazardous goods requalification enforcement is unusually consistent here, which turns the thirty month leak testing cycle into predictable service revenue rather than a compliance formality that gets deferred. Chemical processing along the Gulf Coast and pharmaceutical contract manufacturing across the Northeast and Puerto Rico generate most container demand. Wash station capacity is geographically uneven and concentrated near those clusters, which shapes where fleets can practically operate. Long domestic hauls depress turn rates on some routes, and pooled operators compete specifically on their ability to shorten empty return legs. Asset loss is measured more consistently here than elsewhere, which is why tracking adoption runs ahead of most other regions across the deployed fleet.
Share: 27% | CAGR: 6.2% (2026 to 2036)

Western Europe

European chemical processing in Germany, the Netherlands and Belgium supports a dense container fleet operating over short distances, which produces turn rates well above the American average and improves payback considerably. Pooled and leased fleet models are more established here than anywhere, with operators managing flows across borders that would be single-country routes elsewhere. Cleaning and requalification networks are correspondingly mature. Hygienic service demand follows pharmaceutical manufacturing concentrated in Ireland, Switzerland and Germany, where documentation requirements exceed what industrial service ever requires. Short return distances between industrial clusters lift turn rates well above what long-haul geographies achieve, which improves the payback calculation materially for operators. Pooled models dominate here. Cross-border flows work well.
Share: 22% | CAGR: 5.2% (2026 to 2036)
Regional intelligence for 5 additional markets available in the complete report: East Asia, South Asia and Pacific, Latin America, Middle East and Africa, Eastern Europe. Contact sales@marketmindsadvisory.com.
united-states-stainless-steel-ibc-market-country-cagr-analysis-1787696191144

Selling Trips Rather Than Containers

Payback needs roughly five trips a year against a fleet average of 7.4, loss runs at 4.6% annually, and cleaning capacity rather than fabrication limits regulated service. Four levers work on return logistics, loss measurement, cleaning liability and requalification scheduling rather than on container pricing at all. Container pricing is the least of it.

Balance Return Flows Across Multiple Customer Fleets

A returning container occupies a full trailer position carrying nothing, and payback collapses below roughly four trips a year on long-haul routes. An operator managing several customer fleets can match one customer's outbound leg against another's return, which lifts turn rates well above the 7.4 a captive fleet achieves. That capability cannot be replicated by a single user or by a fabricator selling outright. It also makes the operator very difficult to remove once flows are balanced around them. Flows are hard to unpick afterward. Utilisation carries the whole return.
Market Impact: Lifts turn rates beyond the 7.4 annual average

Measure Asset Loss Before Selling Any Tracking

Around 4.6% of deployed containers disappear annually and most fleet owners have never measured it, which is precisely why tracking sold poorly for years despite being technically adequate. Running a measurement exercise first converts an abstract feature into a replacement capital number that a finance department acts on immediately. Suppliers who lead with hardware specifications lose to suppliers who lead with the customer's own loss rate. Growth at 10.2% is going to the second group consistently. Nobody buys a feature list. Replacement capital is what persuades. Hardware specifications persuade nobody at all.
Market Impact: Quantifies the whole 4.6% annual fleet loss rate

Accept Cleaning Liability Competitors Will Not Take

Certified cleaning between products carries cross-contamination responsibility, and many potential providers decline it entirely, which is why wash capacity limits regulated service across 3 major categories rather than fabrication capacity doing so. Suppliers who build validated cleaning networks and accept the certificate hold positions that container quality does not threaten. The liability is real and manageable through dedicated allocation by product family. The commercial protection it buys is considerably greater than the exposure it creates. Few competitors will follow. Liability accepted becomes position held. Wash capacity is the genuine bottleneck.
Market Impact: Covers all 3 of the regulated service categories

Schedule Requalification Around Customer Production Calendars

Hazardous goods containers require leak testing every thirty months, and a container in a test facility is a container not earning anything for its owner. Providers who schedule testing against a customer's own production calendar rather than their own workshop convenience remove downtime that customers currently absorb silently. It costs planning effort rather than capital. Fleet owners notice immediately, because availability is the number their operations team is actually measured on internally. A container sitting in a test facility for 2 weeks is 2 weeks of lost trips, and nobody had costed that before being shown it.
Market Impact: Removes downtime from the 30 month test cycles

Who Controls the Margin Pool

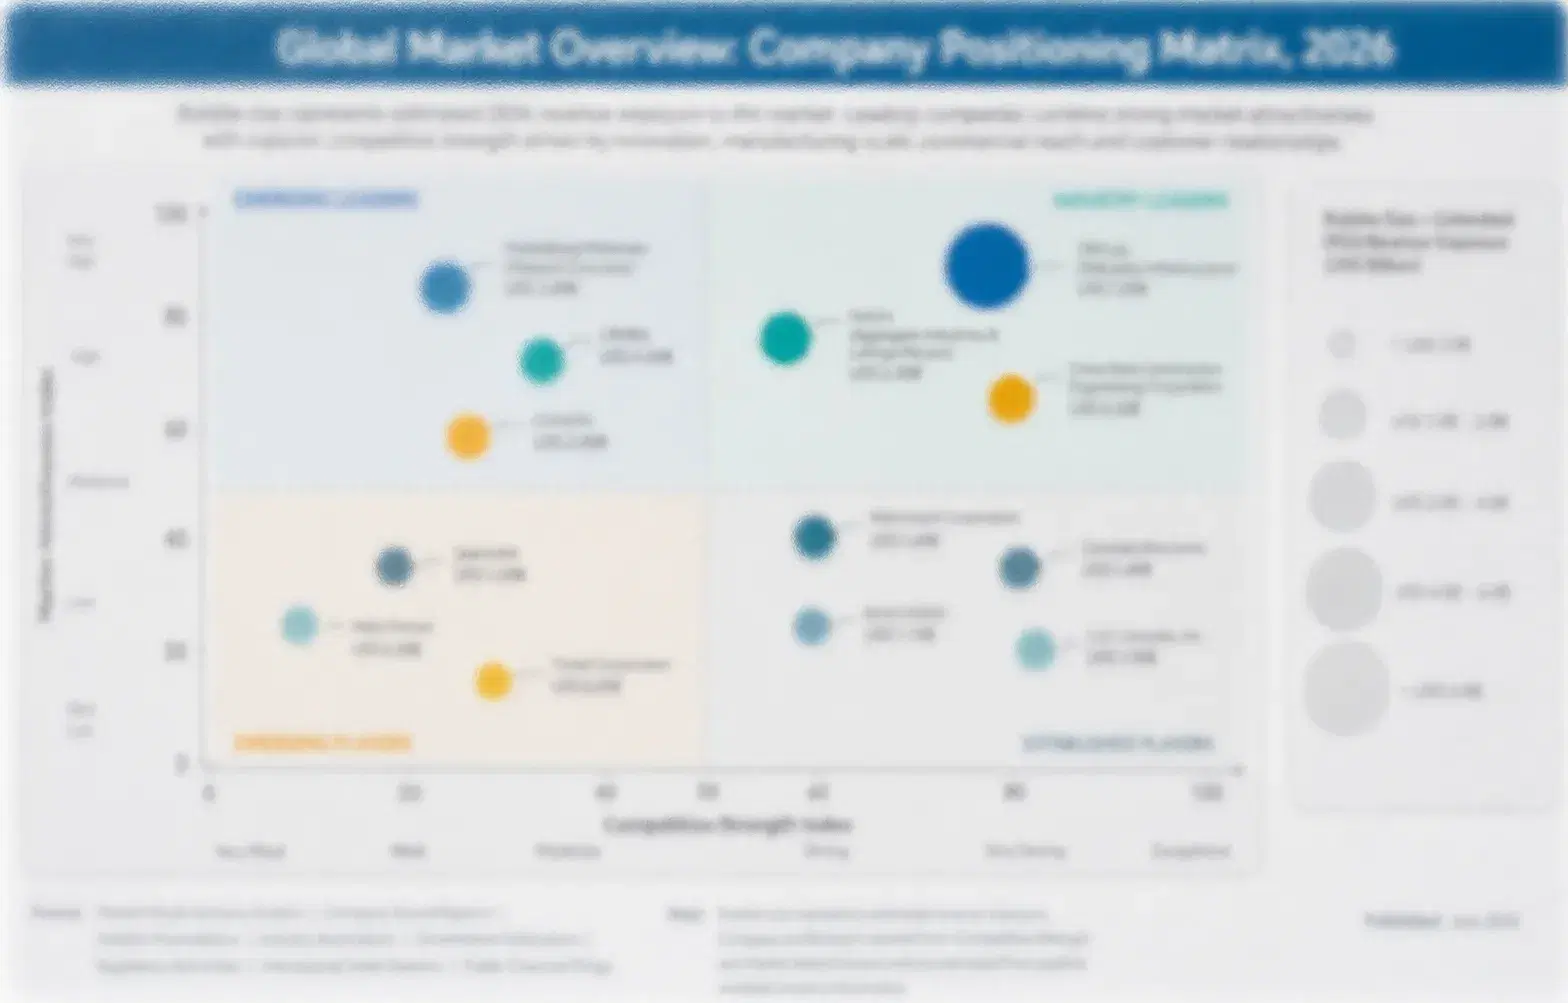
Measured on disclosed bulk container and tank equipment revenue, the five largest suppliers hold a CR5 of 29%, and the number understates how competition actually works because fabrication and service are different businesses with different economics. Hoover Ferguson and THIELMANN operate service and fleet networks alongside manufacturing, while several capable fabricators compete on container quality alone and find that quality decides less than they expect. Comparable containers do not produce comparable businesses.
Three contests define activity here. Container fabrication competes on price and lead time among suppliers whose products are genuinely comparable once certified to the same standard. Fleet and pooled operations compete on return flow balancing and asset availability. Cleaning and requalification services compete on network coverage and on willingness to carry contamination liability, which many providers refuse outright. A supplier organised around one contest is rarely equipped for the others.

Pressure builds as users shift from ownership toward pooled arrangements, which removes the fabricator's customer relationship entirely and replaces it with an operator who buys on different criteria. Rankings shift toward whoever holds cleaning and requalification network coverage, since those constrain regulated service in ways manufacturing capacity never does. Fabrication capacity never was the constraint.
united-states-stainless-steel-ibc-market-company-positioning-matrix-1787696191326

Competitive Moat and Risk Dimensions

HOOVER FERGUSON GROUP

Moat: Integrated Fleet Service Network

Hoover Ferguson combines container supply with cleaning, requalification and fleet management across a network that lets it balance return flows between customers rather than within one. That combination took years to assemble and cannot be replicated by a fabricator adding services gradually. A customer whose empty legs are already matched against another fleet has very little reason to test alternatives.
HOOVER FERGUSON GROUP

Risk: Chemical Cycle Volume Exposure

Fleet utilisation depends on chemical and industrial production volumes that move with cycles the company does not influence at all. A downturn leaves deployed assets idle while fixed service network costs continue running regardless. The integrated model that produces resilience in normal conditions concentrates operating leverage precisely when volumes fall away.
THIELMANN

Moat: Hygienic Specification Technical Depth

THIELMANN holds strong positions in hygienic and pharmaceutical grade containers where surface finish, weld quality and validated drainability are documented rather than claimed. Those specifications are written into customer quality systems, which makes substitution a change control matter rather than a purchasing decision. A competitor offering an equivalent container still faces a validation process nobody wants to schedule.
THIELMANN

Risk: Limited Return Logistics Control

Technical depth in container specification does not address the return freight and turn rate economics that determine whether a customer's fleet earns anything. Pooled operators competing on flow balancing reach the same customers on a dimension that container quality does not touch. Specification wins the qualification and logistics wins the ongoing relationship.

Players Tracked

Prominent Players

Hoover Ferguson Group
THIELMANN
Schäfer Container Systems
Müller GmbH
Precision IBC

Other Key Players

Custom Metalcraft
Metano IBC Services
Greif
Mauser Packaging Solutions
Time Technoplast
Balmer Lawrie
Alloy Products Corp
Feldmeier Equipment
Paul Mueller Company
Walker Stainless Equipment
Roth Industries
Sicagen India
Shanghai Rongtai
Jiangsu Yongjin
Snyder Industries

Recent Developments

APRIL 2025

Specialty chemical producer transfers owned fleet to pooled operator

A specialty chemical producer transferred its owned container fleet to a pooled operator under a multi-year service agreement, a commercial arrangement rather than any acquisition. Capital tied up in idle assets and turn rates well below the deployed fleet average had made outright ownership difficult to justify against the alternative.
Signal: Pooling removes the fabricator's customer relationship and replaces it with an operator buying on entirely different criteria.
AUGUST 2025

Fleet owner publishes measured container loss and recovery data

A fleet owner published measured asset loss figures after instrumenting its container population, an organic disclosure rather than any transaction. The measured rate exceeded internal assumptions substantially, and the replacement capital involved changed how the finance function viewed tracking investment across the whole operation. Nobody had counted it before.
Signal: Measurement rather than hardware capability is what finally moved tracking adoption after years of technical readiness.
DECEMBER 2025

Container service provider commissions dedicated pharmaceutical cleaning facility

A container service provider commissioned a cleaning facility dedicated to pharmaceutical and nutraceutical service, an organic capital investment rather than any acquisition or joint venture. Existing capacity had been declining hygienic work because cross-contamination liability on validated cleaning is a commitment many providers refuse to make.
Signal: Cleaning capacity rather than fabrication capacity is what actually constrains regulated container service across most regions.

What A Container Actually Costs

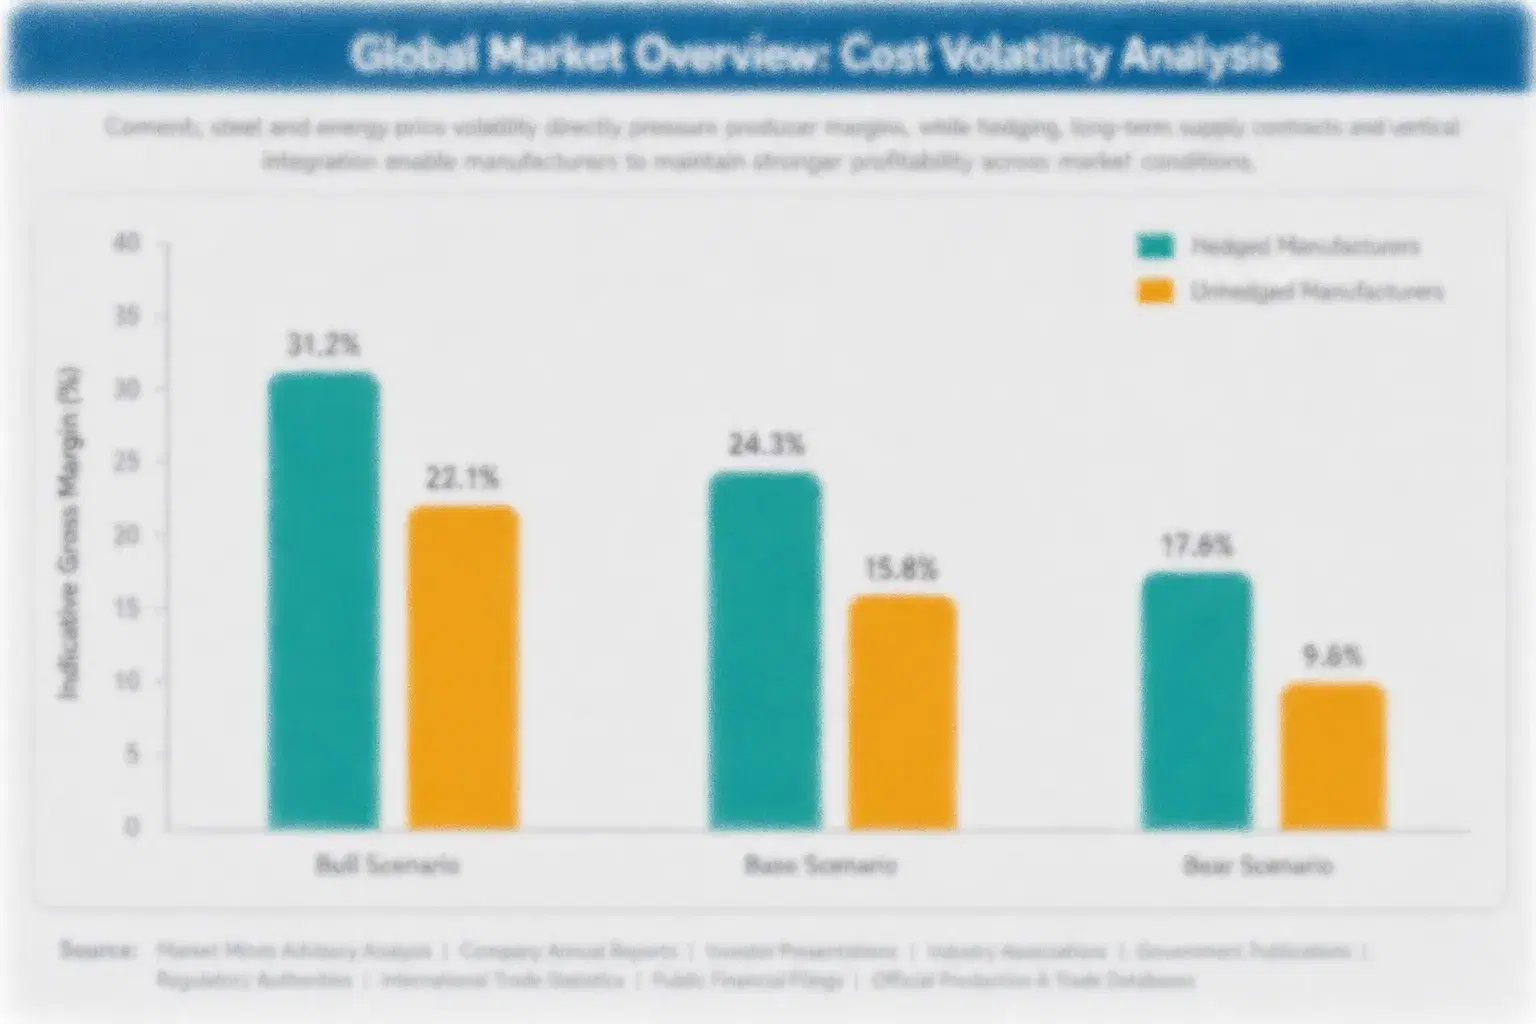
Stainless dominates the manufactured cost and nothing else comes close. Grade 304 and 316 sheet and fittings account for 52 to 61% of fabrication cost, with the alloy surcharge on nickel and chromium moving independently of the base steel price. Fabrication labour follows and is higher in Western markets. For a fleet operator the picture inverts, since freight and service dominate over the asset's life.
The volatility that mattered was the nickel move. Nickel pricing spiked violently in early 2022 and alloy surcharges followed, lifting container prices without any change in demand, which EIA and IEA commodity and energy data document across that period. Fabricators quoting fixed prices on long lead orders absorbed the increase entirely. Those with surcharge pass-through clauses did not, and reported margins showed the difference. Both effects hit the same quarter.

Exposure divides by business model rather than by geography. Fabricators selling containers outright carry alloy surcharge risk on a product priced before the steel is bought. Fleet operators carry freight, cleaning and requalification costs instead, which move with energy and labour rather than with metals. European operators face higher energy and labour on cleaning, while Asian fabricators benefit from regional stainless supply.
united-states-stainless-steel-ibc-market-cost-volatility-analysis-1787696191514

Pass alloy surcharges through separately from base pricing

Nickel and chromium surcharges move independently of base stainless pricing and spiked violently in 2022, and fabricators quoting fixed prices on long lead orders absorbed the whole increase. Separating the surcharge contractually costs negotiation effort and removes exposure on the input that dominates fabrication cost. Suppliers on single fixed prices found out the hard way.

Price fleet service on trips not assets

A container earns nothing while it sits, and turn rates vary widely between customers and routes regardless of how the asset was priced originally. Charging against completed trips rather than deployed units aligns revenue with the economics that actually govern the model. It also gives the operator a direct commercial reason to shorten empty return legs continuously.

Allocate containers by product family for cleaning

Cross-contamination liability on validated cleaning is what makes many providers refuse regulated service, and validation difficulty rises with the variety of previous contents a container has held. Allocating containers to product families reduces that variety and makes the certificate defensible. It costs fleet flexibility, which is a real price worth paying for the liability position it creates.

Portfolio Architecture for Margin Defence

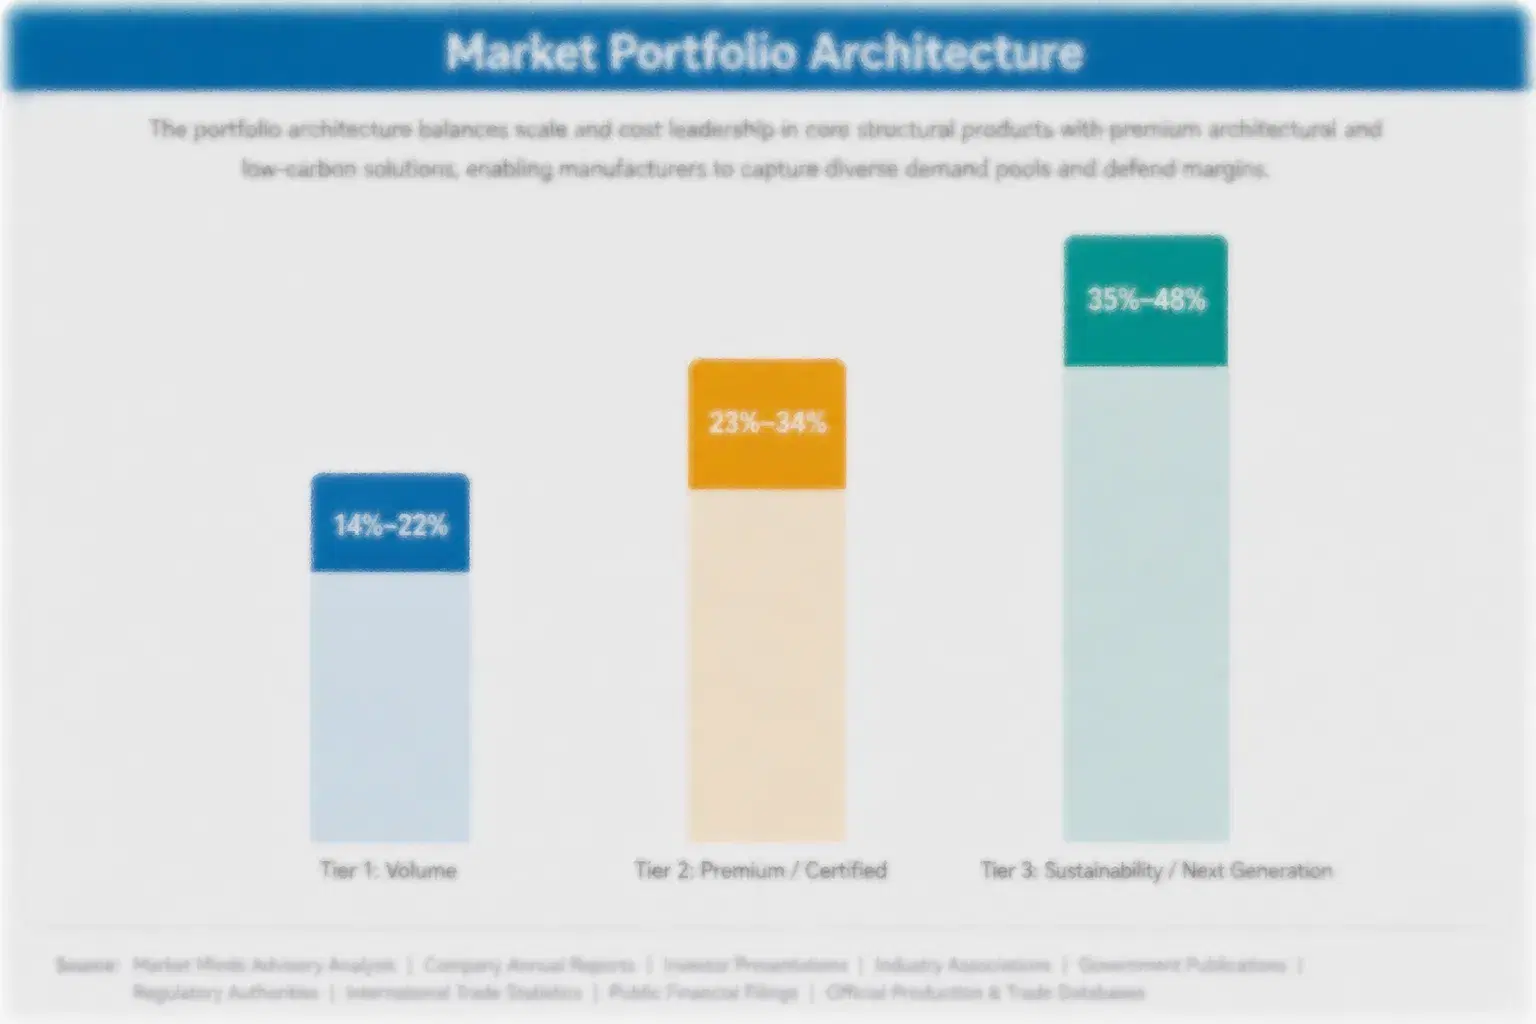
Margin follows service position rather than fabrication capability. Standard non-pressure containers are comparable once certified and priced accordingly, with alloy surcharge exposure sitting on whoever quoted first. UN rated and pressure certified containers earn better on certification and testing capability. Hygienic and pharmaceutical grade containers earn considerably more because validation and cleaning liability limit who can serve the work at all. Fleet management and tracking services earn most of all.
The tension runs between manufacturing volume and service returns, and they pull in different directions on capital. Fabrication fills a workshop and generates the scale that keeps a plant viable, while cleaning networks, requalification facilities and pooled fleets generate returns and require entirely different investment. Fabricators adding services gradually rarely reach network coverage that matters. Service operators without fabrication depend on suppliers who may compete with them directly.

High-value pools sit in three places. Cleaning and requalification network coverage, which constrains regulated service in a way manufacturing capacity never does. Pooled fleet operations where balanced return flows lift turn rates above what any captive fleet reaches. And tracking services sold against measured loss rather than against hardware specification, which is where growth at 10.2% is actually going.

Volume / Commodity-Adjacent

Standard non-pressure containers certified to common specifications where fabricators are genuinely comparable. The 7-point range separates suppliers with alloy surcharge pass-through clauses from those quoting fixed prices on long lead orders and absorbing metals volatility.
Gross Margin: 14-21%

Premium / Certified

UN rated hazardous goods containers, pressure rated and ASME certified vessels, and insulated or jacketed constructions. The 7-point spread separates suppliers holding approved testing and requalification facilities from those relying on third parties for certification work.
Gross Margin: 26-33%

Sustainability / Regulatory / Next-Generation

Hygienic and pharmaceutical grade containers, tracked and instrumented units, and pooled fleet management with cleaning and requalification services. The 18-point range is wide because cleaning liability, tracking services and fleet management command very different returns on very different capital bases.
Gross Margin: 31-49%
united-states-stainless-steel-ibc-market-portfolio-architecture-1787696191707

High-value Sub-segments and Strategic Watch-out

Cleaning and Requalification Networks

Highest value with steady growth, since cross-contamination liability limits who will serve regulated categories at all and coverage cannot be assembled quickly. The risk is that a contamination event traced to a certified wash creates exposure far larger than the revenue the service ever generated.
Gross Margin: 44-49%

Tracked and Instrumented Fleets

Fastest growth at 10.2% as measured loss rates convert an abstract feature into a replacement capital argument finance departments act on. The risk is that hardware commoditises quickly, leaving the durable value in fleet data services rather than in the instrumentation itself. Data outlasts the device.
Gross Margin: 38-43%

Standard Non-Pressure Containers

The volume core, comparable across certified fabricators and exposed to alloy surcharge movements that arrive after pricing. Fabricators hold the position because it carries workshop utilisation, and utilisation is what makes the certified and hygienic work economically possible. Nobody exits it willingly. Utilisation makes everything else possible.
Gross Margin: 15-20%

Turn Rate Dependency

The strategic watch-out. Payback collapses below roughly four trips a year, and long-haul routes push users toward single-trip composite containers that avoid return freight completely. The risk is that a fabricator's customer quietly discovers the stainless economics never worked on their particular routes. Composite alternatives are always available.
Gross Margin: 20-25%

Revenue From The Fleet

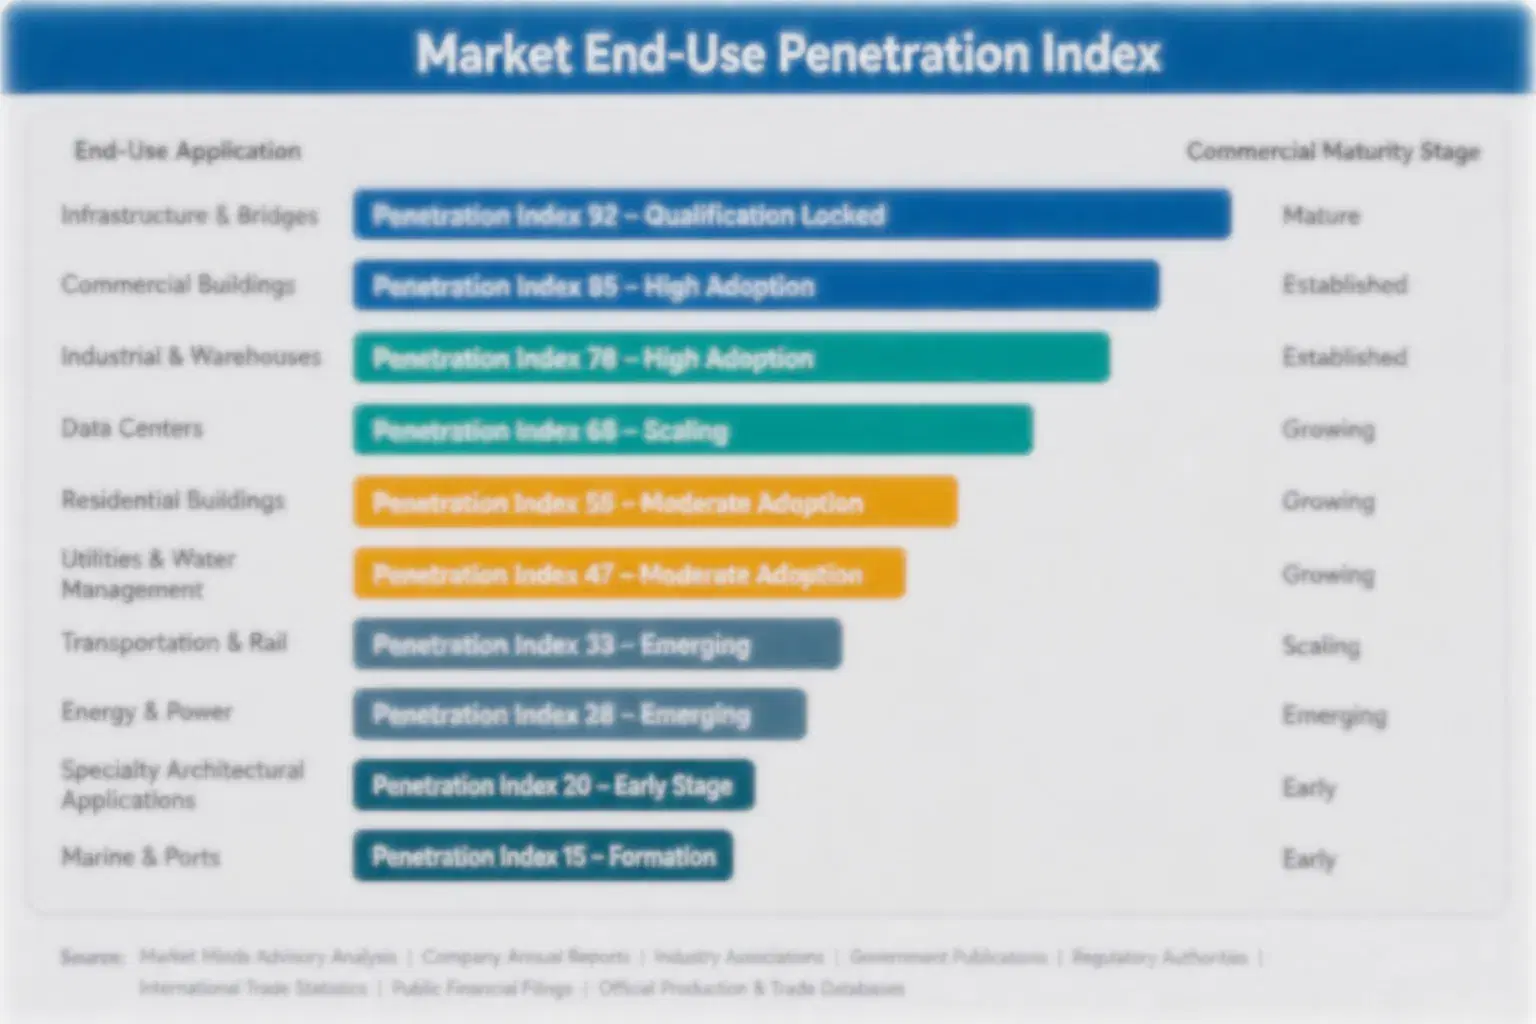
Container sales are lumpy and service revenue is not, which is the central architectural fact of this market. A fabricator sells a fleet once and waits years for replacement demand, while a service provider earns on every trip, every cleaning cycle and every thirty month requalification across the entire deployed population. The annuity grows with the installed fleet rather than with new sales.
Stickiness varies sharply by service type. Requalification is effectively locked, since approved facilities are limited and a container in transit to a distant test site earns nothing. Cleaning is locked wherever validated capacity is scarce and liability has been accepted. Pooled fleet arrangements become extremely hard to unwind once return flows are balanced around an operator. Container fabrication itself is not sticky at all and gets requoted whenever a fleet expands.

The buyer differs by service too. Container purchases run through procurement comparing certified fabricators on price and lead time. Cleaning and requalification are chosen by quality and regulatory functions who care about validation documentation. Pooled fleet decisions increasingly reach finance, because they convert capital expenditure into operating cost. Suppliers organised only for procurement compete where the fewest returns exist.
united-states-stainless-steel-ibc-market-end-use-penetration-index-1787696191894

Where The Returns Actually Sit

These are among the four positions where our research anticipates prominent divergence between winners and laggards over the coming forecast period. Each is grounded in the demand model, the regulatory perimeter, and the announced capacity pipeline.
01 / RETURN FLOW BALANCING

The empty leg decides whether anything works

A returning container occupies a full trailer position while carrying nothing at all, and payback collapses whenever turn rates fall below roughly four trips against a deployed fleet average of 7.4 a year. An operator managing several customer fleets can match one customer's outbound movement against another customer's return leg, which no single captive fleet operating alone can ever manage to do. That capability lifts utilisation and makes the operator extremely difficult to remove once flows have been balanced around them.
02 / LOSS MEASUREMENT FIRST

Sell the number before selling the hardware

Roughly 4.6% of deployed containers disappear each year into customer yards and scrap merchants, and most fleet owners have never measured that rate for themselves at all. Tracking hardware has been technically adequate for years and still sold poorly, because a hardware feature specification persuades nobody at all in a finance department. Suppliers who run a measurement exercise first convert the whole conversation into replacement capital, and the growth running at 10.2% annually is going almost entirely to that group.
03 / CLEANING LIABILITY ACCEPTANCE

Take the certificate competitors refuse to sign

Certified cleaning between products carries cross-contamination responsibility, and enough potential providers decline that responsibility that wash capacity rather than fabrication capacity now constrains regulated service across three major categories. Suppliers who build validated cleaning networks and accept the certificate themselves hold commercial positions that container fabrication quality cannot threaten in any way at all. The liability is genuine, and it stays manageable through dedicated container allocation by product family, and the protection it buys considerably exceeds the exposure it creates.
04 / SERVICE ANNUITY BUILDING

Every container returns on a fixed schedule

Hazardous goods containers require leak testing every thirty months as a legal obligation rather than a maintenance preference, which turns the whole deployed fleet into recurring revenue arriving on a calendar that nobody involved can renegotiate. That annuity grows with the installed population rather than with new container sales, and the two move on entirely different cycles. Providers who schedule testing around a customer's production calendar rather than their own workshop convenience win availability arguments that operations teams genuinely care about.

Engagement Snapshot From the Field

A live engagement with an industry participant carrying material or product regulatory and market exposure ahead of a defining policy shift, showing how our research translates into a defensible multi-year portfolio strategy.
MARKET MINDS ADVISORY · CLIENT ENGAGEMENT SUMMARY
United States Stainless Steel IBC Producer Strategic Portfolio Review and Transition Roadmap 2026·Investment Scenario on United States Stainless Steel IBC Exposure Evaluation 2025-26
CLIENT PROFILE
A stainless container fabricator with two manufacturing sites and a small cleaning and testing operation, serving chemical, food and pharmaceutical customers with reported revenue of 96 million dollars (client-reported, unverified by MMA). Roughly 82% of revenue came from container sales and the balance from cleaning and requalification. Fleet management services had been discussed internally for several years without ever being launched commercially.
STRATEGIC CHALLENGE
Container sales had flattened while two long-standing customers transferred owned fleets to pooled operators, removing volume the company had assumed was secure. Management was pursuing fabrication cost reduction and a wider container range. Neither addressed why customers were leaving ownership altogether, or why the service operation had never grown beyond its original scale.
MMA APPROACH
MMA modelled turn rates and total cost of ownership across the customer base using route and volume data the company held but had never analysed. Sixteen expert interviews with fleet managers, chemical logistics leads and quality functions established how pooling and cleaning decisions are actually made. The analysis treated return logistics and cleaning liability, rather than fabrication cost, as the drivers of both outcomes.
KEY FINDINGS
  1. Both departing customers ran turn rates below five trips annually on long-haul routes, which meant outright ownership had never made economic sense for them.
  2. The cleaning operation was declining pharmaceutical work because nobody internally would accept cross-contamination liability on validated washes for regulated products. Existing capacity had never been the constraint.
  3. Requalification testing was scheduled around workshop convenience, and three customers cited container availability during testing as their principal frustration. Nobody had asked them about it.
  4. Fleet management services modelled materially higher returns than the fabrication cost programme already underway (client-reported, unverified by MMA). Payback modelled inside three years on capability the business partly held.
CLIENT PROFILE
A stainless container fabricator with two manufacturing sites and a small cleaning and testing operation, serving chemical, food and pharmaceutical customers with reported revenue of 96 million dollars (client-reported, unverified by MMA). Roughly 82% of revenue came from container sales and the balance from cleaning and requalification. Fleet management services had been discussed internally for several years without ever being launched commercially.
STRATEGIC CHALLENGE
Container sales had flattened while two long-standing customers transferred owned fleets to pooled operators, removing volume the company had assumed was secure. Management was pursuing fabrication cost reduction and a wider container range. Neither addressed why customers were leaving ownership altogether, or why the service operation had never grown beyond its original scale.
MMA APPROACH
MMA modelled turn rates and total cost of ownership across the customer base using route and volume data the company held but had never analysed. Sixteen expert interviews with fleet managers, chemical logistics leads and quality functions established how pooling and cleaning decisions are actually made. The analysis treated return logistics and cleaning liability, rather than fabrication cost, as the drivers of both outcomes.
KEY FINDINGS
  1. Both departing customers ran turn rates below five trips annually on long-haul routes, which meant outright ownership had never made economic sense for them.
  2. The cleaning operation was declining pharmaceutical work because nobody internally would accept cross-contamination liability on validated washes for regulated products. Existing capacity had never been the constraint.
  3. Requalification testing was scheduled around workshop convenience, and three customers cited container availability during testing as their principal frustration. Nobody had asked them about it.
  4. Fleet management services modelled materially higher returns than the fabrication cost programme already underway (client-reported, unverified by MMA). Payback modelled inside three years on capability the business partly held.
RECOMMENDED STRATEGY
Phase 1: Phase one: reschedule requalification testing around customer production calendars, which costs planning effort rather than capital and addresses a stated frustration. Phase 2: Phase two: accept cleaning liability for pharmaceutical service with dedicated container allocation by product family to keep validation defensible throughout. Phase 3: Phase three: launch pooled fleet management for customers whose turn rates make ownership uneconomic, balancing return flows between them. Ownership had never suited those routes.
OUTCOME
Requalification rescheduling improved measured container availability and two accounts extended service agreements as a direct result. Pharmaceutical cleaning was accepted with product family allocation and the operation grew substantially within three quarters (client-reported, unverified by MMA). A pooled fleet offer launched with two customers whose ownership economics had never worked on their routes.

Frequently Asked Questions

Foundational context covering the market sizes, CAGR, scope, country, region and competition that inform every finding below. This section is provided to cover basics and most often pre-purchase conversations, answered from the MMA Primary Research Dataset.

What is the current size of the United States Stainless Steel IBC Market?

The market was worth 2.4 billion dollars in 2025, covering standard, UN rated, pressure certified, hygienic, insulated and tracked stainless containers. It reaches 2.56 billion dollars in 2026.

How large will the United States Stainless Steel IBC Market be by 2036?

MMA forecasts 4.95 billion dollars by 2036, an increase of 2.39 billion dollars over the 2026 base. That represents an expansion multiple of 1.93 times across the forecast period.

What is the CAGR for the United States Stainless Steel IBC Market 2026 to 2036?

The base case compounds at 6.8% annually. The bull case reaches 8.0% if tracking adoption accelerates on measured loss rates, while the bear case sits at 5.6% on reversion to composite containers.

Which segment is growing fastest?

Tracked and instrumented containers, at 10.2%, half again the market rate of 6.8%. Roughly 4.6% of deployed assets disappear annually into customer yards and scrap merchants.

Who are the major companies in the United States Stainless Steel IBC Market?

Hoover Ferguson Group, THIELMANN, Schäfer Container Systems, Müller GmbH and Precision IBC lead on disclosed bulk container revenue. Custom Metalcraft, Metano IBC Services and Greif hold strong regional positions.

Which country is growing fastest?

India at 9.0%, as specialty chemical and pharmaceutical contract manufacturing expand together across the country. China remains the largest producer at roughly 24% of global container output.

Report Segmentation Architecture

The full report scope spans multiple orthogonal segmentation dimensions, with cross-tabulated demand data provided for each dimension pair. Coverage extends further to regional breakdowns, trend trajectories, and the competitive detail needed to support segment-level decision-making.

By Container Specification

  • Standard Non-Pressure Stainless IBCs
  • UN Rated Hazardous Goods IBCs
  • Pressure Rated and ASME Certified IBCs
  • Hygienic and Pharmaceutical Grade IBCs
  • Insulated and Jacketed IBCs
  • Tracked and Instrumented IBCs

By End-Use Industry

  • Specialty and Fine Chemicals
  • Food and Beverage Ingredients
  • Pharmaceutical and Nutraceutical
  • Cosmetics and Personal Care
  • Paints, Coatings and Adhesives
  • Agricultural Chemicals

By Commercial Dimension

  • Outright Container Purchase
  • Operating Lease Arrangement
  • Pooled Fleet Management
  • Cleaning and Requalification Service
  • Tracking and Fleet Data Service
  • Rental and Short-Term Hire

By Region

  • North America
  • Western Europe
  • East Asia
  • South Asia and Pacific
  • Latin America
  • Middle East and Africa
  • Eastern Europe

Scope, Methodology, and Coverage

Every figure in this report is reproducible from documented input assumptions. The scope below maps the historical period, the forecast horizon, the segmentation dimensions, and the countries covered, alongside the underlying primary and qualitative methodology.
Historical Period
2020 to 2025
Forecast Period
2026 to 2036
Base Year
2025 (USD billions; MMA Primary Research Dataset, August 2026)
Market Definition
Scope covers stainless steel intermediate bulk containers supplied to chemical, food, pharmaceutical, cosmetic and industrial users, spanning standard non-pressure containers, United Nations rated hazardous goods containers, pressure rated and ASME certified containers, hygienic and pharmaceutical grade containers, insulated and jacketed containers, and tracked and instrumented containers. Plastic and composite intermediate bulk containers, steel and fibre drums, road tankers and ISO tank containers, fixed process vessels and storage tanks, and filling, discharge and cleaning equipment are excluded. Cleaning, requalification and fleet management services are analysed as commercial dimensions rather than as separate product segments.
Quantitative Units
USD billions (current prices); containers deployed; annual turn rate; asset loss percentage; requalification cycles completed
Segmentation Dimensions
By Container Specification; By End-Use Industry; By Commercial Dimension; By Region
Regions Covered
North America, Western Europe, East Asia, South Asia and Pacific, Latin America, Middle East and Africa, Eastern Europe
Countries Covered
USA, China, Germany, India, Netherlands, Japan, Brazil, Belgium, UK, South Korea, Italy, Poland, Turkey, Saudi Arabia, Australia
Key Companies Profiled
Hoover Ferguson Group, THIELMANN, Schäfer Container Systems, Müller GmbH, Precision IBC, Custom Metalcraft, Metano IBC Services, Greif, Mauser Packaging Solutions, Time Technoplast, Balmer Lawrie, Alloy Products Corp, Feldmeier Equipment, Paul Mueller Company, Walker Stainless Equipment, Roth Industries, Sicagen India, Shanghai Rongtai, Jiangsu Yongjin, Snyder Industries
Quantitative Methodology
Primary survey, n=3,800 respondents, Q4 2025, six countries; demand-side model with trade association cross-validation
Qualitative Methodology
47 expert interviews, Q4 2025; applied to validate demand model assumptions, identify emerging dynamics, and assess competitive positioning
Report Format
PDF and XLSX data workbook (Word format preview document)
Publisher
Market Minds Advisory
Report Code
MMA-2026-PAC-108
Published
August 2026
Contact
sales@marketmindsadvisory.com | www.marketmindsadvisory.com

Purchase the full United States Stainless Steel IBC Market Report (2026 to 2036).

The full report runs to 165 pages and covers all six container specification segments, seven regions and 20 profiled companies, with United States dynamics examined as the analytical focus throughout. It includes the complete segment CAGR set, regional turn rate and cleaning capacity analysis, and total cost of ownership modelling across representative route profiles. Company profiles carry evaluation on disclosed bulk container and tank equipment revenue, with moat and risk assessment for the top five suppliers. The competitive section extends to 14 tracked corporate developments across 2024 and 2025. Primary research inputs include a quantitative survey of 3,800 respondents and 47 expert interviews conducted in Q4 2025.
Six container specification segments with individual CAGR forecasts
Seven regional markets with turn rate and cleaning capacity data
Twenty company profiles on consistent revenue evaluation basis
Fourteen tracked developments with commercial interpretation and context
Total cost of ownership modelling across representative route profiles
Asset loss and recovery analysis by end-use industry category

Built For The People Who Decide

From boardroom strategy to bench-side execution, this report is read cover-to-cover by leaders shaping the next decade of their industry, turning demand scenarios, market dynamics and valuation benchmarks into decisions.
CXOs/ Presidents/ VPs/ Managers
M&A and Corporate Development
Strategy Teams and R&D Heads
Procurement and Product Directors
Regulatory and Compliance Leaders
Investor Relations and Equity Analysts