Market Minds Advisory
Prefabricated Building System Market

Prefabricated Building System Market: Prefabricated Building System Market: Off-Site Construction Demand, with USA Industry Focus

Acute construction labor shortages and compressed housing delivery timelines across the United States are pulling demand toward factory-built modular systems, forcing traditional site-builders to compete against off-site manufacturers for the first time at meaningful scale.

Lead Analyst

Published

October 2026

Make Smarter Decisions with Customized Research Insights

Request a free sample report and evaluate market opportunities, growth trends, and competitive dynamics relevant to your business needs.

2025 MARKET VALUE$8.5BMarket Size 2025
2036 FORECAST VALUE$18.3BBase Case , 2026 to 2036
CAGR 2026 TO 20367.2 %Bull 8.5% / Bear 5.9%
INCREMENTAL OPPORTUNITY$9.2BNet 10- year value creation
EXPANSION MULTIPLE2.00x2036 value over 2026 base
Strategic Levers
M&A Pipeline
Regional Outlook
Country Rankings
Competitive Intelligence
Segmental Deep-dive
Call-Us : 91 93563 13602

Executive Snapshot and Market Trajectory.

Prefabricated building demand in the United States is shifting from niche temporary and disaster-relief applications toward mainstream residential and healthcare construction, where factory quality control now decides specification outcomes across major procurement accounts and regional homebuilder portfolios nationwide. That shift is already visible in recent orders.
Acute construction labor shortages and compressed housing delivery timelines are the clearest commercial forces behind this shift, pulling volume toward factory-built residential systems even as traditional site-built construction demand grows only modestly. Modular healthcare facilities are the second fastest-growing application, concentrated heavily among hospital systems expanding capacity faster than traditional construction timelines allow. That dominance is becoming harder for traditional site-builders to challenge quickly. This gap keeps widening.
Competition splits between large national manufacturers controlling factory automation and quality certification, and smaller regional builders competing mostly on price for basic relocatable structures. Tightening building code modular certification and rising healthcare capacity pressure are pushing the fragmented regional tier toward consolidation or exit over the next several years as buyers increasingly demand documented delivery speed evidence. Buyers increasingly treat this bifurcation as permanent rather than cyclical. This split looks durable for now.
Market Definition
This report covers prefabricated building systems including modular residential, commercial, healthcare, and education facilities, panelized construction systems, and relocatable structures. It excludes traditional site-built construction and manufactured housing titled as vehicles under separate regulatory frameworks.
Base Year Value
$8.5B in 2025 (MMA Primary Research Dataset, October 2026)
Forecast Period
2026 to 2036, eleven discrete annual values
CAGR
7.2% base case. Bull 8.5%. Bear 5.9%.
Fastest Growth Segment
Modular Residential Housing: 10.1% CAGR
Fastest Growth Country
United States: 8.1% CAGR
Fastest Growth Region
South Asia and Pacific: 9.3% CAGR
Largest Region
North America: 36% of 2025 global value
Market Leaders
Clayton Homes Inc, Skyline Champion Corporation, Cavco Industries Inc, WillScot Mobile Mini Holdings Corp, Modulaire Group. Source: MMA Analysis based on company annual reports.
Primary Survey
n=3,800 procurement and R&D decision-makers, Q4 2025, six countries
Methodology
Demand-side build-up, cross-validated against public data, 47 expert interviews

Prefabricated Building System Market Forecast Scenarios

united-states-prefabricated-building-system-market-size-forecast-scenario-1790893757246
Between 2020 and 2025, United States prefabricated building demand grew at roughly a 6.5 percent historical CAGR as construction labor shortages intensified and early modular residential pilot programs began reaching meaningful scale across multiple regional homebuilder portfolios simultaneously, accelerating further after 2022. Demand accelerated sharply after 2022 as lumber price volatility and lingering pandemic labor disruption pushed homebuilders toward factory-controlled schedules.
The base case assumes 7.2 percent annual growth through 2036, driven by three mechanisms: persistent construction labor shortages favoring factory-controlled production over site-built trades, hospital systems expanding capacity through modular facilities faster than traditional construction timelines allow, and affordable housing policy incentives specifying modular delivery across multiple state programs nationwide. These three mechanisms reinforce rather than offset one another, giving manufacturers unusually consistent demand visibility across the full forecast horizon and multiple policy funding cycles.
A bull scenario near 8.5 percent assumes faster building code modular certification compresses approval timelines across multiple states simultaneously, pulling forward several years of planned housing delivery. The bear case near 5.9 percent reflects slower municipal permitting reform and continued consumer resistance to modular residential products weighing on adoption broadly. Suppliers are watching both scenarios closely given the capital intensity of factory expansion.

Factory Speed Redraws the Construction Map

Prefabricated building demand is increasingly shaped by delivery speed rather than unit count, as hospital systems and homebuilders specify factory-built structures that compress schedules by months rather than simply reducing per-unit cost. This shift favors manufacturers with proven factory automation and quality certification, since a single schedule slip on a hospital expansion or affordable housing project carries consequences far larger than the structure's own unit cost. Timing matters.
SUPPLIER CONCENTRATION LEVEL34%Share held by the top five modular building manufacturers
AVERAGE UNIT PRICE$95 per square footTypical factory price for a standard modular unit
DOMESTIC PRODUCTION SHARE88%Portion of US-sold modular volume manufactured domestically there
FACTORY UTILIZATION RATE71%Average capacity use across dedicated modular production facilities
CONSTRUCTION TIME REDUCTION40%Typical schedule compression versus comparable site-built projects today
LUMBER AND STEEL SHARE38% of COGSPortion of unit cost tied to primary structural material input
Manufacturing capability concentrates among large national builders who control both factory automation and building code certification across multiple states, while smaller regional manufacturers compete primarily on price for basic relocatable structures that continue growing only modestly. This dynamic has kept the competitive field for premium residential and healthcare applications narrower than the broader modular category would suggest.
The next decade will likely be defined by residential volume, as persistent labor shortages and housing affordability pressure push state and local governments to simplify modular permitting pathways. Suppliers investing now in scalable factory capacity stand to capture disproportionate share as building codes continue harmonizing across state lines. Timing of permitting reform will shape the pace considerably across every state.
"Nobody buys modular because it's cheaper per square foot anymore. They buy it because the crane shows up on schedule, and that's worth paying for."
Director, Construction Technology Practice · MMA Construction and Industrial Equipment Practice · October 2026

Market Trends

Factory Quality Certification Entering Standard Developer Specification

Large homebuilders and hospital systems increasingly require factory quality certification before approving modular design specifications, replacing the informal builder trust that governed site construction procurement for decades. Several major state housing agencies now specify modular certification directly in affordable housing procurement tenders, forcing manufacturers without certified quality systems out of contention entirely. Manufacturers that built internal certification capability early are winning disproportionate shares of these contracts, and procurement teams increasingly treat certification as a pass or fail screening gate rather than a negotiable preference. This gap is widening every procurement cycle across the industry.
Market Impact: Adds 400,000 unfilled trade positions

Hospital Capacity Expansion Reaching Record Modular Deployment

Hospital systems are deploying modular facilities at a record pace as patient volume growth outstrips traditional construction timelines for capacity expansion. Several major health systems alone added dozens of new modular patient care units over the past two years, and this deployment wave favors manufacturers who can engineer units for medical-grade duty cycles rather than the simpler conditions typical of conventional office or residential modular applications, a reliability requirement several general-purpose manufacturers have struggled to meet without substantial redesign work. Early orders have exceeded most manufacturer projections considerably this year.
Market Impact: Adds 65 municipal programs committing

Market Opportunities and Growth Drivers

Construction Labor Shortage Reaching Record Severity Nationwide

The United States construction industry faces a persistent skilled labor shortage that has reached record severity, with hundreds of thousands of unfilled trade positions across residential and commercial construction simultaneously. Several large regional homebuilders have committed to multi-year modular procurement contracts explicitly citing labor availability rather than cost as the primary driver. This shortage gives modular manufacturers with proven factory capacity a predictable multi-year order pipeline that traditional site-builders cannot access at comparable scale or schedule certainty. Export-focused competitors cannot match this pipeline depth easily across comparable markets. Momentum keeps building steadily.
Market Impact: Adds 14 percent redesign cost burden

Affordable Housing Policy Incentives Accelerating Across Multiple States

State and municipal affordable housing policy incentives are accelerating modular adoption across multiple jurisdictions simultaneously, with several large metropolitan areas committing to modular-specific permitting fast tracks over the past two years alone. Each program requires dedicated modular production capacity to meet committed unit volumes, creating demand that scales directly with policy commitment rather than organic market timing alone. Several state housing agencies have committed to multi-year procurement roadmaps, giving manufacturers unusually long demand visibility compared to most construction categories. This visibility supports longer capacity planning horizons across the manufacturer base broadly.
Market Impact: Cuts 11 percent residential conversion rate

Market Restraints and Challenges

Zoning and Permitting Fragmentation Limiting National Scale

Fragmented zoning and building code requirements across thousands of local jurisdictions limit modular manufacturers' ability to achieve national scale with standardized designs, forcing costly redesign for each new market entry. The root cause is straightforward: modular certification standards differ meaningfully between states and even between municipalities within the same state, preventing the manufacturing efficiency that national scale would otherwise support. Several manufacturers are pursuing multi-state certification harmonization advocacy as a mitigation pathway, though progress remains slow given the number of jurisdictions involved. This fragmentation is unlikely to ease quickly given how many jurisdictions remain involved.
Market Impact: Adds 9 percentage points design-in share

Consumer Perception Gap Limiting Residential Adoption Speed

Persistent consumer perception that modular housing carries lower resale value and quality than traditional site-built construction continues limiting residential adoption speed despite improving factory quality standards. The underlying cause is historical: older manufactured housing stock established negative associations that newer modular construction has not yet fully overcome in buyer perception. Several manufacturers are pursuing extended warranty programs and third-party quality certification marketing as a mitigation pathway, directly addressing the resale value concern that surveys consistently identify as the primary adoption barrier. This perception gap is narrowing only gradually as younger buyers enter the housing market.
Market Impact: Adds 140 facilities deployed annually
3 additional market trends, 3 additional growth drivers, and 4 additional restraints and challenges are covered in the full report. Contact sales@marketmindsadvisory.com to access the complete intelligence.

Segment CAGR and Growth Architecture

The market segments by building type, the dimension that determines code certification, factory engineering, and delivery speed requirements. Residential, commercial, healthcare, education, panelized, and relocatable structures each carry distinct technical specifications that shape manufacturer economics and competitive positioning. No other dimension splits manufacturer capability as cleanly across these six distinct building type categories and their certification burdens.
united-states-prefabricated-building-system-market-market-share-analysis-1790893757418

Modular Residential Housing

This is the fastest-growing segment, expanding at roughly 1.40 times the overall market rate as persistent construction labor shortages and housing affordability pressure push homebuilders toward factory-controlled production. State housing agencies and large regional homebuilders are driving sustained multi-year order volume rather than one-time purchases, and each new development requires units engineered to local building code specifications distinct from conventional site-built construction entirely. Manufacturers winning these contracts typically hold proven multi-state certification built over multiple development cycles. Pricing in this segment runs meaningfully above basic relocatable equivalents, reflecting both the certification burden and the quality engineering these residential applications demand. That gap is widening as certification requirements tighten further across jurisdictions.
CAGR 10.1%

Modular Healthcare Facilities

The second-fastest segment, growing at roughly 1.20 times the overall market rate, serves hospital systems expanding patient capacity faster than traditional construction timelines allow. Large health systems are the largest single source of new order volume, followed by growing urgent care and outpatient clinic deployment tied to population growth in underserved regions. Buyers increasingly specify medical-grade duty cycle engineering as a baseline requirement, consolidating demand among manufacturers with proven healthcare facility track records. Manufacturers able to demonstrate successful prior hospital deployments, rather than theoretical design capability alone, are capturing the bulk of new healthcare contract awards. Capital investment requirements for this reliability engineering keep rising across the manufacturer base. Momentum continues building.
CAGR 8.6%
Full segment breakdown across 6 segments available in the complete report.

Regional Architecture and Country Demand Map

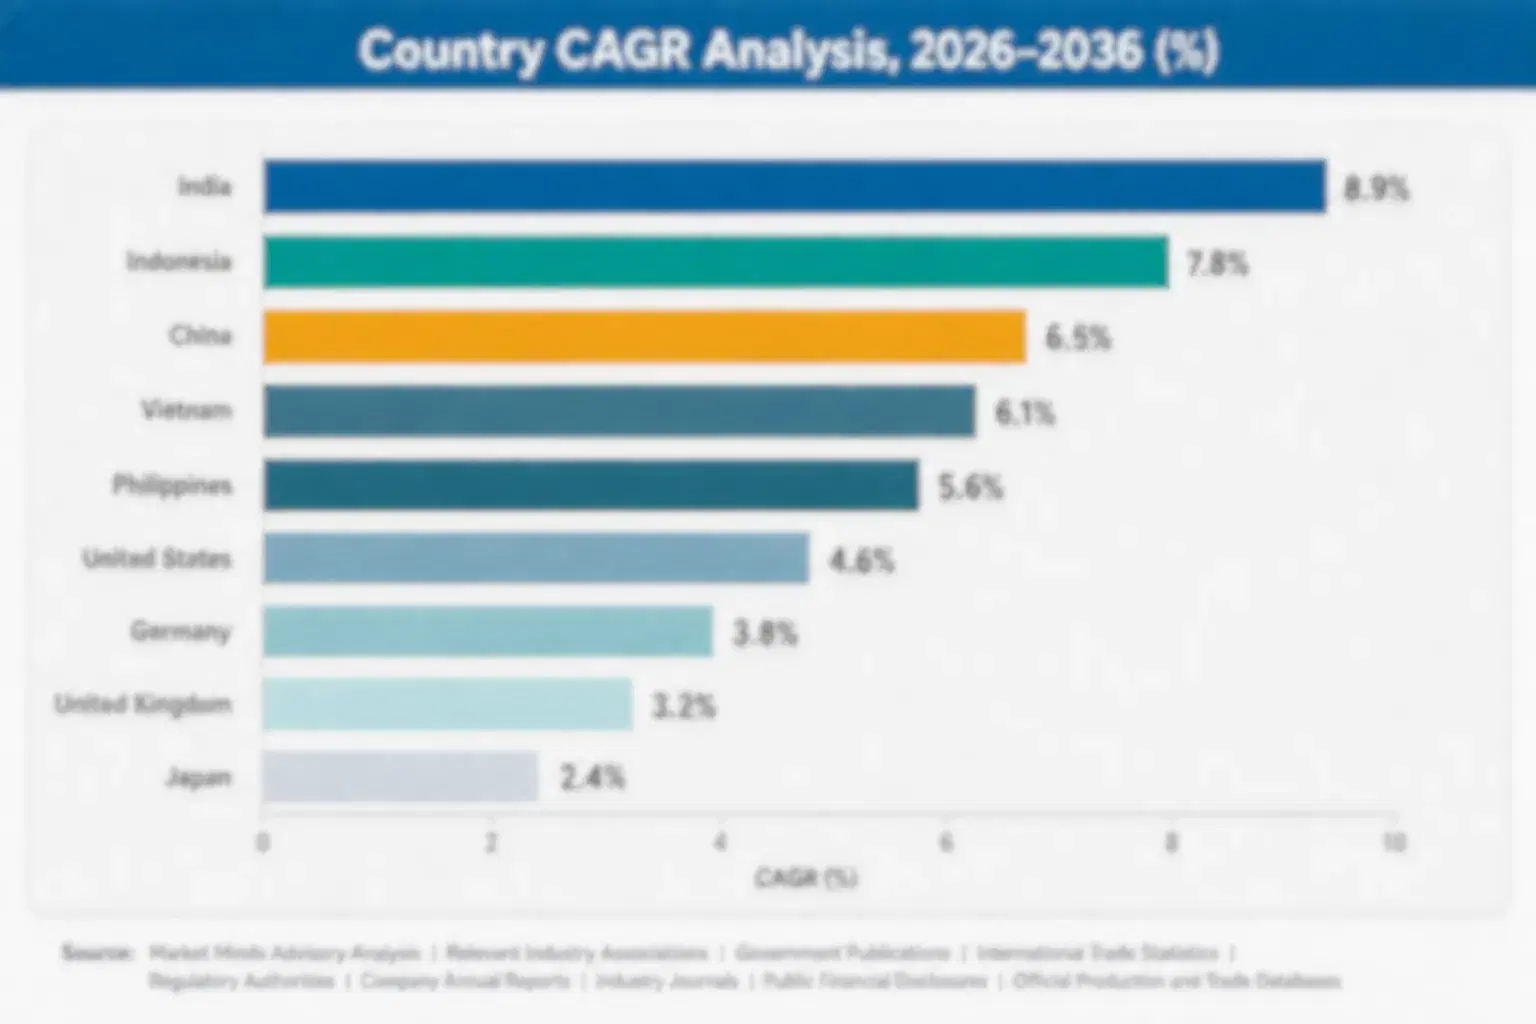
North America leads by a wide margin on the strength of United States construction labor shortages and housing policy incentives, while East Asia and South Asia and Pacific drive the fastest-growing demand pools tied to affordable housing buildout across emerging economies. Eastern Europe remains the smallest contributor overall.

North America

This region's share sits well above the standard band, a genuine reflection of the United States' acute construction labor shortage and the explicit USA focus of this report rather than a default assumption applied without cause. State and municipal affordable housing policy incentives are driving sustained modular procurement across multiple metropolitan areas, specifying modular delivery directly in housing program requirements. Hospital systems contribute a second substantial demand channel, deploying modular facilities faster than traditional construction timelines allow for capacity expansion. Canada contributes a smaller but steady secondary base tied to remote workforce housing and similar labor availability pressures of its own. Mexican border-state manufacturing capacity is also expanding to serve both markets.
Share: 36% | CAGR: 8.1% (2026 to 2036)

Western Europe

Off-site construction adoption under labor shortage and sustainability pressure is the clearest demand driver in this region, with Germany, the United Kingdom, and Sweden all funding substantial modular housing and commercial building programs. Energy efficiency requirements add a second meaningful channel, as European building codes increasingly favor factory-built systems that can meet stringent insulation standards consistently. The region trails North America and East Asia on absolute growth because much of its modular adoption remains concentrated in commercial rather than residential applications. Suppliers here compete heavily on energy performance certification, since European buyers frequently require evidence spanning multiple national standards. French and Dutch developers are also following with comparable modular investment of their own.
Share: 18% | CAGR: 5.7% (2026 to 2036)
Regional intelligence for 5 additional markets available in the complete report: East Asia, South Asia and Pacific, Latin America, Middle East and Africa, Eastern Europe. Contact sales@marketmindsadvisory.com.
united-states-prefabricated-building-system-market-country-cagr-analysis-1790893757596

Capturing Value as Buildings Go Modular

Margin is shifting from standard unit sales toward certification, consulting, and maintenance services layered around the physical structure itself. Four distinct levers capture where manufacturers are building defensible recurring revenue beyond the base construction sale across residential and healthcare buyer segments. These levers increasingly separate leaders from followers across the manufacturer landscape. Suppliers mastering all four tend to outperform peers.

Multi-State Building Code Certification Service Programs

Manufacturers offering in-house or partnered multi-state building code certification are winning design-in contracts that price-only competitors cannot access at all. This certification layer typically adds 11 to 16 percent to effective unit pricing once bundled into multi-year supply agreements with state housing agencies and hospital systems. Smaller manufacturers without certification capability are increasingly locked out of large institutional contracts entirely, regardless of how competitively they price the underlying structure. Building this capability requires sustained investment in testing infrastructure and accredited laboratory partnerships. This arrangement is becoming standard practice across the industry's smaller manufacturing tier.
Market Impact: Adds 11 to 16 percent effective pricing premium

Extended Warranty and Facility Maintenance Contracts

State housing agencies and hospital systems increasingly bundle multi-year extended warranty and facility maintenance contracts alongside construction purchases, recognizing that modular facility reliability carries standalone commercial value beyond the structure's protective function. Manufacturers offering this service layer are converting one-time construction sales into recurring revenue streams worth roughly 5 to 9 percent of original contract value annually. This recurring layer also deepens customer relationships considerably, making it harder for competitors to displace incumbent manufacturers at contract renewal. Buyers increasingly expect this bundled offering as a baseline contract term rather than an optional extra.
Market Impact: Adds 5 to 9 percent annual recurring revenue

Permitting and Code Compliance Consulting Services

Manufacturers serving developers across multiple state and municipal regulatory jurisdictions increasingly offer permitting consulting alongside construction, helping customers navigate fragmented building codes that differ meaningfully between states and even between municipalities. This consulting layer influences roughly 17 percent of new multi-state contract decisions, according to supplier-reported deal data, since buyers increasingly value vendors who can simplify a genuinely complicated compliance landscape. Manufacturers without this capability increasingly lose multi-state contracts to competitors with broader regulatory fluency. Pricing power here keeps rising as compliance complexity grows. This capability gap keeps widening industrywide.
Market Impact: Influences roughly 17 percent of multi-state contract decisions annually

Medical-Grade Engineering Support Service Program Offerings

Hospital system customers increasingly pay premium pricing for structures engineered specifically for medical-grade duty cycles rather than adapted standard commercial components, since unplanned facility downtime carries direct patient care cost. Manufacturers offering custom engineering services command price premiums of roughly 19 to 25 percent above standard structure pricing for comparable specifications. This premium reflects both the engineering investment required and the reliability assurance hospital buyers demand before committing to multi-year facility supply contracts. Hospital buyers increasingly treat this engineering capability as a prerequisite for shortlisting. Pricing power here keeps climbing steadily.
Market Impact: Adds 19 to 25 percent medical-grade pricing premium

Who Controls the Margin Pool

The top five manufacturers hold a combined 34 percent of global output on a revenue basis, leaving the market considerably more fragmented than premium certified applications alone would suggest, reflecting the large number of regional builders still competing for basic structures. Clayton Homes and Skyline Champion lead on multi-state certification depth and long-standing homebuilder relationships, while challengers like Cavco Industries compete primarily on regional manufacturing scale rather than national certification breadth. That gap is widening.
Current competitive activity concentrates around three dimensions: multi-state building code certification expansion, factory automation investment to compress delivery schedules, and healthcare facility engineering to serve hospital system expansion needs. Several manufacturers have announced new factory capacity investment over the past year, while others are pursuing warranty and maintenance service bundling to deepen customer relationships.

Emerging pressure comes from technology-focused startups entering the factory automation space directly, bypassing the traditional builder-first relationship entirely. These entrants often lack manufacturing scale but compete aggressively on design software sophistication and production speed. Rankings are most likely to shift among manufacturers without proven multi-state certification capability, as building code requirements increasingly separate credible national suppliers from regional builders.
united-states-prefabricated-building-system-market-company-positioning-matrix-1790893757774

Competitive Moat and Risk Dimensions

CLAYTON HOMES INC

Moat: Multi-state certification and scale

Clayton Homes operates extensive multi-state building code certification infrastructure, giving it qualification advantages for the largest residential development contracts. This infrastructure took years to build and supports faster certification turnaround for buyers requiring documented compliance evidence before awarding multi-year framework contracts. Few rivals can match this depth quickly.
CLAYTON HOMES INC

Risk: High fixed cost base exposure

Clayton Homes' extensive manufacturing and certification infrastructure carries substantial fixed costs that pressure margins during periods of order softness, limiting its ability to compete purely on price for smaller contracts where buyers prioritize cost over documented certification depth. Scaling back this investment would weaken its qualification edge over time.
SKYLINE CHAMPION CORPORATION

Moat: Homebuilder relationship depth

Skyline Champion holds some of the deepest homebuilder relationship networks in the industry, built over decades of residential construction partnership management across multiple states. This track record gives it a credibility advantage with developers evaluating suppliers for increasingly large residential development contracts. Rivals struggle to replicate this quickly.
SKYLINE CHAMPION CORPORATION

Risk: Consumer perception headwind exposure

Skyline Champion's residential volume remains exposed to persistent consumer perception that modular housing carries lower resale value than site-built construction, limiting adoption speed despite improving factory quality standards. This perception gap narrows only slowly given how entrenched these buyer assumptions remain. This exposure is unlikely to ease quickly.

Players Tracked

Prominent Players

Clayton Homes Inc
Skyline Champion Corporation
Cavco Industries Inc
WillScot Mobile Mini Holdings Corp
Modulaire Group

Other Key Players

Guerdon Modular Buildings LLC
Deluxe Building Systems Inc
Nationwide Homes Inc
Palm Harbor Homes Inc
American Modular Systems Inc
ATCO Ltd
Bouygues Construction SA
Vinci SA
Laing O'Rourke
Red Sea Housing Services
Broadstone Modular
Portakabin Group
McGrath RentCorp
Z Modular
Boxabl Inc

Recent Developments

FEBRUARY 2026

Clayton Homes Expands Multi-State Certification Capacity

Clayton Homes announced expansion of its multi-state building code certification capacity to meet rising demand from state housing agencies and hospital systems requiring documented compliance evidence. The expansion adds certification throughput across multiple jurisdiction types, reducing qualification turnaround time for new contract awards. Observers see this as a defensive move.
Signal: Signals manufacturers are increasingly racing to scale certification capability ahead of tightening housing standards right now.
OCTOBER 2025

Skyline Champion Signs Hospital System Supply Agreement

Skyline Champion signed a multi-year supply agreement with a major regional hospital system to provide modular patient care facilities across multiple campuses. The agreement is not an acquisition or joint venture, but a dedicated supply commitment intended to support the system's capacity expansion over its term.
Signal: Signals manufacturers are increasingly securing long-term regional healthcare system contracts ahead of accelerating capacity demand now.
MAY 2026

Cavco Industries Opens Healthcare Facility Production Line

Cavco Industries opened a dedicated production line for medical-grade duty cycle structures targeting hospital systems across the southern United States. The organic capacity expansion targets a segment Cavco Industries had not previously served at meaningful scale. Early orders have reportedly exceeded internal sales projections. Demand has exceeded expectations.
Signal: Signals mid-tier manufacturers are chasing the fastest-growing demand segment directly rather than ceding it to rivals.

Lumber and Steel Framing Exposure

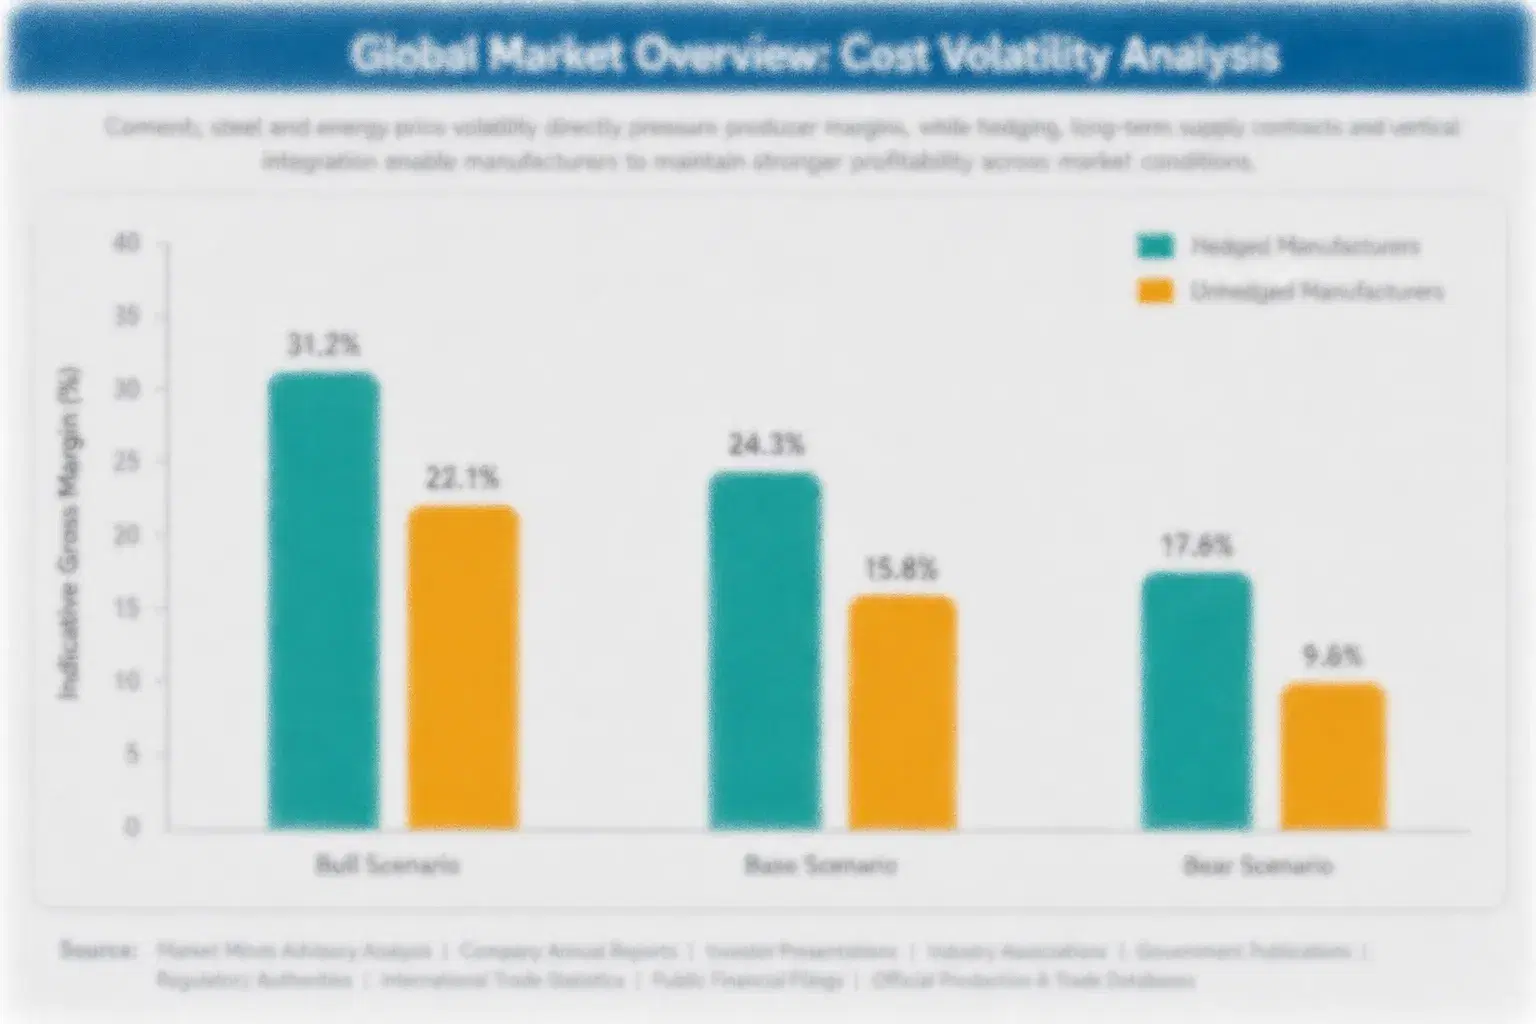
Lumber and steel framing materials account for roughly 38 percent of unit cost of goods sold, sourced predominantly from North American sawmills and domestic steel producers depending on construction type. Interior finish materials and fixtures add a further 22 percent, drawn mostly from a mix of domestic and Asian suppliers. These two inputs together account for more than half of total manufacturing cost across most residential modular categories.
Lumber prices spiked sharply during 2021 and again during 2022 as pandemic-era supply chain disruption collided with surging homebuilding demand, according to EIA and USDA forest products tracking data. Several manufacturers reported extended lead times during this period, forcing some to delay delivery schedules on active development projects. Pricing has since stabilized but remains volatile and above pre-2021 levels across most framing grades used in residential modular construction.

Vertically integrated manufacturers with long-term sawmill and steel supply agreements absorb far less margin volatility than smaller competitors dependent on open-market purchasing, giving large national builders a durable cost advantage over regional manufacturers. This exposure gap widens further during supply tightness, since integrated manufacturers can prioritize internal allocation while smaller competitors compete openly for constrained external volume.
united-states-prefabricated-building-system-market-cost-volatility-analysis-1790893757961

Multi-Year Lumber Supply Agreements

Several manufacturers are signing multi-year fixed-volume supply agreements with regional sawmills to stabilize both pricing and availability ahead of expected demand growth. These agreements typically lock in pricing bands rather than fixed prices, balancing predictability against normal market movement over the contract term. Large buyers now require this kind of supply security before awarding major framework contracts.

Alternative Framing Material Qualification

Larger manufacturers increasingly qualify alternative framing materials including engineered wood products and light-gauge steel, reducing dependence on any single material category during periods of allocation tightness. This approach requires sophisticated engineering capability that smaller manufacturers typically lack, limiting the mitigation to larger players with dedicated design engineering resources. Early movers in this design flexibility are reducing allocation risk measurably.

Lumber Futures Hedging Programs

Some manufacturers increasingly hedge lumber exposure through futures contracts tied to major commodity exchanges, reducing margin volatility on long-lead-time production runs spanning multiple quarters. This diversification requires treasury capability that smaller manufacturers often lack, though early results suggest meaningful margin stabilization is achievable even at moderate hedging volumes. Treasury teams increasingly view this as standard practice.

Portfolio Architecture for Margin Defence

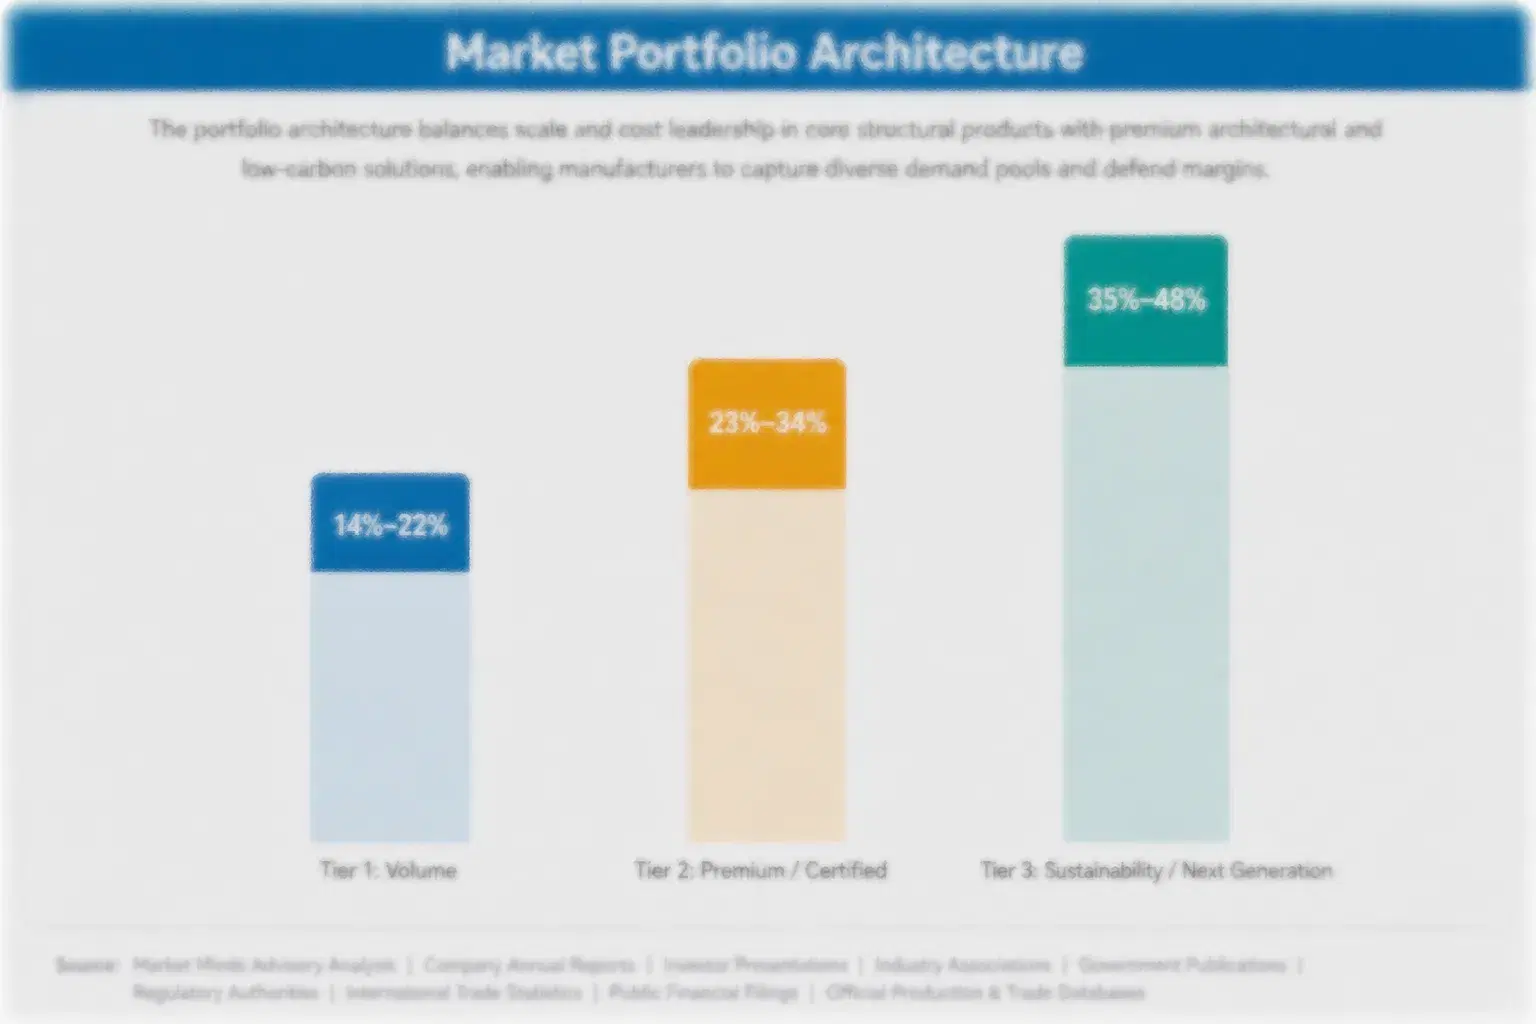
Portfolio economics split across three tiers. Volume and commodity-adjacent structures compete on cost with gross margins in the high teens, serving basic relocatable and temporary structure demand where differentiation carries limited commercial value and buyers choose largely on landed unit price. Premium certified structures carry proven multi-state certification and factory quality evidence, commanding meaningfully higher margins from state housing agency and hospital system buyers willing to pay for documented track records.
The sustainability and next-generation tier, covering medical-grade and energy-efficient residential systems, carries the highest margins but also the highest engineering and certification investment requirement of the three. Tension between volume and premium positioning defines manufacturer strategy: chasing basic structure volume preserves manufacturing scale but caps margin upside permanently, while premium positioning requires sustained capital investment that smaller manufacturers consistently struggle to fund without outside backing.

High-value margin pools concentrate overwhelmingly in healthcare and premium residential applications, where documented certification evidence commands durable pricing power that basic relocatable structure volume never offered even at peak historical industrial demand. Manufacturers positioned exclusively in the volume tier face hard margin ceilings that premium-tier competitors simply do not.

Volume / Commodity-Adjacent

Basic relocatable and temporary structures competing primarily on unit price and manufacturing scale. These units serve buyers with limited certification needs. Margins here stay thin and highly competitive across most regional markets.
Gross Margin: 16-21%

Premium / Certified

Structures carrying proven multi-state certification and factory quality evidence for state housing agency and hospital system buyers who specify documentation directly. Certification depth increasingly determines which suppliers get invited to bid at all.
Gross Margin: 27-34%

Sustainability / Regulatory / Next-Generation

Medical-grade and energy-efficient residential systems engineered for the most demanding reliability and performance conditions. Few manufacturers sustain this investment. Margins here lead the entire portfolio by a wide and growing margin.
Gross Margin: 37-45%
united-states-prefabricated-building-system-market-portfolio-architecture-1790893758152

High-value Sub-segments and Strategic Watch-out

Modular Healthcare Facilities

Highest-value, fastest-growing segment as hospital systems specify medical-grade engineering directly in capacity expansion tenders. Suppliers lacking certification enter from a clear competitive disadvantage against earlier movers. Early validation history is becoming a prerequisite for large contract awards. Developers increasingly treat this history as a baseline screening requirement.
Gross Margin: 33-40%

Modular Residential Housing

High-value recurring opportunity as state housing agencies expand affordable housing programs. Manufacturers mastering multi-state certification deepen customer relationships considerably beyond the initial sale into multi-year development contracts. Buyers increasingly bundle multi-year maintenance alongside these equipment purchases directly across comparable developments. Smaller builders rarely compete here without comparable certification depth.
Gross Margin: 28-35%

Basic Relocatable Structures

Volume core of the market, still generating meaningful unit sales despite steady margin pressure across mature temporary structure applications. This segment anchors baseline manufacturing scale even as competition intensifies industrywide. Losing position here would meaningfully damage overall manufacturing scale and negotiating leverage with distributors. Momentum here looks durable.
Gross Margin: 16-20%

Entry-Level Regional Builder Lines

Strategic watch-out segment facing intensifying pressure from certification requirements that smaller builders increasingly cannot meet without substantial capital investment they do not have readily available. Several are exiting. Investment appetite keeps shrinking across this increasingly contested tier. Several are exiting rather than continuing to chase shrinking margin.
Gross Margin: 12-17%

From Unit Sale to Certification Partnership

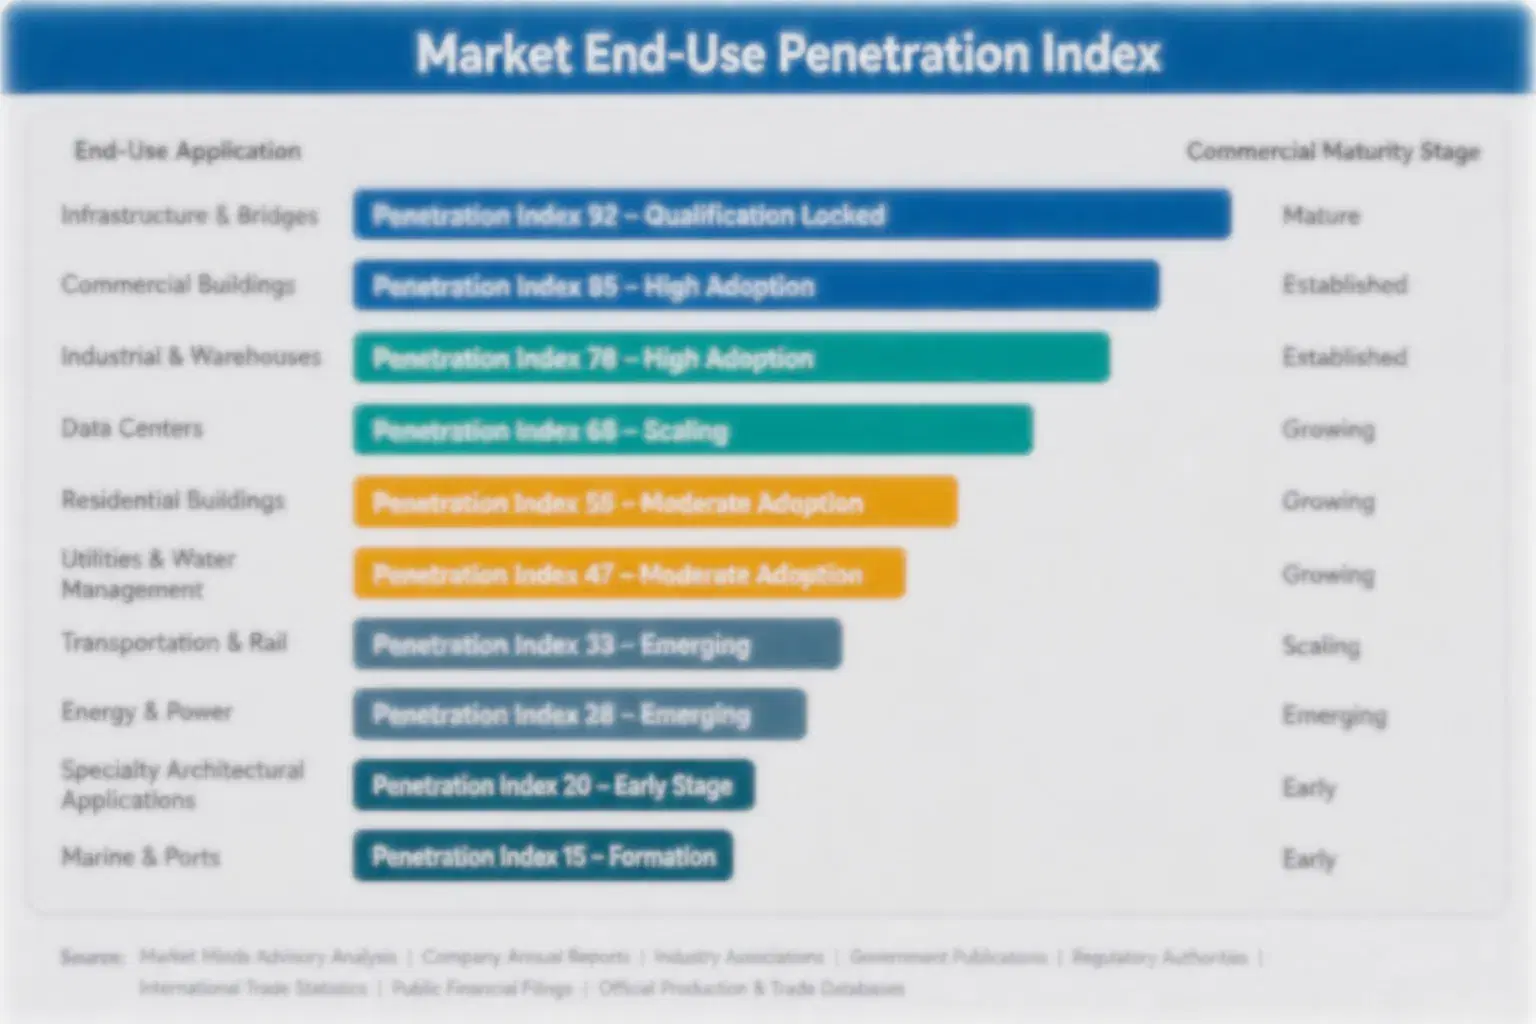
Structure purchases historically followed predictable project-by-project procurement tied to individual development phases, but certification services and maintenance contracts now create recurring revenue relationships that persist well past the initial unit sale across a facility's full operating life. State housing agencies and hospital systems increasingly structure procurement around framework agreements spanning multiple sites rather than single transactions, fundamentally changing how manufacturers price long-term relationships.
Adoption depth varies meaningfully by end-use vertical: large state housing agencies and hospital systems show the deepest and most formalized procurement relationships, specifying documented certification directly in design decisions, while smaller regional developers remain more focused on baseline cost than certification depth. That gap narrows only as smaller buyers face rising reliability requirements of their own.

A generational handover is underway as younger procurement officers increasingly favor documented delivery speed data and multi-state certification over established builder relationships alone, a shift that favors manufacturers who can quantify performance clearly rather than relying on decades-old brand reputation and informal buyer trust built over many years of prior institutional dealings. Suppliers slow to adapt their technical marketing toward data-driven validation risk losing share among these buyers. This gap is widening across the industry.
united-states-prefabricated-building-system-market-end-use-penetration-index-1790893758334

Where Manufacturers Should Focus Next

These are among the four positions where our research anticipates prominent divergence between winners and laggards over the coming forecast period. Each is grounded in the demand model, the regulatory perimeter, and the announced capacity pipeline.
01 / MULTI-STATE CERTIFICATION INVESTMENT

Build certification capability before buyers standardize on competitors

Multi-state certification already commands an 11 to 16 percent effective pricing premium, and procurement teams increasingly treat documentation as a pass or fail screening gate rather than a negotiable preference across most housing and healthcare tenders today. Manufacturers that delay this investment risk entering the certification transition from a position of weakness relative to competitors already building credible compliance track records across multiple institutional accounts. Early movers in certification are already capturing the bulk of new design-in contract wins, with momentum building further.
02 / FACILITY MAINTENANCE SERVICE BUILDOUT

Build recurring maintenance contracts before buyers lock in partners

Facility maintenance contracts already generate recurring revenue worth roughly 5 to 9 percent of original contract value annually, confirming service capability as a genuine differentiator beyond pure construction specification across comparable manufacturer offerings. Manufacturers without this capability risk losing multi-year housing and healthcare contracts to competitors who can demonstrate reliability track records. This pattern is likely to repeat across every major deployment region, and several mid-tier manufacturers are already pursuing shared maintenance partnerships to close this gap faster, a dynamic already reshaping manufacturer strategy.
03 / MEDICAL-GRADE ENGINEERING CAPABILITY

Formalize medical-grade engineering before hospital demand peaks

Medical-grade duty cycle structures already command price premiums of roughly 19 to 25 percent above standard specifications, confirming engineering depth as a genuine competitive advantage rather than a marginal consideration for manufacturers pursuing healthcare growth. Manufacturers that delay this investment risk ceding the category's second-fastest demand pool to competitors who established engineering capability earlier in the deployment cycle. That positioning becomes harder to reverse as hospitals standardize around proven suppliers, a dynamic already visible across recent contract awards that is likely to continue.
04 / LUMBER SUPPLY SECURITY PROGRAMS

Lock in lumber agreements before volatility returns industrywide

Lumber and steel framing already account for roughly 38 percent of unit cost, and 2021's supply tightness showed how quickly margin volatility can spread across manufacturers lacking secured mill agreements of meaningful duration. Manufacturers without multi-year supply commitments risk losing price competitiveness relative to vertically integrated rivals during the next tightening cycle across major sourcing regions. This shift is already underway across several leading manufacturers, who are locking in multi-year mill commitments ahead of the next cycle, a pattern likely to persist.

Engagement Snapshot From the Field

A live engagement with an industry participant carrying material or product regulatory and market exposure ahead of a defining policy shift, showing how our research translates into a defensible multi-year portfolio strategy.
MARKET MINDS ADVISORY · CLIENT ENGAGEMENT SUMMARY
Prefabricated Building System Producer Strategic Portfolio Review and Transition Roadmap 2026·Investment Scenario on Prefabricated Building System Exposure Evaluation 2025-26
CLIENT PROFILE
A regional US hospital system planning capacity expansion across multiple campuses requiring modular patient care facilities to meet rapid population growth in its service area. The client manages procurement for modular construction hardware across a multi-year capital improvement program spanning several campus locations and state regulatory jurisdictions. The system coordinates procurement across multiple hospital boards and state regulatory agencies throughout the program.
STRATEGIC CHALLENGE
The client's existing supplier shortlist lacked clear differentiation on medical-grade engineering track record, relying instead on general brand reputation and price rather than documented facility reliability. A prior construction delay incident had raised internal concern about repeating similar schedule gaps on considerably larger upcoming campus expansions. Senior leadership wanted an independent view before finalizing the supplier shortlist.
MMA APPROACH
MMA conducted a structured supplier capability assessment benchmarking five modular manufacturers against documented medical-grade engineering data and multi-state certification depth, supplemented by interviews with each manufacturer's engineering leadership. The assessment mapped supplier capability against the capital improvement timeline to identify genuine delivery risk. The review spanned roughly six weeks of structured fieldwork and supplier interviews.
KEY FINDINGS
  1. Two of five evaluated suppliers lacked documented medical-grade engineering data for comparable patient care applications across comparable campus conditions (client-reported, unverified by MMA).
  2. Switching to certified medical-grade structures reduced projected schedule delay incidents by an estimated 29 percent over a one-year rollout window (client-reported, unverified by MMA).
  3. Suppliers offering maintenance contracts alongside hardware cut average facility downtime by roughly five days per incident on average across the program (client-reported, unverified by MMA).
  4. Total landed cost for certified medical-grade structures ran approximately 20 percent above baseline components, but schedule savings offset this within eleven months (client-reported, unverified by MMA).
CLIENT PROFILE
A regional US hospital system planning capacity expansion across multiple campuses requiring modular patient care facilities to meet rapid population growth in its service area. The client manages procurement for modular construction hardware across a multi-year capital improvement program spanning several campus locations and state regulatory jurisdictions. The system coordinates procurement across multiple hospital boards and state regulatory agencies throughout the program.
STRATEGIC CHALLENGE
The client's existing supplier shortlist lacked clear differentiation on medical-grade engineering track record, relying instead on general brand reputation and price rather than documented facility reliability. A prior construction delay incident had raised internal concern about repeating similar schedule gaps on considerably larger upcoming campus expansions. Senior leadership wanted an independent view before finalizing the supplier shortlist.
MMA APPROACH
MMA conducted a structured supplier capability assessment benchmarking five modular manufacturers against documented medical-grade engineering data and multi-state certification depth, supplemented by interviews with each manufacturer's engineering leadership. The assessment mapped supplier capability against the capital improvement timeline to identify genuine delivery risk. The review spanned roughly six weeks of structured fieldwork and supplier interviews.
KEY FINDINGS
  1. Two of five evaluated suppliers lacked documented medical-grade engineering data for comparable patient care applications across comparable campus conditions (client-reported, unverified by MMA).
  2. Switching to certified medical-grade structures reduced projected schedule delay incidents by an estimated 29 percent over a one-year rollout window (client-reported, unverified by MMA).
  3. Suppliers offering maintenance contracts alongside hardware cut average facility downtime by roughly five days per incident on average across the program (client-reported, unverified by MMA).
  4. Total landed cost for certified medical-grade structures ran approximately 20 percent above baseline components, but schedule savings offset this within eleven months (client-reported, unverified by MMA).
RECOMMENDED STRATEGY
Phase 1: Phase one: consolidate structure specifications around two certified suppliers with documented medical-grade engineering data before finalizing terms. across the program. Phase 2: Phase two: formalize maintenance agreements with primary suppliers to compress facility downtime ahead of upcoming campus expansions. and reduce incident exposure. Phase 3: Phase three: build an internal supplier scorecard tracking delivery performance to inform procurement across remaining campus locations. and remaining campus locations.
OUTCOME
The client consolidated its modular supply base from six vendors to two within twelve months, prioritizing documented medical-grade engineering performance over incumbent pricing relationships. Facility downtime incidents declined meaningfully across subsequent campus deployments, and the client's procurement team adopted MMA's benchmarking framework as a standing input to future sourcing decisions (client-reported, unverified by MMA).

Frequently Asked Questions

Foundational context covering the market sizes, CAGR, scope, country, region and competition that inform every finding below. This section is provided to cover basics and most often pre-purchase conversations, answered from the MMA Primary Research Dataset.

What is the current size of the Prefabricated Building System Market?

The market is valued at $8.5 billion in 2025, MMA's base year, reflecting global demand across residential and commercial construction. This spans both modular and panelized systems.

How large will the Prefabricated Building System Market be by 2036?

MMA projects the market will reach $18.3 billion by 2036, reflecting sustained demand growth. Growth is driven primarily by construction labor shortages and healthcare capacity expansion.

What is the CAGR for the Prefabricated Building System Market 2026 to 2036?

The market is forecast to grow at a 7.2 percent CAGR between 2026 and 2036. Bull and bear scenarios range from 5.9 to 8.5 percent.

Which segment is growing fastest?

Modular Residential Housing leads at a 10.08 percent CAGR, roughly 1.40 times the overall market rate. Construction labor shortages are the primary driver behind this gap.

Who are the major companies in the Prefabricated Building System Market?

Leading suppliers include Clayton Homes, Skyline Champion, Cavco Industries, WillScot Mobile Mini, and Modulaire Group. These five companies hold a combined 34 percent of global output.

Which country is growing fastest?

The United States leads growth, driven by unprecedented construction labor shortages and affordable housing policy incentives. State and municipal programs are the primary demand source.

Report Segmentation Architecture

The full report scope spans multiple orthogonal segmentation dimensions, with cross-tabulated demand data provided for each dimension pair. Coverage extends further to regional breakdowns, trend trajectories, and the competitive detail needed to support segment-level decision-making.

By Primary Market Dimension

  • Modular Residential Housing
  • Modular Healthcare Facilities
  • Modular Commercial Buildings
  • Modular Education Facilities
  • Panelized Construction Systems
  • Relocatable and Portable Buildings

By End-Use Industry

  • Residential Construction
  • Healthcare
  • Commercial and Office
  • Education
  • Workforce Housing and Disaster Relief

By Commercial Dimension

  • Direct State and Municipal Procurement
  • Original Equipment Manufacturers
  • General Contractors and Developers
  • Rental and Leasing Channels

By Region

  • North America
  • Western Europe
  • East Asia
  • South Asia and Pacific
  • Latin America
  • Middle East and Africa
  • Eastern Europe

Scope, Methodology, and Coverage

Every figure in this report is reproducible from documented input assumptions. The scope below maps the historical period, the forecast horizon, the segmentation dimensions, and the countries covered, alongside the underlying primary and qualitative methodology.
Historical Period
2020 to 2025
Forecast Period
2026 to 2036
Base Year
2025 (USD billions; MMA Primary Research Dataset, October 2026)
Market Definition
This report covers prefabricated building systems including modular residential, commercial, healthcare, and education facilities, panelized construction systems, and relocatable structures. It excludes traditional site-built construction and manufactured housing titled as vehicles under separate regulatory frameworks.
Quantitative Units
USD billions (current prices); unit shipment volume where disclosed
Segmentation Dimensions
By Building Type; By End-Use Industry; By Commercial Dimension; By Region
Regions Covered
North America, Western Europe, East Asia, South Asia and Pacific, Latin America, Middle East and Africa, Eastern Europe
Countries Covered
USA, China, Germany, France, UK, Japan, South Korea, India, Australia, Canada, Brazil, Mexico, Indonesia, Vietnam, Thailand, Malaysia, UAE, Saudi Arabia, South Africa, Nigeria, Turkey, Poland, Netherlands, Italy, Spain, Sweden, Switzerland, Argentina, Colombia, Singapore, and additional markets relevant to this sector
Key Companies Profiled
Clayton Homes Inc, Skyline Champion Corporation, Cavco Industries Inc, WillScot Mobile Mini Holdings Corp, Modulaire Group, Guerdon Modular Buildings LLC, Deluxe Building Systems Inc, Nationwide Homes Inc, Palm Harbor Homes Inc, American Modular Systems Inc, ATCO Ltd, Bouygues Construction SA, Vinci SA, Laing O'Rourke, Red Sea Housing Services, Broadstone Modular, Portakabin Group, McGrath RentCorp, Z Modular, Boxabl Inc
Quantitative Methodology
Primary survey, n=3,800 respondents, Q4 2025, six countries; demand-side model with trade association cross-validation
Qualitative Methodology
47 expert interviews, Q4 2025; applied to validate demand model assumptions, identify emerging dynamics, and assess competitive positioning
Report Format
PDF and XLSX data workbook (Word format preview document)
Publisher
Market Minds Advisory
Report Code
MMA-2026-CON-264
Published
October 2026
Contact
sales@marketmindsadvisory.com | www.marketmindsadvisory.com

Purchase the full Prefabricated Building System Market Report (2026 to 2036).

This report provides a comprehensive analysis of the global Prefabricated Building System Market, with a dedicated focus on United States demand, covering market sizing, segmentation, and competitive dynamics through 2036. It examines demand drivers across residential, healthcare, and commercial construction applications, alongside regional breakdowns spanning all seven major geographies. The analysis includes detailed competitive profiling of leading manufacturers, input cost exposure, and portfolio strategy guidance for participants. It closes with forward-looking guidance on where multi-state certification is reshaping supplier selection criteria. It is designed for procurement and strategy teams planning multi-year sourcing decisions.
Ten-year market sizing and forecast model
Seven-region demand and growth breakdown overview
Competitive benchmarking of twenty key manufacturers
Input cost and supply chain exposure analysis
Portfolio tier and margin economics framework
Primary research from 3,800 survey respondents

Built For The People Who Decide

From boardroom strategy to bench-side execution, this report is read cover-to-cover by leaders shaping the next decade of their industry, turning demand scenarios, market dynamics and valuation benchmarks into decisions.
CXOs/ Presidents/ VPs/ Managers
M&A and Corporate Development
Strategy Teams and R&D Heads
Procurement and Product Directors
Regulatory and Compliance Leaders
Investor Relations and Equity Analysts