

Market Minds Advisory
United States Plastic Jar Industry

United States Plastic Jar Industry: The Customer Owns The Tool

Injection moulds for jars are expensive and the brand usually owns them, which means a converter can be replaced by moving a steel tool across town rather than by winning any technical argument.

Lead Analyst

Published

September 2026

Make Smarter Decisions with Customized Research Insights

Request a free sample report and evaluate market opportunities, growth trends, and competitive dynamics relevant to your business needs.

2025 MARKET VALUE$12.6BMarket Size 2025
2036 FORECAST VALUE$28.2BBase Case , 2026 to 2036
CAGR 2026 TO 20367.6 %Bull 8.8% / Bear 6.4%
INCREMENTAL OPPORTUNITY$14.6BNet 10- year value creation
EXPANSION MULTIPLE2.08x2036 value over 2026 base
Strategic Levers
M&A Pipeline
Regional Outlook
Country Rankings
Competitive Intelligence
Segmental Deep-dive
Call-Us : 91 93563 13602

Executive Snapshot and Market Trajectory

Switching costs here run backwards. Injection tooling for a jar is expensive and the brand owner generally owns it, so replacing a converter means moving a steel tool rather than requalifying a product. The customer holds the asset that would normally hold them in place. Nothing gets requalified.
East Asia takes 30% of value on Chinese moulding capacity and consumption together, while American converters compete inside short haul radii because a rigid jar is mostly shipped air. Post-consumer recycled content jars grow at 11.4%, half again the market rate of 7.6%, held back by colour consistency and odour rather than by any shortage of recycled resin. Recycled pellets are easy to buy. Consistency of supply is what separates converters permanently.
Concentration is remarkably low at 24% because freight economics prevent anybody dominating a region they cannot supply from a nearby plant. On-site moulding at a filler's own facility removes that constraint entirely, which is the structure serious volume increasingly takes. It also ties a converter to one customer completely. Converters take the trade anyway because contracted volume is worth having. Regional competitors cannot reach that customer.
Market Definition
The market covers rigid plastic jars manufactured for filling by brand owners and contract packers, including injection moulded jars, injection blow moulded jars, injection stretch blow moulded PET jars, extrusion blow moulded jars, post-consumer recycled content jars, and lightweighted and thin-wall constructions. Closures, liners, induction seals and dispensing fitments, labels and decoration, glass and metal containers, flexible packaging, and filling equipment are excluded. This report covers jar manufacture; the complete pack including closure and decoration is covered separately.
Base Year Value
$12.6B in 2025 (MMA Primary Research Dataset, August 2026)
Forecast Period
2026 to 2036, eleven discrete annual values
CAGR
7.6% base case. Bull 8.8%. Bear 6.4%.
Fastest Growth Segment
Post-Consumer Recycled Content Jars: 11.4% CAGR
Fastest Growth Country
India: 9.8% CAGR
Fastest Growth Region
South Asia and Pacific: 9.6% CAGR
Largest Region
East Asia: 30% of 2025 global value
Market Leaders
Berry Global, Amcor, Alpla, Silgan Holdings, Plastipak. Source: MMA Analysis based on disclosed rigid plastic packaging revenue, company annual reports 2025.
Primary Survey
n=3,800 procurement and R&D decision-makers, Q4 2025, six countries
Methodology
Demand-side build-up, cross-validated against public data, 47 expert interviews

United States Plastic Jar Industry Market Forecast Scenarios

united-states-plastic-jar-industry-size-forecast-scenario-1787696183958
Growth from 2020 to 2025 ran at 6.6% and resin pricing moved reported value more than volume did. Polypropylene and polyethylene terephthalate pricing swung sharply through the period, and converters passing resin through contractually reported revenue movements that had nothing to do with units shipped. Recycled content commitments made by brand owners across the period created demand for constructions that converters had to develop before any volume was contracted.
The 7.6% base case rests on three mechanisms. Recycled content requirements keep tightening through brand commitments and state packaging rules, which moves volume toward constructions that command a premium and that fewer converters can supply consistently. On-site and near-site moulding keeps expanding because a jar is mostly air and freight is punishing. And Asian consumption keeps rising with regional manufacturing. All three run on fixed compliance dates and freight arithmetic.
The bull case at 8.8% turns on recycled content mandates extending to further states and categories, which would pull volume toward premium constructions faster than converters can qualify them. The bear case at 6.4% is brand owners moving tooling to lower cost moulders more aggressively, since they own the assets and switching costs sit with the converter rather than with them.

Shipping Air Across Short Distances

A rigid jar is mostly empty space, so a trailer fills long before it reaches weight and every kilometre is paid on air. Past roughly 290 kilometres freight exceeds what the container is worth, which is why converters cluster around fillers and why five large companies hold only 24% of the market. On-site moulding inside a filler's building removes the freight entirely.
FIVE-FIRM CONCENTRATION24%Share of rigid plastic packaging revenue held by leading converters
STANDARD JAR PRICE$0.19 eachTypical selling price for a mid size injection moulded jar
TOP PRODUCING COUNTRYChina 28%Chinese share of global rigid plastic jar manufacturing output
ECONOMIC HAUL RADIUS290 kmDistance beyond which freight cost exceeds container value
BRAND OWNED TOOLING SHARE71%Injection moulds owned by the brand rather than the converter
RECYCLED CONTENT REJECTION18%Recycled batches failing brand colour or odour acceptance testing
The switching cost in this industry sits on the wrong side of the relationship. Injection tooling for a jar is expensive and roughly 71% of moulds are owned by the brand owner rather than the converter, which means replacing a supplier requires moving a steel tool rather than requalifying a package. Converters therefore compete continuously for work they already hold, and the qualification advantage protecting suppliers elsewhere does not exist.
Recycled content is not a supply problem and the industry keeps describing it as one. Post-consumer resin is available; what fails is colour consistency, residual odour and food contact documentation, with roughly 18% of batches rejected on brand acceptance testing rather than on mechanical performance. A perfectly sound jar with a grey cast does not reach a shelf. Converters who invested in sorting and odour management supply consistently.
"They own the mould. That is the whole conversation. You are not a supplier with a qualified position, you are a subcontractor with a forklift's worth of switching cost."
Director, Rigid Plastic Packaging Practice · MMA Packaging Practice · August 2026

Market Trends

On-Site Moulding Removes The Freight Constraint

A jar is mostly air and past roughly 290 kilometres freight exceeds the container's value, which caps how far any converter can compete. Moulding inside the filler's own building eliminates that cost entirely and removes handling, warehousing and damage alongside it. Growth in that structure is genuine and it binds a converter to one customer completely, since the equipment sits on somebody else's floor under an agreement that can end. Converters weigh guaranteed volume against total dependency and frequently take it anyway. Guaranteed volume beats theoretical independence in most boardrooms.
Market Impact: Applies across 8 state programmes

Recycled Content Fails On Colour Not Performance

Post-consumer resin is available and mechanically adequate for most jar applications, and roughly 18% of batches are still rejected on brand acceptance testing for colour variation, residual odour or incomplete food contact documentation. Growth at 11.4% goes to converters who invested in sorting, blending and odour management rather than to those simply buying recycled pellets. A mechanically sound jar with an unpredictable grey cast does not reach a retail shelf regardless of how well it performs mechanically in every other respect. Buying pellets is not the same as holding a specification.
Market Impact: Produces 28% of global output

Market Opportunities and Growth Drivers

State Packaging Rules Force Recycled Content Adoption

Extended producer responsibility and minimum recycled content requirements are advancing state by state across the United States rather than federally, which produces a patchwork that brand owners resolve by adopting the strictest applicable standard nationally. That converts a regional rule into a national specification and pulls volume toward constructions fewer converters can supply consistently. Compliance dates are fixed, which creates demand on a calendar rather than gradually and rewards converters who qualified their recycled constructions ahead of the deadline. Late qualification means lost volume at the deadline. Nobody qualifies a construction overnight.
Market Impact: Leaves 71% of tooling elsewhere

Asian Manufacturing Consumption Grows Alongside Capacity

Chinese moulding capacity accounts for roughly 28% of global jar output and serves personal care, food and pharmaceutical manufacturing concentrated in the same region, which is the usual pattern for containers that ship poorly. Indian and Southeast Asian consumption is rising quickly as organised retail and domestic manufacturing expand together. Regional growth therefore compounds, since new filling capacity attracts moulding capacity nearby which attracts further downstream investment in the same industrial areas. Regional demand and regional supply reinforce each other continuously, and the pattern repeats wherever new filling capacity opens. Freight arithmetic guarantees it.
Market Impact: Halts thinning at 2 loads

Market Restraints and Challenges

Brand Owned Tooling Removes Converter Switching Costs

Roughly 71% of injection moulds are owned by the brand owner rather than the converter, so replacing a supplier means transporting a steel tool rather than requalifying a package or repeating stability testing. Root cause is a tooling ownership convention that developed when brands wanted control over their own container designs. The commercial impact is that converters compete continuously for volume they already hold and enjoy none of the qualification protection normal in manufacturing. Mitigation involves converter-owned tooling arrangements, which brands resist strongly. Some converters have made it work at renewal.
Market Impact: Eliminates a 290 kilometre limit

Top-Load Requirements Limit How Far Lightweighting Goes

A jar must survive stacking in a warehouse and torque during capping, and thinner walls buckle under both, which is a different constraint from bottles where internal pressure supports the sidewall. Root cause is geometry rather than material science. The commercial impact is that lightweighting in jars reaches a practical floor considerably earlier than brand sustainability teams expect, and pushing past it produces failures at the filler rather than in a laboratory. Mitigation runs through rib design and geometry optimisation rather than through further wall reduction. Sustainability teams learn the limit expensively.
Market Impact: Rejects 18% of recycled batches
3 additional market trends, 4 additional growth drivers, and 2 additional restraints and challenges are covered in the full report. Contact sales@marketmindsadvisory.com to access the complete intelligence.

Segment CAGR and Growth Architecture

Segmentation follows manufacturing construction: how the container is formed and what resin content it carries, rather than which product fills it or who buys it. Six constructions cover the market without overlap, from injection moulded jars through to lightweighted thin-wall designs. End-use industry and commercial arrangement are treated separately here. Ownership arrangement sits in the commercial dimension.
united-states-plastic-jar-industry-market-share-analysis-1787696184238

Post-Consumer Recycled Content Jars

Recycled resin is available and mechanically adequate for most jar applications, and the failures are cosmetic and olfactory rather than functional, with roughly 18% of batches rejected on brand acceptance testing. Growth at 11.4%, half again the market rate of 7.6%, follows state packaging rules and brand commitments rather than any converter push. What separates suppliers is investment in sorting, blending and odour management rather than access to recycled pellets, which anybody can buy. A mechanically perfect jar carrying an unpredictable grey cast simply does not reach a retail shelf anywhere. Rejection is decided by a brand technologist looking at a colour swatch, not by any performance data at all. That test is harder to pass than it sounds.
CAGR 11.4%

Lightweighted and Thin-Wall Constructions

Removing material from a jar saves resin and freight and improves every sustainability metric a brand reports, which is why lightweighting continues despite reaching a genuine physical limit. A jar must survive warehouse stacking and capping torque, and thinner walls buckle under both, which is a constraint bottles avoid because internal pressure supports their sidewalls. Growth at 9.6% therefore comes increasingly from rib geometry and container design rather than from further wall reduction, and converters who push past the floor generate failures at the filler rather than in testing. Rib geometry and base design do the work that gauge reduction can no longer do safely. Brands report the weight reduction and rarely see the engineering behind it.
CAGR 9.6%
Full segment breakdown across 6 segments available in the complete report.

Regional Architecture and Country Demand Map

Geography follows moulding capacity and filling location together, since jars ship poorly and converters cluster around their customers. East Asia leads on manufacturing scale, North America on recycled content regulation, and South Asia grows fastest of all regions. Recycled capability separates converters everywhere. Freight decides the rest.

North America

American recycled content requirements advance state by state rather than federally, and brand owners resolve that patchwork by adopting the strictest applicable standard across national production, which converts a regional rule into a national specification. Tooling ownership sits overwhelmingly with brand owners, which leaves converters competing continuously for volume they already supply. On-site and near-site moulding is more common here than anywhere, reflecting both freight economics and the scale of individual filling operations. Canadian converters follow similar patterns, and Mexican moulding has grown with manufacturing relocation into the region. Recycled content acceptance failures on colour and odour are widely reported and separate converters with processing capability from those buying pellets.
Share: 26% | CAGR: 6.8% (2026 to 2036)

Western Europe

European packaging regulation drives recycled content specification more uniformly than the American state patchwork does, which gives converters a single target rather than a moving compliance map. German, Italian and Spanish converters supply substantial regional volume and several hold technical positions in recycled content processing. Energy costs weigh on moulding operations and have compressed margins since 2022. Tooling ownership conventions vary more than in America, with some converters holding moulds and the switching dynamics that follow from that. Regional consolidation has proceeded steadily among mid-sized converters. Recycled content processing capability is more widely held here than in most regions, reflecting how long the requirements have been in force across the market.
Share: 20% | CAGR: 6.0% (2026 to 2036)
Regional intelligence for 5 additional markets available in the complete report: East Asia, South Asia and Pacific, Latin America, Middle East and Africa, Eastern Europe. Contact sales@marketmindsadvisory.com.
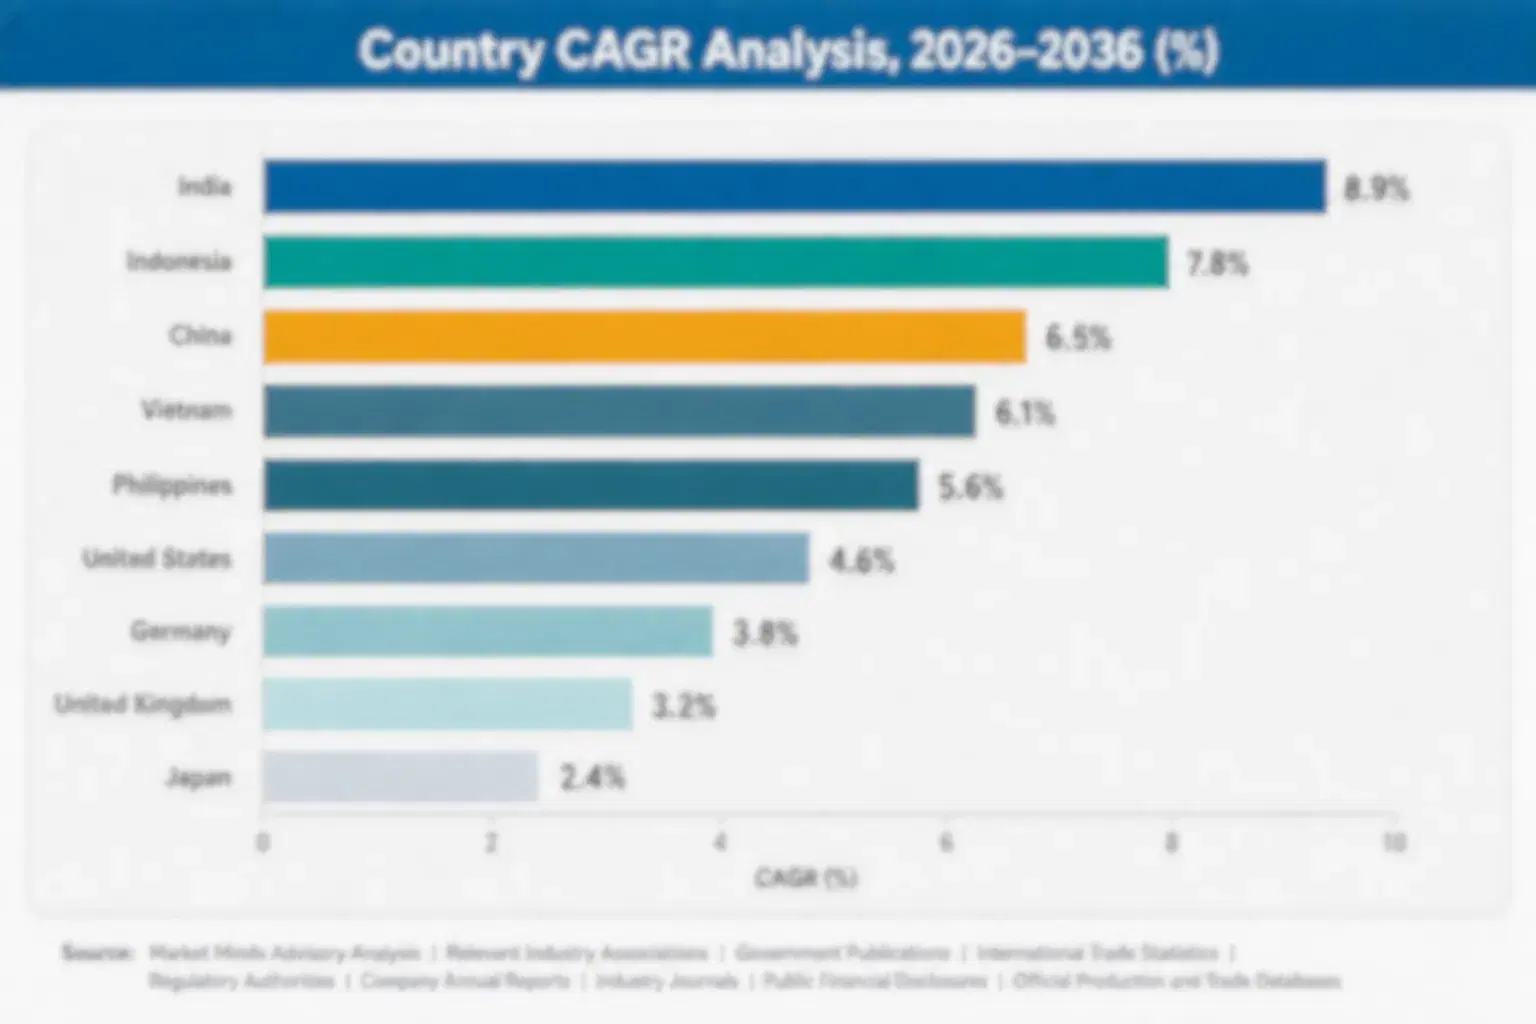
united-states-plastic-jar-industry-country-cagr-analysis-1787696184575

Building The Missing Switching Cost

Roughly 71% of tooling belongs to the brand, freight caps competition at about 290 kilometres, and 18% of recycled batches fail on colour rather than performance. Four levers work on tooling structure, proximity, recycled processing and geometry rather than on price, which is the only lever converters currently pull. Price competition here has no floor at all.

Offer Converter Owned Tooling With Volume Commitment

Roughly 71% of injection moulds belong to the brand owner, which means a converter can be replaced by a lorry rather than by any technical argument. Offering to fund tooling in exchange for a volume commitment inverts that entirely and creates the switching cost this industry otherwise lacks completely. Brands resist because the arrangement reduces their flexibility, which is precisely why it is worth having. The capital involved is modest against the volume it secures for the tool's whole working life. A funded tool creates dependency where none existed. Brands weigh flexibility against price.
Market Impact: Reverses the 71% brand tooling ownership position entirely

Pursue On-Site Moulding Despite The Dependency

Past roughly 290 kilometres freight exceeds a jar's value, and moulding inside a filler's own building removes that cost along with handling, warehousing and transit damage. The arrangement binds a converter completely to one customer, which is a genuine risk. It also produces contracted volume, eliminates the freight disadvantage against every regional competitor and makes displacement practically impossible while the equipment sits on the customer's floor. Converters weighing dependency against certainty mostly conclude that certainty wins. Contracted volume and zero freight together outweigh a dependency that ends only if the customer's own plant closes. That calculation favours certainty.
Market Impact: Removes the whole 290 kilometre freight ceiling completely

Invest In Recycled Sorting And Odour Management

Recycled resin is available to anybody and roughly 18% of batches are rejected on colour variation, residual odour or food contact documentation rather than on mechanical performance. Converters who invested in sorting, blending and odour management supply consistently while competitors substitute pellets and get rejected. Growth at 11.4% goes to the former. The investment is processing capability rather than material purchasing, and it is what separates a converter who can hold a recycled specification from one who occasionally meets it. It is the difference between quoting recycled and supplying it.
Market Impact: Prevents roughly 18% of all recycled batch rejections

Solve Top-Load Through Geometry Not Wall Thickness

A jar must survive warehouse stacking and capping torque, and thinner walls buckle under both because there is no internal pressure supporting the sidewall as there is in a bottle. Lightweighting therefore reaches a floor that brand sustainability teams consistently underestimate. Converters who solve top-load through rib design and container geometry keep reducing weight where competitors have stalled, and they avoid the failures at the filler that pushing past the physical limit inevitably produces. A jar carries 2 competing load requirements at once, stacking and torque, and no amount of gauge reduction satisfies both. Geometry does.
Market Impact: Satisfies the 2 competing load requirements at once

Who Controls the Margin Pool

Measured on disclosed rigid plastic packaging revenue, the five largest converters hold a CR5 of just 24%, which is extraordinarily low and follows directly from freight economics rather than from any absence of scale. Berry, Amcor, Alpla and Plastipak operate broad plant networks, and even they compete plant by plant against regional moulders inside each haul radius rather than as national suppliers. Scale buys reach here rather than any protection.
Three contests define activity. Standard jar supply competes on price within a haul radius where converters are broadly interchangeable and tooling belongs to the customer anyway. Recycled content constructions compete on processing capability that fewer converters hold. On-site moulding competes on capital and on willingness to accept complete dependency on one customer. A converter organised for the first contest is not equipped for either of the other two, and most are organised only for the first.

Pressure comes from brand owners exercising tooling ownership more aggressively as recycled content and cost pressures build simultaneously. Rankings shift wherever a converter secures on-site placement or converter-owned tooling, since both create the switching cost that this industry entirely lacks everywhere else. Everything else is repriced annually.
united-states-plastic-jar-industry-company-positioning-matrix-1787696184864

Competitive Moat and Risk Dimensions

BERRY GLOBAL

Moat: Plant Network Geographic Density

Berry operates a moulding plant network dense enough to serve most American filling locations inside economic haul distance, which is the only durable advantage available where freight caps competition at a few hundred kilometres. That network took decades and considerable acquisition to assemble. A competitor with better constructions cannot deliver them profitably without a nearby plant.
BERRY GLOBAL

Risk: Brand Tooling Ownership Exposure

Roughly 71% of injection moulds belong to brand owners, so plant density secures the ability to compete without securing the volume itself. A customer can move tooling to a regional moulder within the same haul radius at very little cost. Scale provides reach rather than retention, and retention is what this industry plainly lacks across every converter.
ALPLA

Moat: On-Site Moulding Operating Model

Alpla built a business around moulding inside customers' own filling plants, which removes freight entirely and makes displacement practically impossible while the equipment occupies the customer's floor. That model requires capital discipline and operational integration few converters have developed. A regional moulder competing on price cannot reach a customer whose containers are produced twenty metres from the filler.
ALPLA

Risk: Single Customer Dependency

On-site moulding ties a converter completely to one customer at one location under an agreement that eventually ends, and the equipment is not readily redeployable elsewhere. Contract non-renewal strands assets rather than merely losing volume. The model that removes competitive exposure concentrates counterparty exposure in exactly the same proportion.

Players Tracked

Prominent Players

Berry Global
Amcor
Alpla
Silgan Holdings
Plastipak

Other Key Players

Gerresheimer
Pretium Packaging
Sonoco Products
Greif
TriMas Packaging
Comar
Alpha Packaging
Mold-Rite Plastics
Ring Container Technologies
Zhuhai Zhongfu
Zijiang Enterprise
Taiwan Hon Chuan
Indorama Ventures
Graham Packaging
Logoplaste

Recent Developments

MARCH 2025

Personal care manufacturer relocates jar tooling to regional moulder

A personal care manufacturer moved its injection tooling from an incumbent converter to a regional moulder, a sourcing decision rather than any corporate transaction. Because the brand owned the moulds, the transition required transport and qualification of the moulding process rather than any repackaging or stability work at all.
Signal: Brand tooling ownership means supplier changes cost a lorry rather than a requalification programme. Nothing else changes.
JULY 2025

Converter commissions dedicated recycled resin processing capability

A jar converter commissioned dedicated sorting, blending and odour management capability for post-consumer resin, an organic capital investment rather than any acquisition. Brand acceptance rejections on colour and residual odour had been running well above mechanical rejection rates. Processing capability rather than pellet purchasing resolves it.
Signal: Recycled content is a processing capability rather than a purchasing decision, which separates converters permanently. Pellets are available anywhere.
NOVEMBER 2025

Food manufacturer signs on-site moulding agreement for jar supply

A food manufacturer signed an agreement for jar moulding inside its own filling facility, an operational and commercial arrangement rather than any acquisition. Freight on empty containers had become a visible cost line, and on-site production removed transport, warehousing and transit damage from the supply chain simultaneously.
Signal: On-site production removes freight and competition together, which is why converters accept the dependency. Both disappear together.

What A Jar Costs To Mould

Resin dominates and everything else is comparatively small. Polypropylene, polyethylene or polyethylene terephthalate accounts for 56 to 64% of manufacturing cost depending on construction, with recycled grades carrying a premium over virgin material in most periods. Moulding energy is the next largest element and is meaningfully higher in Europe than in Asia or the Gulf. Tooling amortisation appears only where the converter owns the mould.
The volatility that matters is polymer pricing and energy together. Polypropylene and polyethylene terephthalate pricing moved sharply through 2022 alongside petrochemical and energy costs, and IEA industrial energy data documents the European increases involved. Converters with indexed resin pass-through recovered those movements while those on fixed annual pricing absorbed them entirely. Recycled resin pricing has also decoupled from virgin at times, which older contracts never anticipated.

Exposure divides by contract structure and region. Converters with indexed resin clauses pass polymer movements through and compete on conversion cost alone. Those on fixed pricing carry the full swing on a cost that dominates the bill of materials. European moulders carry energy intensity that Gulf and Asian competitors do not, and Gulf converters benefit from regional polymer production, which matters when resin dominates.
united-states-plastic-jar-industry-cost-volatility-analysis-1787696185160

Index resin including recycled grades separately

Polymer is over half the cost of a jar and recycled grades have at times decoupled from virgin pricing entirely, which contracts written against a single index did not anticipate. Indexing recycled and virgin separately costs negotiation effort and prevents absorbing a divergence nobody predicted. Converters on single-index clauses discovered the gap only after it had already opened.

Fund converter tooling against volume commitments

Brand-owned moulds leave a converter replaceable by transport rather than by any technical failure, which removes the switching cost every other manufacturing relationship relies upon. Funding tooling in exchange for committed volume inverts that at modest capital cost. Brands resist because it reduces their flexibility, which is exactly the reason the arrangement is worth pursuing.

Hedge moulding energy in high cost regions

Moulding and cooling consume energy continuously and European industrial pricing rose sharply from 2022, compressing converter margins against regions with materially cheaper power. Hedged supply costs flexibility and protects conversion margin on a product where resin already dominates the cost. Converters exposed to spot energy have watched conversion margin disappear for reasons unrelated to polymer.

Portfolio Architecture for Margin Defence

Margin follows capability that a nearby competitor cannot immediately match. Standard injection and extrusion blow moulded jars are comparable within a haul radius and priced accordingly, with tooling belonging to the customer anyway. Stretch blow moulded PET earns better on process capability. Recycled content constructions earn considerably more because consistent colour and odour control is genuinely difficult. On-site arrangements earn steadily and carry complete customer dependency. The pattern is consistent across every construction.
The tension is that the two routes to a defensible position pull in opposite directions. Recycled processing capability differentiates a converter across many customers, while on-site moulding secures one customer absolutely and strands assets if the agreement ends. Converters pursuing both simultaneously spread capital thinly, and those pursuing neither compete on price for volume the customer can move with a forklift whenever it chooses. Capital allocation is therefore the real strategic question and most converters have not framed it that way at all.

High-value pools sit in three places. Recycled content constructions supported by sorting, blending and odour management capability. On-site moulding arrangements where freight disappears and displacement becomes impractical. And converter-owned tooling agreements, which create the switching cost this industry otherwise entirely lacks.

Volume / Commodity-Adjacent

Standard injection and extrusion blow moulded jars supplied within haul radii where converters are broadly interchangeable and tooling belongs to the customer. The 7-point range separates converters with indexed resin clauses and hedged energy from those absorbing polymer swings on fixed annual pricing.
Gross Margin: 13-20%

Premium / Certified

Injection stretch blow moulded PET and precision thin-wall constructions requiring process capability beyond straightforward moulding. The 7-point spread separates converters with proven dimensional consistency and surface quality from those competing on nominal specification without that demonstrated process control.
Gross Margin: 24-31%

Sustainability / Regulatory / Next-Generation

Post-consumer recycled content constructions and on-site moulding arrangements. The 17-point range is wide because recycled capability commands a premium fewer converters can supply while on-site moulding trades margin for contracted volume and complete customer dependency.
Gross Margin: 27-44%
united-states-plastic-jar-industry-portfolio-architecture-1787696185457

High-value Sub-segments and Strategic Watch-out

Recycled Content With Processing Capability

Highest value and fastest growth at 11.4%, where sorting, blending and odour management separate converters who hold a specification from those who occasionally meet it. The risk is that recycled resin pricing has decoupled from virgin at times, which contracts indexed to a single benchmark absorb badly.
Gross Margin: 41-44%

On-Site Moulding Arrangements

Steady value with contracted volume and no freight exposure, and displacement is impractical while equipment occupies the customer's floor. The risk is complete dependency, since a non-renewal strands assets that are not readily redeployable to any other location or customer. Redeployment is rarely practical. Assets sit on somebody else's floor.
Gross Margin: 30-33%

Standard Moulded Jars

The volume core, supplied within a haul radius against interchangeable competitors where the customer owns the tooling and can move it cheaply. Converters hold the position because this volume carries plant utilisation, which determines whether a moulding site earns anything at all. Nobody exits it voluntarily.
Gross Margin: 14-17%

Brand Tooling Dependency

The strategic watch-out. Roughly 71% of moulds belong to brand owners, leaving converters competing continuously for volume they already hold with no qualification protection whatsoever. The risk is a customer relocating tooling for a marginal price difference at essentially no cost to themselves. Conversion cost programmes do not address it.
Gross Margin: 17-20%

Volume Without Any Lock

Jars are consumed with every unit filled and never accumulate, which ties demand directly to a customer's production volume rather than to any purchasing decision revisited periodically. A filling line running two shifts consumes containers continuously and reorders on schedule. That is a reliable annuity in every respect except one: the customer can move it to another converter within the same haul radius whenever it chooses, because it owns the mould.
Stickiness therefore has to be manufactured rather than assumed. On-site moulding creates it physically, since equipment on the customer's floor cannot be replaced without disruption nobody wants. Converter-owned tooling creates it contractually. Recycled processing capability creates it practically, since a competitor without sorting and odour management cannot hold the specification. Absent one of those, a converter holds volume only until somebody quotes lower.

The decision sits with procurement in most accounts and with packaging development where recycled content or lightweighting is involved. A standard jar is repriced annually by a buyer comparing quotations within a radius. A recycled construction is specified by a packaging technologist who ran acceptance testing and knows which converters passed it. Converters organised only for the first compete where price is the sole variable.
united-states-plastic-jar-industry-end-use-penetration-index-1787696185739

Where Position Has To Be Built

These are among the four positions where our research anticipates prominent divergence between winners and laggards over the coming forecast period. Each is grounded in the demand model, the regulatory perimeter, and the announced capacity pipeline.
01 / TOOLING OWNERSHIP INVERSION

Fund the mould and own the relationship

Roughly 71% of injection moulds belong to the brand owner rather than the converter, which means a supplier can be replaced by a lorry rather than by losing any technical argument about performance. Offering to fund the tooling in exchange for a firm volume commitment inverts that position entirely and creates the switching cost that this industry otherwise lacks completely. Brands resist the arrangement because it reduces their flexibility, which is precisely why it is worth a converter pursuing seriously.
02 / PROXIMITY STRUCTURE CHOICE

Twenty metres beats two hundred kilometres

Past roughly 290 kilometres the freight bill on a jar exceeds what the container itself is worth, which caps how far any converter can compete for a customer's business. Moulding inside a filler's own building removes that cost entirely, along with handling, warehousing and transit damage across the whole chain. The arrangement does bind a converter completely to one single customer at one location, and most converters weighing that dependency against contracted certainty conclude that certainty is clearly worth having.
03 / RECYCLED PROCESSING INVESTMENT

Colour fails long before performance does

Post-consumer resin is available to anybody who wants to buy it, and roughly 18% of batches are still rejected on colour variation, residual odour or food contact documentation rather than on any mechanical performance issue at all. Converters who invested properly in sorting, blending and odour management hold recycled specifications consistently, while competitors substitute pellets and then get rejected. The investment required is processing capability rather than material purchasing, and the growth running at 11.4% annually goes entirely to the former.
04 / GEOMETRY OVER GAUGE

Jars buckle where bottles simply do not

A jar must survive warehouse stacking and capping torque simultaneously, and thinner walls buckle under both because no internal pressure supports the sidewall the way it does in a pressurised bottle. Lightweighting therefore reaches a practical floor considerably earlier than brand sustainability teams generally expect it to. Converters who solve the top-load problem through rib design and container geometry keep reducing weight where competitors have stalled, and they avoid the failures that appear at the filler rather than in any laboratory test.

Engagement Snapshot From the Field

A live engagement with an industry participant carrying material or product regulatory and market exposure ahead of a defining policy shift, showing how our research translates into a defensible multi-year portfolio strategy.
MARKET MINDS ADVISORY · CLIENT ENGAGEMENT SUMMARY
United States Plastic Jar Industry Producer Strategic Portfolio Review and Transition Roadmap 2026·Investment Scenario on United States Plastic Jar Industry Exposure Evaluation 2025-26
CLIENT PROFILE
A rigid plastic packaging converter operating five moulding plants and supplying jars to personal care, food and pharmaceutical fillers, with reported revenue of 268 million dollars (client-reported, unverified by MMA). Roughly 84% of volume ran on brand-owned tooling under annual pricing agreements. A recycled content range existed and was supplied by purchasing recycled pellets without any dedicated sorting or odour management capability.
STRATEGIC CHALLENGE
Three significant accounts had moved tooling to regional competitors within eighteen months and margins had eroded across the remaining base. Management was pursuing manufacturing cost reduction to defend pricing. Nobody had examined why volume was so easily moved, or why recycled quotations were failing brand acceptance testing repeatedly. Both had been assumed rather than tested.
MMA APPROACH
MMA reviewed the three account losses in detail, establishing what the transition had actually cost each customer, which the company had never asked. Fourteen expert interviews with brand packaging technologists and procurement leads established how converter selection and recycled acceptance are decided. The analysis treated tooling ownership and processing capability, not conversion cost, as the likely causes.
KEY FINDINGS
  1. All three lost accounts moved tooling to converters within the same haul radius, at transition costs the customers described as trivial and easily justified.
  2. Recycled quotations had failed brand acceptance testing on colour and odour rather than on mechanical performance, and the company had no processing capability to address it.
  3. No customer had ever been offered converter-funded tooling, and two of the three lost accounts said they would have considered a volume commitment in exchange.
  4. Recycled processing investment modelled better returns than the manufacturing cost programme already underway (client-reported, unverified by MMA). Payback modelled inside two years on capability the business entirely lacked.
CLIENT PROFILE
A rigid plastic packaging converter operating five moulding plants and supplying jars to personal care, food and pharmaceutical fillers, with reported revenue of 268 million dollars (client-reported, unverified by MMA). Roughly 84% of volume ran on brand-owned tooling under annual pricing agreements. A recycled content range existed and was supplied by purchasing recycled pellets without any dedicated sorting or odour management capability.
STRATEGIC CHALLENGE
Three significant accounts had moved tooling to regional competitors within eighteen months and margins had eroded across the remaining base. Management was pursuing manufacturing cost reduction to defend pricing. Nobody had examined why volume was so easily moved, or why recycled quotations were failing brand acceptance testing repeatedly. Both had been assumed rather than tested.
MMA APPROACH
MMA reviewed the three account losses in detail, establishing what the transition had actually cost each customer, which the company had never asked. Fourteen expert interviews with brand packaging technologists and procurement leads established how converter selection and recycled acceptance are decided. The analysis treated tooling ownership and processing capability, not conversion cost, as the likely causes.
KEY FINDINGS
  1. All three lost accounts moved tooling to converters within the same haul radius, at transition costs the customers described as trivial and easily justified.
  2. Recycled quotations had failed brand acceptance testing on colour and odour rather than on mechanical performance, and the company had no processing capability to address it.
  3. No customer had ever been offered converter-funded tooling, and two of the three lost accounts said they would have considered a volume commitment in exchange.
  4. Recycled processing investment modelled better returns than the manufacturing cost programme already underway (client-reported, unverified by MMA). Payback modelled inside two years on capability the business entirely lacked.
RECOMMENDED STRATEGY
Phase 1: Phase one: offer converter-funded tooling against volume commitments at renewal, creating a switching cost the business currently does not have at all. Phase 2: Phase two: invest in recycled sorting, blending and odour management, since acceptance failures are cosmetic rather than mechanical and processing solves them. Phase 3: Phase three: pursue on-site moulding with the largest filler in the base, removing freight and competition from that account simultaneously.
OUTCOME
Converter-funded tooling was accepted at four accounts covering a meaningful share of volume, creating commitments that had not previously existed. Recycled processing capability was commissioned and acceptance testing pass rates improved substantially (client-reported, unverified by MMA). One on-site moulding discussion reached agreement and construction is underway at the customer's site.

Frequently Asked Questions

Foundational context covering the market sizes, CAGR, scope, country, region and competition that inform every finding below. This section is provided to cover basics and most often pre-purchase conversations, answered from the MMA Primary Research Dataset.

What is the current size of the United States Plastic Jar Industry?

The market was worth 12.6 billion dollars in 2025, covering injection moulded, injection blow, stretch blow, extrusion blow, recycled content and lightweighted jar constructions. It reaches 13.56 billion dollars in 2026.

How large will the United States Plastic Jar Industry be by 2036?

MMA forecasts 28.20 billion dollars by 2036, an increase of 14.64 billion dollars over the 2026 base. That represents an expansion multiple of 2.08 times across the forecast period.

What is the CAGR for the United States Plastic Jar Industry 2026 to 2036?

The base case compounds at 7.6% annually. MMA's bull case reaches 8.8% if recycled content mandates extend further, while the bear case sits at 6.4% on brands relocating tooling more aggressively.

Which segment is growing fastest?

Post-consumer recycled content jars, at 11.4%, half again the market rate of 7.6%. Roughly 18% of batches fail brand acceptance on colour and odour rather than performance.

Who are the major companies in the United States Plastic Jar Industry?

Berry Global, Amcor, Alpla, Silgan Holdings and Plastipak lead on disclosed rigid plastic packaging revenue. Pretium Packaging, Alpha Packaging, Comar and Logoplaste hold strong regional or format positions.

Which country is growing fastest?

India at 9.8%, driven by personal care, food and pharmaceutical manufacturing expanding alongside organised retail. China remains the largest producer at roughly 28% of global jar output.

Report Segmentation Architecture

The full report scope spans multiple orthogonal segmentation dimensions, with cross-tabulated demand data provided for each dimension pair. Coverage extends further to regional breakdowns, trend trajectories, and the competitive detail needed to support segment-level decision-making.

By Manufacturing Construction

  • Injection Moulded Jars
  • Injection Blow Moulded Jars
  • Injection Stretch Blow Moulded PET Jars
  • Extrusion Blow Moulded Jars
  • Post-Consumer Recycled Content Jars
  • Lightweighted and Thin-Wall Constructions

By End-Use Industry

  • Personal Care and Cosmetics
  • Food and Confectionery
  • Pharmaceutical and Nutraceutical
  • Household and Industrial Chemicals
  • Pet Care Products
  • Paint and Coatings

By Commercial Dimension

  • Brand Owned Tooling Supply
  • Converter Funded Tooling Agreement
  • On-Site Moulding Arrangement
  • Annual Contract Supply
  • Resin Indexed Contract
  • Spot and Transactional Supply

By Region

  • North America
  • Western Europe
  • East Asia
  • South Asia and Pacific
  • Latin America
  • Middle East and Africa
  • Eastern Europe

Scope, Methodology, and Coverage

Every figure in this report is reproducible from documented input assumptions. The scope below maps the historical period, the forecast horizon, the segmentation dimensions, and the countries covered, alongside the underlying primary and qualitative methodology.
Historical Period
2020 to 2025
Forecast Period
2026 to 2036
Base Year
2025 (USD billions; MMA Primary Research Dataset, August 2026)
Market Definition
Scope covers rigid plastic jars manufactured for filling by brand owners and contract packers, spanning injection moulded jars, injection blow moulded jars, injection stretch blow moulded polyethylene terephthalate jars, extrusion blow moulded jars, post-consumer recycled content constructions, and lightweighted and thin-wall designs. Closures, liners, induction seals and dispensing fitments, labels, sleeves and decoration, glass and metal containers, tubs and pails outside jar formats, flexible packaging, and filling and capping equipment are excluded. This report examines jar manufacture specifically; the complete packaging system including closure, seal and decoration is addressed in a separate MMA report.
Quantitative Units
USD billions (current prices); units moulded; tonnes of resin converted; recycled content percentage; tooling ownership share
Segmentation Dimensions
By Manufacturing Construction; By End-Use Industry; By Commercial Dimension; By Region
Regions Covered
North America, Western Europe, East Asia, South Asia and Pacific, Latin America, Middle East and Africa, Eastern Europe
Countries Covered
USA, China, India, Germany, Japan, Brazil, Mexico, Italy, UK, Vietnam, South Korea, Poland, Turkey, Saudi Arabia, France
Key Companies Profiled
Berry Global, Amcor, Alpla, Silgan Holdings, Plastipak, Gerresheimer, Pretium Packaging, Sonoco Products, Greif, TriMas Packaging, Comar, Alpha Packaging, Mold-Rite Plastics, Ring Container Technologies, Zhuhai Zhongfu, Zijiang Enterprise, Taiwan Hon Chuan, Indorama Ventures, Graham Packaging, Logoplaste
Quantitative Methodology
Primary survey, n=3,800 respondents, Q4 2025, six countries; demand-side model with trade association cross-validation
Qualitative Methodology
47 expert interviews, Q4 2025; applied to validate demand model assumptions, identify emerging dynamics, and assess competitive positioning
Report Format
PDF and XLSX data workbook (Word format preview document)
Publisher
Market Minds Advisory
Report Code
MMA-2026-PAC-106
Published
August 2026
Contact
sales@marketmindsadvisory.com | www.marketmindsadvisory.com

Purchase the full United States Plastic Jar Industry Report (2026 to 2036).

The full report runs to 170 pages and covers all six manufacturing construction segments, seven regions and 20 profiled companies in detail, with United States dynamics examined as the analytical focus. It includes the complete segment CAGR set, regional moulding capacity data, and tooling ownership analysis across major end-use industries. Company profiles carry evaluation on disclosed rigid plastic packaging revenue, with moat and risk assessment for the top five converters. The competitive section extends to 15 tracked corporate developments across 2024 and 2025, each with commercial interpretation. Primary research inputs include a quantitative survey of 3,800 respondents and 47 expert interviews conducted in Q4 2025.
Six manufacturing construction segments with individual CAGR forecasts
Seven regional markets with moulding capacity and consumption data
Twenty company profiles on consistent revenue evaluation basis
Fifteen tracked corporate developments with commercial interpretation notes
Tooling ownership analysis across major end-use industry categories
Recycled content acceptance failure modes mapped by rejection cause

Built For The People Who Decide

From boardroom strategy to bench-side execution, this report is read cover-to-cover by leaders shaping the next decade of their industry, turning demand scenarios, market dynamics and valuation benchmarks into decisions.
CXOs/ Presidents/ VPs/ Managers
M&A and Corporate Development
Strategy Teams and R&D Heads
Procurement and Product Directors
Regulatory and Compliance Leaders
Investor Relations and Equity Analysts