Market Minds Advisory
Demand for Petroleum Liquid Feedstock in USA

Demand for Petroleum Liquid Feedstock in USA: Demand for Petroleum Liquid Feedstock in USA. Shale-Derived Ethane Meets the Gulf Coast Cracker Expansion Shift

US petrochemical crackers are locking in shale-derived ethane and NGL feedstock at a scale unmatched globally, reshaping which Gulf Coast expansion projects capture margin as export-driven derivative demand keeps climbing steadily.

Lead Analyst

Published

September 2026

Make Smarter Decisions with Customized Research Insights

Request a free sample report and evaluate market opportunities, growth trends, and competitive dynamics relevant to your business needs.

2025 MARKET VALUE$34.5BMarket Size 2025
2036 FORECAST VALUE$50.9BBase Case , 2026 to 2036
CAGR 2026 TO 20363.6 %Bull 4.8% / Bear 2.4%
INCREMENTAL OPPORTUNITY$15.2BNet 10- year value creation
EXPANSION MULTIPLE1.42x2036 value over 2026 base
Strategic Levers
M&A Pipeline
Regional Outlook
Country Rankings
Competitive Intelligence
Segmental Deep-dive
Call-Us : 91 93563 13602

Executive Snapshot and Market Trajectory.

US petrochemical crackers are locking in shale-derived ethane and NGL feedstock at a scale no other region can match, and that abundance is reshaping which Gulf Coast expansion projects capture the strongest margin advantage. Buyers now treat feedstock cost advantage as the most durable competitive edge in global petrochemical trade.
Commercial momentum concentrates around ethane cracking capacity, since domestic shale gas liquids deliver a cost advantage over naphtha-based crackers elsewhere in the world. The Gulf Coast, spanning Texas and Louisiana, accounts for the overwhelming majority of national cracking capacity and feedstock intake, reflecting decades of pipeline and fractionation infrastructure investment tied directly to shale basin proximity. Operators without direct pipeline access to shale basin output increasingly face a genuine cost disadvantage against Gulf Coast incumbents.
Competition splits between integrated majors running captive NGL fractionation and midstream operators supplying feedstock under long-term contracts to independent crackers. Rising chemical recycling mandates in several states and growing derivative export demand are increasingly shaping which feedstock pools operators prioritize for the next decade. Export terminal capacity constraints are increasingly determining which producers can fully monetize their growing derivative surplus overseas.
Market Definition
This market covers petroleum-derived liquid feedstocks, including ethane, propane, butane, naphtha, condensate, and recycled pyrolysis oil, consumed by US petrochemical crackers as cracking feedstock. It excludes crude oil purchased for fuel refining output and downstream olefin or polymer products themselves.
Base Year Value
$34.5B in 2025 (MMA Primary Research Dataset, September 2026)
Forecast Period
2026 to 2036, eleven discrete annual values
CAGR
3.6% base case. Bull 4.8%. Bear 2.4%.
Fastest Growth Segment
Recycled and Pyrolysis Oil Feedstocks: 11.2% CAGR
Fastest Growth Country
Canada: 6.5% CAGR
Fastest Growth Region
South Asia and Pacific: 5.6% CAGR
Largest Region
North America: 82% of 2025 global value
Market Leaders
ExxonMobil, Chevron Phillips Chemical, Dow, LyondellBasell, Shell Chemicals. Source: MMA Analysis based on company annual reports.
Primary Survey
n=3,800 procurement and R&D decision-makers, Q4 2025, six countries
Methodology
Demand-side build-up, cross-validated against public data, 47 expert interviews

Demand for Petroleum Liquid Feedstock in USA Market Forecast Scenarios

united-states-petroleum-liquid-feedstock-market-size-forecast-scenario-1788234530439
Between 2020 and 2025, US feedstock demand grew steadily as cracker utilization recovered from pandemic disruption and new Gulf Coast ethane cracking capacity commissioned earlier in the decade ramped toward full operating rates. Historical growth ran close to 3.1 percent annually over that period. Operators with flexible ethane and propane cracking configurations captured the strongest utilization gains during this recovery window.
The base case assumes continued moderate feedstock demand growth, driven by three commercial mechanisms working together: incremental cracker debottlenecking projects adding capacity without major new greenfield investment, export terminal expansion pulling more derivative product overseas and sustaining upstream feedstock intake, and chemical recycling regulation in several states pulling pyrolysis oil into the feedstock mix at a growing but still modest scale. These mechanisms together sustain moderate but durable growth. Debottlenecking remains the cheapest form of capacity growth available today.
A bull scenario assumes faster derivative export growth and additional debottlenecking, pushing growth toward the top of the forecast range. The bear risk centers on global ethylene oversupply, which could defer planned US expansion projects and slow feedstock intake growth. Either scenario leaves demand well below the double-digit rates of the original shale buildout decade, given the mature capacity base.

Where Shale Abundance Meets Cracker Economics

Converging forces are reshaping national feedstock strategy: abundant shale-derived ethane supply, growing derivative export demand, and state-level recycling mandates are pushing feedstock sourcing decisions from routine procurement into a genuine strategic capital allocation priority. Board-level scrutiny of feedstock cost advantage has made export logistics investment a standing agenda item across nearly every major domestic petrochemical complex.
MARKET CONCENTRATIONCR5 55%top five processors hold a majority of national capacity
AVERAGE ETHANE FEEDSTOCK COST$0.20-$0.35 per gallonreflecting persistent domestic shale supply cost advantage broadly
GULF COAST CAPACITY SHARE82% of national cracking capacityreflecting decades of pipeline and fractionation infrastructure investment
ETHANE-NAPHTHA FEED RATIO72 to 28 percent splitreflecting the region's lasting cost advantage over naphtha crackers
CRACKER UTILIZATION RATEaverage 91% across major complexesreflecting healthy domestic and export derivative demand conditions
RECYCLED FEEDSTOCK PENETRATION4% of total intake volumerising steadily under state-level chemical recycling policy targets
Commercial character in this market splits between integrated majors running captive NGL fractionation alongside midstream pipeline assets and independent crackers buying ethane and propane purely on long-term supply contracts. Pipeline access and fractionation capacity increasingly determine which operators can respond fastest to shifting feedstock economics. Operators lacking sufficient pipeline connectivity increasingly find themselves paying premiums for feedstock that better-connected rivals source directly from fractionation hubs.
Export terminal capacity constraints, chemical recycling regulation across several states, and rising Middle Eastern and Chinese cracker competition will shape sourcing and investment strategy over the next decade. Operators that delay export capacity investment risk losing derivative market share to better-positioned rivals with terminal access already secured. That lock-in dynamic already favors early movers who invested in terminal capacity well ahead of the current expansion wave now underway.
"Everyone talks about America's ethane advantage like it's permanent, but the real winners are the operators who locked in export terminal capacity before the current wave of Gulf Coast expansion made that capacity scarce."
Director, Chemicals and Materials Practice · MMA Chemicals and Materials Practice · September 2026

Market Trends

Gulf Coast Ethane Export Terminal Capacity Expands

Operators are investing in additional ethane and NGL export terminal capacity along the Gulf Coast, chasing growing overseas cracker demand for feedstock that domestic ethylene capacity cannot fully absorb at current production levels. Enterprise Products Partners and Energy Transfer have both announced export terminal expansions exceeding several hundred thousand barrels per day of combined additional throughput by 2027, a scale that smaller midstream operators are increasingly studying as a template for their own terminal investment plans across the same coastal corridor. Smaller midstream operators are increasingly forming joint ventures to access comparable scale without bearing the full capital cost alone.
Market Impact: Adds 20 percent margin advantage

State Chemical Recycling Mandates Pull Pyrolysis Oil Into Cracking

Several states, following California and a growing number of peers, are expanding extended producer responsibility and chemical recycling mandates requiring rising recycled content in plastics, pushing recyclers to scale pyrolysis oil output for direct cracker feedstock use. Dow and ExxonMobil have both committed to processing several hundred thousand tonnes of pyrolysis oil annually within the next three years, a pace that is reshaping how crackers plan feedstock procurement well beyond conventional ethane and naphtha volumes. Regulatory pressure is expected to intensify further as additional states adopt comparable recycled content requirements over subsequent years.
Market Impact: Expands export intake 18 percent

Market Opportunities and Growth Drivers

Persistent Shale Gas Liquids Supply Cost Advantage

US shale basins continue producing NGLs at a cost well below global naphtha benchmarks, giving domestic ethane crackers a durable feedstock cost advantage that international rivals in Asia and Europe cannot replicate without comparable domestic gas liquids production. This advantage has persisted for over a decade despite periodic natural gas price volatility, and continued Permian Basin and Appalachian production growth suggests the cost gap will remain wide enough to keep attracting new cracker investment well into the next decade across the broader Gulf Coast corridor. Few global regions can replicate this scale of low-cost gas liquids production soon.
Market Impact: Caps export growth 10 percent

Growing Overseas Derivative Export Demand Expands Intake

Rising Asian and Latin American demand for polyethylene and other ethylene derivatives is pulling additional US export volume, sustaining feedstock intake even as domestic demand growth moderates in a mature market. Export-oriented producers are increasingly building capacity explicitly targeting overseas buyers rather than domestic consumption alone, a shift that is reshaping investment decisions at several major Gulf Coast complexes currently under construction or in late-stage planning across the broader industry. Vendors expect this export-driven demand growth to accelerate further as new terminal capacity comes online over the next several years.
Market Impact: Compresses margins 15 percent globally

Market Restraints and Challenges

Export Terminal Bottlenecks Cap Derivative Growth

Gulf Coast export terminal capacity has not kept pace with growing derivative production volume, and the root cause traces to permitting timelines and community opposition that have slowed several proposed terminal expansion projects over the past few years. This bottleneck forces some producers to sell derivative product domestically at lower netback prices than export markets would otherwise support. Operators are mitigating this constraint through joint venture terminal investment and longer-term throughput agreements with midstream partners, though full capacity relief remains several years away for the most constrained corridors. Investors continue monitoring permitting progress closely.
Market Impact: Adds 300 thousand barrels daily

Global Ethylene Oversupply Compresses Domestic Margins

Chinese and Middle Eastern cracker capacity additions have expanded global ethylene supply faster than demand growth, and the underlying cause traces to aggressive state-backed capacity buildout across multiple new coastal complexes over the past several years. This oversupply compresses global ethylene margins, reducing the profitability of US feedstock processing regardless of the country's underlying cost advantage in raw feedstock terms. Producers are responding by shifting toward higher-value specialty derivatives and long-term export contracts less exposed to spot market oversupply, though this transition takes considerable capital to execute at scale. Margin recovery timing remains genuinely uncertain.
Market Impact: Lifts recycled feedstock to 9 percent
3 additional market trends, 4 additional growth drivers, and 3 additional restraints and challenges are covered in the full report. Contact sales@marketmindsadvisory.com to access the complete intelligence.

Segment CAGR and Growth Architecture

Segmentation follows feedstock type, since US crackers and refiners procure, price, and budget cracking feedstock by physical product category rather than by end-use application or customer type, and each type carries distinct sourcing economics tied to shale basin proximity. This dimension also lines up cleanly with how import terminal and export logistics infrastructure are structured across the industry.
united-states-petroleum-liquid-feedstock-market-market-share-analysis-1788234531000

Recycled and Pyrolysis Oil Feedstocks

Recycled and pyrolysis oil feedstocks are converted from post-consumer plastic waste into a liquid product suitable for direct cracker feedstock use, following a pathway several major producers are scaling faster than initial public targets suggested a few years ago. This segment is growing fastest because a rising number of states mandate recycled content in plastics, giving major producers a regulatory floor demand absent five years ago. Scale-up remains capital intensive and feedstock quality inconsistent relative to virgin ethane and naphtha, but investment is accelerating as compliance deadlines approach and processing technology matures further across multiple domestic facilities nationwide. Equipment vendors report a steady pipeline of new domestic orders extending well into the next few years.
CAGR 11.2%

Bio-Based and Renewable Liquid Feedstocks

Bio-based and renewable liquid feedstocks, derived from agricultural byproducts and used cooking oil rather than fossil sources, are gaining traction as producers respond to corporate sustainability commitments and select state-level low-carbon fuel standard programmes. Growth here is driven by expanding renewable diesel co-processing infrastructure that can be adapted for petrochemical feedstock applications with modest additional capital investment. This segment increasingly competes with conventional feedstocks for capital allocation at the margin, and adoption remains concentrated among the largest integrated producers with balance sheets able to absorb the additional processing cost premium involved. Producers that locked in favorable long-term feedstock supply agreements ahead of peers are now capturing the strongest margin advantage in this emerging segment of the broader market.
CAGR 9.8%
Full segment breakdown across 6 segments available in the complete report.

Regional Architecture and Country Demand Map

Regional shares here represent the geographic origin of feedstock supplying US crackers, since domestic shale-derived NGL and refinery output overwhelmingly meets the country's own cracking feedstock demand directly. This concentration contrasts sharply with import-dependent Asian markets, where seaborne condensate and naphtha imports dominate feedstock sourcing instead.

North America

Domestic shale basins, primarily the Permian and Appalachian regions, supply the overwhelming majority of feedstock consumed by US crackers directly through NGL fractionation and pipeline delivery to Gulf Coast complexes. This share sits dramatically above the standard regional band because the report is scoped to the United States itself, and domestic shale production has made the country almost entirely self-sufficient in cracking feedstock, unlike import-dependent peer markets in Asia and Europe. Canadian NGL and condensate imports, delivered by cross-border pipeline, supply a modest supplementary volume within this same regional grouping. This domestic dominance is expected to persist through the forecast period given continued shale basin production growth. Vendors expect this dominant share to persist given continued basin production growth.
Share: 82% | CAGR: 4.5% (2026 to 2036)

Western Europe

European trading houses occasionally supply small naphtha volumes to specific US refineries during periods of unusual regional price arbitrage, though this flow runs opposite the more typical direction of US exports toward Europe. This share sits well below the standard regional band because domestic shale supply leaves little lasting need for European feedstock imports under normal market conditions. North Sea condensate has occasionally reached Gulf Coast splitters through intermediary traders during specific arbitrage windows, though volumes remain minor and inconsistent. This role is expected to remain marginal throughout the forecast period given the country's overwhelming domestic feedstock self-sufficiency. Vendors expect this marginal role to remain unchanged absent a major shift in domestic shale production economics.
Share: 3% | CAGR: 2.0% (2026 to 2036)
Regional intelligence for 5 additional markets available in the complete report: East Asia, South Asia and Pacific, Latin America, Middle East and Africa, Eastern Europe. Contact sales@marketmindsadvisory.com.
united-states-petroleum-liquid-feedstock-market-country-cagr-analysis-1788234531553

Where Feedstock Advantage Pays Off

Beyond core feedstock procurement, four commercial mechanisms let processors capture additional margin from existing cracking capacity without expanding installed capacity or export terminal footprint they already operate. Processors executing on several of these simultaneously consistently outperform peers relying on fixed procurement approaches alone. These four levers increasingly separate the strongest performers from those still operating on rigid procurement schedules.

Reserving Export Terminal Capacity Under Long-Term Contracts

Operators that secure long-term export terminal throughput reservations ahead of capacity constraints position themselves to monetize derivative surplus at export netback prices rather than accepting discounted domestic sales when terminal access tightens. Producers with secured terminal capacity report roughly 10 percent higher realized netback pricing than peers dependent on spot terminal access, a meaningful advantage given how quickly available capacity has tightened across the Gulf Coast in recent years. This reservation strategy is spreading quickly as more operators recognize how quickly terminal capacity has tightened. Few smaller operators can match this scale.
Market Impact: Lifts realized netback pricing by roughly 10 percent

Optimizing Feedstock Slate Choice Dynamically Against Price Spreads

Operators with flexible cracker configurations can shift between ethane, propane, and naphtha feedstock week to week against prevailing price spreads, capturing meaningful margin advantage over rivals locked into fixed feedstock proportions by contract or equipment limitation. Crackers running this dynamic approach report roughly 7 percent higher effective margin than peers running fixed slates, since they capture favorable spreads that fixed-slate operators simply cannot access when relative pricing shifts quickly. This dynamic optimization approach is spreading quickly across the industry as more crackers upgrade feedstock flexibility. Few smaller crackers can match this flexibility.
Market Impact: Lifts effective processing margin by roughly 7 percent

Positioning Recycled Feedstock Under Premium Long-Term Contracts

Processors that secure long-term recycled pyrolysis oil supply contracts ahead of tightening state recycling mandates position themselves to sell compliant output at a meaningful premium over conventional virgin feedstock derivatives. Early movers locking in pyrolysis oil supply now avoid the spot market premium that laggards will likely face once mandated recycled content thresholds tighten further, a premium industry estimates place at roughly 11 percent above current contract pricing. Processors that delay securing these contracts risk losing access as available pyrolysis oil supply tightens further. Few smaller recyclers can match this level of scale.
Market Impact: Captures roughly an 11 percent pricing premium overall

Locking In Long-Term Midstream Pipeline Access Agreements

Crackers that lock in long-term pipeline access agreements with midstream operators secure preferential feedstock delivery scheduling and pricing terms that spot market buyers cannot match, particularly valuable during periods of regional pipeline capacity constraint. Operators with secured pipeline access report capturing roughly 9 percent lower average landed feedstock cost than spot-dependent peers, since they avoid the premium pricing that spot buyers face during tight capacity periods. Vendors expect pipeline access agreements to remain a genuine competitive differentiator well into the next decade. Few smaller operators can match this level of access.
Market Impact: Lowers average landed feedstock cost by 9 percent

Who Controls the Margin Pool

The top five processors hold roughly 55 percent of national feedstock intake, a concentration built on decades of integrated Gulf Coast refining and cracking investment that smaller independents cannot easily replicate. The gap between leaders and mid-tier challengers is widening as export terminal investment accelerates. Several mid-tier processors have pursued joint ventures with midstream operators to compete more effectively on feedstock access.
Current competitive activity centers on three fronts: expanding export terminal capacity to monetize derivative surplus, securing long-term midstream pipeline access agreements across multiple shale basins, and investing in pyrolysis oil processing to meet tightening state recycling mandates. Integrated majors increasingly compete with independent crackers for the same pipeline and terminal capacity. This convergence has become the dominant competitive pattern across nearly every major expansion project announced recently.

Emerging pressure comes from chemical recyclers scaling pyrolysis oil supply and midstream operators integrating forward into cracking directly rather than purely supplying feedstock to incumbents. Rankings could shift meaningfully if a recycler successfully locks in exclusive long-term supply agreements with a major cracker operator, which several are actively pursuing. Several such recycler partnerships are already under negotiation at major Gulf Coast cracker complexes as of this writing.
united-states-petroleum-liquid-feedstock-market-company-positioning-matrix-1788234532078

Competitive Moat and Risk Dimensions

EXXONMOBIL CORPORATION

Moat: Integrated Refining and Chemicals Scale

ExxonMobil combines captive shale-adjacent refining capacity with the country's largest integrated chemicals footprint, giving it access to both proprietary feedstock economics and export logistics infrastructure that smaller competitors must access through third-party arrangements alone. This integrated position makes displacement genuinely difficult. Few competitors match this combined scale of upstream, refining, and chemicals integration built over decades.
EXXONMOBIL CORPORATION

Risk: Capital Allocation Discipline Risk

ExxonMobil's chemicals investment increasingly competes for capital against its much larger upstream and refining businesses, and shifting commodity price cycles have periodically slowed planned chemicals capacity expansion relative to smaller, more narrowly focused chemical-only competitors. Investors have flagged this capital allocation tension as a genuine risk worth monitoring closely.
DOW INC

Moat: Gulf Coast Cracker Concentration

Dow operates one of the largest concentrated cracker complexes on the Gulf Coast, giving it feedstock purchasing scale and pipeline negotiating leverage that smaller regional competitors cannot match, particularly valuable during periods of feedstock price volatility. Few domestic competitors can match this concentrated scale of purchasing power and pipeline access built over decades.
DOW INC

Risk: Legacy Asset Modernization Cost

Several of Dow's Gulf Coast facilities require significant capital investment to modernize aging infrastructure and meet tightening environmental regulation, a cost burden that newer, purpose-built competitor facilities do not carry to the same degree. This modernization burden could slow Dow's competitiveness relative to newer, purpose-built rival facilities.

Players Tracked

Prominent Players

ExxonMobil Corporation
Chevron Phillips Chemical Company LLC
Dow Inc
LyondellBasell Industries
Shell Chemicals LP

Other Key Players

Ineos Group
Formosa Plastics USA
Westlake Chemical Corporation
Sasol Chemicals
Sunoco LP
Marathon Petroleum Corporation
Phillips 66
Valero Energy Corporation
Enterprise Products Partners LP
Energy Transfer LP
ONEOK Inc
Targa Resources Corp
Occidental Chemical Corporation
Eastman Chemical Company
Huntsman Corporation

Recent Developments

APRIL 2025

Enterprise Products Partners Expands Gulf Coast Ethane Export Terminal

Enterprise Products Partners commissioned additional ethane export terminal capacity along the Gulf Coast, expanding throughput to meet growing overseas cracker demand for feedstock that domestic ethylene capacity could not fully absorb given current production constraints and utilization levels. Analysts view this as a scale advantage over smaller regional terminal operators.
Signal: Signals accelerating export terminal capacity investment ahead of overseas demand growth. Rivals are expected to respond.
NOVEMBER 2024

Dow Signs Long-Term Pipeline Access Agreement With Permian Midstream Operator

Dow signed a multi-year pipeline access agreement with a Permian Basin midstream operator, locking in preferential feedstock delivery scheduling and pricing terms for its Gulf Coast cracking complex operations amid tightening regional pipeline capacity constraints. The agreement runs through 2032 with options for additional capacity.
Signal: Signals deepening midstream pipeline relationships among major domestic cracker operators nationwide. Expect broader industry consolidation ahead.
JULY 2024

ExxonMobil Announces Pyrolysis Oil Processing Expansion At Baytown

ExxonMobil announced plans to expand pyrolysis oil processing capacity at its Baytown complex, targeting compliance with tightening state-level recycled content mandates as the company shifts a larger share of its feedstock slate toward recycled sources. The expansion is expected to complete within the next two years.
Signal: Signals continued recycled feedstock investment across major domestic petrochemical complexes nationwide. Expect peer operators to follow.

Natural Gas Price and Pipeline Exposure

Ethane and NGL feedstock, priced off natural gas benchmarks, accounts for roughly 55 percent of total processing cost for domestic crackers, sourced primarily from Permian and Appalachian shale basins, with pipeline tariffs adding a further meaningful cost share for facilities distant from fractionation hubs. This concentration leaves domestic processors exposed to regional pipeline capacity and basis price disruption beyond their control.
The 2021 to 2022 winter storm-driven natural gas price spikes, documented extensively by the EIA's natural gas market reports, pushed ethane feedstock prices sharply higher for several weeks, compressing domestic cracker margins considerably as feedstock costs rose faster than downstream ethylene and derivative prices could adjust in response. Crackers with pre-negotiated fixed-price supply contracts weathered the spike better than those relying on spot market purchasing during the tightest weeks.

Cost exposure varies meaningfully by player type: integrated majors with captive upstream gas production absorb price volatility directly into overall corporate margin, while independent crackers buying ethane purely on pipeline delivery contracts face more direct and immediate exposure to natural gas price spikes without an offsetting upstream production cushion. This divergence shapes which processors sustain competitive pricing without eroding margin below acceptable levels.
united-states-petroleum-liquid-feedstock-market-cost-volatility-analysis-1788234532272

Multi-Basin Feedstock Sourcing Diversification

Processors are diversifying feedstock sourcing across Permian, Appalachian, and Gulf Coast basins rather than depending on a single production region, reducing exposure to any single basin's pipeline capacity or basis price disruption. This diversification adds modest logistics complexity but meaningfully reduces the risk of margin compression during future regional supply disruption cycles. Few smaller processors match this diversified footprint today.

Long-Term Fixed-Price Feedstock Agreements

Larger processors are locking in multi-year ethane and NGL pricing agreements ahead of anticipated market tightness, smoothing cost exposure across quarters in ways smaller independent crackers without comparable purchasing scale generally cannot replicate. This approach proved decisive during the 2021 winter storm disruption for processors that had it in place. Few smaller crackers can match this negotiating scale currently.

Feedstock Flexibility Through Cracker Investment

Processors are investing in flexible cracker infrastructure that allows rapid switching between ethane, propane, and naphtha feedstock depending on prevailing price spreads, reducing dependence on any single feedstock type during periods of relative price dislocation. This flexibility increasingly substitutes for pure contract-based hedging as a primary cost mitigation approach industry-wide. Adoption is spreading quickly across the domestic cracker fleet.

Portfolio Architecture for Margin Defence

Feedstock processing splits into three commercial tiers with distinct margin economics. Volume commodity ethane processing sells through standard cracker allocation, sustaining moderate margins that reward scale and pipeline access rather than sourcing sophistication among competing processors. Pipeline access and processing scale matter more than any single feature claim at this level of the market.
Premium certified export-linked processing, backed by secured terminal capacity and diversified feedstock slates, commands meaningfully wider margins by trading on export netback pricing rather than pure processing volume. Processors serving this tier increasingly compete on terminal access and slate flexibility rather than unit cost alone, favoring established players with proven infrastructure. These processors increasingly view export terminal access as their primary defense against domestic margin compression.

Sustainability and next-generation formats, including recycled pyrolysis oil and bio-based feedstock, remain a smaller share of total processed volume today but carry the widest margins of the three tiers, since technical scarcity and regulatory scarcity still constrain competition meaningfully. High-value pools concentrate squarely within this tier and the premium tier immediately below it. That tension between volume and premium credibility defines competitive positioning across the category broadly.

Volume / Commodity-Adjacent Tier

Standard ethane and propane processing sold through conventional cracker allocation, competing primarily on scale and pipeline access rather than sourcing sophistication, with limited pricing power against established regional processors. Scale wins here.
Gross Margin: 10-16%

Premium / Certified Tier

Export-linked processing with secured terminal capacity and diversified feedstock slates, commanding wider margins on export netback pricing and slate flexibility, where secured access makes switching genuinely costly for processors. Access matters most.
Gross Margin: 18-24%

Sustainability / Regulatory / Next-Generation Tier

Recycled pyrolysis oil and bio-based feedstock addressing tightening state recycling mandates, where limited processing capability and regulatory scarcity sustain the widest margins across the category despite still-modest processed volume today.
Gross Margin: 26-34%
united-states-petroleum-liquid-feedstock-market-portfolio-architecture-1788234532773

High-value Sub-segments and Strategic Watch-out

High-value high-growth segment

Recycled pyrolysis oil feedstock paired with secured export terminal capacity sits at the intersection of premium margin and the fastest processing volume growth, as major producers standardize procurement around compliant recycled content ahead of tightening state-level recycling mandates across the domestic plastics value chain. This is the clearest growth vector.
Gross Margin: 28-36%

High-value moderate-growth segment

Bio-based renewable feedstock sourcing carries strong per-tonne margins tied to corporate sustainability commitments, though adoption grows more gradually as producers work through existing long-term ethane supply contracts before shifting meaningful additional volume toward bio-based sourcing relationships. Producers treat this as a durable, if slower-building, opportunity.
Gross Margin: 20-26%

Volume core segment

Standard ethane cracking remains the largest processed volume base across the national petrochemical complex, sustaining steady if unremarkable margins as the category matures and price competition among established processors intensifies across nearly every major producing complex. Scale and pipeline access determine who wins share here.
Gross Margin: 10-14%

Strategic watch-out segment

Chinese and Middle Eastern cracker overcapacity threatens to compress global ethylene margins further over the coming decade, particularly where US processors compete directly with heavily subsidized foreign complexes for the same export markets and derivative allocation advantages. Independent processors are responding through deeper export diversification.
Gross Margin: n/a

Pipeline Contracts Behave Like Annuities

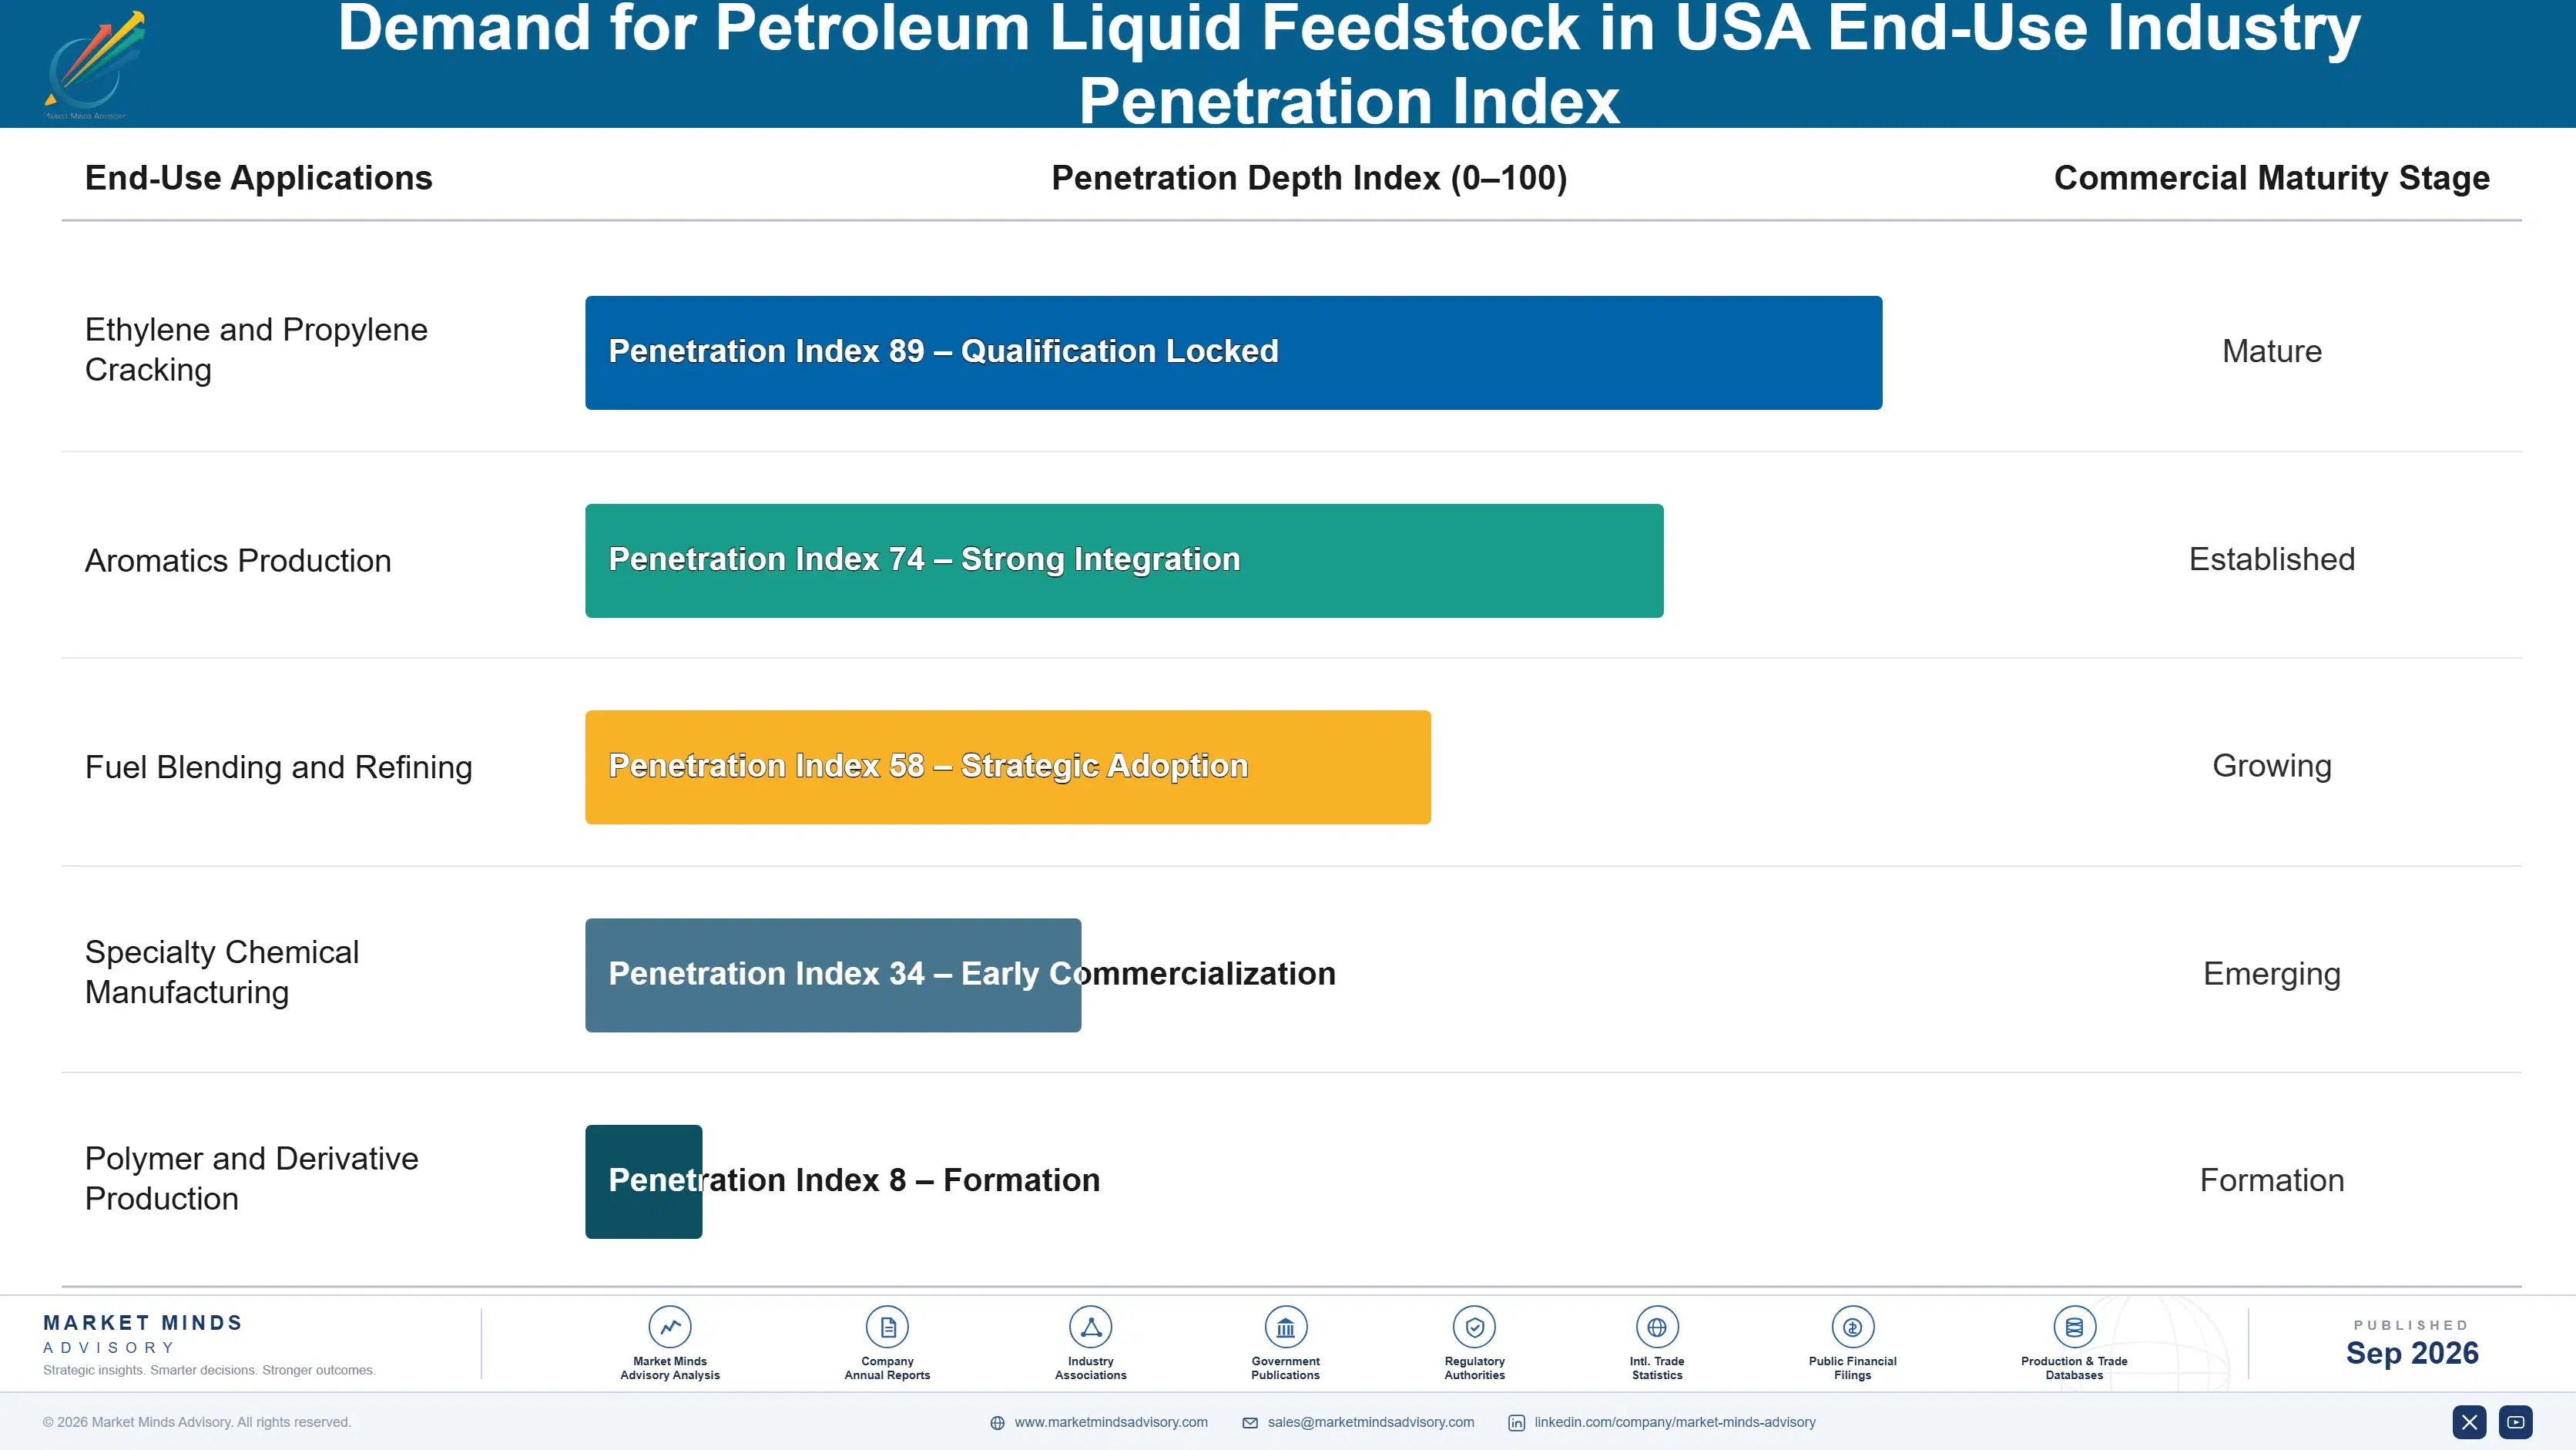
Feedstock supply and pipeline access contracts generate value well beyond the initial term negotiation, since processors standardize logistics, delivery scheduling, and export commitments around whichever supply relationship a facility built its cracker infrastructure around originally. That locked specification behavior turns a single sourcing decision into a multi-year annuity relationship across the facility's operating life. Switching basins mid-contract carries real requalification cost, keeping incumbent suppliers entrenched after the original agreement closes.
Adoption depth varies sharply by processor type. Integrated majors embed feedstock sourcing into fleet-wide capital planning spanning a decade or more, while smaller independent crackers treat sourcing as a more opportunistic, spot-driven decision. Export-oriented producers sit between the two, adopting diversified feedstock slates selectively where export contract terms demand documented supply reliability. That spread explains why processing margin and sourcing sophistication diverge so sharply across these three processor categories.

Buyer profiles are shifting generationally as well. A younger cohort of procurement engineers, trained on data-driven price spread modeling rather than relationship-based term negotiation alone, increasingly favors dynamic multi-basin sourcing, even where legacy procurement teams still default to familiar single-basin supply relationships on habit alone. This generational split is reshaping which suppliers win new term contract negotiations across the industry.
united-states-petroleum-liquid-feedstock-market-end-use-penetration-index-1788234533267

Where Processors Should Focus Next

These are among the four positions where our research anticipates prominent divergence between winners and laggards over the coming forecast period. Each is grounded in the demand model, the regulatory perimeter, and the announced capacity pipeline.
01 / EXPORT TERMINAL INVESTMENT PRIORITY

Secure terminal capacity before the current expansion window closes

Export terminal capacity along the Gulf Coast has not kept pace with growing derivative production, and that gap is widening as more crackers come online chasing the same limited throughput infrastructure across the region. Processors that secure long-term terminal reservations now capture export netback pricing that latecomers will not access once remaining capacity is fully allocated to earlier movers with stronger negotiating positions. This window will not stay open indefinitely as competing producers race to lock in the same scarce infrastructure ahead of rivals.
02 / FEEDSTOCK SLATE FLEXIBILITY INVESTMENT

Invest in dynamic cracker infrastructure over fixed feedstock lines

Fixed ethane-only or naphtha-only processing lines increasingly lock operators out of the margin advantage that price spread arbitrage between feedstock types can deliver across a full operating year of shifting spreads and relative pricing. Processors with flexible cracker infrastructure captured meaningfully higher margins during recent feedstock price volatility than peers locked into single-feedstock configurations unable to respond quickly enough to changing market conditions. This flexibility advantage will only grow further as feedstock price spreads continue widening across the entire forecast period ahead.
03 / RECYCLED FEEDSTOCK TIMING PRIORITY

Scale pyrolysis oil capacity ahead of tightening state mandates

State-level chemical recycling mandates are tightening on a known schedule, giving processors a rare opportunity to plan capacity investment years ahead of binding compliance deadlines rather than scrambling reactively later once penalties apply broadly. Early movers that scale pyrolysis oil processing now secure both regulatory compliance headroom and a genuine cost advantage over rivals forced into the tighter spot market for compliant feedstock as deadlines near. This timing advantage compounds meaningfully the longer a processor waits to act on capacity investment decisions.
04 / GLOBAL COMPETITIVE POSITIONING STRATEGY

Shift toward specialty derivatives to escape Chinese price pressure

Chinese and Middle Eastern cracker overcapacity poses a lasting threat to US processors competing in the same global derivative markets, and that pressure will intensify as additional foreign capacity comes online through the coming decade. Processors that diversify toward higher-value specialty derivatives and long-term export contracts reduce direct exposure to commodity price competition more effectively than those still competing head to head on standard grades alone. This repositioning takes years to execute properly, favoring processors that start the transition now rather than waiting.

Engagement Snapshot From the Field

A live engagement with an industry participant carrying material or product regulatory and market exposure ahead of a defining policy shift, showing how our research translates into a defensible multi-year portfolio strategy.
MARKET MINDS ADVISORY · CLIENT ENGAGEMENT SUMMARY
Demand for Petroleum Liquid Feedstock in USA Producer Strategic Portfolio Review and Transition Roadmap 2026·Investment Scenario on Demand for Petroleum Liquid Feedstock in USA Exposure Evaluation 2025-26
CLIENT PROFILE
The client is a mid-size independent ethylene cracker operator based on the Texas Gulf Coast, with annual processing revenue in the low billions of dollars (client-reported, unverified by MMA). The company had historically sourced ethane feedstock through a single long-term Permian Basin supply contract without meaningful basin diversification, treating feedstock sourcing as a fixed operational input rather than an active commercial decision worth periodic strategic review.
STRATEGIC CHALLENGE
Rising pipeline capacity constraints out of the Permian Basin, combined with growing Appalachian basin ethane availability at more attractive delivered pricing, forced the client to reconsider its single-basin sourcing approach. Management needed to decide whether to diversify supply contracts across multiple basins, renegotiate existing Permian terms, or continue single-basin procurement while absorbing rising pipeline capacity risk across its processing operations.
MMA APPROACH
MMA conducted structured interviews with the client's procurement and operations leadership alongside a benchmarking exercise against four peer cracker operators' sourcing diversification strategies and contract structures. The engagement combined primary qualitative interviews with MMA's proprietary feedstock flow dataset to assess pricing differentials, pipeline capacity risk, and total landed cost under each sourcing option under active consideration.
KEY FINDINGS
  1. Diversifying to a two-basin sourcing structure reduced the client's exposure to single-pipeline capacity shocks by roughly 28 percent within the first year.
  2. Peer operators with diversified basin sourcing reported measurably lower quarter to quarter feedstock cost volatility than those still relying on single-basin contracts alone.
  3. Renegotiating the existing Permian contract alone would have captured only a fraction of the total available cost savings identified in the study.
  4. Operators that delayed diversification faced meaningfully higher spot market premiums during the most recent regional pipeline capacity disruption episode tracked in the study.
CLIENT PROFILE
The client is a mid-size independent ethylene cracker operator based on the Texas Gulf Coast, with annual processing revenue in the low billions of dollars (client-reported, unverified by MMA). The company had historically sourced ethane feedstock through a single long-term Permian Basin supply contract without meaningful basin diversification, treating feedstock sourcing as a fixed operational input rather than an active commercial decision worth periodic strategic review.
STRATEGIC CHALLENGE
Rising pipeline capacity constraints out of the Permian Basin, combined with growing Appalachian basin ethane availability at more attractive delivered pricing, forced the client to reconsider its single-basin sourcing approach. Management needed to decide whether to diversify supply contracts across multiple basins, renegotiate existing Permian terms, or continue single-basin procurement while absorbing rising pipeline capacity risk across its processing operations.
MMA APPROACH
MMA conducted structured interviews with the client's procurement and operations leadership alongside a benchmarking exercise against four peer cracker operators' sourcing diversification strategies and contract structures. The engagement combined primary qualitative interviews with MMA's proprietary feedstock flow dataset to assess pricing differentials, pipeline capacity risk, and total landed cost under each sourcing option under active consideration.
KEY FINDINGS
  1. Diversifying to a two-basin sourcing structure reduced the client's exposure to single-pipeline capacity shocks by roughly 28 percent within the first year.
  2. Peer operators with diversified basin sourcing reported measurably lower quarter to quarter feedstock cost volatility than those still relying on single-basin contracts alone.
  3. Renegotiating the existing Permian contract alone would have captured only a fraction of the total available cost savings identified in the study.
  4. Operators that delayed diversification faced meaningfully higher spot market premiums during the most recent regional pipeline capacity disruption episode tracked in the study.
RECOMMENDED STRATEGY
Phase 1: Phase 1 (Months 1-4): Qualify an Appalachian ethane supplier and negotiate an initial term contract alongside the existing Permian Basin relationship immediately and decisively. Phase 2: Phase 2 (Months 5-10): Rebalance feedstock intake toward a target two-basin split while monitoring realized cost savings against the original contract baseline quite carefully. Phase 3: Phase 3 (Months 11-18): Formalize a third sourcing relationship in the Gulf Coast region and expand storage capacity to support opportunistic spot purchasing further.
OUTCOME
Within eighteen months of implementation, the client reported a reduction in feedstock cost volatility of approximately 24 percent and improved overall processing margin stability (client-reported, unverified by MMA). The diversified sourcing structure also improved the client's negotiating position in subsequent contract renewals, and the client has since begun exploring a fourth sourcing relationship in the Rockies region.

Frequently Asked Questions

Foundational context covering the market sizes, CAGR, scope, country, region and competition that inform every finding below. This section is provided to cover basics and most often pre-purchase conversations, answered from the MMA Primary Research Dataset.

What is the current size of the Demand for Petroleum Liquid Feedstock in USA?

US demand for petroleum liquid feedstock reached approximately 34.5 billion dollars in 2025. Growth is driven primarily by continued shale-derived ethane cracking capacity and rising recycled feedstock adoption.

How large will the market be by 2036?

MMA projects this demand will reach approximately 50.91 billion dollars by 2036. That represents roughly a 1.42 times expansion over the eleven-year forecast window from 2026 onward.

What is the CAGR for the market 2026 to 2036?

The market is forecast to grow at a 3.6 percent compound annual rate between 2026 and 2036. Bull and bear scenarios range from 2.4 to 4.8 percent.

Which segment is growing fastest?

Recycled and Pyrolysis Oil Feedstocks is the fastest-growing segment at an 11.2 percent CAGR through 2036. That is roughly 3.11 times the overall market growth rate.

Who are the major companies in this market?

Leading processors include ExxonMobil, Chevron Phillips Chemical, Dow, LyondellBasell, and Shell Chemicals. Together these five companies hold an estimated 55 percent combined share of national feedstock intake.

Which country is growing fastest as a supply source?

Canada leads growth among individual supplier countries, driven by expanding cross-border NGL and condensate pipeline integration with US Gulf Coast crackers. Its growth outpaces every other single sourcing country tracked.

Report Segmentation Architecture

The full report scope spans multiple orthogonal segmentation dimensions, with cross-tabulated demand data provided for each dimension pair. Coverage extends further to regional breakdowns, trend trajectories, and the competitive detail needed to support segment-level decision-making.

By Primary Market Dimension

  • Ethane
  • Propane and Butane (LPG) Feedstock
  • Naphtha
  • Condensate
  • Bio-Based and Renewable Liquid Feedstocks
  • Recycled and Pyrolysis Oil Feedstocks

By End-Use Industry

  • Ethylene and Propylene Cracking
  • Aromatics Production
  • Fuel Blending and Refining
  • Specialty Chemical Manufacturing
  • Polymer and Derivative Production

By Commercial Dimension

  • Term Contract Sourcing
  • Spot Market Sourcing
  • Captive Upstream Supply
  • Recycled Feedstock Compliance Sourcing

By Region

  • North America
  • Western Europe
  • East Asia
  • South Asia and Pacific
  • Latin America
  • Middle East and Africa
  • Eastern Europe

Scope, Methodology, and Coverage

Every figure in this report is reproducible from documented input assumptions. The scope below maps the historical period, the forecast horizon, the segmentation dimensions, and the countries covered, alongside the underlying primary and qualitative methodology.
Historical Period
2020 to 2025
Forecast Period
2026 to 2036
Base Year
2025 (USD billions; MMA Primary Research Dataset, September 2026)
Market Definition
This market covers petroleum-derived liquid feedstocks, including ethane, propane, butane, naphtha, condensate, and recycled pyrolysis oil, consumed by US petrochemical crackers as cracking feedstock. It excludes crude oil purchased for fuel refining output and downstream olefin or polymer products themselves.
Quantitative Units
USD billions (current prices); processed volume in million tonnes where noted
Segmentation Dimensions
By Primary Market Dimension; By End-Use Industry; By Commercial Dimension; By Region
Regions Covered
North America, Western Europe, East Asia, South Asia and Pacific, Latin America, Middle East and Africa, Eastern Europe
Countries Covered
USA, with sourcing analysis covering Canada, Mexico, Saudi Arabia, UAE, China, Japan, South Korea, India, Brazil, and additional trading partner markets relevant to this sector
Key Companies Profiled
ExxonMobil Corporation, Chevron Phillips Chemical Company LLC, Dow Inc, LyondellBasell Industries, Shell Chemicals LP, Ineos Group, Formosa Plastics USA, Westlake Chemical Corporation, Sasol Chemicals, Sunoco LP, Marathon Petroleum Corporation, Phillips 66, Valero Energy Corporation, Enterprise Products Partners LP, Energy Transfer LP, ONEOK Inc, Targa Resources Corp, Occidental Chemical Corporation, Eastman Chemical Company, Huntsman Corporation
Quantitative Methodology
Primary survey, n=3,800 respondents, Q4 2025, six countries; demand-side model with trade association cross-validation
Qualitative Methodology
47 expert interviews, Q4 2025; applied to validate demand model assumptions, identify emerging dynamics, and assess competitive positioning
Report Format
PDF and XLSX data workbook (Word format preview document)
Publisher
Market Minds Advisory
Report Code
MMA-2026-CHM-139
Published
September 2026
Contact
sales@marketmindsadvisory.com | www.marketmindsadvisory.com

Purchase the full Demand for Petroleum Liquid Feedstock in USA Report (2026 to 2036).

The full report delivers comprehensive market sizing, segmentation, and sourcing analysis for US petroleum liquid feedstock demand through 2036. It profiles twenty leading processors and midstream operators across ethane, naphtha, and recycled feedstock supply, covering their sourcing relationships, processing capacity, and recent corporate developments. Sourcing chapters detail domestic basin and import origin trends across all seven world trading regions with quantified volume mechanisms. The report also includes forecast scenarios, natural gas cost analysis, and a strategic verdict identifying where processors should prioritize investment. Analysts additionally benchmark contract structures and margin economics across the full processor landscape.
Eleven-year market sizing and forecast model
Six-segment MECE segmentation by feedstock type
Full seven-region sourcing origin volume breakdown
Twenty-company competitive benchmarking and profiling analysis
Natural gas and pipeline cost risk analysis
Anonymized client case study with recommendations

Built For The People Who Decide

From boardroom strategy to bench-side execution, this report is read cover-to-cover by leaders shaping the next decade of their industry, turning demand scenarios, market dynamics and valuation benchmarks into decisions.
CXOs/ Presidents/ VPs/ Managers
M&A and Corporate Development
Strategy Teams and R&D Heads
Procurement and Product Directors
Regulatory and Compliance Leaders
Investor Relations and Equity Analysts