

Market Minds Advisory
United States Merchandising Unit Market

United States Merchandising Unit Market: Paid For by One Party, Deployed by Another

A brand pays for the display, ships it, and then a store manager decides whether it goes on the floor at all, which happens rather less often than anybody budgeting for it assumes.

Lead Analyst

Bilal Shaikh

Published

September 2026

Make Smarter Decisions with Customized Research Insights

Request a free sample report and evaluate market opportunities, growth trends, and competitive dynamics relevant to your business needs.

2025 MARKET VALUE$6.8BMarket Size 2025
2036 FORECAST VALUE$10.9BBase Case , 2026 to 2036
CAGR 2026 TO 20364.4 %Bull 5.6% / Bear 3.2%
INCREMENTAL OPPORTUNITY$3.8BNet 10- year value creation
EXPANSION MULTIPLE1.54x2036 value over 2026 base
Strategic Levers
M&A Pipeline
Regional Outlook
Country Rankings
Competitive Intelligence
Segmental Deep-dive
Call-Us : 91 93563 13602

Executive Snapshot and Market Trajectory

The awkward fact about this industry is that the buyer does not control the outcome. A brand funds and ships a display, and a store manager decides whether it reaches the floor. Around 58% of units are actually placed as intended, and the spend happens before anybody knows which ones.
Temporary corrugated units make that worse rather than better. They sit on a floor for roughly four weeks and are then discarded, and freight consumes around 24% of delivered cost because shipping a large empty structure is priced on cubic volume rather than weight. The economics reward compactness far more than they reward design. Designers optimising for shelf presence without a freight model produce units that cost more to deliver than the promotion can justify.
Retail media is the structural pressure nobody in the display trade wants to discuss. Around 19% of trade spending has moved into on-site retail advertising, which is measurable, attributable and does not require a store manager's cooperation. Semi-permanent hybrid units grow at 6.6%, half again the market rate of 4.4%, precisely because they stay put. A unit remaining for months spreads freight and compliance risk considerably further.
Market Definition
Point of purchase merchandising units supplied into United States retail, covering temporary corrugated displays, permanent metal and wood fixtures, semi-permanent hybrid units, pallet and bulk displays, counter and shelf units, and digitally integrated merchandising units. Measured at manufacturer selling value. Excludes warehouse racking and storage systems, standalone digital signage hardware, retail media advertising inventory, and store construction and fit-out work.
Base Year Value
$6.8B in 2025 (MMA Primary Research Dataset, August 2026)
Forecast Period
2026 to 2036, eleven discrete annual values
CAGR
4.4% base case. Bull 5.6%. Bear 3.2%.
Fastest Growth Segment
Semi-Permanent Hybrid Units: 6.6% CAGR
Fastest Growth Country
Georgia: 7.2% CAGR
Fastest Growth Region
South Asia and Pacific: 6.2% CAGR
Largest Region
North America: 91% of 2025 global value
Market Leaders
WestRock, International Paper, Menasha Packaging, Great Northern Instore, DS Smith. Source: MMA Primary Research Dataset, July 2026.
Primary Survey
n=3,800 procurement and R&D decision-makers, Q4 2025, six countries
Methodology
Demand-side build-up, cross-validated against public data, 47 expert interviews

United States Merchandising Unit Market Forecast Scenarios

united-states-merchandising-unit-market-size-forecast-scenario-1787641043409
Growth ran near 3.4% between 2020 and 2025 as retail media networks absorbed trade spending that had previously gone into physical display. Temporary corrugated volume fell in real terms across the period while semi-permanent constructions held better, since anything remaining on the floor for months rather than weeks delivers a measurable return. Freight cost increases weighed disproportionately on large lightweight structures throughout.
Base case 4.4% rests on three mechanisms. Semi-permanent hybrid units grow at 6.6% because longer floor life answers the attribution question retail media raised. Digitally integrated units grow at 6.0% as brands seek measurement inside physical space. And Georgia grows fastest of any state at 7.2%, where retail distribution, store opening activity and display fulfilment capacity all concentrate together. None of the three depends on retail floor space expanding, which has been broadly flat for years.
The bull case at 5.6% assumes brands rebalancing back toward physical presence as retail media inventory prices rise, which several are already testing quietly. The bear case at 3.2% is retail media continuing to absorb trade budget, since it offers attribution a corrugated display cannot and requires no cooperation from a store manager who has other priorities that week.

Someone Else Decides

Everything difficult about this business follows from a split between who pays and who decides. A brand funds the display, agrees the design, commits the volume and ships it to hundreds of stores. A store manager with competing priorities then decides whether it is assembled, where it stands and how long it stays. Around 58% of units reach the floor as intended, and the money was committed months earlier.
TOP FIVE CONCENTRATION26%Highly fragmented with regional converters holding substantial positions
DISPLAY COMPLIANCE RATE58%Units actually placed as the brand intended them to be
TEMPORARY DISPLAY LIFE4 weeksTime a promotional unit typically stays on a retail floor
FREIGHT SHARE OF COST24%Delivered cost consumed by shipping largely empty structures
RETAIL MEDIA BUDGET SHIFT19%Trade spending moved from physical display into onsite advertising
REMODEL CYCLE INTERVAL7 yearsPeriod between fixture replacement programmes at a typical chain
Temporary corrugated construction compounds the problem economically. A promotional unit occupies a floor for roughly four weeks and is then discarded, while freight absorbs around 24% of delivered cost because a large hollow structure is charged on the space it occupies in a trailer rather than what it weighs. The result rewards flat-packing far more than anything a designer would call good display.
Retail media has meanwhile taken around 19% of the trade budget that used to fund physical presence, and it did so by offering exactly what display cannot: attribution. A brand buying onsite advertising receives impression and conversion data and needs nobody in a store to cooperate. Semi-permanent hybrid units grow at 6.6% because a unit that remains for months rather than weeks begins to answer the same question.
"You spend the money in March, ship in May, and in June somebody in a stockroom decides they have nowhere to put it. Retail media never has that conversation, which is most of why the budget moved."
Director, Retail Solutions and Packaging Practice · MMA Packaging and Retail Solutions Practice · August 2026

Market Trends

Retail media absorbing budget that once funded physical display

Around 19% of trade spending has moved into onsite retail advertising, which delivers impression and conversion data and requires no cooperation from anybody in a store. Display cannot match that attribution and has largely stopped trying. Semi-permanent hybrid units grow at 6.6% because longer floor life produces something closer to measurable presence, which is the only ground on which physical merchandising currently competes for the same money. A brand buying onsite advertising receives conversion data and needs nobody in a store to cooperate with anything. That is most of why the budget moved across.
Market Impact: Georgia growing fastest at 7.2%

Freight economics rewarding compactness over design

Freight consumes around 24% of delivered cost because a merchandising unit is charged on the trailer space it occupies rather than its weight, and an assembled display is mostly air. That makes flat-pack construction, nesting geometry and assembly time the dominant design constraints. Designers optimising for shelf presence without a freight model produce units that cost more to deliver than the promotion they support can justify. Flat-pack geometry, nesting and assembly time are therefore the dominant design constraints rather than anything visual. Air ships expensively. Cubic volume decides everything. Weight decides nothing.
Market Impact: Remodels run about 7 years

Market Opportunities and Growth Drivers

Retail distribution and store openings concentrating regionally

Georgia grows fastest of any state at 7.2% as retail distribution capacity, store opening activity and display fulfilment operations all concentrate in the same corridor. Proximity to distribution reduces the freight burden that consumes around 24% of delivered cost, which matters more here than in almost any comparable category. Suppliers organised around historic manufacturing geography carry a freight disadvantage on every single shipment. Freight proximity is worth more than manufacturing scale in a category where transport takes a quarter of delivered cost. Historic manufacturing geography carries a penalty on every shipment.
Market Impact: Only 58% placed as intended

Permanent fixture demand following retailer remodel programmes

Permanent metal and wood fixtures follow store remodel cycles running roughly seven years, which are capital projects planned well in advance rather than promotional decisions taken quarterly. That demand is predictable, contractible and entirely separate from brand funded promotional display. Suppliers treating both as one market are forecasting a capital cycle and a marketing budget as though they responded to the same thing, which they never do. Buyers, lead times and evaluation criteria differ completely between the two, and so do the sales approaches required to win either. Nothing links them.
Market Impact: Displays last only 4 weeks

Market Restraints and Challenges

Compliance failure removing value before anybody measures it

Around 58% of shipped units are placed as the brand intended, so a substantial share of spend produces nothing at all and nobody finds out until a field audit that most brands do not commission. The root cause is that the paying party has no authority over the deploying party. Commercially it caps what any brand will spend. Compliance auditing, retailer agreements and simpler assembly are the practical responses in use. Most brands never commission the audit that would tell them, which keeps the loss invisible. Simpler assembly helps considerably.
Market Impact: Around 19% of budget moved

Attribution gap against measurable retail media alternatives

Retail media delivers impression and conversion data while a corrugated display delivers a photograph if somebody remembers to take one, and around 19% of trade budget has moved accordingly. The root cause is measurement rather than effectiveness, since well placed display performs perfectly well when it is actually placed. Commercially it erodes budget continuously. In-store measurement, sensor integration and compliance reporting are the developing answers. Well placed display performs perfectly adequately when it is actually placed, which is precisely the problem. Sensor integration is being tried. Reporting is the third answer.
Market Impact: Freight takes 24% of cost
4 additional market trends, 3 additional growth drivers, and 2 additional restraints and challenges are covered in the full report. Contact sales@marketmindsadvisory.com to access the complete intelligence.

Segment CAGR and Growth Architecture

Six segments split by unit construction, because construction determines floor life, freight burden, whether the buyer is a brand or a retailer and the budget it is funded from. Size and finish variants sit inside each construction. Retail channel and category dimensions are handled separately within the framework. Construction decides the buyer and the budget.
united-states-merchandising-unit-market-market-share-analysis-1787641043942

Semi-Permanent Hybrid Units

Growing at 6.6%, half again the market rate of 4.4%, semi-permanent constructions combine corrugated economics with materials that survive months rather than weeks on a floor. Longer life spreads freight and compliance risk across far more selling days, which is the only structural answer physical display has to the attribution argument retail media raised. Brands increasingly specify them for anchor placements while reserving corrugated for genuinely short promotional windows. Brands increasingly reserve corrugated for genuinely short promotional windows and specify semi-permanent constructions for anchor placements that need to last. Materials surviving months rather than weeks cost more per unit and considerably less per selling day, which is the calculation brands have started running properly.
CAGR 6.6%

Digitally Integrated Merchandising Units

At 6.0% units integrating screens, sensors or interactive elements attempt to bring measurement into physical space, which is precisely what display has lacked against retail media. Cost per unit runs many times a corrugated display and installation requires power and sometimes connectivity that store managers must accommodate. Deployment is therefore concentrated in anchor stores and flagship placements rather than distributed across a chain the way promotional units are. Cost per unit runs many times a corrugated display, and installation requires power and sometimes connectivity that a store manager has to accommodate before anything works. Measurement inside physical space is exactly what display has lacked against retail media, and these units are the first serious attempt at supplying it.
CAGR 6.0%
Full segment breakdown across 6 segments available in the complete report.

Regional Architecture and Country Demand Map

North America holds 91% of value because the market is defined as United States supply, with the residual reflecting imported components and cross-border converting rather than any domestic demand elsewhere. South Asia and Pacific grows fastest of the seven regions covered here. Scope confines the rest.

North America

This region holds 91% of value, far above the usual band, because the market is defined as United States supply and essentially all of it occurs here. Georgia grows fastest of any state at 7.2% on retail distribution, store openings and fulfilment capacity concentrating together. Freight economics make regional converter positions unusually durable, since proximity to a distribution centre is worth more than manufacturing scale in a category where transport takes around a quarter of delivered cost. Retail media has taken trade budget here faster than in any other market, which makes the attribution argument sharper for suppliers than it is anywhere else. Regional converter positions are unusually durable here.
Share: 91% | CAGR: 4.2% (2026 to 2036)

Western Europe

This region holds 2%, far below the usual band, and represents component supply and design services rather than any demand within the defined scope. Several European display groups operate United States subsidiaries that are counted domestically. European retail merchandising follows different conventions around who funds display and who controls placement. Regional growth of 3.0% is the slowest anywhere on a static supply relationship with no underlying dynamic. Several European display groups operate United States subsidiaries whose activity is counted domestically rather than here. European retail merchandising follows different conventions around who funds display and who ultimately controls its placement in store. Design services rather than manufacture account for most of it.
Share: 2% | CAGR: 3.0% (2026 to 2036)
Regional intelligence for 5 additional markets available in the complete report: East Asia, South Asia and Pacific, Latin America, Middle East and Africa, Eastern Europe. Contact sales@marketmindsadvisory.com.
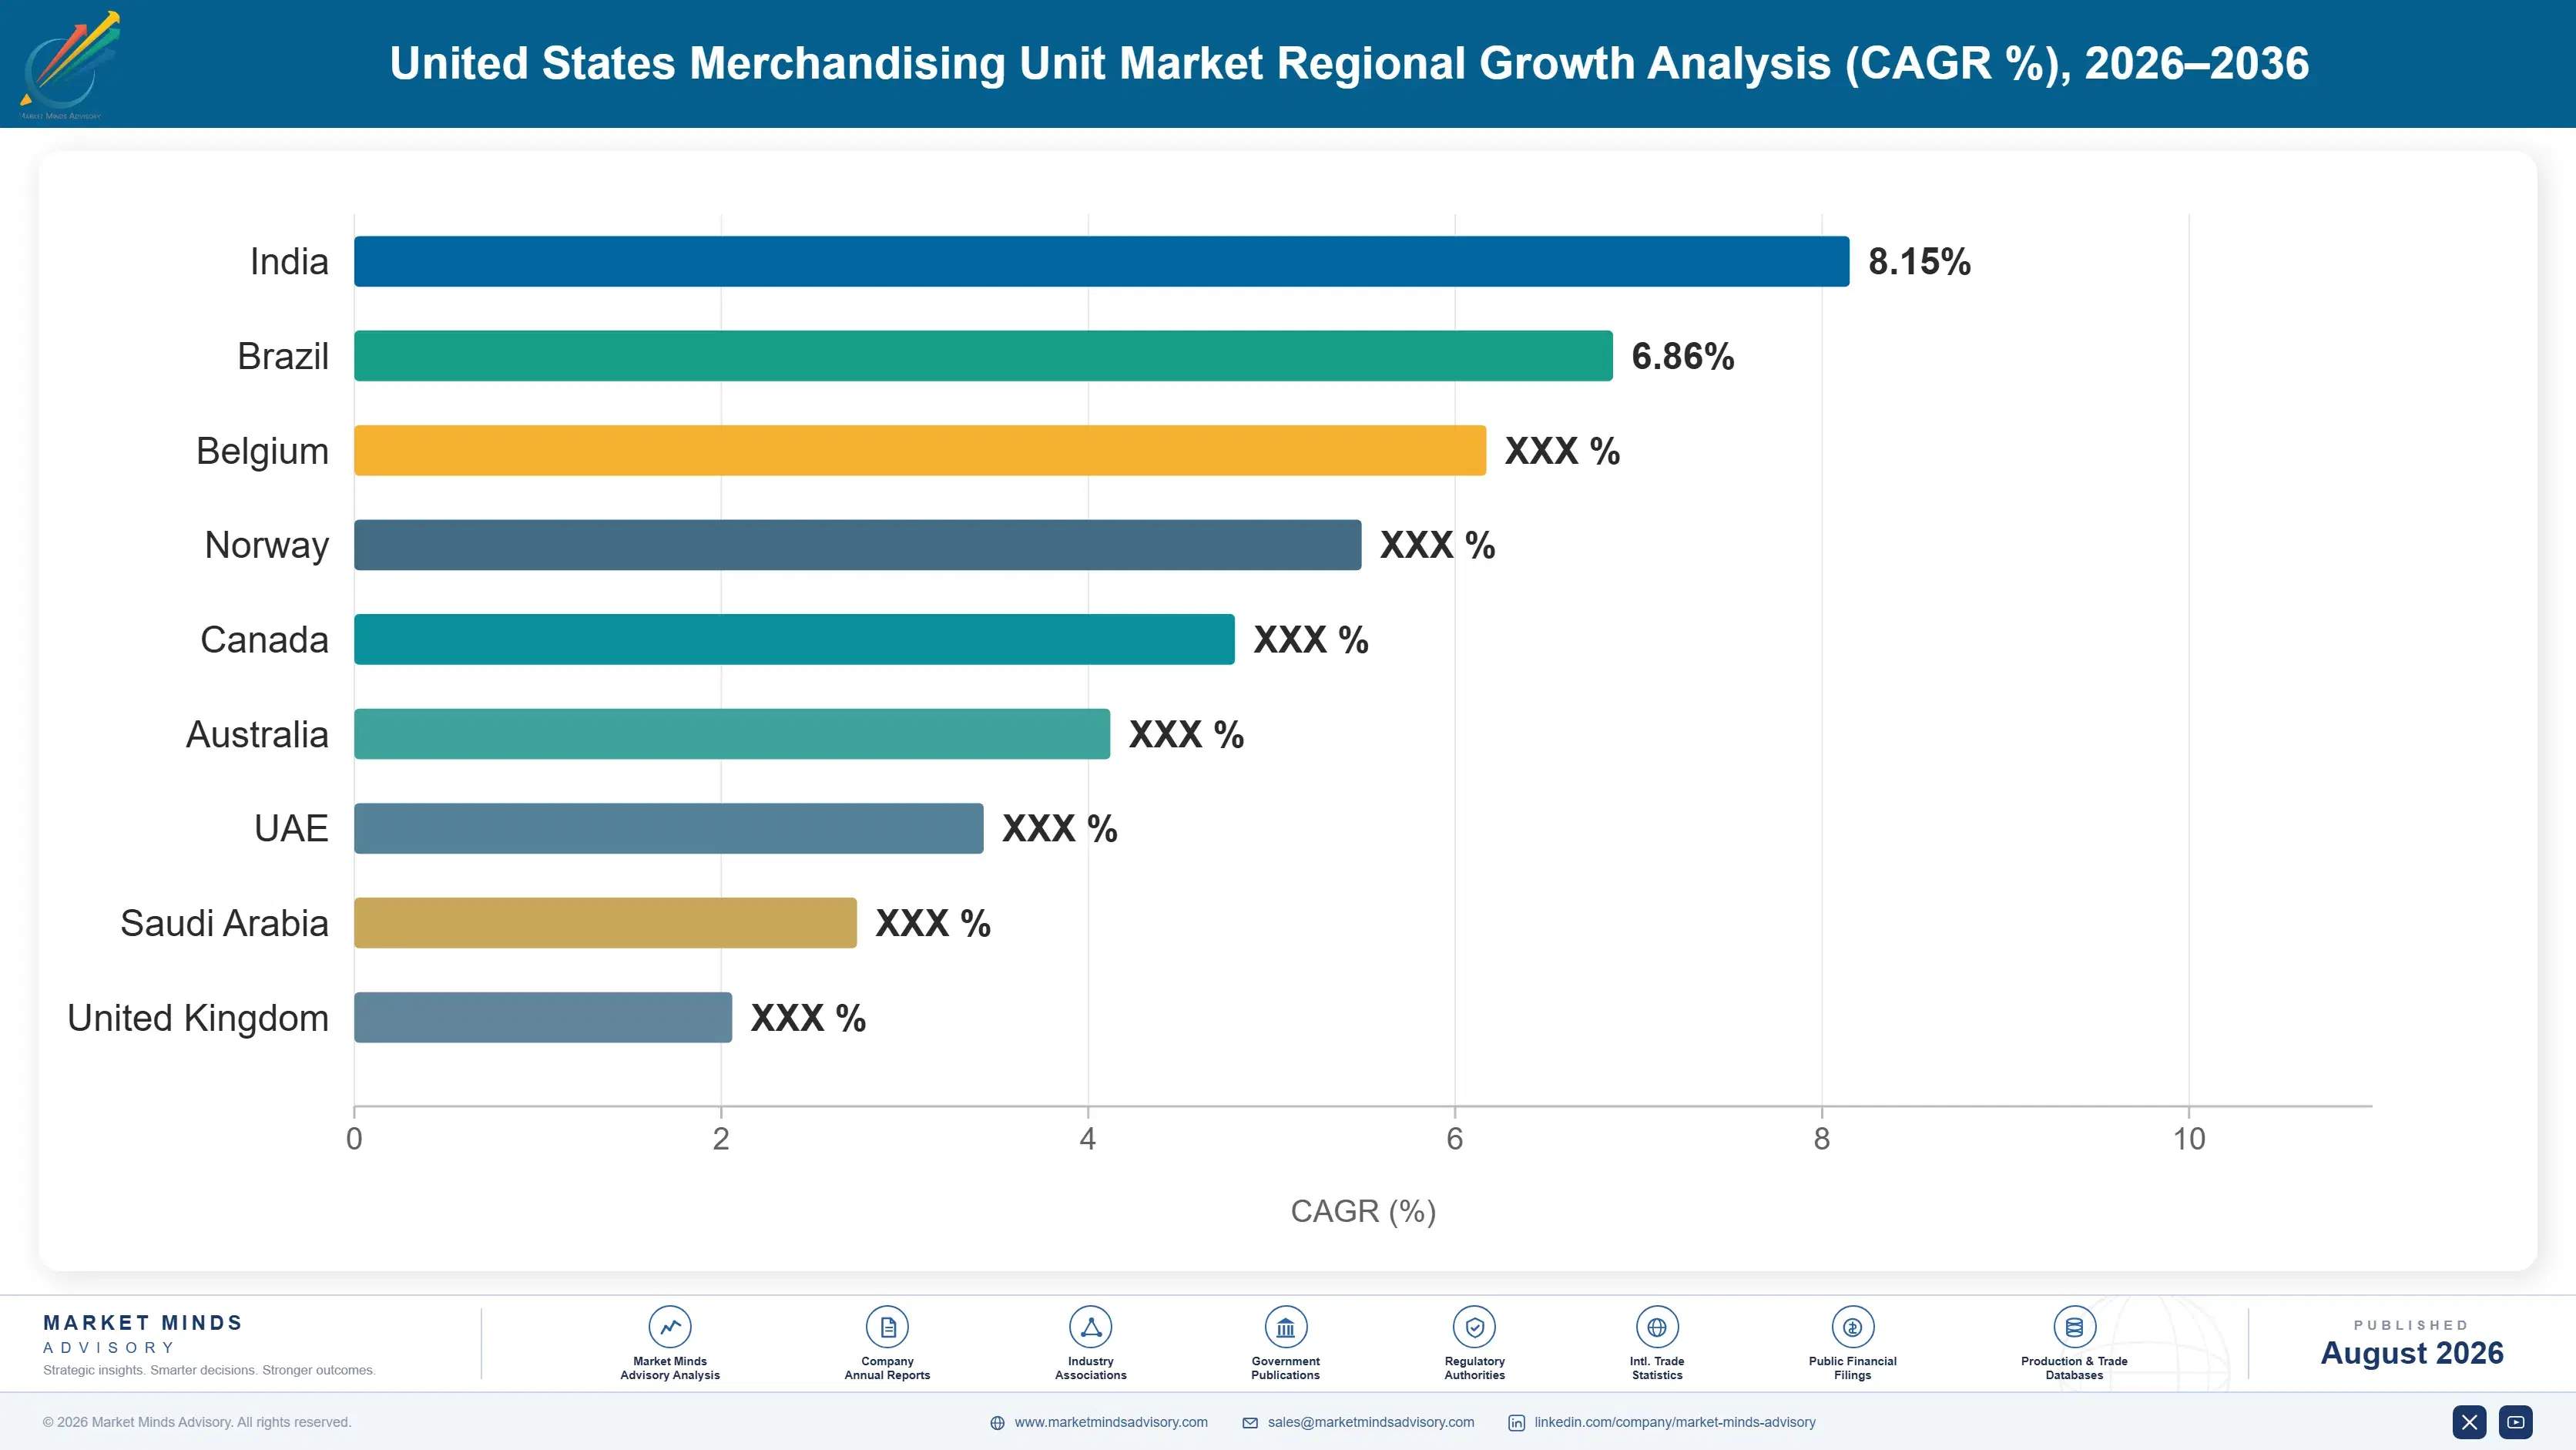
united-states-merchandising-unit-market-country-cagr-analysis-1787641044462

Four Moves Around a Store Manager

Somebody who did not pay for the display decides whether it exists, and a competing medium offers attribution that physical presence cannot. What remains available is designing for freight rather than for a photograph, extending floor life, and separating a capital cycle from a marketing budget. Nobody in the store is listening. Design solves some of it.

Design against the trailer, not the presentation deck

Freight consumes around 24% of delivered cost because a merchandising unit is charged on the cubic space it occupies rather than what it weighs, and an assembled display is mostly air. Flat-pack geometry, nesting and assembly time therefore dominate the economics. Designers optimising purely for shelf presence produce units costing more to deliver than the promotion supports, and the freight model belongs in the design brief rather than in a later costing exercise. Cubic efficiency beats material substitution every time. Nesting geometry decides delivered cost more than any material choice available to a designer.
Market Impact: Addresses the whole 24% share of freight cost

Extend floor life to answer the attribution argument

A temporary unit occupies a floor for roughly four weeks and then becomes waste, which spreads its cost across very few selling days and produces nothing measurable. Semi-permanent constructions growing at 6.6% remain for months, which spreads freight and compliance risk considerably further and starts to resemble the persistent presence retail media sells. Longer life is the only structural answer physical display currently has to the measurement gap. Attribution is the whole argument now. A unit lasting months instead of weeks spreads its cost across far more selling days, which is the only comparison retail media cannot simply win outright.
Market Impact: Extends well beyond the 4 week floor life

Sell compliance auditing as part of the programme

Around 58% of shipped units are placed as intended and most brands never find out which, because field auditing costs money nobody budgeted and produces uncomfortable answers. Suppliers bundling compliance reporting into a display programme convert an invisible loss into a managed one, and a brand that can see placement rates will fund display considerably more confidently than one operating entirely blind. Field auditing produces uncomfortable answers, which is exactly why so few brands commission it and why the loss persists year after year without correction. Visibility funds confidence. Blind spending stays small.
Market Impact: Verifies the whole 58% rate of placement compliance

Separate the remodel cycle from promotional buying

Permanent fixtures follow retailer remodel programmes running roughly seven years, planned as capital projects with long lead times and entirely different buyers from brand funded promotional display. Suppliers treating both as one market forecast a capital cycle and a marketing budget as though they respond to the same signals. They never do, and the sales approaches required have almost nothing in common with each other. Remodel programmes run roughly 7 years and are planned as capital projects, while promotional display moves quarterly against a marketing calendar. Selling both the same way fails at both.
Market Impact: Follows the whole 7 year store remodel cycle

Who Controls the Margin Pool

Participation is measured on annual revenue from merchandising unit manufacture, and the top five hold 26%. Concentration is genuinely low because freight economics favour regional converters, design capability sits with agencies as often as manufacturers, and permanent fixture work is a separate industry that overlaps only partially. The gap to challengers is freight geography rather than manufacturing capability, which is why regional positions persist against much larger competitors.
Competition runs on three fronts. Freight geography decides commodity corrugated work, where proximity beats scale. Design and programme management decides brand relationships. And fixture manufacturing capability decides retailer remodel work, which very few corrugated converters can serve. Each front rewards a different capability, and very few participants hold more than one of them properly.

Pressure ahead comes from retail media absorbing trade budget and from freight cost weighing on large formats. Expect suppliers offering compliance measurement and longer life constructions to gain. Rankings shift on whoever makes physical presence measurable. Concentration should stay low given freight economics. Corrugated converters without programme management or measurement capability look most exposed as trade budget keeps moving toward media that offers both.
united-states-merchandising-unit-market-company-positioning-matrix-1787641044988

Competitive Moat and Risk Dimensions

WESTROCK

Moat: Converting network and freight proximity

A national converting footprint puts production close to retail distribution centres, which matters disproportionately in a category where freight takes around a quarter of delivered cost and a display is mostly empty space. That geography cannot be replicated by a distant competitor offering lower manufacturing cost, since the saving disappears in transport before it reaches the customer.
WESTROCK

Risk: Trade budget migration to media

Around 19% of trade spending has already moved into retail media, which offers attribution that corrugated display cannot and needs no store level cooperation at all. That migration is structural rather than cyclical, and defending against it requires measurement capability that a converting business has no natural reason to possess.
GREAT NORTHERN INSTORE

Moat: Programme management and design integration

Combining design, engineering and programme management lets the business take responsibility for a display programme end to end rather than manufacturing to somebody else's drawing, which matters when freight and assembly decide whether the economics work at all. Brands increasingly want one party accountable for the outcome rather than several defending their own scope.
GREAT NORTHERN INSTORE

Risk: Compliance outside supplier control

Around 58% of units are placed as intended and the supplier controls none of that, yet the disappointment attaches to the display programme rather than to the retailer who declined to build it. Managing that requires auditing and reporting capability that costs money brands are reluctant to fund until they have seen the numbers.

Players Tracked

Prominent Players

WestRock
International Paper
Menasha Packaging
Great Northern Instore
DS Smith

Other Key Players

Packaging Corporation of America
Georgia-Pacific
Sonoco Products
Green Bay Packaging
Pratt Industries
Rapid Displays
FFR Merchandising
Lozier Corporation
Madix
Trion Industries
Siffron
Frank Mayer and Associates
Marketing Alliance Group
Chandler Displays
Rich Ltd

Recent Developments

MARCH 2026

Brand audit finds substantial share of displays never assembled

A consumer brand commissioned field auditing across a national display programme and found a substantial share of shipped units never assembled or placed, having previously assumed deployment matched the shipping manifest entirely. Shipping manifests had been treated as deployment records throughout. Nobody had ever verified them.
Signal: Nobody ever checks whether the display actually reached a store floor unless somebody pays for auditing
SEPTEMBER 2025

Trade budget reallocated from display toward retail media

A packaged goods company reallocated a meaningful share of its trade budget from physical display toward onsite retail advertising, citing attribution data that physical merchandising had never been able to provide for any campaign. Physical display had never produced comparable data. The reallocation was permanent rather than a trial.
Signal: Measurement rather than any effectiveness decided where the trade budget eventually went in the end here
JANUARY 2026

Freight surcharge makes large format display uneconomic

A dimensional weight surcharge made a large format display programme uneconomic on delivered cost, prompting a redesign toward flat-pack construction that shipped in a fraction of the trailer space previously required. Retail presentation was essentially unchanged afterwards. Delivered cost fell substantially. Nobody noticed the change.
Signal: The trailer rather than the shelf sets the real design constraint across this whole category entirely

Board, Freight and Assembly

Corrugated board and paperboard carry around 31% of temporary display cost, priced from containerboard markets no converter influences. Freight absorbs roughly 24% of delivered cost, charged on cubic volume rather than weight for structures that are mostly air. Assembly and finishing labour take about 17%, concentrated in units requiring manual construction. Design, tooling, printing plates and programme management account for the balance.
Containerboard and freight pricing both moved sharply across recent years, per published paper market reporting and WestRock annual reporting for 2025 on input cost commentary. Converters passed board cost through reasonably well and freight considerably less well, since brands compare delivered display cost against media spending that carries no logistics component whatsoever. That comparison is unusually unforgiving, since a media buy carries no logistics component that anybody has to justify.

Exposure divides on format rather than on scale. A temporary corrugated converter carries board and freight against a customer comparing the total against retail media. A permanent fixture manufacturer carries steel, aluminium and labour against capital contracts with longer horizons. A programme manager holding no manufacturing carries only coordination cost, which is the most defensible position when input prices move.
united-states-merchandising-unit-market-cost-volatility-analysis-1787641045185

Engineer for cubic efficiency at the design stage

Freight is charged on trailer space rather than weight, and an assembled display ships mostly air, which makes flat-pack geometry and nesting the single largest cost lever available. Building a freight model into the design brief rather than costing it afterwards routinely removes more from delivered cost than any material substitution or manufacturing efficiency ever manages.

Index containerboard exposure into programme agreements

Display programmes are quoted months ahead of production while containerboard prices reset far more often, leaving converters absorbing movement inside agreed programme pricing. Indexation matched to programme duration addresses the timing mismatch, and brand procurement teams accustomed to indexed packaging pricing generally accept the same mechanism when it is presented consistently. Timing mismatch is the issue.

Shift mix toward programme management and longer life

Temporary corrugated carries the heaviest board and freight exposure against the weakest attribution argument, which is an uncomfortable combination. Semi-permanent constructions and programme management services carry less material exposure per unit of revenue and defend better against retail media, since both compete on something other than delivered cost per display. Cost is not the only battleground.

Portfolio Architecture for Margin Defence

Margin here follows accountability rather than manufacturing, because a converter making to somebody else's drawing competes on delivered price while a party responsible for the programme outcome competes on something else entirely. Commodity corrugated display earns margins in the high single digits to high teens, where freight geography and board cost decide everything. The drawing transfers to any converter with a plant nearby.
Pallet displays and counter units do better in the high teens to low thirties, because both carry format specific engineering and neither ships as inefficiently as a full height floor unit does. Engineering content rather than board grade separates suppliers at this level. Pallet formats in particular ship efficiently.

Semi-permanent constructions, digital units and permanent fixtures hold the strongest position, reaching into the high thirties, where longer life, engineering content and capital procurement all support pricing that promotional buying does not. Those margins depend on the buyer valuing durability or measurement, which is precisely the argument retail media forced this industry to start making properly. Retail media forced this industry to start making a durability and measurement argument it had previously never needed to make at all.

Temporary Corrugated Displays

Units manufactured to supplied drawings where freight geography and board cost decide everything. The nine point range reflects converting proximity and board sourcing rather than any capability difference between suppliers.
Gross Margin: 9-18%

Pallet, Counter and Shelf Units

Formats carrying specific engineering requirements and shipping considerably more efficiently than full height units. The thirteen point range reflects design content and how much programme responsibility accompanies manufacture. Shipping efficiency helps considerably.
Gross Margin: 18-31%

Semi-Permanent, Digital and Permanent Fixtures

Constructions supported by longer floor life, engineering content or capital procurement rather than promotional budget. The twelve point range reflects durability, measurement capability and buyer type across quite different situations.
Gross Margin: 26-38%
united-states-merchandising-unit-market-portfolio-architecture-1787641045684

High-value Sub-segments and Strategic Watch-out

Semi-Permanent Hybrid Units

High value and the fastest growth at 6.6%, spreading freight and compliance risk across months rather than weeks. Longer life is the only structural answer display has to retail media attribution. Brands increasingly reserve corrugated for genuinely short windows and specify these for anchor placements.
Gross Margin: 26-38%

Digitally Integrated Merchandising Units

High value and growing at 6.0% by bringing measurement into physical space. Power and connectivity requirements confine deployment to anchor stores rather than distributed chain wide placement. Cost per unit runs many times a corrugated display, which limits it to flagship and anchor placements. Power is required.
Gross Margin: 28-40%

Temporary Corrugated Displays

The volume core, occupying a floor for roughly four weeks before disposal while freight takes around a quarter of delivered cost. It competes directly against a medium offering attribution. Freight geography and board cost decide who wins, and the drawing transfers to any nearby converter.
Gross Margin: 9-18%

Compliance Failure Exposure

The strategic watch-out. Around 58% of units are placed as intended and the supplier controls none of it, and the range reflects whether compliance reporting accompanies the programme or nobody checks. Auditing costs money nobody budgeted and returns answers nobody wants, which is why it rarely happens.
Gross Margin: 0-35%

Two Cycles, One Industry

Demand here arrives on two rhythms that share almost nothing. Brand funded promotional display follows marketing calendars, moves quarterly and competes for budget against media of every kind. Retailer funded permanent fixture work follows remodel programmes running roughly seven years, arrives as capital procurement with long lead times and is largely indifferent to whatever marketing is doing. Forecasting them together misleads badly.
Stickiness follows programme relationships rather than product. A brand that trusts a supplier to manage design, engineering, production and distribution across a national programme rarely re-tenders casually, because coordinating those elements across several vendors is genuinely difficult and failure is visible. Commodity corrugated production reopens continually, since the drawing transfers to any converter with a plant nearby. Coordination failure is highly visible.

The deciding party has quietly multiplied. Brand marketing commits the budget, brand procurement runs the tender, retailer category teams approve the placement and a store manager executes it. Suppliers reaching only procurement are negotiating price on a programme whose success depends on three other parties, none of whom were in the room when anything was agreed. Four parties, one purchase order.
united-states-merchandising-unit-market-end-use-penetration-index-1787641046174

Where We Would Put Effort

These are among the four positions where our research anticipates prominent divergence between winners and laggards over the coming forecast period. Each is grounded in the demand model, the regulatory perimeter, and the announced capacity pipeline.
01 / FREIGHT LED DESIGN

The trailer sets the brief

Freight consumes around 24% of delivered cost because a merchandising unit is charged on the cubic space it occupies rather than what it actually weighs, and an assembled display is mostly air. Flat-pack geometry, nesting efficiency and assembly time therefore dominate the economics of this category completely. Designers optimising purely for shelf presence produce units that cost more to deliver than the promotion can possibly support, and the freight model belongs in the design brief rather than in a later costing exercise.
02 / FLOOR LIFE EXTENSION

Four weeks answers no question

A temporary unit occupies a retail floor for roughly four weeks before it becomes waste, which spreads its whole cost across very few selling days and produces nothing that anybody can measure afterwards. Semi-permanent constructions, growing at 6.6%, remain in place for months at a time instead, which spreads freight and compliance risk considerably further across the programme. Longer floor life is the only structural answer that physical display currently has to the measurement argument that retail media raised against it.
03 / COMPLIANCE MEASUREMENT DISCIPLINE

Nobody knows what reached the floor

Around 58% of all shipped units are actually placed as the brand intended them to be, and most brands never discover which ones, because field auditing costs money that nobody budgeted for and returns answers that nobody particularly wants. Suppliers who bundle compliance reporting into the display programme itself convert an invisible loss into a managed one instead. A brand that can see its own actual placement rates will fund physical display considerably more confidently than one currently operating entirely blind.
04 / CYCLE SEPARATION DISCIPLINE

Capital and marketing share nothing

Permanent fixture demand follows retailer remodel programmes running on roughly seven year cycles, planned as capital projects with long lead times and entirely different buyers from any of the brand funded promotional display work. Suppliers that treat both as a single market end up forecasting a capital cycle and a marketing budget as though the two respond to the same signals. They never do, and the two sales approaches involved have almost nothing at all in common with each other.

Engagement Snapshot From the Field

A live engagement with an industry participant carrying material or product regulatory and market exposure ahead of a defining policy shift, showing how our research translates into a defensible multi-year portfolio strategy.
MARKET MINDS ADVISORY · CLIENT ENGAGEMENT SUMMARY
United States Merchandising Unit Producer Strategic Portfolio Review and Transition Roadmap 2026·Investment Scenario on United States Merchandising Unit Exposure Evaluation 2025-26
CLIENT PROFILE
A display manufacturer producing temporary corrugated and semi-permanent merchandising units for consumer brands across United States retail, at annual revenue near 290 million dollars (client-reported, unverified by MMA). Programme management capability was limited and compliance reporting was not offered. Commercial planning treated promotional and fixture demand as a single forecast. Coverage was procurement led. Freight was costed late.
STRATEGIC CHALLENGE
Brand customers were reallocating trade budget toward retail media while freight surcharges were making large format work uneconomic. Management wanted to know whether physical display had a defensible position or whether the business should reposition entirely. Volume was holding while margin fell across consecutive years. A decision could not wait.
MMA APPROACH
MMA audited display placement rates across customer programmes, modelled freight cost against design geometry, compared attribution capability between display and retail media buying, and mapped the separate demand cycles behind promotional and fixture work. Interviews with 47 experts covered brand marketing, retail operations, display design, freight and store management. Placement rates were audited directly.
KEY FINDINGS
  1. Placement rates across audited programmes fell well below what customers had assumed from shipping manifests, and none of those customers had been measuring it at all.
  2. Freight cost tracked cubic geometry far more closely than material choice, and several designs could have shipped in half the space with no visible change at retail.
  3. Retail media had taken budget on attribution rather than on performance, and semi-permanent formats were the only physical response that addressed the argument.
  4. Permanent fixture work followed retailer capital cycles entirely disconnected from brand marketing calendars, and the client was forecasting both as one demand pattern.
CLIENT PROFILE
A display manufacturer producing temporary corrugated and semi-permanent merchandising units for consumer brands across United States retail, at annual revenue near 290 million dollars (client-reported, unverified by MMA). Programme management capability was limited and compliance reporting was not offered. Commercial planning treated promotional and fixture demand as a single forecast. Coverage was procurement led. Freight was costed late.
STRATEGIC CHALLENGE
Brand customers were reallocating trade budget toward retail media while freight surcharges were making large format work uneconomic. Management wanted to know whether physical display had a defensible position or whether the business should reposition entirely. Volume was holding while margin fell across consecutive years. A decision could not wait.
MMA APPROACH
MMA audited display placement rates across customer programmes, modelled freight cost against design geometry, compared attribution capability between display and retail media buying, and mapped the separate demand cycles behind promotional and fixture work. Interviews with 47 experts covered brand marketing, retail operations, display design, freight and store management. Placement rates were audited directly.
KEY FINDINGS
  1. Placement rates across audited programmes fell well below what customers had assumed from shipping manifests, and none of those customers had been measuring it at all.
  2. Freight cost tracked cubic geometry far more closely than material choice, and several designs could have shipped in half the space with no visible change at retail.
  3. Retail media had taken budget on attribution rather than on performance, and semi-permanent formats were the only physical response that addressed the argument.
  4. Permanent fixture work followed retailer capital cycles entirely disconnected from brand marketing calendars, and the client was forecasting both as one demand pattern.
RECOMMENDED STRATEGY
Phase 1: Phase one: build compliance auditing into programme offers, since brands cannot fund confidently while placement rates remain entirely invisible. Blind spending stays small. Phase 2: Phase two: put freight geometry into the design brief rather than costing it afterwards, because cubic space dominates delivered cost. Phase 3: Phase three: separate fixture and promotional forecasting completely, as the two cycles respond to entirely different signals. Buyers differ completely.
OUTCOME
The manufacturer introduced compliance reporting during 2026 and two brand customers increased programme spend once placement became visible (client-reported, unverified by MMA). Freight led design review was adopted, and fixture and promotional planning were separated. Large format promotional work was repriced against its real delivered cost.

Frequently Asked Questions

Foundational context covering the market sizes, CAGR, scope, country, region and competition that inform every finding below. This section is provided to cover basics and most often pre-purchase conversations, answered from the MMA Primary Research Dataset.

What is the current size of the United States Merchandising Unit Market?

MMA sizes it at USD 6.8 billion in 2025, rising to USD 7.10 billion in 2026. The figure covers point of purchase merchandising units at manufacturer selling value.

How large will the United States Merchandising Unit Market be by 2036?

USD 10.92 billion by 2036, an incremental USD 3.82 billion over the 2026 base and an expansion multiple of 1.54 times. Semi-permanent formats carry most of that gain.

What is the CAGR for the United States Merchandising Unit Market 2026 to 2036?

4.4% in the base case, with a bull case at 5.6% and a bear case at 3.2%. Retail media absorbing trade budget drives most of the spread between them.

Which segment is growing fastest?

Semi-permanent hybrid units at 6.6%, half again the market rate of 4.4%. Longer floor life spreads freight and compliance risk across months rather than weeks.

Who are the major companies in the United States Merchandising Unit Market?

WestRock, International Paper, Menasha Packaging, Great Northern Instore and DS Smith lead on merchandising unit revenue. Fifteen further participants are profiled in the full report on the same consistent basis.

Which country is growing fastest?

The market is defined as United States supply, and Georgia grows fastest of any state at 7.2% on retail distribution, store openings and fulfilment capacity concentrating.

Report Segmentation Architecture

The full report scope spans multiple orthogonal segmentation dimensions, with cross-tabulated demand data provided for each dimension pair. Coverage extends further to regional breakdowns, trend trajectories, and the competitive detail needed to support segment-level decision-making.

By Unit Construction

  • Temporary Corrugated Displays
  • Permanent Metal and Wood Fixtures
  • Semi-Permanent Hybrid Units
  • Pallet and Bulk Displays
  • Counter and Shelf Units
  • Digitally Integrated Merchandising Units

By End-Use Industry

  • Grocery and Supermarket
  • Mass Merchant and Club
  • Convenience and Fuel Retail
  • Drug and Pharmacy Retail
  • Specialty and Apparel Retail
  • Home Improvement and Hardware

By Commercial Dimension

  • Brand Funded Programme Contracts
  • Retailer Capital Fixture Procurement
  • Agency Managed Programmes
  • Distributor and Broker Channels
  • Direct Store Delivery Programmes
  • Design and Engineering Services

By Region

  • North America
  • Western Europe
  • East Asia
  • South Asia and Pacific
  • Latin America
  • Middle East and Africa
  • Eastern Europe

Scope, Methodology, and Coverage

Every figure in this report is reproducible from documented input assumptions. The scope below maps the historical period, the forecast horizon, the segmentation dimensions, and the countries covered, alongside the underlying primary and qualitative methodology.
Historical Period
2020 to 2025
Forecast Period
2026 to 2036
Base Year
2025 (USD billions; MMA Primary Research Dataset, August 2026)
Market Definition
Point of purchase merchandising units supplied into United States retail, covering temporary corrugated displays, permanent metal and wood fixtures, semi-permanent hybrid units, pallet and bulk displays, counter and shelf units, and digitally integrated merchandising units. Measured at manufacturer selling value. Warehouse racking and storage systems, standalone digital signage hardware, retail media advertising inventory, and store construction and fit-out work are excluded from scope.
Quantitative Units
USD billions (current prices); units shipped; USD per unit by construction type
Segmentation Dimensions
Unit construction; end-use industry; commercial dimension; region
Regions Covered
North America, Western Europe, East Asia, South Asia and Pacific, Latin America, Middle East and Africa, Eastern Europe
Countries Covered
United States, Canada, Mexico, United Kingdom, Germany, France, Netherlands, Spain, China, Japan, South Korea, Taiwan, India, Vietnam, Australia, Brazil, Costa Rica, United Arab Emirates, South Africa, Poland
Key Companies Profiled
WestRock, International Paper, Menasha Packaging, Great Northern Instore, DS Smith, Packaging Corporation of America, Georgia-Pacific, Sonoco Products, Green Bay Packaging, Pratt Industries, Rapid Displays, FFR Merchandising, Lozier Corporation, Madix, Trion Industries, Siffron, Frank Mayer and Associates, Marketing Alliance Group, Chandler Displays, Rich Ltd
Quantitative Methodology
Primary survey, n=3,800 respondents, Q4 2025, six countries; demand-side model with trade association cross-validation
Qualitative Methodology
47 expert interviews, Q4 2025; applied to validate demand model assumptions, identify emerging dynamics, and assess competitive positioning
Report Format
PDF and XLSX data workbook (Word format preview document)
Publisher
Market Minds Advisory
Report Code
MMA-2026-PAC-103
Published
August 2026
Contact
sales@marketmindsadvisory.com | www.marketmindsadvisory.com

Purchase the full United States Merchandising Unit Market Report (2026 to 2036).

The full report treats merchandising units as a category where the paying party controls neither placement nor measurement, which is why trade budget keeps migrating toward media that offers both. It sizes all six constructions independently through 2036, quantifies placement compliance against shipped volume, and models freight cost against design geometry. Regional chapters cover all seven regions with the scope confined to United States supply throughout. Competitive profiling covers 20 participants on one consistent manufacturer revenue basis. Placement compliance is audited against shipped volume throughout.
Six unit constructions sized independently through 2036
Placement compliance quantified against shipped programme volume
Freight cost modelled against design geometry and cubic efficiency
Promotional and capital fixture cycles tracked as separate demand patterns
Retail media budget migration measured against physical display spend
Twenty participants profiled on one consistent manufacturer revenue basis

Built For The People Who Decide

From boardroom strategy to bench-side execution, this report is read cover-to-cover by leaders shaping the next decade of their industry, turning demand scenarios, market dynamics and valuation benchmarks into decisions.
CXOs/ Presidents/ VPs/ Managers
M&A and Corporate Development
Strategy Teams and R&D Heads
Procurement and Product Directors
Regulatory and Compliance Leaders
Investor Relations and Equity Analysts