Market Minds Advisory
Demand for Interactive Projector in USA

Demand for Interactive Projector in USA: Demand for Interactive Projector in USA. Classroom, Boardroom, and Collaborative Display Systems

United States classrooms and corporate meeting rooms are replacing fixed whiteboards with touch-enabled interactive projectors as hybrid work and digital curricula reshape procurement budgets across school districts and enterprises nationwide.

Lead Analyst

Published

September 2026

Make Smarter Decisions with Customized Research Insights

Request a free sample report and evaluate market opportunities, growth trends, and competitive dynamics relevant to your business needs.

2025 MARKET VALUE$1.4BMarket Size 2025
2036 FORECAST VALUE$3.6BBase Case , 2026 to 2036
CAGR 2026 TO 20369.0 %Bull 10.3% / Bear 7.7%
INCREMENTAL OPPORTUNITY$2.1BNet 10- year value creation
EXPANSION MULTIPLE2.37x2036 value over 2026 base
Strategic Levers
M&A Pipeline
Regional Outlook
Country Rankings
Competitive Intelligence
Segmental Deep-dive
Call-Us : 91 93563 13602

Executive Snapshot and Market Trajectory.

United States K-12 school districts and corporate meeting rooms are replacing fixed whiteboards with touch-enabled interactive projectors as digital curricula and hybrid collaboration reshape procurement priorities nationwide across most annual district and enterprise budget cycles currently underway. Facilities managers increasingly treat interactive display upgrades as a standard line item.
Ultra-short-throw models increasingly dominate new purchasing decisions, since their reduced shadow interference and simpler installation appeal directly to facilities managers weighing total classroom deployment cost against flat-panel display alternatives competing for the same limited budget allocation. Education procurement drives a substantial share of total unit volume nationally, followed closely by corporate meeting room deployment across mid-size and large enterprises. Overall unit volume growth continues outpacing broader classroom technology spending categories.
Competitive dynamics favor established projector manufacturers with existing education and enterprise sales channels over newer flat-panel-only entrants, since school district procurement cycles reward vendors with proven installation and support track records. Federal education technology funding programs and post-pandemic classroom modernization budgets continue supporting steady replacement demand across most public school districts nationwide. State-level education technology grants add a further layer of demand stability across most regions, cushioning suppliers against any single district's budget cycle volatility.
Market Definition
The Demand for Interactive Projector in USA report covers touch-enabled and gesture-interactive projection systems sold into United States education, corporate, and government markets, including ultra-short-throw and standard-throw configurations. It excludes non-interactive standard projectors and flat-panel interactive display hardware.
Base Year Value
$1.4B in 2025 (MMA Primary Research Dataset, September 2026)
Forecast Period
2026 to 2036, eleven discrete annual values
CAGR
9.0% base case. Bull 10.3%. Bear 7.7%.
Fastest Growth Segment
Ultra-Short-Throw Interactive Projectors: 14.0% CAGR
Fastest Growth Country
United States: 9.5% CAGR
Fastest Growth Region
South Asia and Pacific: 11.0% CAGR
Largest Region
North America: 32% of 2025 global value
Market Leaders
Epson America, BenQ America, ViewSonic Corporation, Optoma Technology, and Promethean lead the market. Source: MMA Analysis, July 2026.
Primary Survey
n=3,800 procurement and R&D decision-makers, Q4 2025, six countries
Methodology
Demand-side build-up, cross-validated against public data, 47 expert interviews

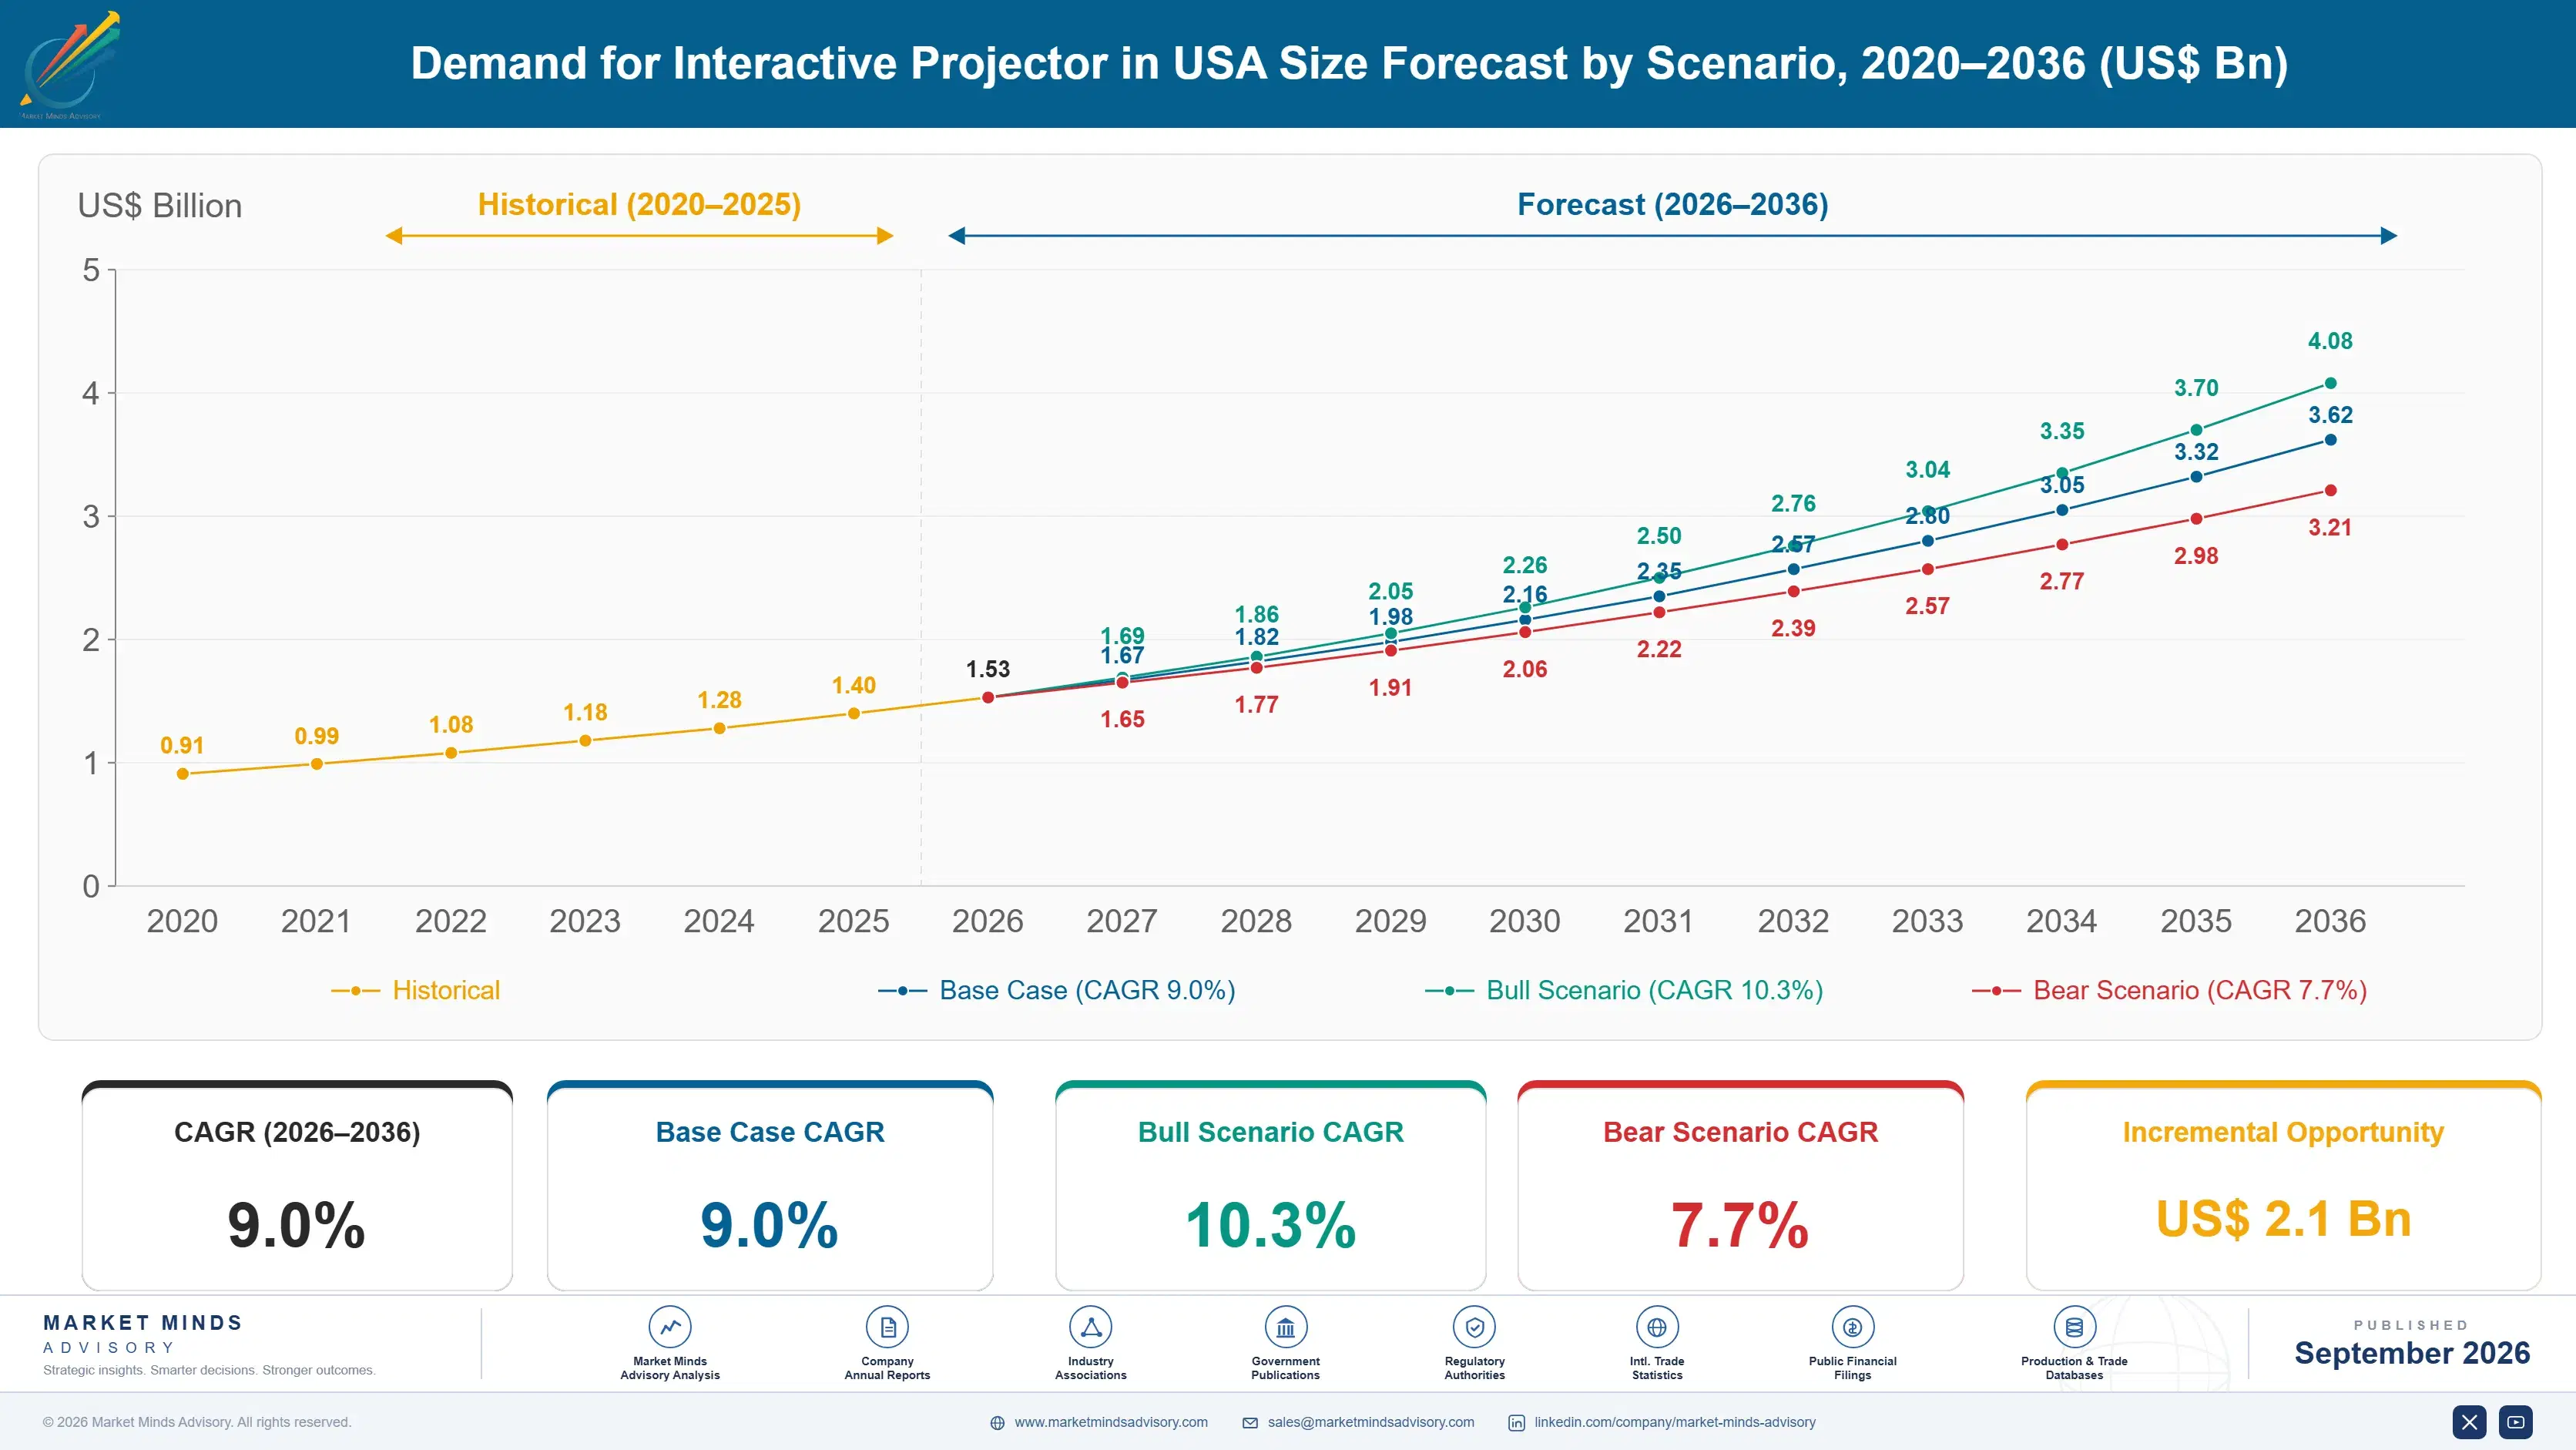
Demand for Interactive Projector in USA Market Forecast Scenarios

united-states-interactive-projector-market-size-forecast-scenario-1788420597443
Between 2020 and 2025, United States interactive projector demand grew steadily as pandemic-era federal education technology funding accelerated classroom modernization and hybrid corporate meeting room upgrades expanded simultaneously, with a historical CAGR near 8.0 percent driven largely by first-time interactive display adopters replacing legacy analog whiteboards nationwide. Growth moderated somewhat after 2023 as initial federal funding waves were largely absorbed by early-adopter districts.
The base case assumes continued school district replacement cycles tied to aging installed base retirement, expanding ultra-short-throw adoption favoring simpler installation, and steady corporate meeting room modernization spending across mid-size enterprises nationally. These three mechanisms together sustain steady growth through 2036, reinforced by continuing state-level education technology grants and rising hybrid meeting frequency across corporate environments. Vendors with strong district relationships capture a disproportionate share of this ongoing replacement demand nationally.
A stronger bull case emerges if federal education technology funding expands meaningfully following renewed congressional appropriations, pulling forward district replacement cycles nationwide. The bear risk centers on flat-panel display competition, where falling large-format touchscreen prices increasingly divert budget away from projector-based interactive systems in new construction specifically. Suppliers investing early in touch-sensitivity improvements are best positioned to defend share against this pressure.

Replacement Cycles Anchor Steady Unit Volume Growth

School district procurement cycles increasingly favor ultra-short-throw configurations over ceiling-mounted alternatives, since simpler installation reduces both upfront labor cost and ongoing maintenance burden for facilities teams managing hundreds of classrooms across sprawling district footprints. Vendors offering multi-year bulk district contracts increasingly displace suppliers competing purely on single-unit list price, since total contract value now determines procurement committee vendor selection more than any individual product feature.
MARKET CONCENTRATIONCR5 54%top five vendors hold majority of national unit shipments
AVERAGE SYSTEM PRICE$1,850typical installed interactive projector unit price range currently
EDUCATION CHANNEL SHARE58%share of total unit volume sold into school districts
REPLACEMENT CYCLE LENGTH7 yearstypical duration before institutions replace existing display hardware
ULTRA-SHORT-THROW SHARE44%share of new units featuring ultra-short-throw configuration currently
INSTALLED BASE AGE5.8 yearsaverage age of currently deployed interactive projector units nationally
Corporate buyers weigh interactive projectors against flat-panel touchscreen displays primarily on total room cost, since larger meeting spaces favor projection economics while smaller huddle rooms increasingly default toward flat-panel alternatives regardless of interactivity requirements specified. Room size and existing infrastructure increasingly determine which technology wins a given deployment, rather than either category winning outright across an entire facility or organization.
Vendors bundling extended warranty and installation support increasingly win competitive school district evaluations, since procurement officers weight total cost of ownership over multiple years more heavily than unit price alone during formal bid processes. This shift favors established projector manufacturers with dedicated education sales teams over newer entrants lacking comparable district relationship depth and long-term support infrastructure built over many years of prior engagement.
"Districts aren't buying projectors anymore. They're buying a seven-year service relationship that happens to include a projector."
Practice Lead, Education and Enterprise Technology · MMA Interactive Display and Collaboration Hardware Practice · September 2026

Market Trends

Ultra-Short-Throw Configuration Becomes Preferred Classroom Standard

School district facilities teams increasingly specify ultra-short-throw interactive projectors over traditional ceiling-mounted units, since wall or table-mounted placement eliminates shadow interference from students standing at the display and simplifies installation across renovated classroom spaces. Roughly 44 percent of new unit shipments now feature ultra-short-throw configuration, up meaningfully from levels reported just several years earlier. Vendors offering compact ultra-short-throw form factors with simplified cabling increasingly win competitive district evaluations against suppliers still relying primarily on legacy ceiling-mounted product lines requiring more extensive installation labor and ongoing maintenance access. This shift is reshaping vendor product roadmaps industry-wide.
Market Impact: 51 percent rely on grant funding

Bundled Service Contracts Reshape District Procurement Decisions

District procurement officers increasingly evaluate vendors on total multi-year service relationship value rather than unit price alone, bundling installation, extended warranty, and calibration support into single contract awards spanning entire school system deployments. Roughly 38 percent of surveyed districts now require bundled service commitments as a formal bid requirement, reflecting genuine budget planning discipline rather than simple vendor preference. Vendors without dedicated field service infrastructure increasingly struggle to compete for large multi-school district contracts, ceding share to established suppliers with proven regional support network coverage across multiple states. This trend shows no sign of slowing.
Market Impact: 33 percent boosted budget for hybrid

Market Opportunities and Growth Drivers

State Education Technology Grant Programs Sustain Demand

State-level education technology grant programs continue funding classroom display modernization across public school districts, providing a steady demand floor that insulates suppliers somewhat from individual district budget volatility tied to local tax revenue fluctuations. Roughly 51 percent of surveyed districts report relying on state grant funding for at least a portion of recent interactive projector purchases, a meaningfully higher share than reported five years earlier. Vendors with dedicated grant application support services increasingly help smaller districts navigate funding processes, winning loyalty and repeat business that extends well beyond the initial grant-funded purchase itself.
Market Impact: 29 percent consider flat-panel alternatives actively

Hybrid Meeting Adoption Expands Corporate Purchasing Volume

Corporate offices increasingly retrofit meeting rooms with interactive projection systems to support hybrid meetings connecting in-office and remote participants, treating interactive display capability as a baseline requirement for modern collaborative workspace design. Roughly 33 percent of surveyed enterprises report increasing interactive display budget specifically to support hybrid meeting formats, reflecting a genuine and lasting shift in corporate office design priorities. Vendors with strong video conferencing software integration increasingly win corporate evaluations over standalone projection hardware suppliers lacking comparable collaboration platform compatibility and enterprise software partnerships. This integration depth increasingly determines contract outcomes.
Market Impact: 26 percent delayed replacement on budget

Market Restraints and Challenges

Flat-Panel Display Competition Pressures Price Points

Falling large-format touchscreen display prices increasingly divert budget away from projector-based interactive systems, particularly in smaller classroom and huddle room deployments where flat-panel image quality advantages matter more than the wider field of view projection offers. The root cause is manufacturing scale economics: flat-panel display production costs have fallen faster than projector lamp and optics manufacturing costs over the same period. Roughly 29 percent of surveyed districts report actively considering flat-panel alternatives during recent procurement cycles. Some projector vendors are responding with laser light source models offering longer lifespan to close this gap.
Market Impact: 44 percent of shipments now ultra-short-throw

District Budget Constraints Delay Replacement Cycle Timing

Many public school districts face genuine budget constraints that push interactive projector replacement decisions past the technically optimal seven-year cycle, extending installed base age and delaying revenue recognition for suppliers dependent on predictable replacement timing. The underlying cause traces to broader municipal budget pressure affecting most discretionary technology spending categories, not projector-specific cost concerns. Roughly 26 percent of surveyed districts report delaying planned replacement cycles due to budget constraints in the past year. Some districts are pursuing phased multi-year replacement plans to spread costs more predictably across budget cycles. Costs spread predictably.
Market Impact: 38 percent require bundled service contracts
3 additional market trends, 4 additional growth drivers, and 3 additional restraints and challenges are covered in the full report. Contact sales@marketmindsadvisory.com to access the complete intelligence.

Segment CAGR and Growth Architecture

The market spans six product categories organized by projector configuration and end-use, from standard-throw classroom units through ultra-short-throw systems built for compact renovated spaces. Adoption pace varies sharply by category as installation simplicity and total ownership cost reshape district and corporate purchasing decisions industry-wide currently. Vendors increasingly design roadmaps around this configuration divide rather than treating throw distance as secondary.
Section default visual

Ultra-Short-Throw Interactive Projectors

This segment covers wall or table-mounted units positioned close to the display surface, eliminating the shadow interference and cabling complexity associated with traditional ceiling-mounted installations common in older classroom buildings. Adoption is concentrated among districts renovating existing facilities rather than building new construction, where ceiling infrastructure retrofit costs often exceed the price of the projector itself. Growth is outpacing every other segment as facilities managers increasingly treat installation simplicity as a primary purchasing criterion above brightness or resolution specifications. Vendors here compete heavily on mounting flexibility and cable management rather than raw image quality alone. Program adoption is accelerating fastest among districts with the oldest installed base facing imminent replacement decisions across most regions nationally.
CAGR 14.0%

Standard Corporate Meeting Room Systems

This segment covers interactive projection systems purpose-built for corporate meeting rooms and huddle spaces, emphasizing video conferencing integration and wireless content sharing over the classroom-specific durability features standard-throw education units prioritize. Adoption is concentrated among mid-size and large enterprises retrofitting meeting rooms for hybrid work, where interactive capability increasingly ranks alongside camera and microphone quality as a baseline room specification. Corporate buyers evaluate total room technology stack integration rather than projector specifications in isolation, favoring vendors with proven collaboration software partnerships. Growth here trails only ultra-short-throw, reflecting genuine enterprise hybrid work investment momentum. Suppliers investing early in software partnership depth are positioned to capture disproportionate share as hybrid work adoption continues expanding across most industries.
CAGR 10.5%
Full segment breakdown across 6 segments available in the complete report.

Regional Architecture and Country Demand Map

North America anchors global demand given this report's United States focus and the scale of domestic school district and corporate procurement budgets. South Asia and Pacific expands fastest as regional education technology investment accelerates across rapidly growing school-age populations and infrastructure programs. East Asia follows closely behind.

North America

The United States drives the overwhelming majority of regional demand, reflecting this report's explicit domestic focus and the sheer scale of the country's roughly thirteen thousand public school districts alongside a large corporate meeting room installed base. Federal and state education technology funding programs sustain steady replacement demand across most districts, while corporate hybrid work adoption continues expanding interactive projector deployment across mid-size and large enterprises nationwide. Canada contributes a smaller but steadily growing share through comparable provincial education technology investment programs. This concentration justifies North America's position at the top of its regional band given the report's United States-centered scope. Provincial funding programs continue supporting this steady growth. Enterprise buyers also increasingly favor domestic support networks.
Share: 32% | CAGR: 9.5% (2026 to 2036)

Western Europe

Germany, the United Kingdom, and France drive the bulk of regional demand, with national education technology modernization programs and corporate hybrid work adoption paralleling trends observed in the United States market. Growth trails North America and East Asia somewhat, reflecting more mature existing installed base and correspondingly longer replacement cycles across most established school systems. Nordic countries show disproportionately high per-capita adoption relative to population size, reflecting strong public education technology investment. European Union digital education initiatives continue supporting steady baseline replacement demand across member states broadly. Corporate hybrid work adoption continues expanding steadily across most major metropolitan business districts. EU-wide digital education targets support continued investment. Multinational corporate headquarters standardize procurement across subsidiaries.
Share: 22% | CAGR: 7.5% (2026 to 2036)
Regional intelligence for 5 additional markets available in the complete report: East Asia, South Asia and Pacific, Latin America, Middle East and Africa, Eastern Europe. Contact sales@marketmindsadvisory.com.
united-states-interactive-projector-market-market-share-analysis-1788420598002

Where Interactive Projector Vendors Can Defend Margin

Vendors face mounting pressure to prove total ownership value as districts and enterprises scrutinize multi-year budgets more closely than in prior procurement cycles. Four commercial levers separate suppliers sustaining premium pricing from those competing purely on unit cost and basic specification parity alone. Multi-year service value and installation simplicity increasingly outweigh raw unit price in most competitive bid evaluations.

Expand Ultra-Short-Throw Product Line Depth Broadly

Vendors investing in mature ultra-short-throw product lines capture disproportionate share of the 44 percent of new shipments now specifying this configuration, since simplified installation directly addresses the labor cost concerns dominating district procurement evaluations. This capability commands measurable pricing premiums over vendors offering only legacy ceiling-mounted configurations during competitive bids. Vendors slow to build this depth risk losing large multi-school district contracts entirely to better-positioned competitors with proven ultra-short-throw installation track records across comparable facilities. Districts evaluating multiple vendors increasingly treat installation simplicity as a baseline requirement rather than a differentiating premium feature.
Market Impact: Captures share of the 44 percent choosing ultra-short-throw

Build Bundled Multi-Year Service Contract Offerings

Vendors offering bundled installation, warranty, and calibration service address the 38 percent of districts now requiring such commitments as a formal bid requirement, positioning themselves ahead of competitors offering hardware-only proposals. This differentiation increasingly determines which vendors win large multi-school contract awards during competitive evaluations. Vendors without dedicated field service infrastructure struggle to match the response capability of established competitors with proven regional support network coverage across comparable multi-state district territories. Districts evaluating multiple vendors increasingly weight demonstrated service infrastructure heavily during formal multi-year contract negotiations. Referrals within regional education networks amplify this reputation advantage further.
Market Impact: Addresses the 38 percent requiring bundled service directly

Deepen Video Conferencing Software Integration Now

Vendors building strong video conferencing and collaboration software integration address the 33 percent of enterprises increasing budget specifically for hybrid meeting support, capturing share from standalone projection hardware suppliers lacking comparable platform partnerships. This positioning increasingly determines corporate procurement outcomes as hybrid meeting frequency continues rising across most office environments. Vendors building these partnerships expand addressable market meaningfully beyond traditional projection hardware buyers toward broader enterprise collaboration technology budgets. Corporate technology buyers increasingly involve IT leadership directly in these procurement decisions given the integration complexity involved. This trend is expected to strengthen as hybrid work models remain permanent.
Market Impact: Addresses the 33 percent expanding hybrid meeting budget

Support District Grant Application Processes Directly

Vendors offering dedicated grant application support address the 51 percent of districts relying on state funding for interactive projector purchases, reducing the administrative burden that otherwise slows smaller district procurement decisions considerably. This support builds genuine loyalty that extends well beyond the initial grant-funded transaction into repeat business relationships. Vendors building this capability expand addressable market among smaller and rural districts lacking dedicated grant-writing staff or prior experience navigating state funding application processes. Smaller districts increasingly favor vendors demonstrating this capability during initial vendor relationship evaluations and outreach. Word-of-mouth referrals within regional education networks amplify this advantage meaningfully.
Market Impact: Addresses the 51 percent relying on grant funding

Who Controls the Margin Pool

Market concentration sits at roughly 54 percent among the top five vendors on a unit shipment basis, reflecting a field where established education and corporate sales channel relationships matter more than raw product specification differences. The gap between leaders and mid-tier challengers has narrowed as newer entrants match feature parity on core interactivity capability. This dynamic pressures margin across most competitive district bid processes.
Current competitive activity centers on ultra-short-throw product line expansion, bundled service contract offerings, and video conferencing software integration, with most major vendors racing to close gaps in whichever dimension they trail competitors most visibly. District-level bid consolidation into multi-year contracts remains common as vendors compete for larger, longer-duration awards. Corporate meeting room contracts increasingly hinge on demonstrated video platform integration depth rather than optical specifications alone.

Emerging pressure comes from flat-panel display manufacturers extending into the interactive projector price range, gaining share among cost-conscious huddle room and small classroom deployments unwilling to commit to projection technology. Rankings could shift meaningfully if flat-panel manufacturers successfully replicate projector-vendor service relationships at comparable scale across large district accounts. This shift could meaningfully reshape the competitive field over the coming several years as adjacent categories continue converging.
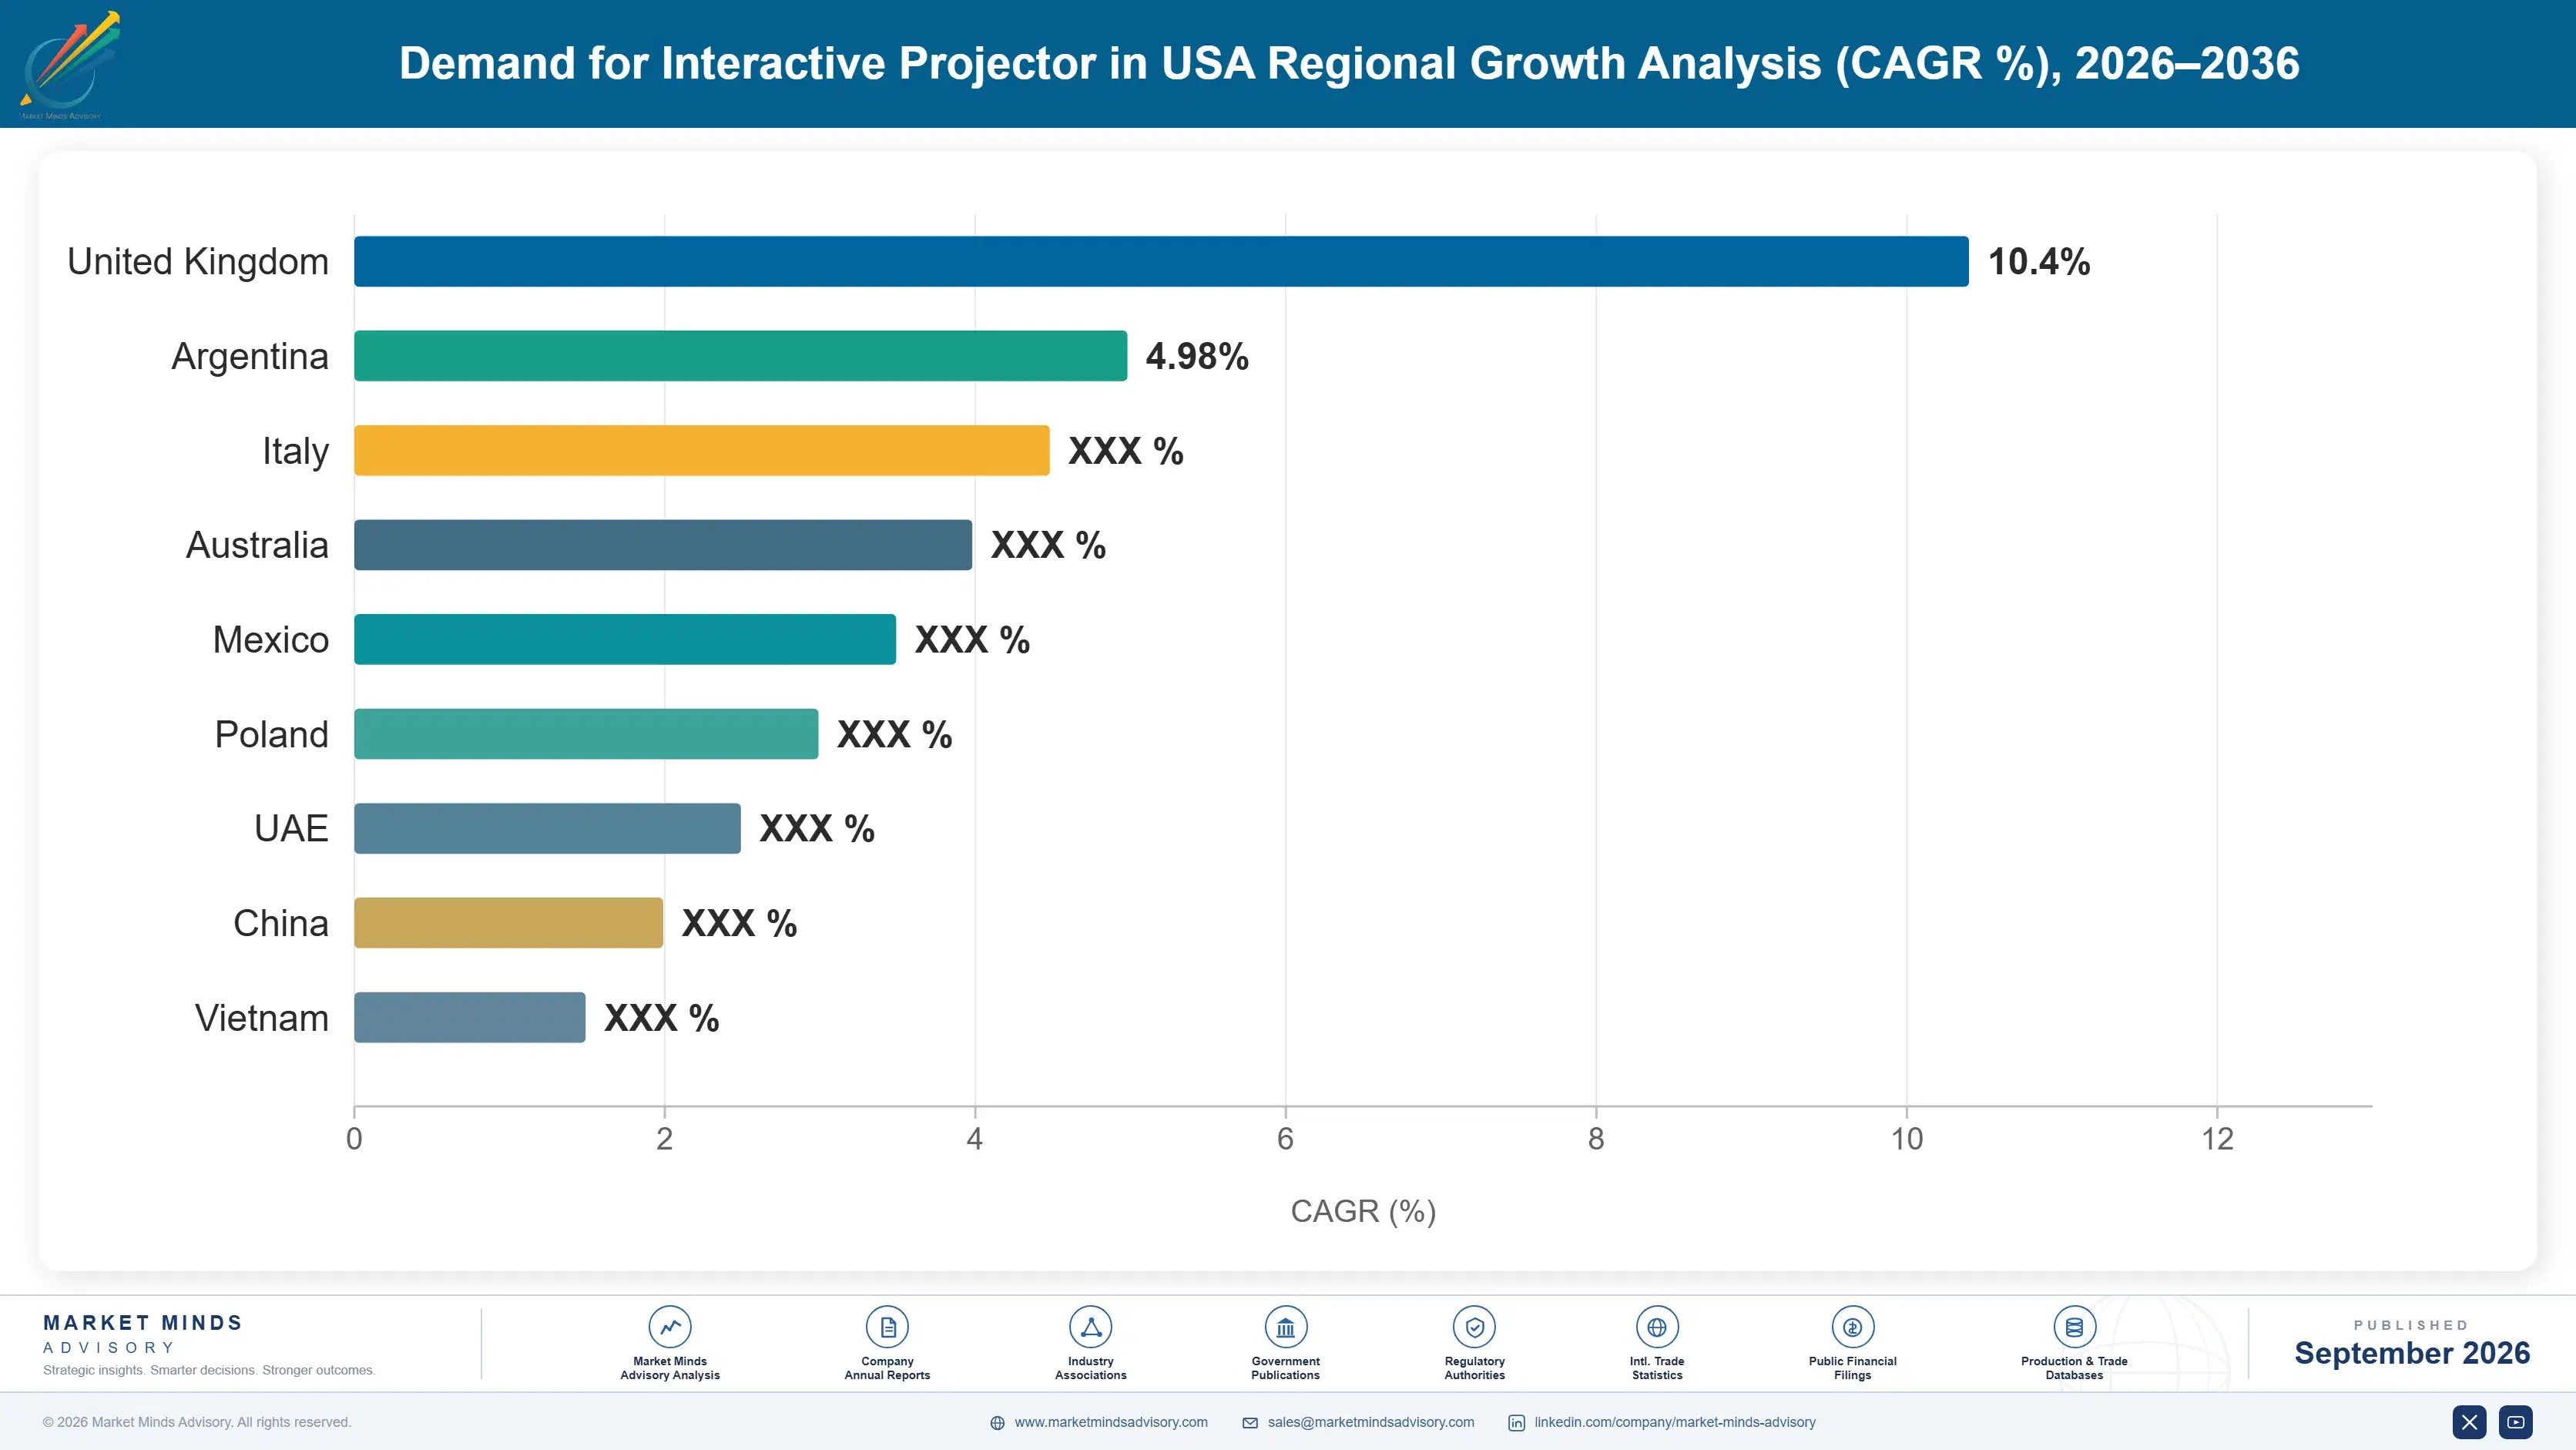
united-states-interactive-projector-market-country-cagr-analysis-1788420598524

Competitive Moat and Risk Dimensions

EPSON AMERICA

Moat: Broad Education Channel Relationships

Epson America maintains deep relationships with education technology resellers and district procurement offices built over decades of dedicated classroom hardware sales, giving it faster access to new district bid opportunities than newer market entrants without comparable channel depth. This channel depth compounds into a durable advantage that newer entrants cannot shortcut through product quality alone.
EPSON AMERICA

Risk: Flat-Panel Competition Rising Sharply

Epson America's core projector business faces genuine margin pressure as flat-panel display manufacturers extend into comparable price points, particularly among smaller huddle room and classroom deployments where interactivity requirements alone no longer favor projection technology. Vendors offering comparable flat-panel touch capability at lower total cost increasingly win price-sensitive district evaluations.
BENQ AMERICA

Moat: Strong Ultra-Short-Throw Engineering

BenQ America's early and sustained investment in ultra-short-throw optical engineering gives it a genuine product performance edge in the fastest-growing configuration category, a differentiator that took years of dedicated research and development investment to build credibly. This engineering depth increasingly determines competitive outcomes as districts prioritize installation simplicity above nearly every other specification.
BENQ AMERICA

Risk: Limited Enterprise Channel Depth

BenQ America's sales relationships concentrate more heavily in education than corporate enterprise channels, leaving it comparatively less positioned to capture the growing hybrid meeting room budget expansion that increasingly favors vendors with established corporate accounts. Competitors with deeper enterprise software partnerships increasingly win corporate accounts that BenQ America struggles to match.

Players Tracked

Prominent Players

Epson America
BenQ America
ViewSonic Corporation
Optoma Technology
Promethean

Other Key Players

Sony Electronics
Panasonic Corporation
InFocus Corporation
NEC Display Solutions
Boxlight Corporation
SMART Technologies
Hitachi Digital Media
Christie Digital Systems
Casio America
Acer America
LG Electronics USA
Barco NV
Vivitek Corporation
Newline Interactive
Legamaster International

Recent Developments

JANUARY 2026

Epson America Launches District Service Bundle

Epson America introduced a new bundled multi-year service offering combining installation, extended warranty, and calibration support designed to address growing district procurement requirements for total ownership value beyond hardware specifications. The offering targets districts increasingly evaluating vendors on relationship value. Industry observers view this as a response to competitor pressure.
Signal: Signals bundled service value is becoming a genuine competitive differentiator industry-wide. Rivals are expected to introduce comparable offerings shortly.
SEPTEMBER 2025

BenQ America Expands Ultra-Short-Throw Product Line

BenQ America launched an expanded ultra-short-throw product line targeting both education and corporate customers, building on its existing optical engineering advantage in this fastest-growing configuration category. Analysts view the move as reinforcing BenQ's technical leadership position. The expansion reflects continued investment in the fastest-growing segment nationally.
Signal: Signals product line investment continues concentrating around the fastest-growing configuration category. This category remains the field's most contested battleground currently.
MAY 2025

ViewSonic Partners With Video Platform Provider

ViewSonic Corporation announced a partnership with a major video conferencing software provider to deepen native integration within its corporate meeting room projector line, positioning ahead of anticipated enterprise demand for tighter platform compatibility. The move reflects growing enterprise integration priorities. The partnership reflects growing enterprise demand for collaboration platform depth.
Signal: Signals software integration depth is emerging as a genuine corporate differentiator. Rivals lacking comparable partnerships face a widening competitive gap.

Optics Component and Lamp Supply Exposure

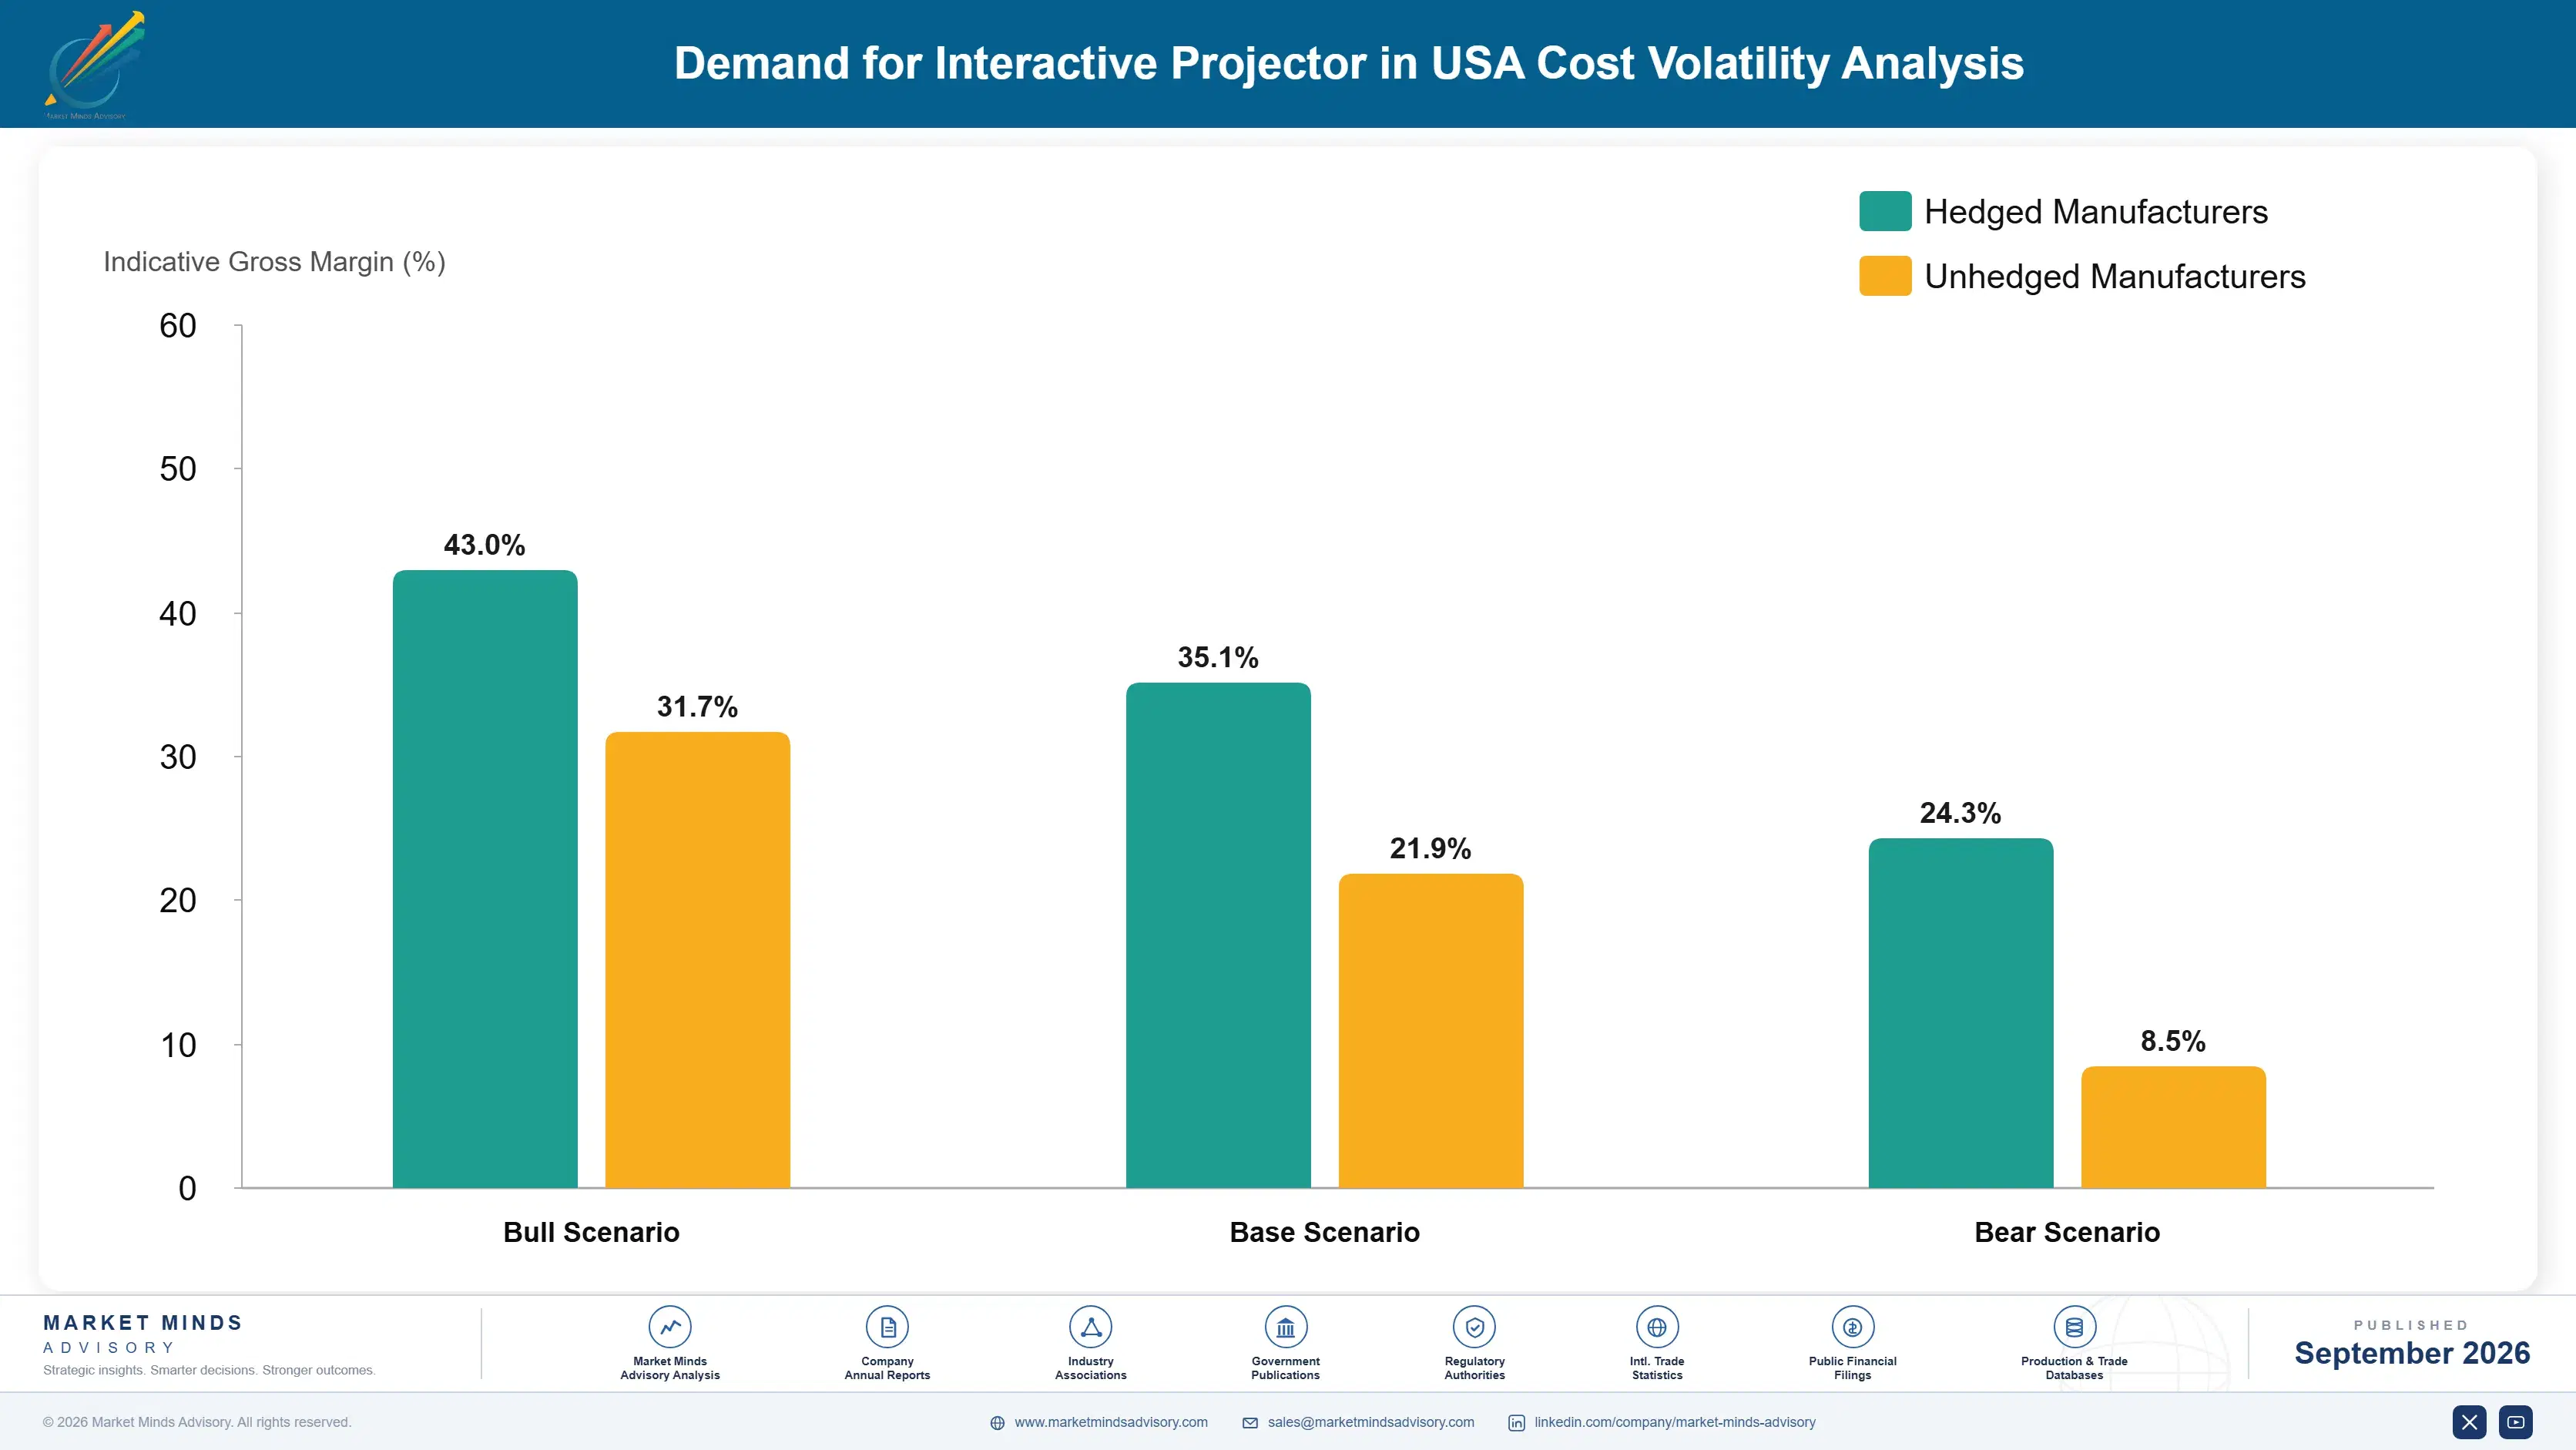
Projection lens assemblies, digital micromirror device chips, and laser light source components represent roughly 32 to 40 percent of platform COGS for interactive projector manufacturers, sourced primarily from specialized optics manufacturers concentrated in Japan, Taiwan, and South Korea. Touch-sensing overlay hardware represents a second meaningful cost category for interactive-specific units. Multi-year supplier contracts help stabilize this cost category, though market volatility still passes through gradually.
Digital micromirror device chip pricing rose meaningfully during 2024 amid tightening semiconductor component supply, an effect documented in several major optics supplier annual reports citing extended lead times and rising input costs across the category. Vendors with diversified component sourcing relationships absorbed less of this cost increase than single-source dependent competitors. Analysts estimate the resulting component cost increase added roughly two to three percentage points of margin pressure for exposed manufacturers.

Smaller vendors lacking diversified component sourcing relationships face a genuine cost disadvantage relative to larger incumbents able to negotiate volume-based pricing agreements directly with specialized optics manufacturers. This gap widens further as touch-sensing technology costs climb, since interactive-specific hardware requirements apply regardless of overall vendor manufacturing scale or purchasing volume. Vendors serving budget-conscious districts feel this disadvantage most acutely given limited negotiating scale.
united-states-interactive-projector-market-company-positioning-matrix-1788420598721

Diversify Optics Component Supplier Relationships

Vendors building relationships with multiple specialized optics manufacturers reduce single-source dependency risk, securing more resilient component pricing and availability even during periods of broader semiconductor supply constraint across the display technology industry. This diversification strategy also shortens replacement timelines when a primary supplier experiences unexpected production disruption or capacity constraint. Investment pays dividends quickly.

Standardize Touch Overlay Hardware Across Product Lines

Vendors standardizing touch-sensing overlay hardware across multiple product lines reduce per-unit component cost meaningfully through shared purchasing volume, spreading fixed engineering investment across a broader base of qualified projector models and configurations. This approach also accelerates new product qualification timelines meaningfully, since previously validated components transfer more readily across similar product lines. Costs drop steadily overall.

Portfolio Architecture for Margin Defence

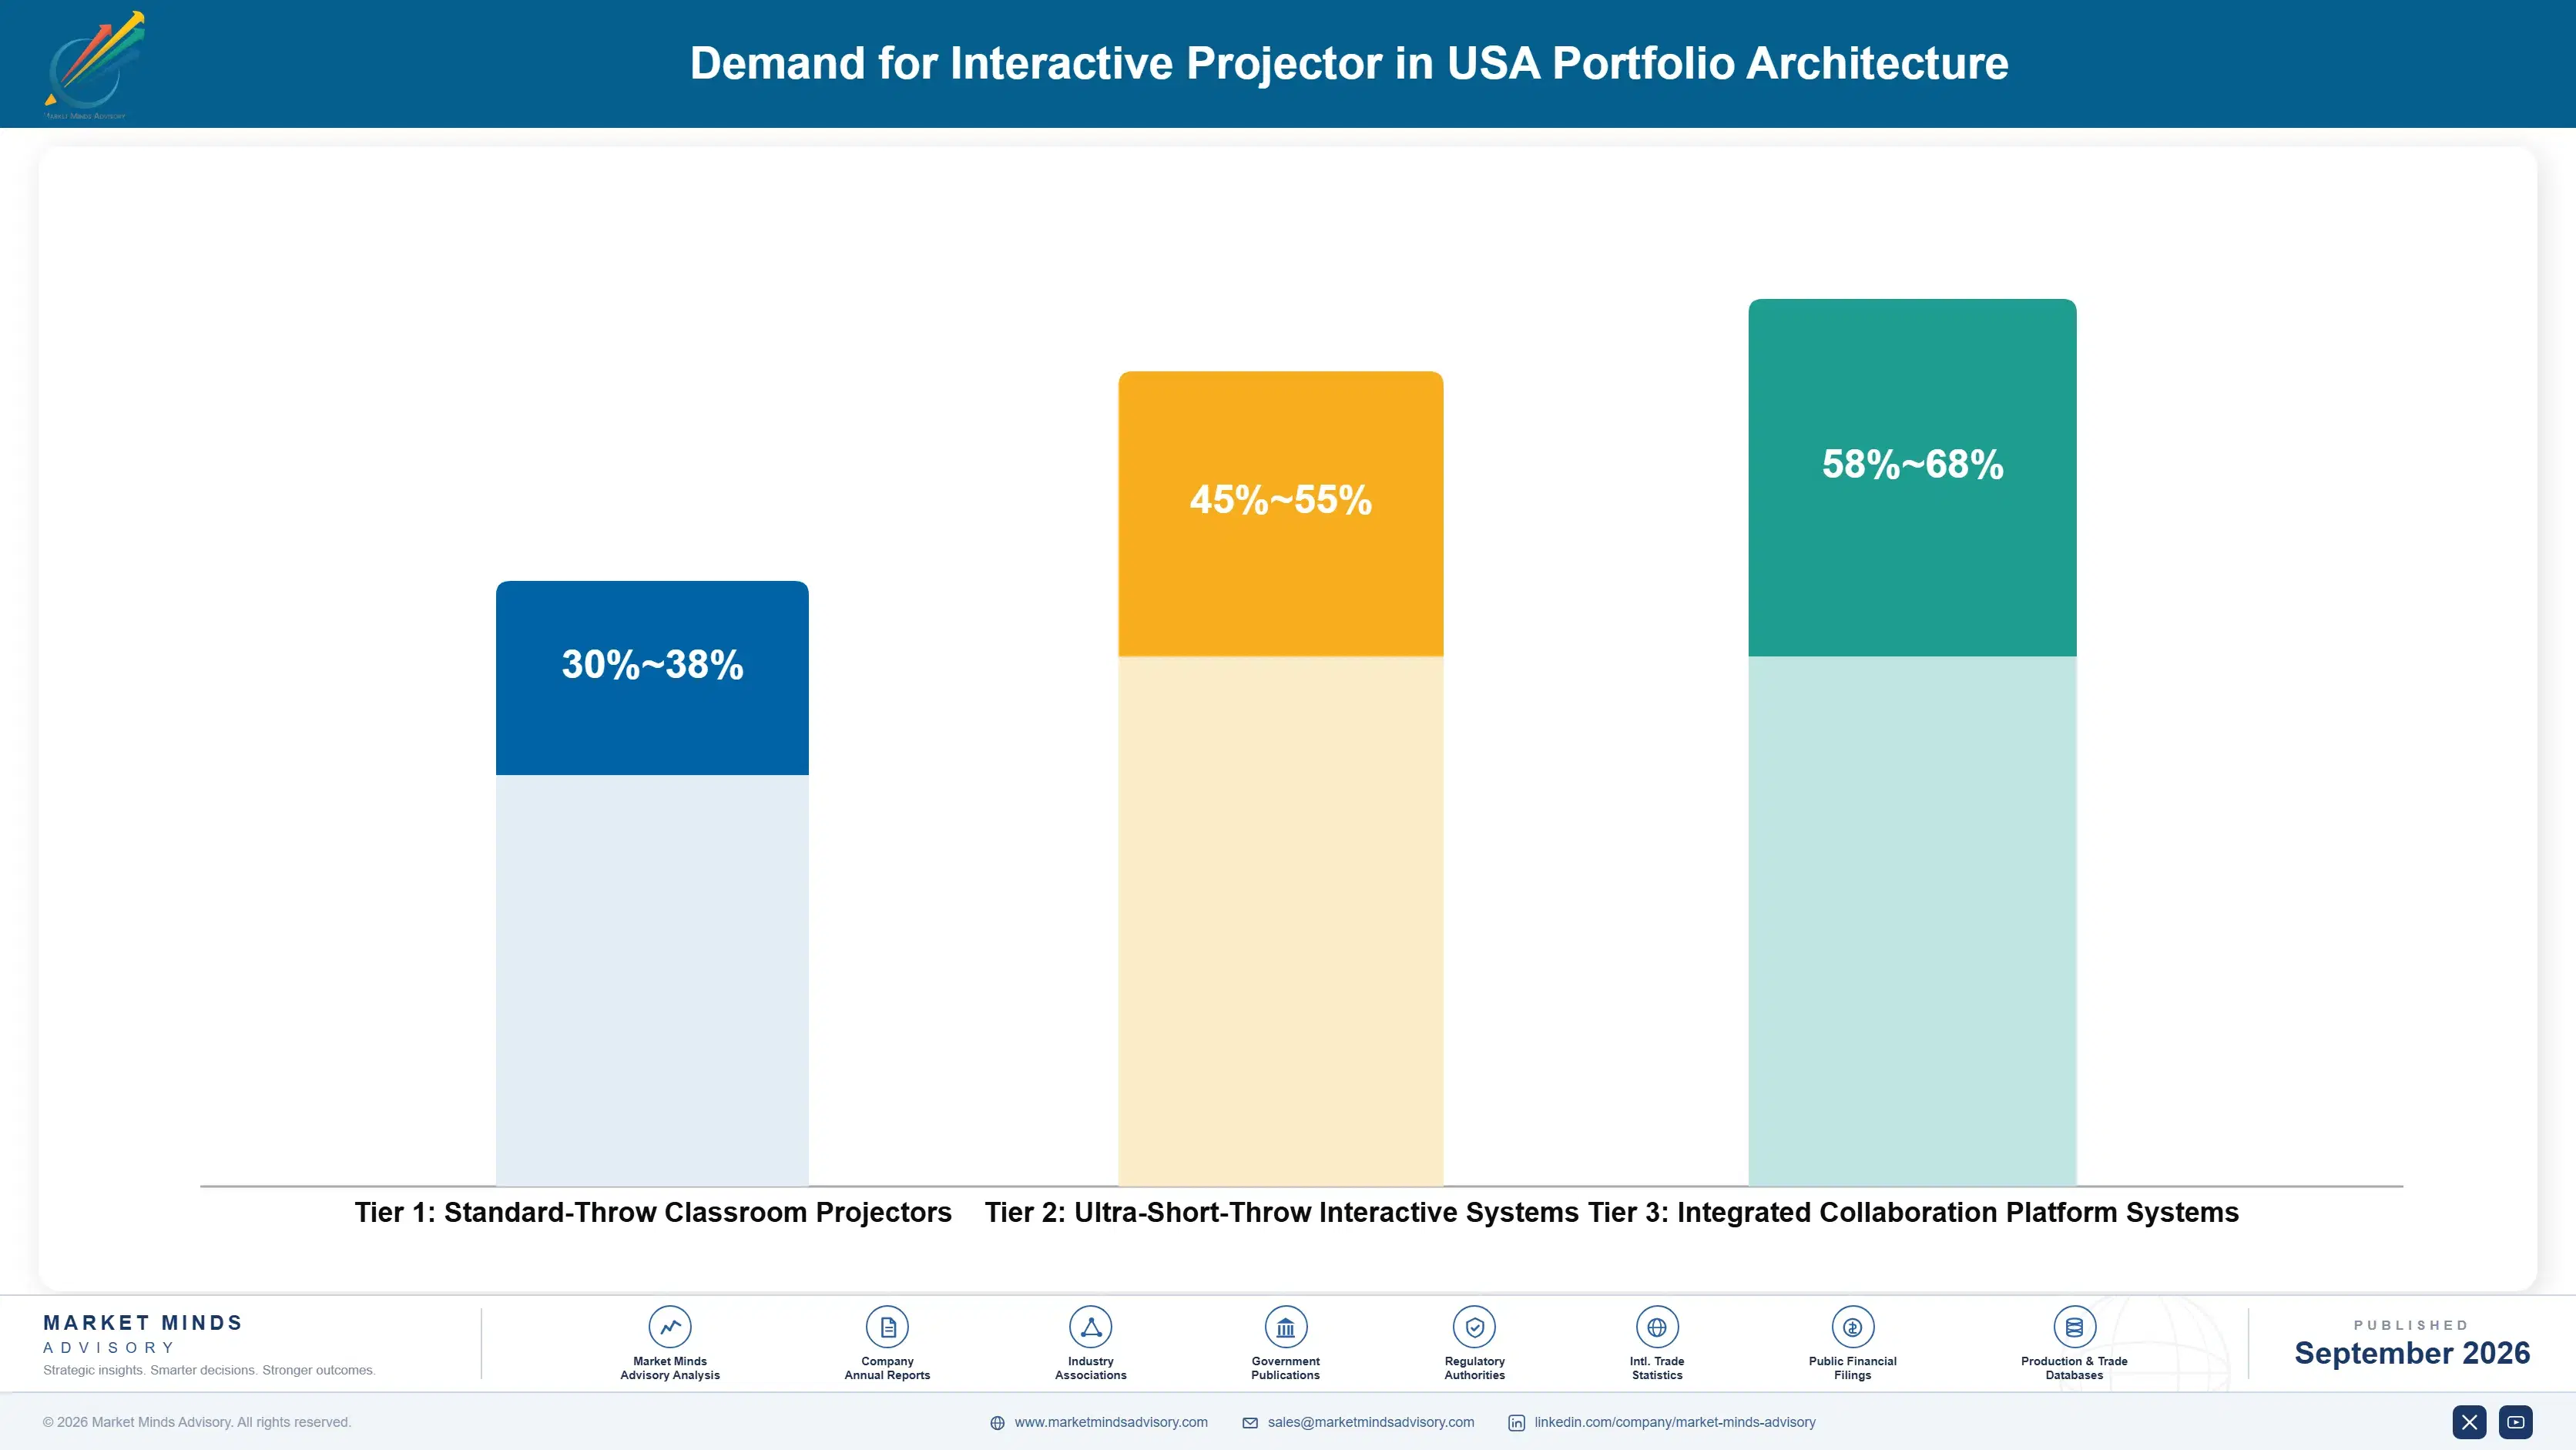
Vendors architect their portfolios around three distinct product tiers separating budget standard-throw classroom units from premium ultra-short-throw and corporate-focused systems commanding substantially higher margins tied to installation simplicity and software integration depth across product lines. Tier boundaries increasingly reflect installation complexity and software depth rather than raw brightness specifications, a shift favoring established vendors with broader engineering capability over commodity-focused entrants.
Volume tier units generate steady revenue at comparatively thin margins, while premium and next-generation certified tiers command substantially higher gross margins reflecting genuine engineering differentiation rather than pure feature bundling alone across most vendor product catalogs currently offered. This tension between volume scale and premium margin defines much of current vendor investment strategy, since serving both segments well requires genuinely different engineering and channel support investment.

High-value margin pools concentrate heavily among ultra-short-throw and corporate collaboration systems requiring deeper software integration and installation engineering not offered within lower-priced standard-throw classroom product tiers across the broader vendor product catalog available nationally. Vendors increasingly steer sales investment toward these higher-margin categories specifically, since the margin differential between standard-throw and premium tiers has widened considerably as software integration matures.

Standard-Throw Classroom Projectors

Entry-level ceiling-mounted interactive projectors for budget-conscious districts with limited renovation budgets and standard classroom configurations already installed. These customers typically operate on tight per-classroom budgets and prioritize cost predictability over advanced feature depth or premium support.
Gross Margin: 30-38%

Ultra-Short-Throw Interactive Systems

Wall or table-mounted units with simplified installation for renovated classrooms and mid-size enterprises seeking reduced deployment complexity and lower ongoing maintenance costs. These customers increasingly represent the fastest-growing segment of new district and enterprise procurement activity nationwide currently underway.
Gross Margin: 45-55%

Integrated Collaboration Platform Systems

Software-integrated systems combining projection, video conferencing, and cloud content sharing for the most demanding corporate and district technology requirements available. These accounts typically represent the highest lifetime value within vendor customer portfolios given multi-year software subscription attachment.
Gross Margin: 58-68%
united-states-interactive-projector-market-cost-volatility-analysis-1788420599220

High-value Sub-segments and Strategic Watch-out

Ultra-Short-Throw Interactive Projectors

High-value and high-growth category as installation simplicity becomes the primary purchasing criterion, commanding premium pricing among vendors with proven optical engineering depth. This segment consistently outpaces every other product category in both revenue growth and new district contract volume nationally. Investment here compounds quickly across most district and enterprise segments.
Gross Margin: 50-60%

Corporate Collaboration Platform Systems

High-value with moderate growth as hybrid work adoption matures, commanding sustained premium pricing tied to demonstrated software integration and collaboration platform compatibility. Vendors with mature software integration increasingly command meaningful renewal pricing power within this maturing corporate category. This gap keeps widening steadily across most competitive evaluations currently.
Gross Margin: 48-58%

Standard-Throw Classroom Projectors

Volume core category generating steady revenue at thinner margins, remaining the entry point for smaller districts before eventual facility renovation upgrade paths emerge. Vendors increasingly view this segment as a customer relationship channel feeding eventual upgrades toward premium tiers. This funnel effect matters greatly for long-term vendor customer value.
Gross Margin: 28-36%

Legacy Analog Whiteboard Systems

Strategic watch-out category facing steady decline as digital interactive displays replace older non-interactive technology across most public school district modernization programs currently. Vendors are monitoring this segment closely for signs of accelerating decline as remaining holdout districts eventually upgrade. This transition remains gradual though inevitable across most districts nationally.
Gross Margin: 12-20%

Replacement Cycles Build Recurring Vendor Revenue

Interactive projector vendors generate genuine annuity economics once embedded within a district's approved vendor list, since procurement rules typically favor incumbent suppliers with proven installation and support track records over unfamiliar new entrants during subsequent replacement cycles. This keeps established vendors embedded across a district's full multi-decade facility relationship, generating recurring hardware and service revenue well beyond any single transaction. Vendors establishing this early enjoy compounding revenue.
Adoption depth and stickiness vary meaningfully by end-use vertical: public school districts embed vendor relationships deepest given multi-year service contracts and grant-funded procurement cycles, while corporate buyers show comparatively shallower loyalty, often re-evaluating vendors each renovation cycle based on current room technology requirements rather than prior familiarity. Grant-funded adoption tends to persist through budget cycles that otherwise prompt vendor switching. Corporate accounts require re-earning trust each cycle.

A generational shift in buyer profile is underway as district technology directors increasingly drive procurement decisions previously owned by facilities managers, favoring vendors with strong software integration and data security credentials over pure hardware specification and price competitiveness that earlier generations of buyers prioritized. This shift pushes suppliers toward technical proof-of-concept demonstrations and data privacy documentation. Purely relationship-based sales approaches increasingly lose to technically credible competitors.
Section default visual

Where MMA Sees Interactive Projectors Heading

These are among the four positions where our research anticipates prominent divergence between winners and laggards over the coming forecast period. Each is grounded in the demand model, the regulatory perimeter, and the announced capacity pipeline.
01 / ULTRA-SHORT-THROW INVESTMENT PRIORITY

Ultra-short-throw product depth deserves priority as installation simplicity wins

Roughly 44 percent of new shipments now feature ultra-short-throw configuration, making optical engineering depth a genuine competitive moat rather than an optional capability most vendors historically treated as secondary to basic brightness specifications. Vendors that build this depth now win the largest multi-school district contracts before slower competitors catch up, since replicating years of installation track record is not something capital alone can shortcut. This gap widens further as renovation-driven demand continues climbing nationwide, leaving late movers facing a meaningfully steeper climb to close it.
02 / SERVICE BUNDLE STRATEGY

Bundled multi-year service contracts capture district procurement preference

Roughly 38 percent of surveyed districts now require bundled service commitments as a formal bid requirement, positioning vendors with dedicated field service infrastructure well ahead of competitors offering hardware-only proposals during competitive evaluations. Vendors with this capability differentiate meaningfully from suppliers still relying on transactional single-unit sales approaches increasingly out of step with procurement expectations. This positioning advantage increasingly determines which vendors win large multi-school contract renewals, a trend expected to strengthen further as more procurement committees formalize similar requirements broadly.
03 / SOFTWARE INTEGRATION FOCUS

Video conferencing integration captures growing hybrid meeting room budget

Roughly 33 percent of surveyed enterprises report increasing interactive display budget specifically to support hybrid meeting formats, representing genuine opportunity for vendors with strong collaboration software partnerships over standalone projection hardware suppliers. Vendors that deepen this integration capture disproportionate share of corporate procurement decisions increasingly driven by IT leadership rather than facilities teams alone. This capability increasingly separates vendors winning enterprise accounts from those confined to education channels, an advantage that compounds steadily as hybrid meeting frequency continues rising nationwide.
04 / GRANT SUPPORT STRATEGY

Grant application support addresses smaller district funding barriers

Roughly 51 percent of surveyed districts rely on state grant funding for at least a portion of recent interactive projector purchases, reflecting a persistent administrative barrier that smaller and rural districts lacking dedicated grant-writing staff face when pursuing modernization funding independently. Vendors offering dedicated grant application support build genuine loyalty extending well beyond the initial funded transaction into repeat business relationships. This capability increasingly separates vendors capturing smaller district accounts, favoring those with dedicated regional support staff, from those confined to larger systems.

Engagement Snapshot From the Field

A live engagement with an industry participant carrying material or product regulatory and market exposure ahead of a defining policy shift, showing how our research translates into a defensible multi-year portfolio strategy.
MARKET MINDS ADVISORY · CLIENT ENGAGEMENT SUMMARY
Demand for Interactive Projector in USA Producer Strategic Portfolio Review and Transition Roadmap 2026·Investment Scenario on Demand for Interactive Projector in USA Exposure Evaluation 2025-26
CLIENT PROFILE
The client is a mid-size public school district serving roughly forty elementary and secondary schools across a suburban county, operating an aging installed base of ceiling-mounted projectors averaging nine years in service. The engagement followed a failed state grant application that left leadership uncertain how to fund a full-district replacement cycle. Estimated annual maintenance costs on the existing fleet reportedly exceeded eight hundred thousand dollars (client-reported, unverified by MMA) district-wide.
STRATEGIC CHALLENGE
The district's technology director faced mounting maintenance costs and teacher complaints about unreliable aging equipment but lacked a clear funding pathway after a recent state grant application was denied, leaving leadership uncertain whether a phased self-funded replacement would deliver acceptable return within budget constraints. Leadership needed a defensible business case before committing to a multi-year district-wide investment.
MMA APPROACH
MMA conducted primary interviews with the district's technology director and facilities staff, and benchmarked three vendors offering bundled service and phased payment structures against total cost of ownership over a projected seven-year replacement cycle. The analysis modeled phased rollout scenarios against the district's specific building renovation schedule and existing maintenance spending patterns.
KEY FINDINGS
  1. A phased ultra-short-throw replacement across the highest-maintenance-cost schools first could plausibly cut annual maintenance spending by roughly thirty percent within two years.
  2. Two of the three benchmarked vendors offered multi-year payment structures that avoided the need for a single large upfront capital expenditure request.
  3. Teacher satisfaction surveys at comparable districts that completed similar phased replacements showed meaningfully higher reported classroom technology reliability ratings overall. Board members cited this data as a decisive factor.
  4. Bundled service contracts reduced the district's internal IT support burden noticeably, freeing staff time for other technology priorities across the district. This freed capacity for other technology priorities.
CLIENT PROFILE
The client is a mid-size public school district serving roughly forty elementary and secondary schools across a suburban county, operating an aging installed base of ceiling-mounted projectors averaging nine years in service. The engagement followed a failed state grant application that left leadership uncertain how to fund a full-district replacement cycle. Estimated annual maintenance costs on the existing fleet reportedly exceeded eight hundred thousand dollars (client-reported, unverified by MMA) district-wide.
STRATEGIC CHALLENGE
The district's technology director faced mounting maintenance costs and teacher complaints about unreliable aging equipment but lacked a clear funding pathway after a recent state grant application was denied, leaving leadership uncertain whether a phased self-funded replacement would deliver acceptable return within budget constraints. Leadership needed a defensible business case before committing to a multi-year district-wide investment.
MMA APPROACH
MMA conducted primary interviews with the district's technology director and facilities staff, and benchmarked three vendors offering bundled service and phased payment structures against total cost of ownership over a projected seven-year replacement cycle. The analysis modeled phased rollout scenarios against the district's specific building renovation schedule and existing maintenance spending patterns.
KEY FINDINGS
  1. A phased ultra-short-throw replacement across the highest-maintenance-cost schools first could plausibly cut annual maintenance spending by roughly thirty percent within two years.
  2. Two of the three benchmarked vendors offered multi-year payment structures that avoided the need for a single large upfront capital expenditure request.
  3. Teacher satisfaction surveys at comparable districts that completed similar phased replacements showed meaningfully higher reported classroom technology reliability ratings overall. Board members cited this data as a decisive factor.
  4. Bundled service contracts reduced the district's internal IT support burden noticeably, freeing staff time for other technology priorities across the district. This freed capacity for other technology priorities.
RECOMMENDED STRATEGY
Phase 1: Phase one: replace equipment at the five highest-maintenance-cost schools first, prioritizing buildings with the oldest installed base. This sequencing captured the largest cost savings fastest. Phase 2: Phase two: expand replacement across remaining schools over three years, aligned with the district's existing renovation and budget cycle. This pacing avoided any single-year budget spike. Phase 3: Phase three: track maintenance cost and teacher satisfaction data annually to validate projected returns and inform future budget requests. This tracking supports future budget request justification.
OUTCOME
The district selected a vendor and began phased replacement within five months of the engagement's conclusion. Early data from the first replaced schools suggests maintenance costs fell by roughly twenty-eight percent (client-reported, unverified by MMA), with full district replacement expected to complete within three years.

Frequently Asked Questions

Foundational context covering the market sizes, CAGR, scope, country, region and competition that inform every finding below. This section is provided to cover basics and most often pre-purchase conversations, answered from the MMA Primary Research Dataset.

What is the current size of the Demand for Interactive Projector in USA?

The United States interactive projector market reached approximately 1.4 billion dollars in 2025. Federal education technology funding and hybrid corporate meeting room adoption are the primary drivers behind current market scale.

How large will the Demand for Interactive Projector in USA be by 2036?

MMA projects the market will reach approximately 3.61 billion dollars by 2036, expanding roughly 2.37 times from its 2026 base. Ultra-short-throw adoption accounts for the largest share of this projected growth.

What is the CAGR for the Demand for Interactive Projector in USA 2026 to 2036?

The market is projected to grow at a compound annual growth rate of 9.0 percent between 2026 and 2036. Bull and bear scenarios range from 7.7 percent to 10.3 percent depending on funding levels.

Which segment is growing fastest?

Ultra-short-throw interactive projectors are the fastest-growing segment, projected at a 14.0 percent CAGR, roughly 1.56 times the overall market rate. Installation simplicity drives district and enterprise adoption of this pace.

Who are the major companies in the Demand for Interactive Projector in USA?

Leading vendors include Epson America, BenQ America, ViewSonic Corporation, Optoma Technology, and Promethean. The top five vendors together hold approximately 54 percent of the market on a unit basis.

Which country is growing fastest?

The United States itself is the primary focus of this report, projected at a 9.5 percent CAGR through 2036. Federal education funding and hybrid corporate adoption underpin this pace of growth.

Report Segmentation Architecture

The full report scope spans multiple orthogonal segmentation dimensions, with cross-tabulated demand data provided for each dimension pair. Coverage extends further to regional breakdowns, trend trajectories, and the competitive detail needed to support segment-level decision-making.

By Throw Configuration Type

    By End-Use Sector

      By Distribution Channel

        By Region

        • North America
        • Western Europe
        • East Asia
        • South Asia and Pacific
        • Latin America
        • Middle East and Africa
        • Eastern Europe

        Scope, Methodology, and Coverage

        Every figure in this report is reproducible from documented input assumptions. The scope below maps the historical period, the forecast horizon, the segmentation dimensions, and the countries covered, alongside the underlying primary and qualitative methodology.
        Historical Period
        2020 to 2025
        Forecast Period
        2026 to 2036
        Base Year
        2025 (USD billions; MMA Primary Research Dataset, September 2026)
        Market Definition
        The Demand for Interactive Projector in USA report covers touch-enabled and gesture-interactive projection systems sold into United States education, corporate, and government markets, including ultra-short-throw and standard-throw configurations. It excludes non-interactive standard projectors, flat-panel interactive display hardware, and standalone document camera systems.
        Quantitative Units
        USD billions, market share in percent, CAGR in percent
        Segmentation Dimensions
        Throw configuration type, end-use sector, distribution channel, region
        Regions Covered
        North America, Western Europe, East Asia, South Asia and Pacific, Latin America, Middle East and Africa, Eastern Europe
        Countries Covered
        United States, with global comparative coverage across Germany, China, Japan, India, Brazil, and 18 additional countries
        Key Companies Profiled
        Epson America, BenQ America, ViewSonic Corporation, Optoma Technology, Promethean, and 15 additional participants
        Quantitative Methodology
        Primary survey, n=3,800 respondents, Q4 2025, six countries; demand-side model with trade association cross-validation
        Qualitative Methodology
        47 expert interviews, Q4 2025; applied to validate demand model assumptions, identify emerging dynamics, and assess competitive positioning
        Report Format
        PDF and XLSX data workbook (Word format preview document)
        Publisher
        Market Minds Advisory
        Report Code
        MMA-2026-TEC-423
        Published
        September 2026
        Contact
        sales@marketmindsadvisory.com | www.marketmindsadvisory.com

        Purchase the full Demand for Interactive Projector in USA Report (2026 to 2036).

        This report provides a comprehensive assessment of United States interactive projector demand, covering segmentation, regional dynamics, competitive positioning, and input cost exposure through 2036. It draws on primary survey data from 3,800 respondents and 47 expert interviews conducted across six countries in the fourth quarter of 2025. Analysts detail ultra-short-throw adoption, bundled service contract trends, and margin economics across three distinct product tiers. The report also includes a detailed client case study illustrating a real district fleet modernization engagement and its measured outcomes. Regional data is included for global comparative context.
        Segment-level CAGR and market share forecasts
        Seven-region demand and pricing trend analysis
        Competitive positioning across twenty profiled vendors
        Input cost exposure and mitigation pathways
        Portfolio tier margin economics and watch segments
        Anonymized client engagement case study review

        Built For The People Who Decide

        From boardroom strategy to bench-side execution, this report is read cover-to-cover by leaders shaping the next decade of their industry, turning demand scenarios, market dynamics and valuation benchmarks into decisions.
        CXOs/ Presidents/ VPs/ Managers
        M&A and Corporate Development
        Strategy Teams and R&D Heads
        Procurement and Product Directors
        Regulatory and Compliance Leaders
        Investor Relations and Equity Analysts