Market Minds Advisory
Demand for Hydrocarbon Accounting Solution in USA

Demand for Hydrocarbon Accounting Solution in USA: Demand for Hydrocarbon Accounting Solution in USA. Digital Transformation Reshapes Upstream Revenue and Volumetric Reporting

Shale operators managing thousands of wells and tightening regulatory reporting mandates are colliding as production accounting teams abandon spreadsheet-based volumetric reconciliation for cloud software engineered for audit-ready compliance at scale.

Lead Analyst

Published

September 2026

Make Smarter Decisions with Customized Research Insights

Request a free sample report and evaluate market opportunities, growth trends, and competitive dynamics relevant to your business needs.

2025 MARKET VALUE$0.9BMarket Size 2025
2036 FORECAST VALUE$2.7BBase Case , 2026 to 2036
CAGR 2026 TO 203610.5 %Bull 11.8% / Bear 9.2%
INCREMENTAL OPPORTUNITY$1.7BNet 10- year value creation
EXPANSION MULTIPLE2.72x2036 value over 2026 base
Strategic Levers
M&A Pipeline
Regional Outlook
Country Rankings
Competitive Intelligence
Segmental Deep-dive
Call-Us : 91 93563 13602

Executive Snapshot and Market Trajectory.

US shale operators running thousands of individual wells across multiple basins are replacing spreadsheet-based production accounting with cloud-native platforms that reconcile volumetric data automatically rather than slow manual monthly closes, cutting reconciliation cycles from weeks to days across most active operating regions nationwide, freeing analyst time for higher-value strategic work.
Regulatory reporting complexity is accelerating fastest, as state royalty audits and expanding methane emissions disclosure requirements push operators toward software that generates audit-ready output directly rather than through manual spreadsheet compilation prone to costly error and delay. Midstream allocation and measurement software is close behind, driven by expanding gathering and processing infrastructure across the Permian and Appalachian basins specifically over recent years of sustained infrastructure buildout across both major basins nationwide.
A small group of specialized vendors, alongside diversified enterprise software giants offering configured modules, competes for operator budgets, with consolidation activity picking up as larger platforms acquire niche measurement and allocation specialists to round out their product offerings and capture additional revenue. Regulatory pressure from state commissions and federal methane rules is reshaping which vendors operators trust most with compliance-critical reporting work going forward.
Market Definition
This report covers software platforms used by upstream and midstream oil and gas operators in the United States for production volumetric accounting, revenue distribution, joint interest billing, and regulatory reporting, measured on a global vendor revenue basis. It excludes general-purpose enterprise resource planning software not specifically configured for hydrocarbon measurement and allocation workflows.
Base Year Value
$0.9B in 2025 (MMA Primary Research Dataset, September 2026)
Forecast Period
2026 to 2036, eleven discrete annual values
CAGR
10.5% base case. Bull 11.8%. Bear 9.2%.
Fastest Growth Segment
Regulatory Reporting and Compliance: 14.5% CAGR
Fastest Growth Country
Guyana: 19.0% CAGR
Fastest Growth Region
South Asia and Pacific: 12.5% CAGR
Largest Region
North America: 32% of 2025 global value
Market Leaders
Quorum Software, Enverus, SAP, Oracle, W Energy Software
Primary Survey
n=3,800 procurement and R&D decision-makers, Q4 2025, six countries
Methodology
Demand-side build-up, cross-validated against public data, 47 expert interviews

Demand for Hydrocarbon Accounting Solution in USA Market Forecast Scenarios

united-states-hydrocarbon-accounting-solution-mark-size-forecast-scenario-1788419029486
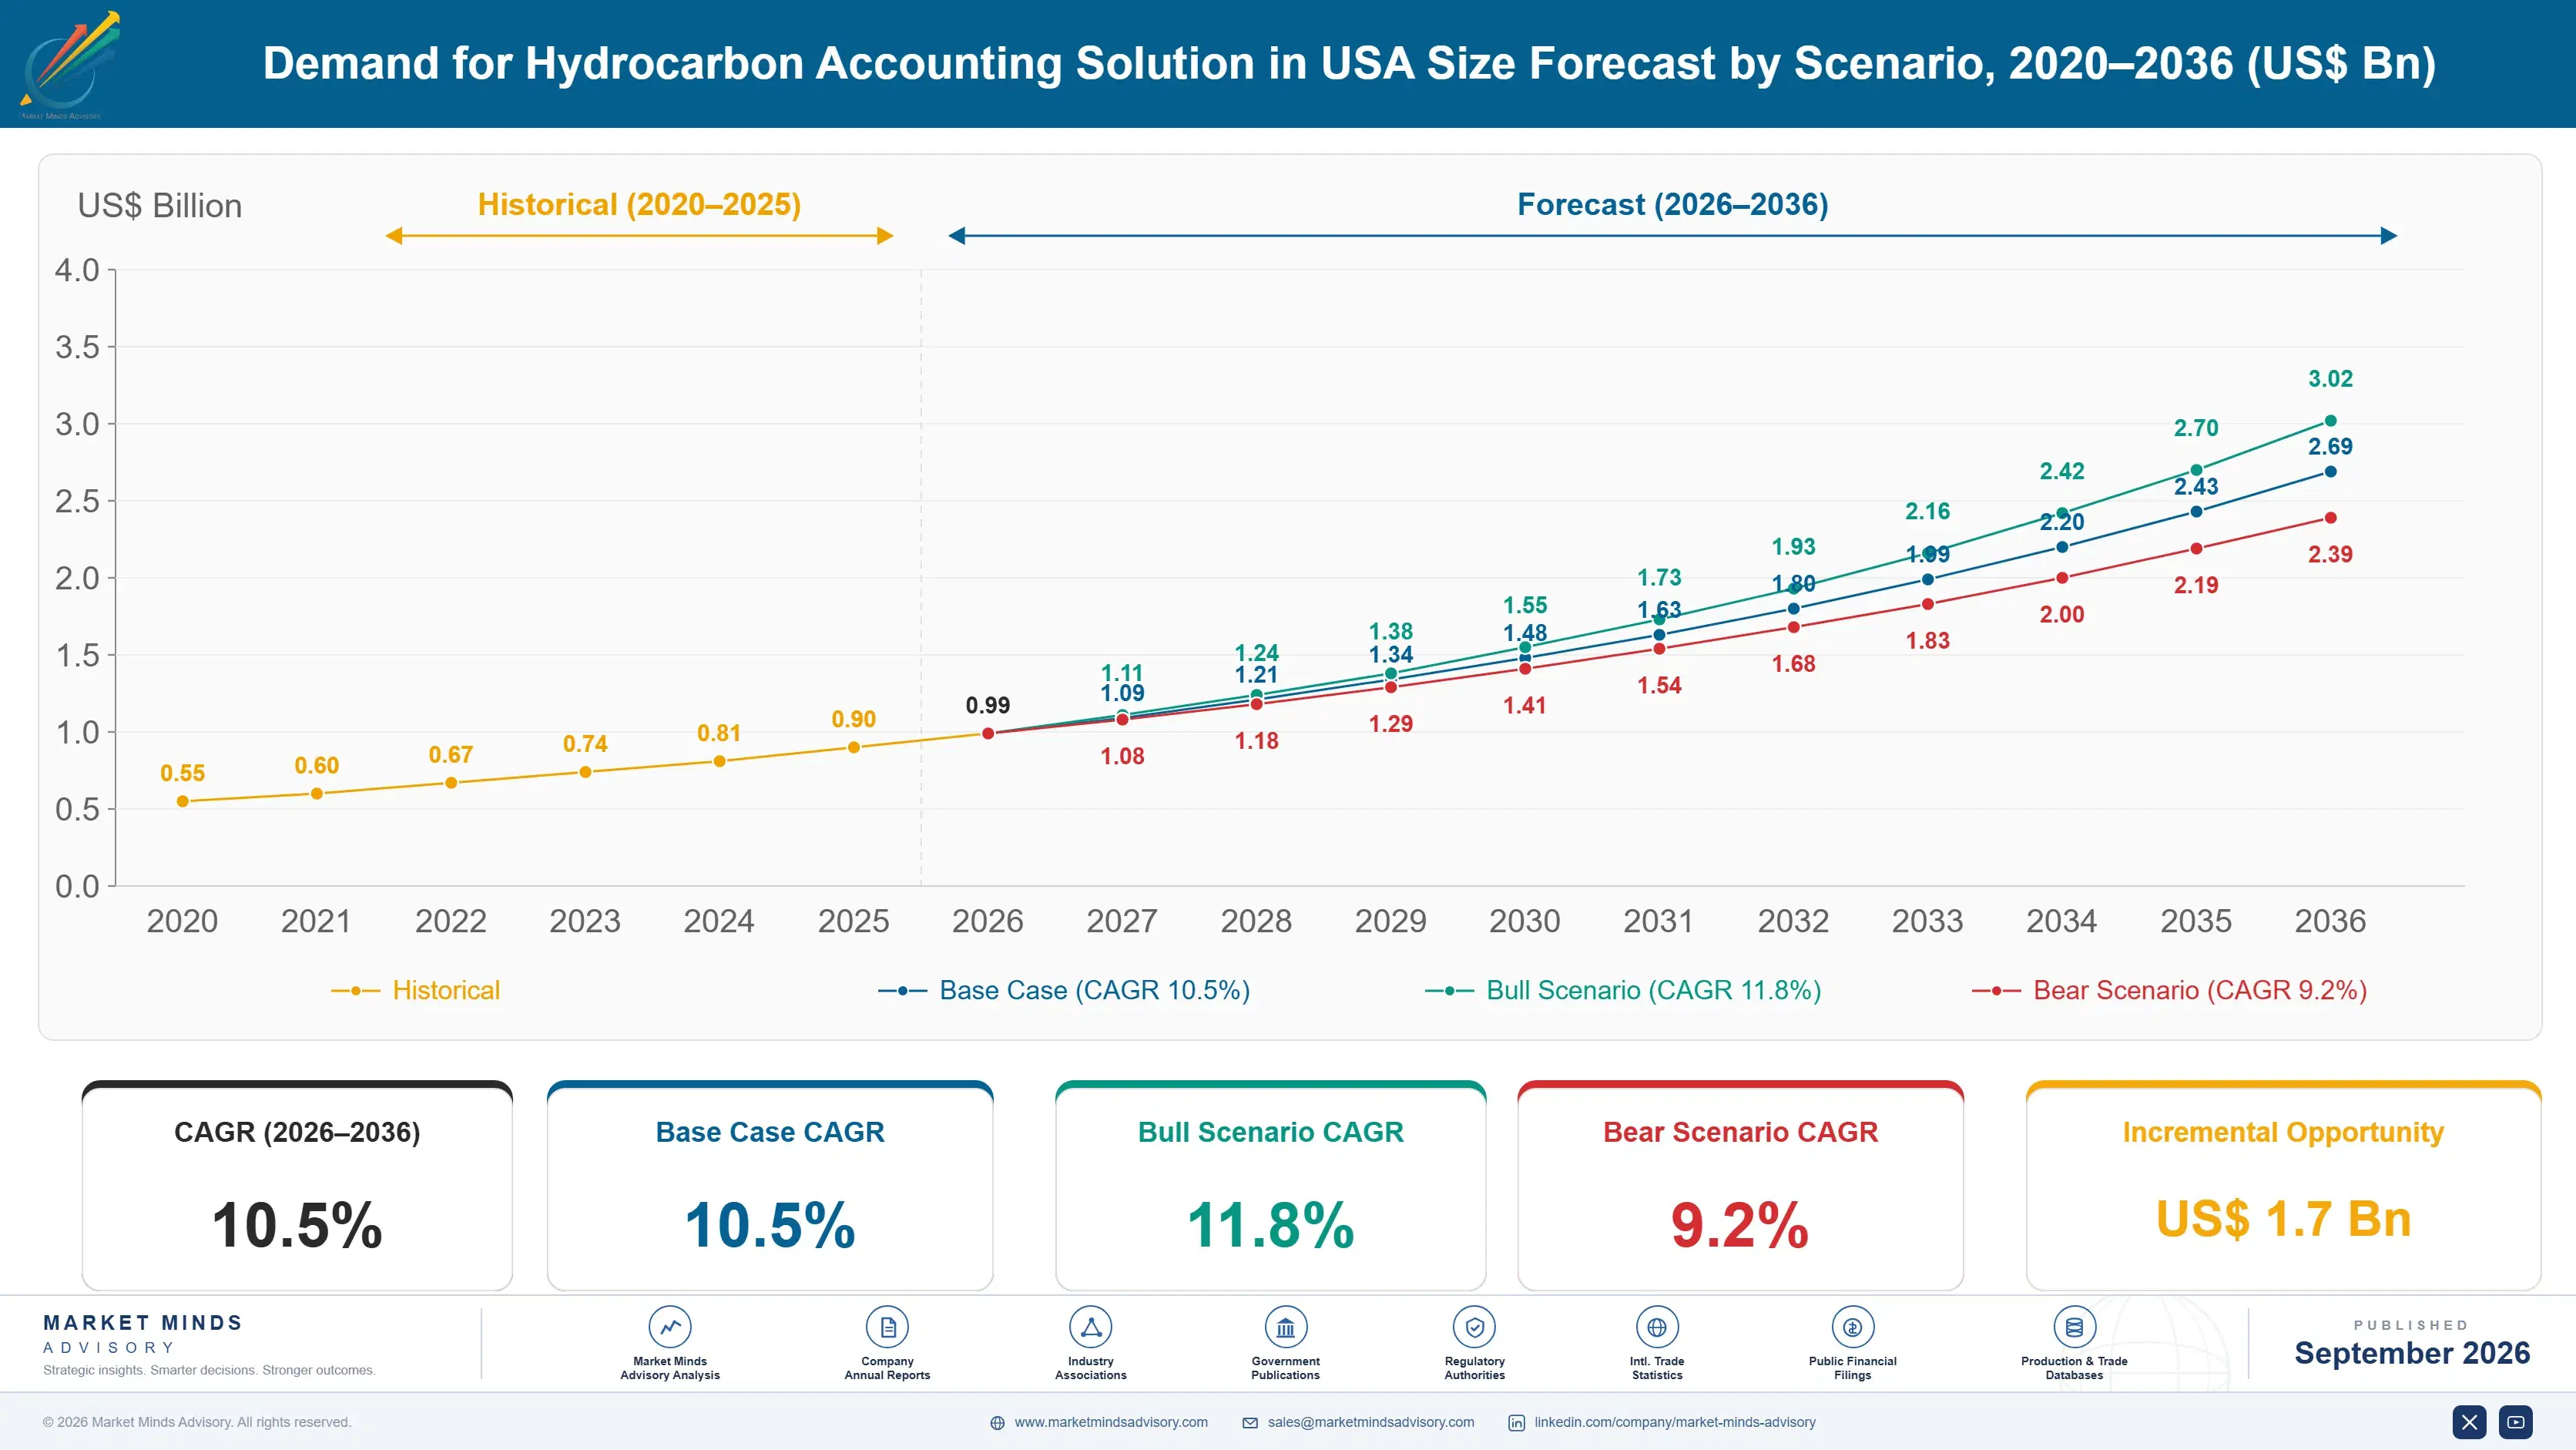
Hydrocarbon accounting software adoption grew at a 9.5 percent historical rate between 2020 and 2025 as shale operators consolidated well counts and sought to replace error-prone spreadsheet workflows following several rounds of merger-driven back-office consolidation across the sector. Early cloud migration among mid-size operators accelerated once larger operators demonstrated measurable audit-cycle time savings worth replicating quickly.
The base case assumes 10.5 percent annual growth through 2036, anchored by three mechanisms working together: expanding methane emissions disclosure mandates requiring auditable reporting trails, continued shale well count growth in the Permian basin sustaining volumetric accounting demand, and midstream operators investing in allocation software to support new gathering and processing capacity coming online. Vendor consolidation is steadily compressing the number of credible platform choices operators can select from with confidence.
A bull case near 11.8 percent growth hinges on federal methane reporting rules tightening further and forcing faster software adoption across smaller independent operators who have so far delayed migration entirely. A bear case near 9.2 percent follows sustained low commodity prices curbing operator IT budgets and delaying planned software modernization projects industry-wide for at least another full cycle.

Compliance Pressure Rewrites the Accounting Software Buying Criteria

Hydrocarbon accounting software sits at the intersection of finance and field operations, requiring vendors to understand both accrual accounting rules and the physical realities of gas metering, tank gauging, and pipeline allocation simultaneously. That dual expertise requirement keeps competition narrower than in general enterprise software categories, where domain depth matters less than broad feature coverage across many unrelated general business industries.
MARKET CONCENTRATIONCR5 48%Moderately fragmented across specialists and larger diversified software platforms
AVERAGE CONTRACT VALUE$85,000 per operator annuallyReflects well count and reporting module complexity purchased
TOP PRODUCING BASIN SHAREPermian Basin 34%Concentrated around the largest active shale drilling region
CLOUD MIGRATION RATE58% of operatorsShare of operators now running cloud-hosted accounting platforms
IMPLEMENTATION CYCLE LENGTH7 to 9 monthsTime typically required for full platform deployment completion
IT BUDGET SHAREAccounting software 12%Portion of operator technology budgets allocated to accounting
Regulatory reporting is now the primary battleground, as operators increasingly select vendors based on how directly software output maps to state royalty audit formats and federal methane disclosure templates required by newly finalized rules. Vendors slow to update reporting templates for new regulatory formats are losing renewal negotiations to competitors who treat compliance mapping as a core product feature rather than an afterthought.
Consolidation is reshaping vendor choice as larger platforms acquire specialized measurement and allocation tools to offer single-vendor coverage across the full accounting workflow from wellhead to revenue distribution. Operators increasingly prefer consolidating vendor relationships to reduce integration overhead, even when that means accepting a less specialized tool for a given workflow step in exchange for unified data visibility across the entire operating platform.
"Operators used to tolerate spreadsheet chaos because switching costs felt too high. Now regulators are forcing the switch for them, and the vendors ready with compliance-mapped reporting are the ones winning renewals."
Practice Lead, Energy Technology and Digital Operations · MMA Oil and Gas Hydrocarbon Accounting and Production Software Practice · September 2026

Market Trends

Cloud Migration Replaces Legacy On-Premise Accounting Systems

Operators are retiring decades-old on-premise hydrocarbon accounting installations in favor of cloud-hosted platforms that update automatically and integrate directly with field measurement devices without custom middleware. This shift lets smaller and mid-size operators access capabilities previously affordable only to major integrated producers running dedicated internal IT teams. Roughly 58 percent of active US operators now run at least one cloud-hosted accounting module, up sharply from a much smaller base just five years earlier, and vendors report accelerating migration inquiries from operators still running legacy systems approaching end of vendor support.
Market Impact: Adds 34% Permian production share demand
Methane Emissions Disclosure Rules Reshape Reporting Requirements

Federal methane emissions disclosure requirements finalized in recent years are forcing operators to track and report volumetric data at a granularity most legacy accounting systems were never designed to capture or reconcile automatically at scale. Software vendors are racing to add emissions-linked reporting modules directly into core accounting platforms rather than offering it as a bolt-on add-on tool. Operators facing a 2026 compliance deadline are prioritizing vendors who can demonstrate working emissions reporting functionality today, not on a future product roadmap promise that remains still many months away from actual release.
Market Impact: Cuts audit cycle time 40%

Market Opportunities and Growth Drivers

Permian Basin Well Count Growth Sustains Accounting Demand

Continued drilling activity in the Permian basin, which now accounts for roughly 34 percent of US shale production, keeps adding new wells that require volumetric accounting and revenue distribution setup from day one of production. Each new well adds recurring software licensing and configuration revenue for accounting platform vendors, independent of overall commodity price cycles that affect drilling capital budgets more directly than software spending decisions. Operators managing well counts in the thousands increasingly view accounting software licensing as a fixed operating cost rather than a discretionary technology purchase they can defer.
Market Impact: Adds 6 to 9 months

State Royalty Audit Frequency Increases Compliance Pressure

Several major oil-producing states have increased royalty audit frequency and scrutiny over the past few years, pushing operators to adopt software capable of generating audit trails that satisfy state auditor documentation standards without manual reconstruction taking weeks. Operators that fail audits face financial penalties and reputational costs with mineral rights owners that can affect future lease negotiations directly. Audit-ready reporting has become a genuine competitive differentiator among vendors, with several now marketing measurable audit-pass rate improvements as a core selling point in competitive procurement processes against rival platforms in competitive bid situations.
Market Impact: Leaves 15% of operators unaddressed

Market Restraints and Challenges

Legacy System Migration Complexity Delays Software Switches

Operators running decades of historical volumetric and revenue distribution data in legacy systems face genuine risk of data loss or reconciliation errors during migration to new platforms, a risk that makes many delay switching even when the legacy system is clearly outdated. The root cause is that historical data formats vary widely across older systems, some predating current industry data standards, making automated migration tools unreliable without extensive manual validation. The commercial impact shows up as migration projects routinely running six to nine months longer than vendors initially quote. Some vendors now offer dedicated migration teams to shorten that gap.
Market Impact: Adds 58% cloud adoption penetration

Small Independent Operators Resist Software Budget Increases

Small independent operators running fewer wells often view dedicated accounting software as an unnecessary expense when spreadsheet-based processes, however error-prone, still technically function for their smaller operational scale. The underlying cause is that per-well software licensing costs represent a proportionally larger burden for small operators than for majors spreading the same cost across thousands of wells. The commercial impact is a persistent addressable market gap among the smallest operators that vendors have struggled to profitably serve. Several vendors are now piloting simplified, lower-cost tiered pricing plans specifically targeting this underserved smaller-operator segment.
Market Impact: Covers 2026 methane reporting mandate
3 additional market trends, 2 additional growth drivers, and 4 additional restraints and challenges are covered in the full report. Contact sales@marketmindsadvisory.com to access the complete intelligence.

Segment CAGR and Growth Architecture

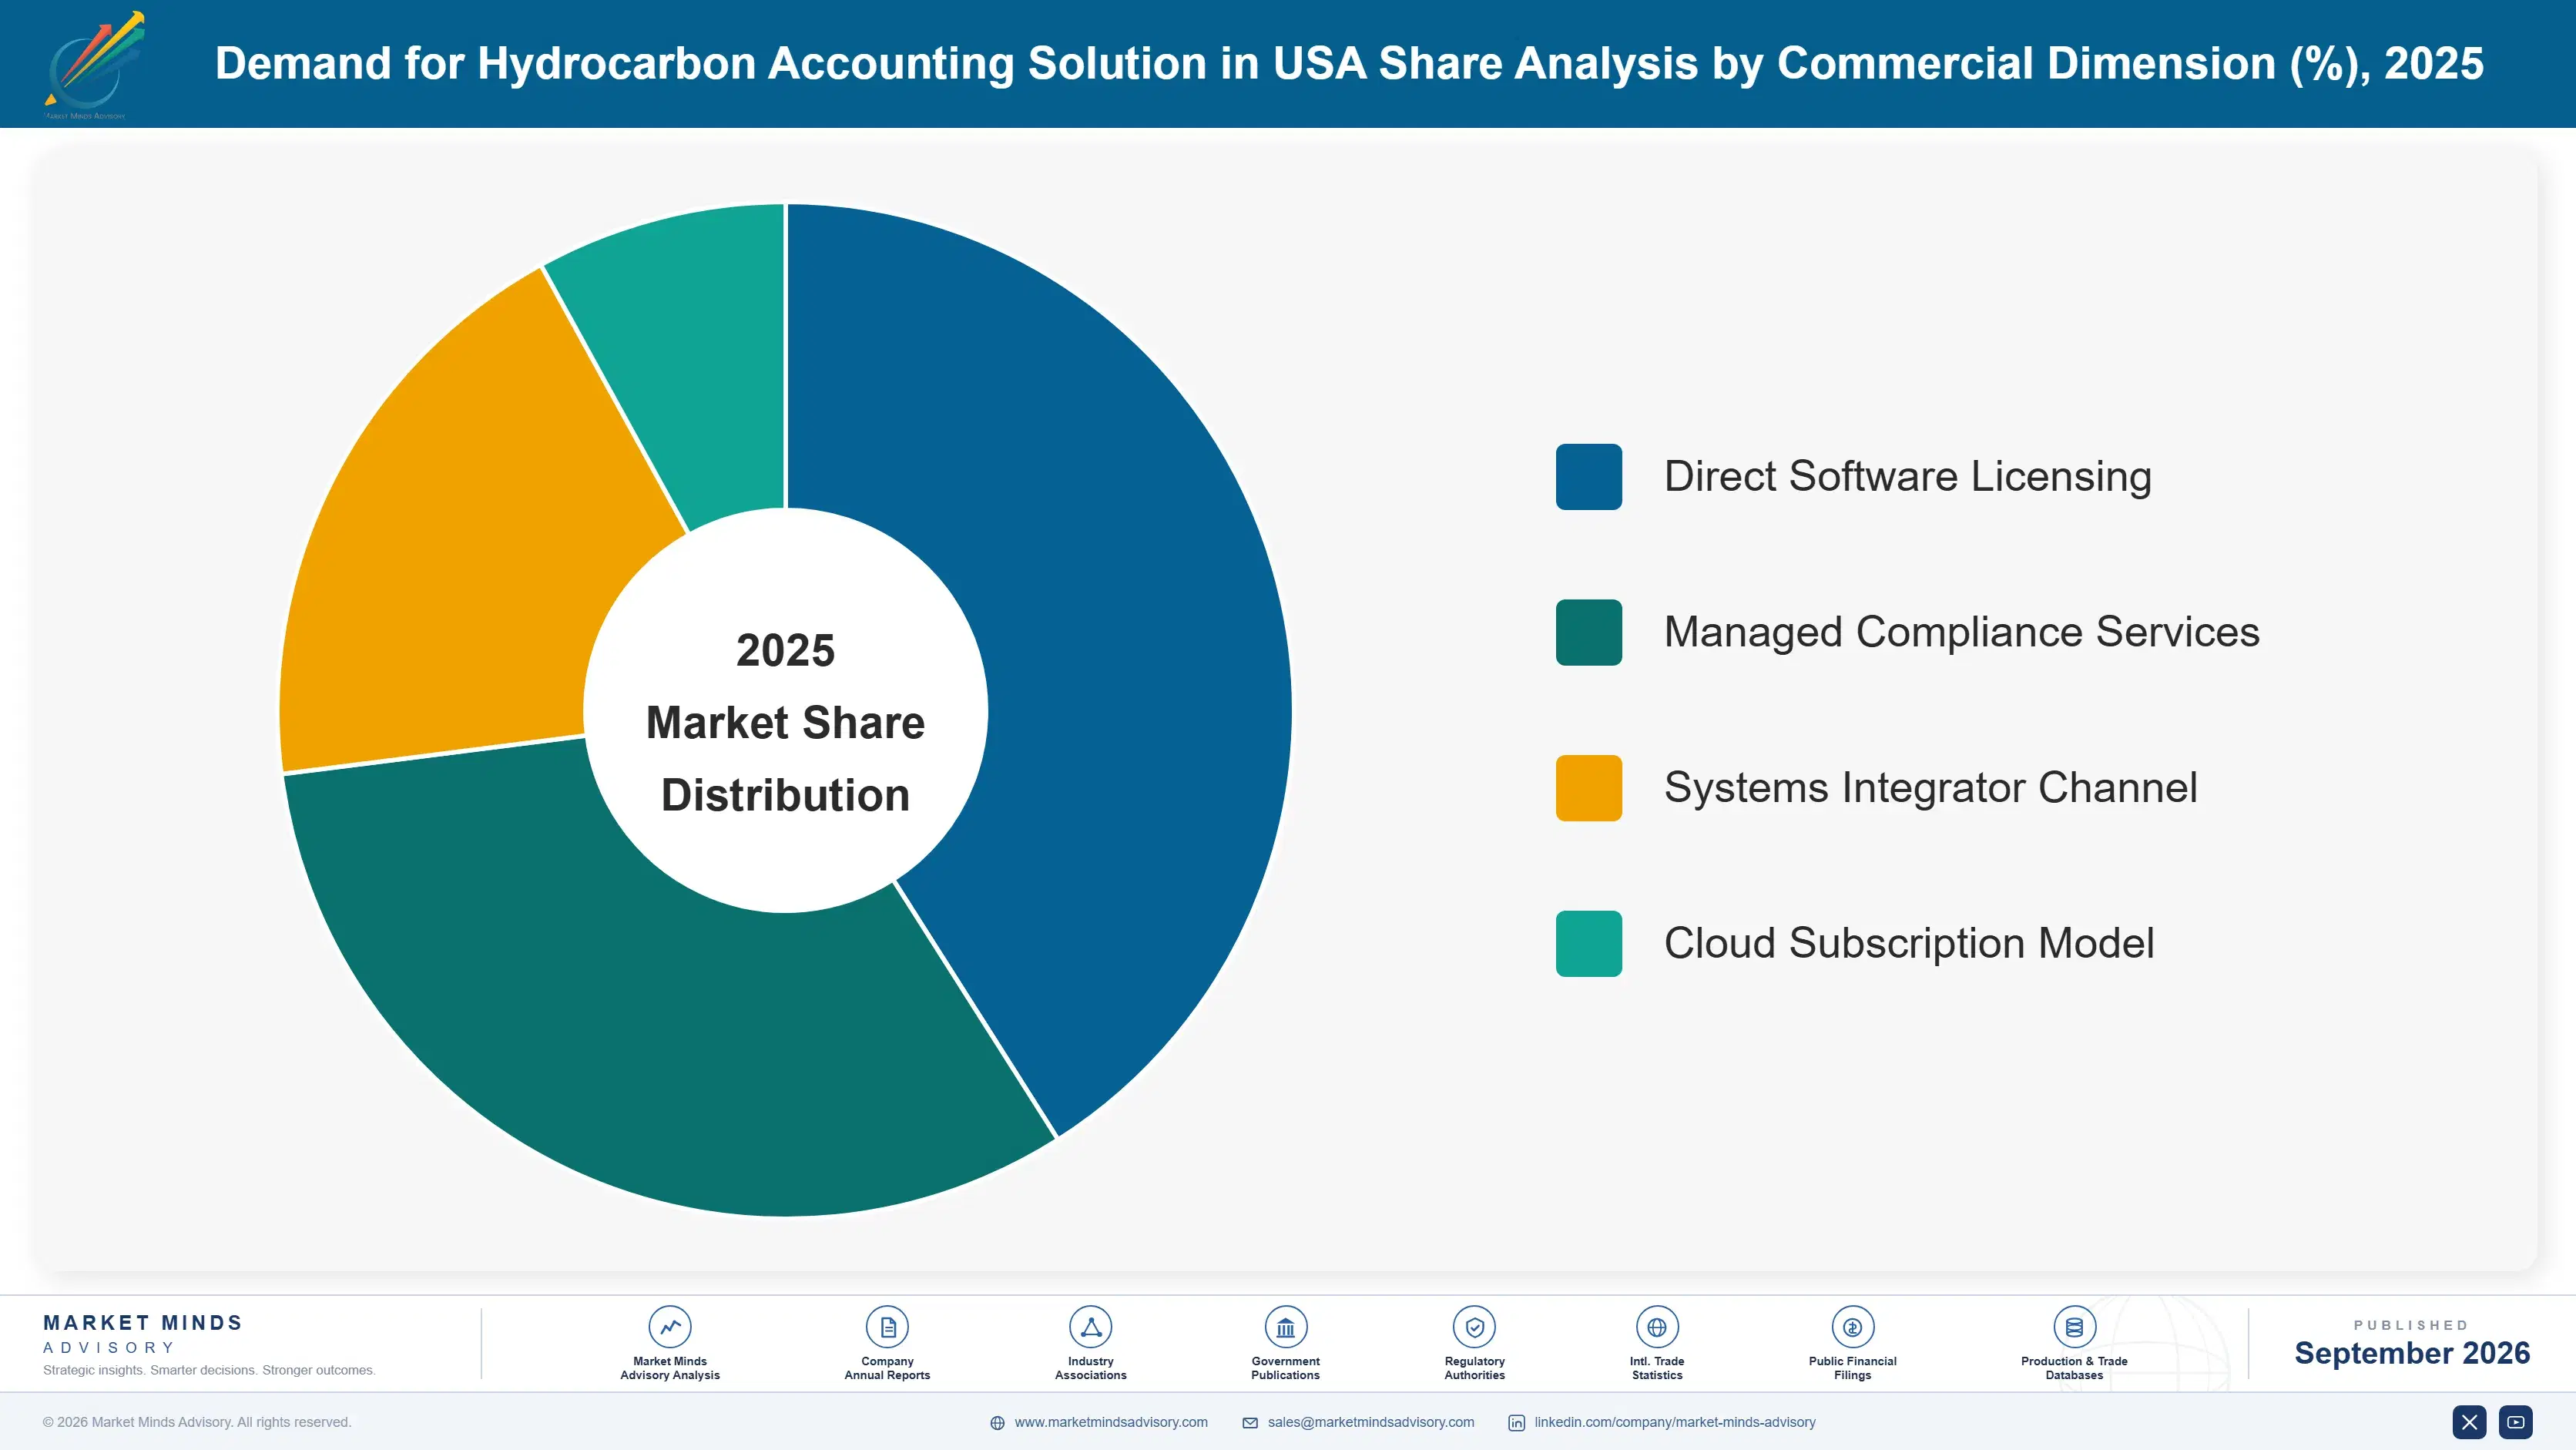
Hydrocarbon accounting software segments by functional module across six categories spanning production and volumetric accounting, revenue distribution, joint interest billing, land and lease management integration, midstream allocation and measurement, and regulatory reporting and compliance, each addressing a distinct workflow within upstream and midstream operations nationwide, spanning the full path from wellhead through final revenue distribution and payment.
united-states-hydrocarbon-accounting-solution-mark-market-share-analysis-1788419030019

Regulatory Reporting and Compliance

Regulatory reporting and compliance software generates audit-ready output mapped directly to state royalty audit formats and federal methane emissions disclosure templates, eliminating the manual spreadsheet compilation that previously consumed weeks of analyst time per reporting cycle across most operating basins. Demand is accelerating fastest here as newly finalized federal methane rules create a hard compliance deadline that operators cannot delay past without facing real financial exposure and reputational risk with regulators and mineral rights owners alike. Vendors who built compliance mapping into their core product architecture early, rather than bolting it on later, are winning the largest share of new contracts and renewal negotiations across the operator base nationwide this cycle.
CAGR 14.5%

Midstream Allocation and Measurement

Midstream allocation and measurement software reconciles volumes moving through gathering systems, processing plants, and pipeline interconnects, a function growing quickly as new midstream infrastructure comes online across the Permian and Appalachian basins specifically over the past several years of sustained capital investment. Accurate allocation directly determines revenue split among interconnected parties, making measurement accuracy a genuine commercial priority rather than a purely technical concern for midstream operators managing shared infrastructure across multiple counterparties and jurisdictions. Growth here trails regulatory reporting slightly but benefits from steady multi-year infrastructure investment cycles that sustain order volume even during periods of lower overall drilling activity across the broader industry, a resilience premium buyers increasingly value.
CAGR 13.0%
Full segment breakdown across 6 segments available in the complete report.

Regional Architecture and Country Demand Map

Demand concentrates in North America given the market's US shale operator base, though vendors serving multinational integrated producers and midstream operators generate meaningful revenue across every region tracked in this report, particularly wherever new offshore or shale production growth is expanding fastest across the globe today.

North America

North America holds the largest share by a wide margin, reflecting the US shale operator base this report is named for, plus the concentration of vendor headquarters including Quorum Software, Enverus, and W Energy Software all operating primarily domestic sales and support organizations. Permian and Appalachian basin drilling activity keeps generating new wells that require volumetric accounting setup from day one. Canadian oil sands operators add incremental demand for similar accounting and allocation software, particularly around royalty reporting to provincial regulators. Federal methane disclosure rules finalized recently are accelerating software upgrade cycles across nearly every active US operator regardless of company size. Well counts approaching two million wells keep software seat counts growing steadily.
Share: 32% | CAGR: 11.5% (2026 to 2036)

East Asia

China's expanding domestic shale gas production and Japan's LNG import terminal operators are driving accounting and allocation software adoption across East Asia, though the region's vendor base remains less mature than North America's specialized base of independent software providers. Local system integrators increasingly partner with global vendors to localize regulatory reporting templates for Chinese and Japanese accounting standards specifically. South Korea's refining sector adds incremental demand for allocation software tied to crude import measurement and reconciliation. Growth here tracks close to North America's pace, reflecting genuinely comparable underlying production growth momentum. Vendor localization investment continues expanding as global providers see genuine long-term opportunity in the region's growing production base. Domestic vendors are also emerging.
Share: 22% | CAGR: 11.5% (2026 to 2036)
Regional intelligence for 5 additional markets available in the complete report: Western Europe, South Asia and Pacific, Latin America, Middle East and Africa, Eastern Europe. Contact sales@marketmindsadvisory.com.
united-states-hydrocarbon-accounting-solution-mark-country-cagr-analysis-1788419030534

Where Accounting Vendors Capture Margin

Vendors expand margin by moving beyond core volumetric accounting toward compliance-mapped regulatory reporting, multi-year platform agreements, and cross-sell into adjacent measurement and land management modules, each capturing budget that a narrow single-module offering otherwise leaves on the table for competitors to claim instead across the same account relationship over the entire contract's full lifetime.

Bundle Regulatory Reporting Into Core Platform

Vendors embedding compliance-mapped regulatory reporting directly into the core accounting platform, rather than selling it as a separate add-on module, capture roughly 25 percent higher average contract value than vendors selling accounting and compliance separately. Operators increasingly refuse to manage two vendor relationships for what they view as a single connected workflow spanning production data through regulatory submission. Building this integration requires deep familiarity with evolving state and federal reporting formats, a moving target that smaller vendors struggle to track without dedicated regulatory affairs staff monitoring every rule change. That refusal has become a genuine competitive differentiator.
Market Impact: Adds a 25% premium in average contract value

Offer Multi-Year Enterprise Software Licensing Contracts

Locking operators into three to five year enterprise licensing agreements, rather than annual renewals, gives vendors predictable recurring revenue while commanding a premium of 6 to 10 percent over comparable annual contract pricing. Operators accept the premium in exchange for locked pricing protection against future increases and guaranteed feature roadmap commitments from the vendor. This lever works best for vendors already holding strong renewal rates, since new entrants lack the trust record customers need before committing multiple years of budget to an unproven platform relationship they cannot easily walk away from.
Market Impact: Commands a 6 to 10% multi-year pricing premium

Cross-Sell Midstream Allocation Software Modules Broadly

Vendors that successfully cross-sell midstream allocation and measurement modules into their existing upstream accounting customer base capture incremental revenue at a fraction of the cost of winning a brand-new customer relationship from scratch. This cross-sell motion works particularly well for operators with integrated upstream and midstream operations who prefer a single vendor relationship spanning both sides of the business. Roughly 30 percent of upstream accounting customers now also purchase at least one midstream module, up meaningfully from a much smaller base just a few years earlier industry-wide. Onboarding time for cross-sold modules also runs shorter given existing platform familiarity.
Market Impact: Reaches a 30% upstream customer attach rate now

Provide Managed Regulatory Compliance Monitoring Services

Vendors offering managed compliance monitoring services, where the vendor's own regulatory affairs team tracks rule changes and updates reporting templates proactively, command a service revenue premium of roughly 15 to 20 percent on top of standard software licensing fees. Smaller operators without dedicated compliance staff find this service particularly valuable, since it effectively outsources a specialized function they cannot justify hiring for internally. This lever requires vendors to build genuine regulatory expertise in-house, a capability that takes years to develop credibly and cannot simply be purchased or hired quickly. Few competitors can match that depth quickly.
Market Impact: Commands a 15 to 20% service fee premium

Who Controls the Margin Pool

Concentration sits at 48 percent among the top five vendors on a revenue basis, a moderate level reflecting a market split between specialized energy software firms and diversified enterprise giants offering configured modules. Quorum Software and Enverus lead the specialist segment, with a meaningful gap separating them from smaller independent challengers still building out feature parity across most core accounting workflows.
Current competitive activity centers on regulatory reporting capability, as vendors race to embed compliance mapping into core platforms ahead of upcoming methane disclosure deadlines that carry real financial consequences for delay. Several vendors are also expanding into midstream allocation software through acquisition, betting that operators managing both upstream and midstream operations will pay a premium for single-vendor coverage across the entire accounting workflow.

Emerging pressure comes from diversified enterprise software giants configuring existing ERP modules for hydrocarbon-specific accounting, a genuinely different competitive threat than specialist vendors have faced before in this category. Rankings are most likely to shift around the regulatory reporting segment specifically, where compliance mapping speed, not general accounting feature depth, increasingly determines which vendor wins new contracts and renewal negotiations across the operator base.
united-states-hydrocarbon-accounting-solution-mark-company-positioning-matrix-1788419031059

Competitive Moat and Risk Dimensions

QUORUM SOFTWARE

Moat: Broadest Module Coverage

Quorum's platform spans production accounting, revenue distribution, land management, and joint interest billing under one integrated system, letting it win large operators seeking to consolidate multiple point solutions into a single vendor relationship. Years of acquisitions have built out this breadth in ways smaller specialists cannot match quickly without significant capital.
QUORUM SOFTWARE

Risk: Integration Complexity From Acquisitions

Years of acquiring smaller point-solution vendors have left Quorum managing a technically complex portfolio of partially integrated legacy codebases, slowing the pace at which new regulatory reporting features roll out consistently across every acquired product line. Customers on older acquired platforms sometimes wait longer for compliance updates than newer platform customers.
ENVERUS

Moat: Deep Energy Data Integration

Enverus combines accounting software with its broader energy data and analytics business, giving customers access to production benchmarking and market intelligence alongside core accounting functionality that pure-play accounting vendors cannot offer natively. This bundled data advantage increasingly wins deals against accounting-only competitors lacking comparable analytics depth.
ENVERUS

Risk: Premium Pricing Limits Reach

Enverus commands premium pricing for its bundled data and accounting offering, which limits its addressable market among smaller independent operators more sensitive to total software spend than to analytics depth. Competitors offering accounting-only modules at lower price points continue winning this more price-sensitive segment of the market.

Players Tracked

Prominent Players

Quorum Software
Enverus
SAP
Oracle
W Energy Software

Other Key Players

Aucerna
Merrick Systems
PakEnergy
Peloton Computer Enterprises
Cimarron Software
Katalyst Data Management
Cygnet Energy Data Management
Workiva
IBM
OpenText
Infor
Epicor
Deltek
Emerson Automation Solutions
Honeywell Connected Enterprise

Recent Developments

FEBRUARY 2025

Quorum Software Acquires Midstream Measurement Specialist

Quorum Software acquired a privately held midstream allocation and measurement software firm to extend its platform coverage into gathering and processing operations, adding an existing customer base of roughly sixty midstream operators to its combined product portfolio immediately following the transaction's close in early 2025.
Signal: Signals accounting platform vendors are now actively buying into midstream measurement to offer unified workflow coverage.
AUGUST 2025

Enverus Launches Automated Methane Reporting Module

Enverus launched a dedicated methane emissions reporting module built directly into its core accounting platform, mapping output automatically to federal disclosure templates ahead of the finalized compliance deadline facing operators across every major producing basin nationwide this upcoming reporting cycle and beyond. Analysts expect competitors to follow with similar modules.
Signal: Confirms regulatory reporting automation has become a required core platform feature rather than an optional add-on.
DECEMBER 2025

W Energy Software Signs Enterprise Agreement With Independent Operator Group

W Energy Software signed a multi-year enterprise licensing agreement with a consortium of independent Permian basin operators, standardizing accounting and reporting workflows across previously fragmented individual company systems under one shared platform configuration and vendor support arrangement going forward into next year. Terms were not fully disclosed publicly.
Signal: Indicates smaller independent operators are increasingly pooling their purchasing power together to access enterprise-grade contract terms.

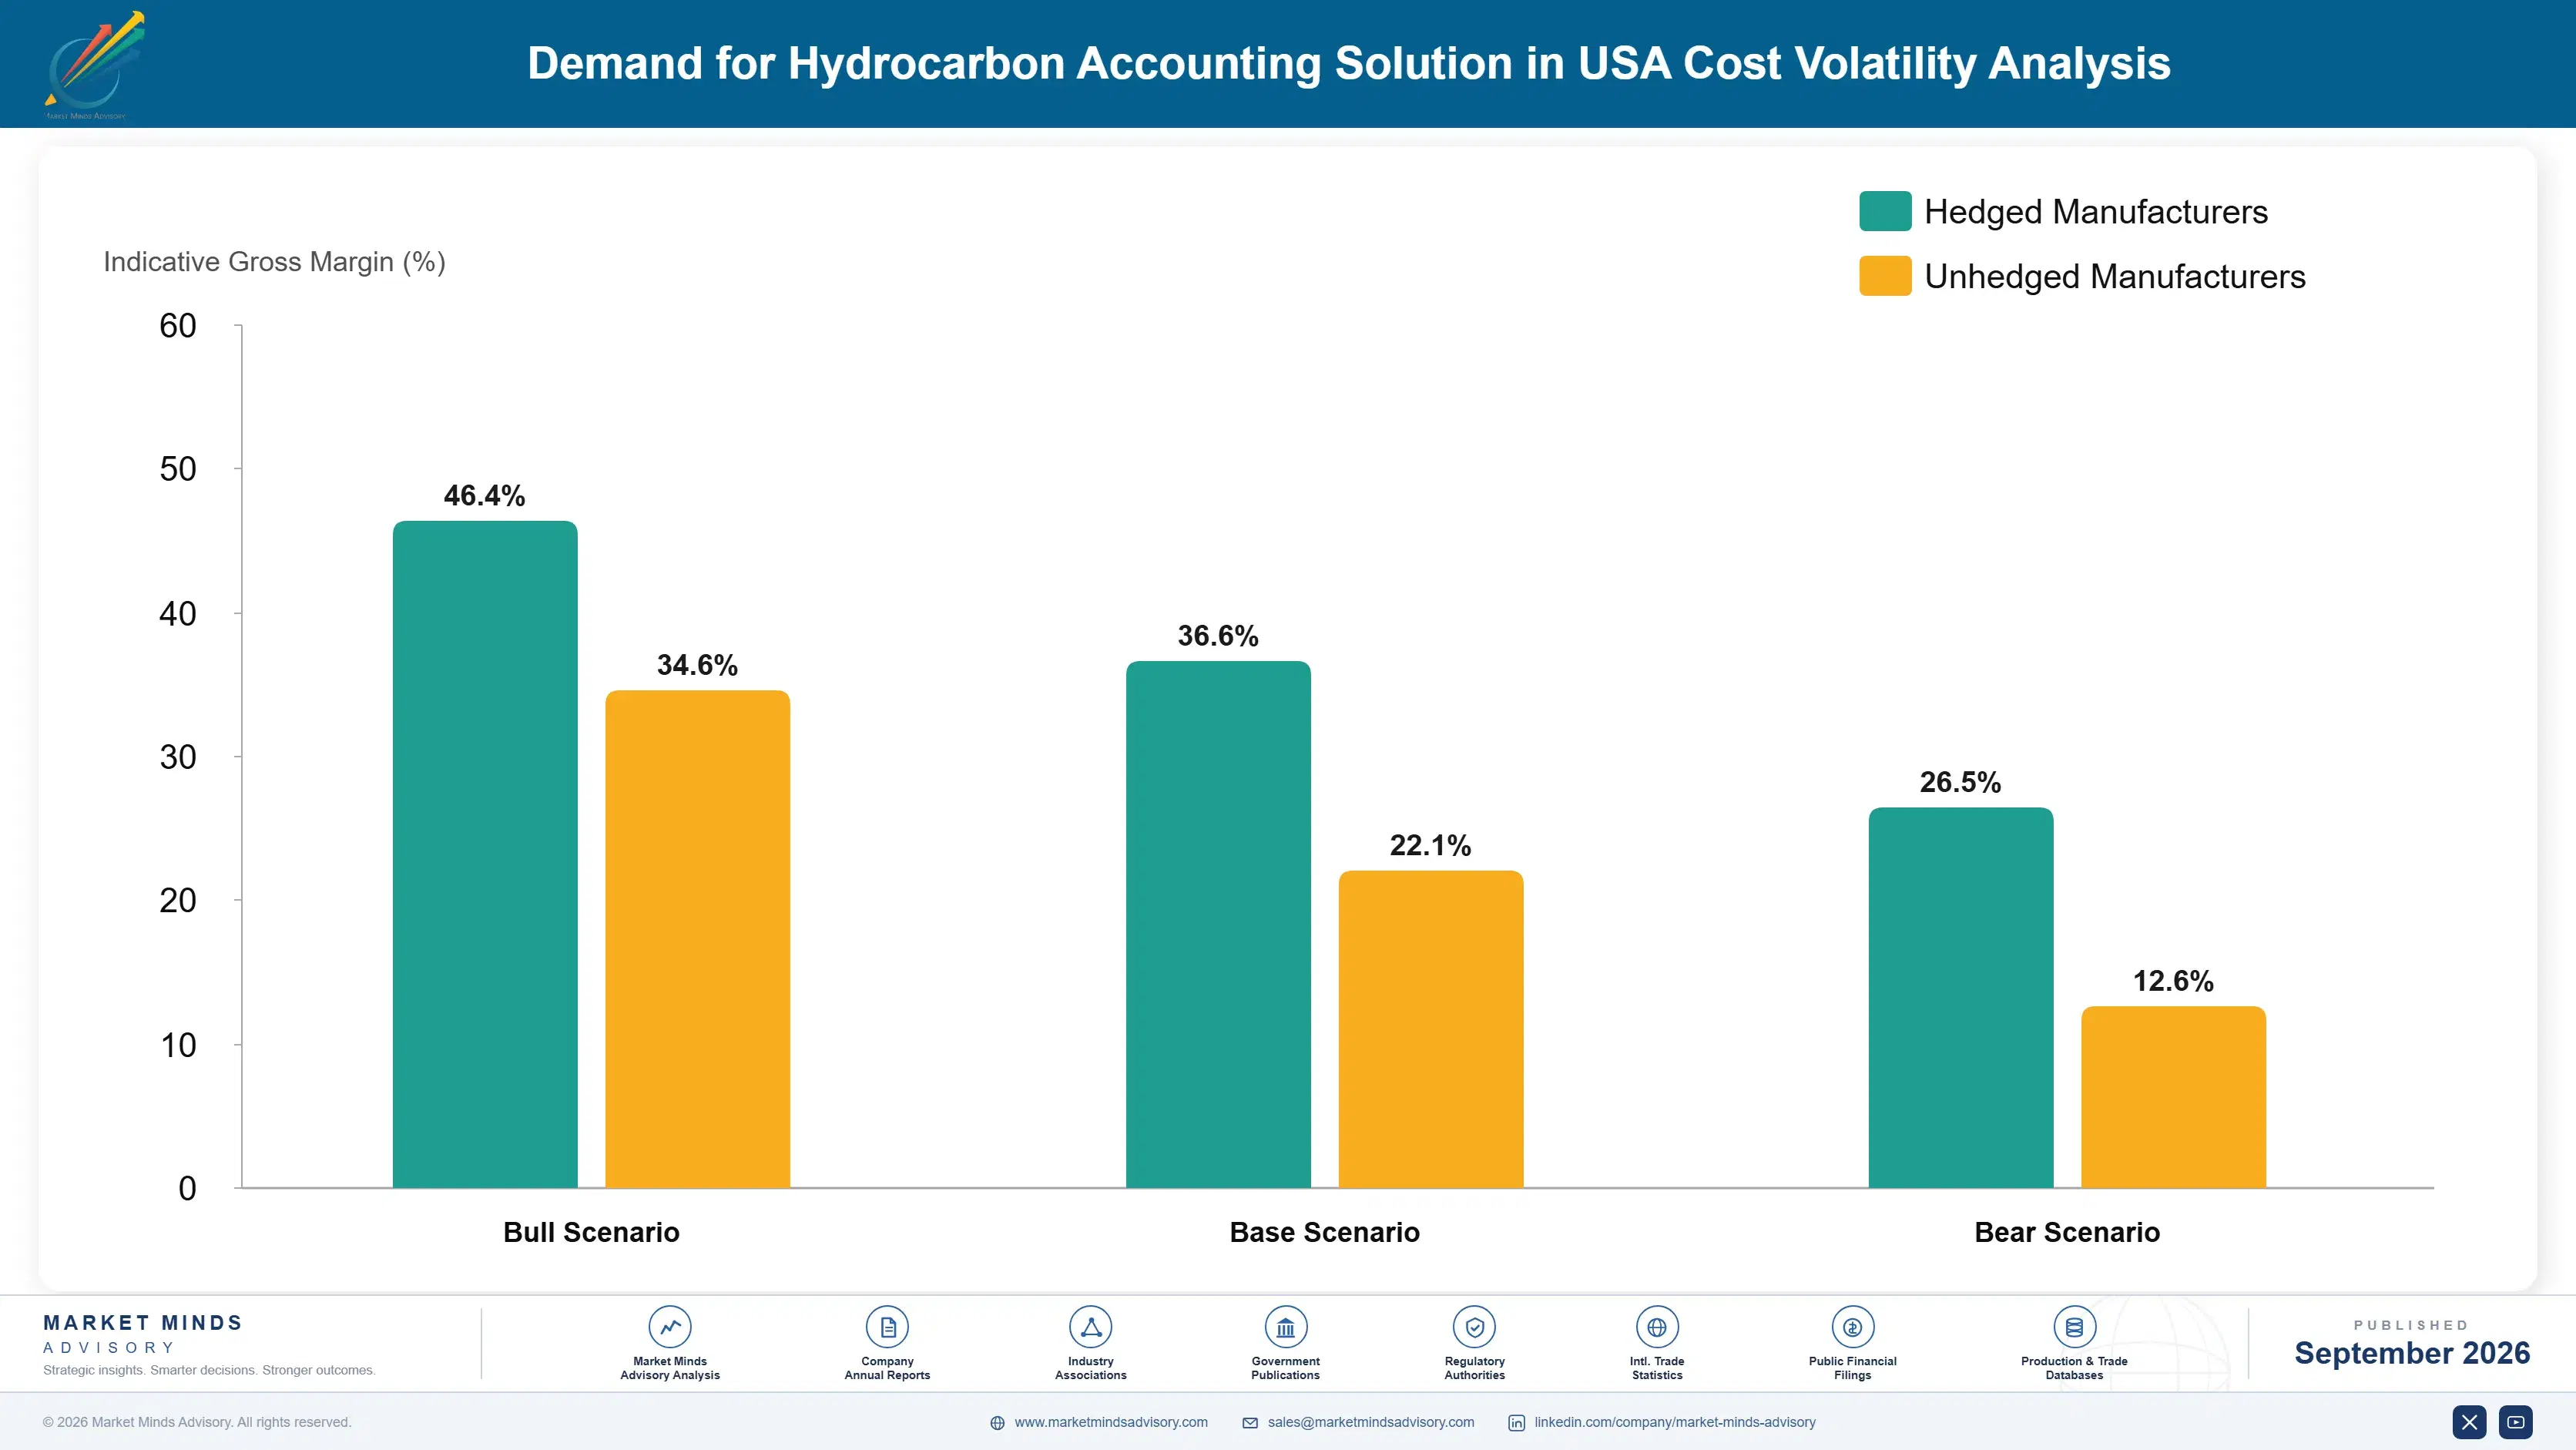
Cloud Infrastructure and Development Talent Costs

Cloud hosting and compute infrastructure account for roughly 22 percent of total cost of goods sold for software vendors in this category, sourced primarily from the major hyperscale cloud providers rather than proprietary data centers most vendors abandoned years ago. Specialized software development talent familiar with both accounting and oil and gas field operations represents the largest remaining cost input by far.
A 2024 cloud pricing adjustment by a major hyperscale provider, disclosed in that company's own annual report, pushed hosting costs up meaningfully for software vendors running large multi-tenant deployments across dozens of operator accounts simultaneously, forcing several smaller vendors to renegotiate customer pricing or absorb the increase into already thin operating margins for at least two full quarters before pricing eventually stabilized again across the broader industry.

Smaller vendors without long-term enterprise cloud agreements face the sharpest cost exposure, since they typically pay closer to list pricing while the largest vendors negotiate multi-year committed-use discounts unavailable to competitors with lower committed spend volumes. This dynamic increasingly separates vendors by scale, since larger platforms can absorb pricing volatility that would meaningfully compress a smaller competitor's already thin operating margins.
united-states-hydrocarbon-accounting-solution-mark-cost-volatility-analysis-1788419031255

Negotiate Multi-Year Committed-Use Cloud Discounts

Vendors increasingly lock in three to five year committed-use agreements with hyperscale cloud providers to secure discounted per-unit compute pricing well below standard list rates, trading some flexibility for meaningfully lower and more predictable hosting costs over the full contract term negotiated upfront. Vendors report meaningful savings from this approach within the first contract year alone.

Build Internal Domain-Specific Training Programs

Vendors are building internal training programs that convert general software engineers into oil and gas accounting domain specialists, reducing dependence on a scarce external talent pool commanding premium compensation and shortening the typical multi-month specialized hiring cycle considerably across most engineering teams. Several vendors now partner directly with universities offering energy-focused technology degree programs.

Adopt Multi-Cloud Architecture for Pricing Leverage

Some larger vendors are architecting platforms to run across multiple cloud providers simultaneously, using the resulting competitive position to negotiate better pricing terms from each provider rather than depending entirely on a single hyperscale vendor relationship for all production hosting needs. This approach adds engineering complexity that only larger, well-resourced vendors can justify maintaining.

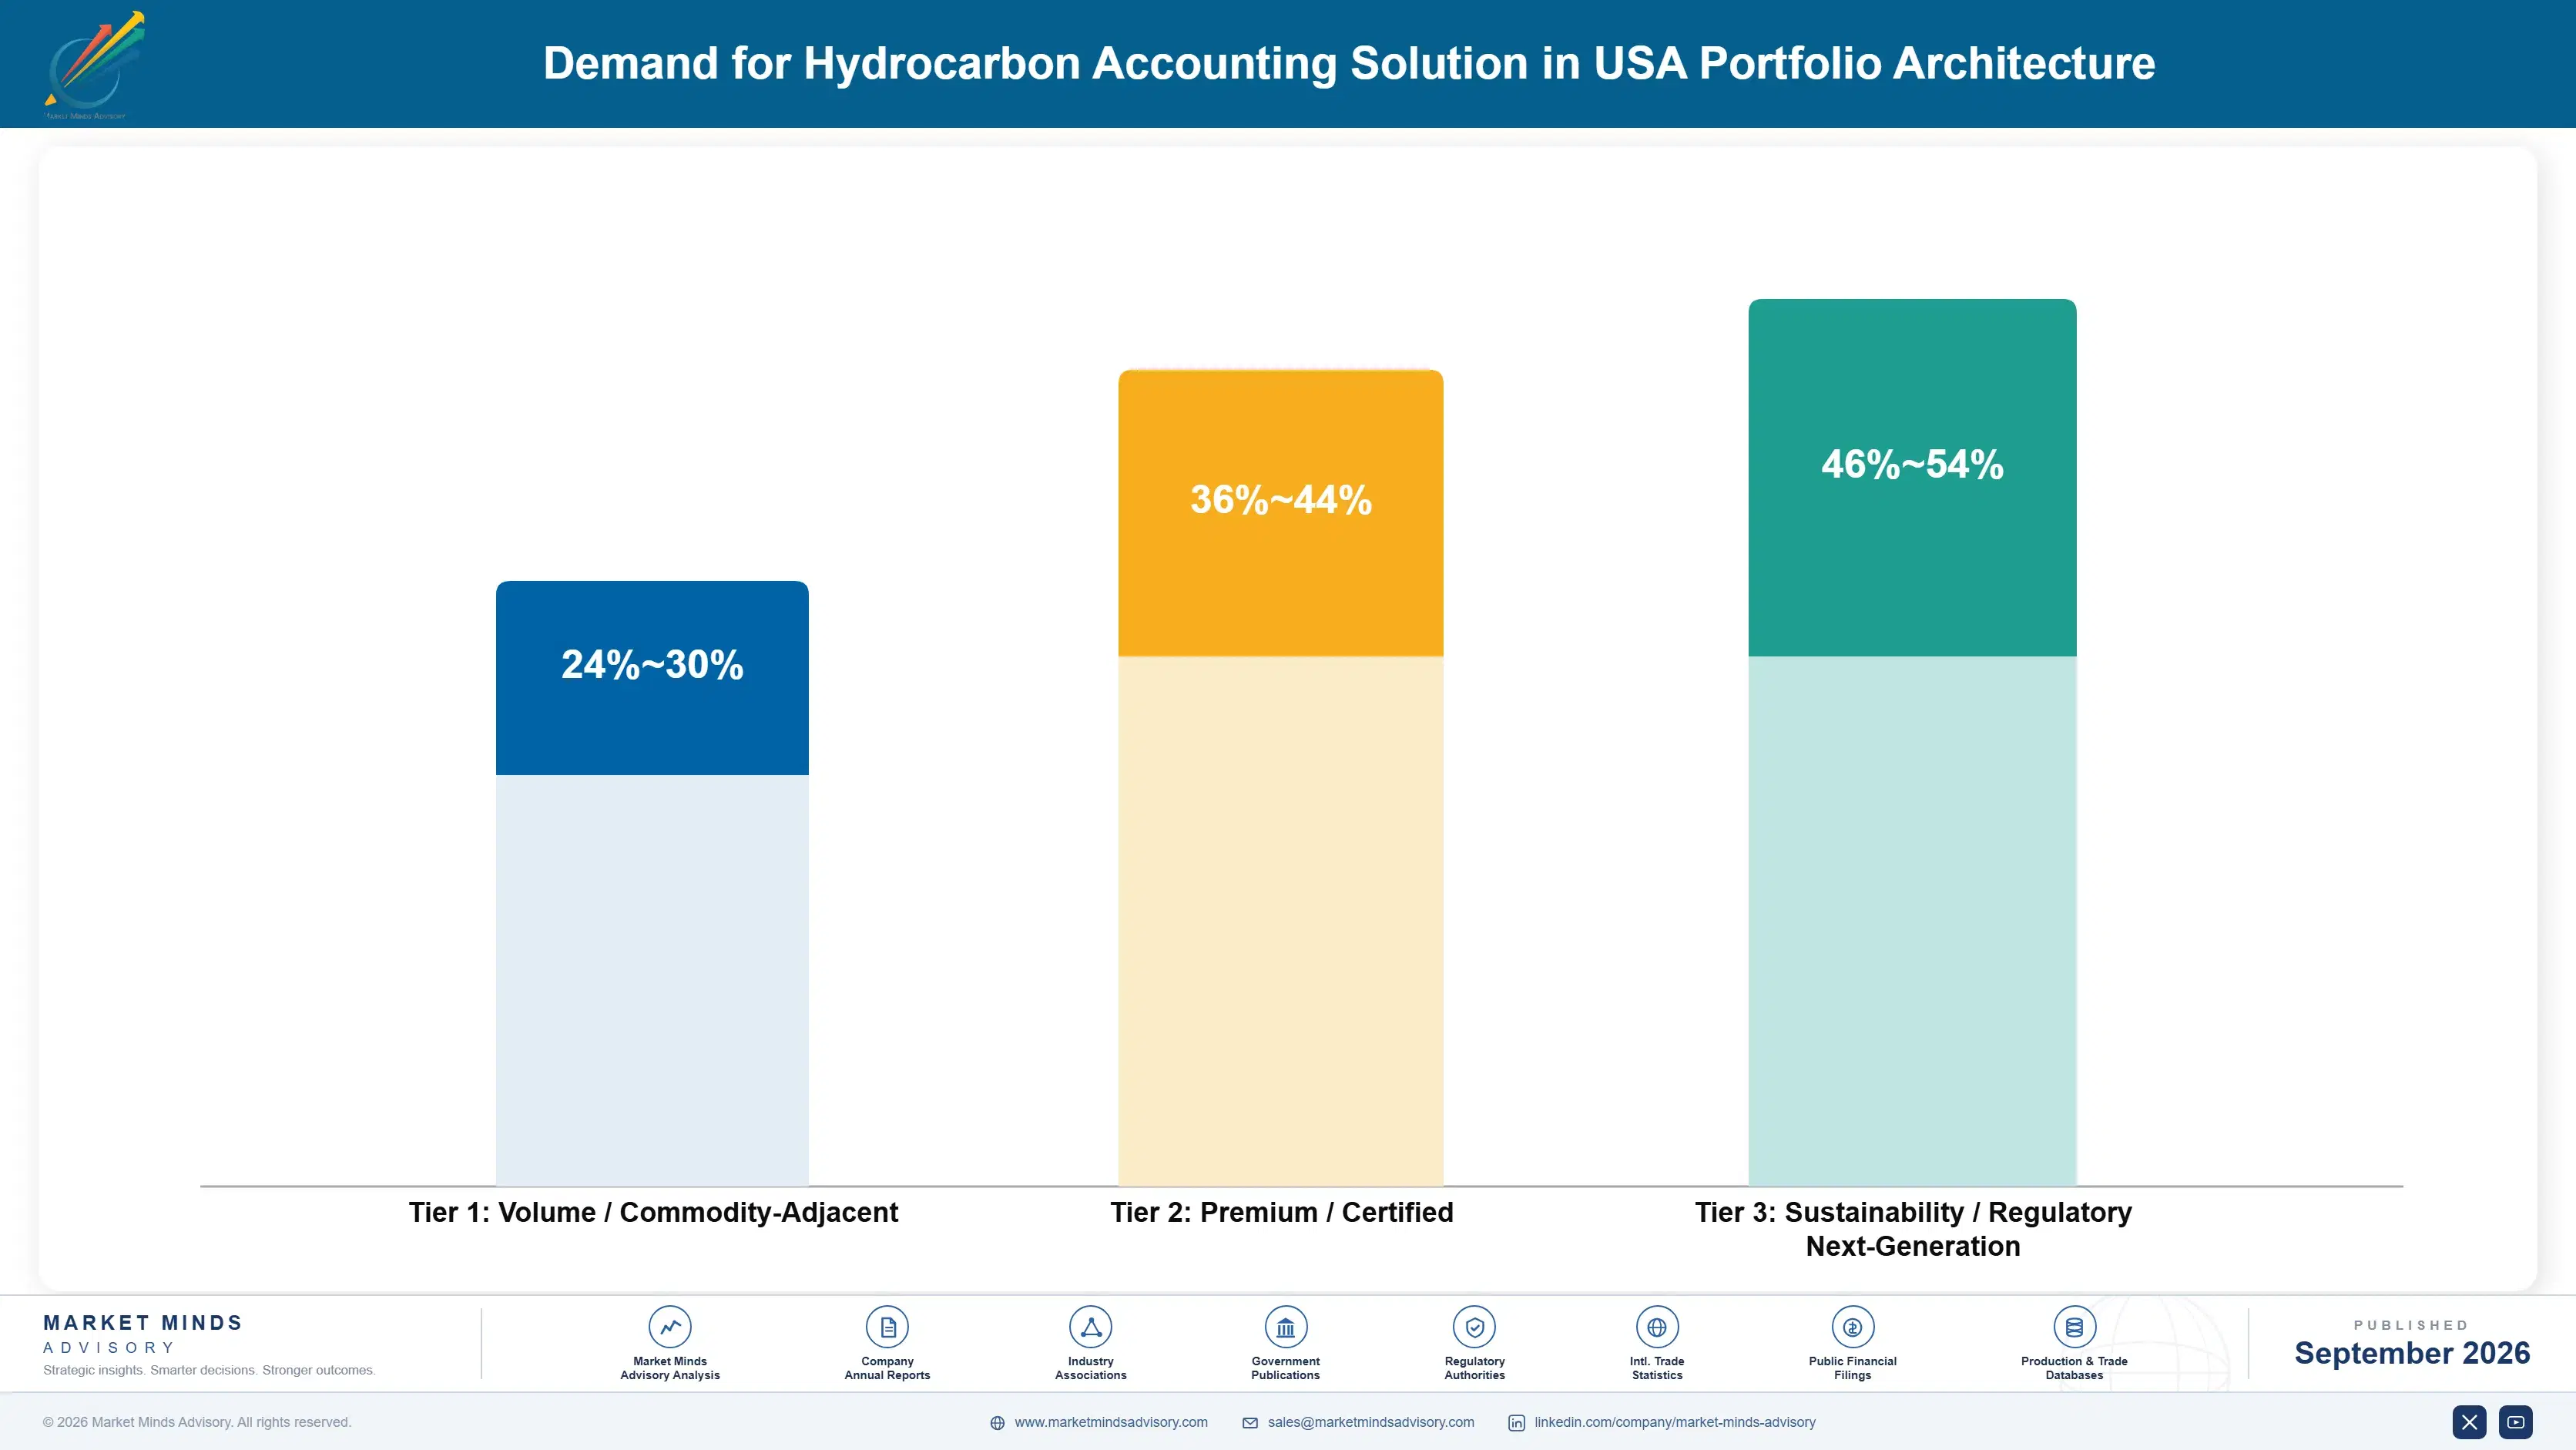
Portfolio Architecture for Margin Defence

Software economics split along a core-versus-compliance axis, with basic volumetric accounting modules competing largely on price and implementation speed while regulatory reporting and compliance modules command materially higher margins tied to specialized domain expertise. Gross margins across the category span a wide range depending almost entirely on which module mix a given vendor's product concentrates in. Vendors that shift product mix toward the higher tiers over time consistently outperform peers competing mainly on speed and price.
Volume tier vendors compete on implementation efficiency and broad basic feature coverage, accepting thinner margins in exchange for larger addressable customer counts among smaller independent operators. Premium tier vendors instead compete on regulatory depth, since customers paying for compliance-mapped reporting are far less price-sensitive than buyers of standard volumetric accounting modules alone. That price insensitivity sustains the premium tier's wider margins even as volume-tier pricing compresses further.

High-value margin pools concentrate overwhelmingly in the regulatory and compliance tier, where vendors combining accounting depth with genuine regulatory affairs expertise capture premiums unavailable anywhere else in the category. This concentration is pulling vendor investment away from pure volume-tier feature expansion and toward compliance capability, a shift likely to reshape competitive rankings over the next several years.

Volume / Commodity-Adjacent

Basic volumetric accounting modules for smaller independent operators, competing primarily on price and fast implementation rather than deep feature differentiation, with margins compressed by intense vendor competition for this segment.
Gross Margin: 24-30%

Premium / Certified

Regulatory reporting and compliance-mapped modules serving operators facing active state audits and federal methane disclosure requirements needing audit-ready output, a combination only a handful of vendors currently offer well. That combination remains scarce.
Gross Margin: 36-44%

Sustainability / Regulatory / Next-Generation

Managed compliance monitoring services and proprietary emissions-linked reporting capability commanding the category's highest margins through genuine regulatory affairs expertise that competitors cannot easily replicate without years of dedicated investment. Few vendors compete here.
Gross Margin: 46-54%
united-states-hydrocarbon-accounting-solution-mark-portfolio-architecture-1788419031756

High-value Sub-segments and Strategic Watch-out

Regulatory Reporting and Compliance Software

Highest-value, fastest-growing category as methane disclosure mandates and state royalty audits push operators toward vendors offering compliance-mapped reporting output built directly into the core platform rather than sold as a separate add-on module. Buyers now expect this natively. Vendors slow to add this feature lose renewal negotiations.
Gross Margin: high

Midstream Allocation and Measurement Software

High-value category growing steadily as new gathering and processing infrastructure comes online, rewarding vendors with proven measurement accuracy and established multi-party allocation contract experience across complex interconnected ownership structures. Contract terms often span years. Multi-year infrastructure funding commitments are becoming increasingly common across the industry.
Gross Margin: high-moderate

Core Volumetric and Revenue Accounting

Volume core category sustained by ongoing well count growth and legacy system replacement cycles, generating steady but slower-growing order volume with thinner overall margins than the newer compliance-driven categories above it. Renewal activity still dominates here. Growth here remains steady but decidedly unspectacular by comparison.
Gross Margin: moderate

Spreadsheet-Based Manual Accounting Conversion

Strategic watch-out category as remaining spreadsheet-dependent smaller operators eventually convert to dedicated software, a one-time conversion wave that will taper once nearly all remaining holdouts fully transition to a purchased platform. Few holdouts remain by comparison. Vendors targeting this segment increasingly use simplified, lower-cost pricing tiers.
Gross Margin: watch

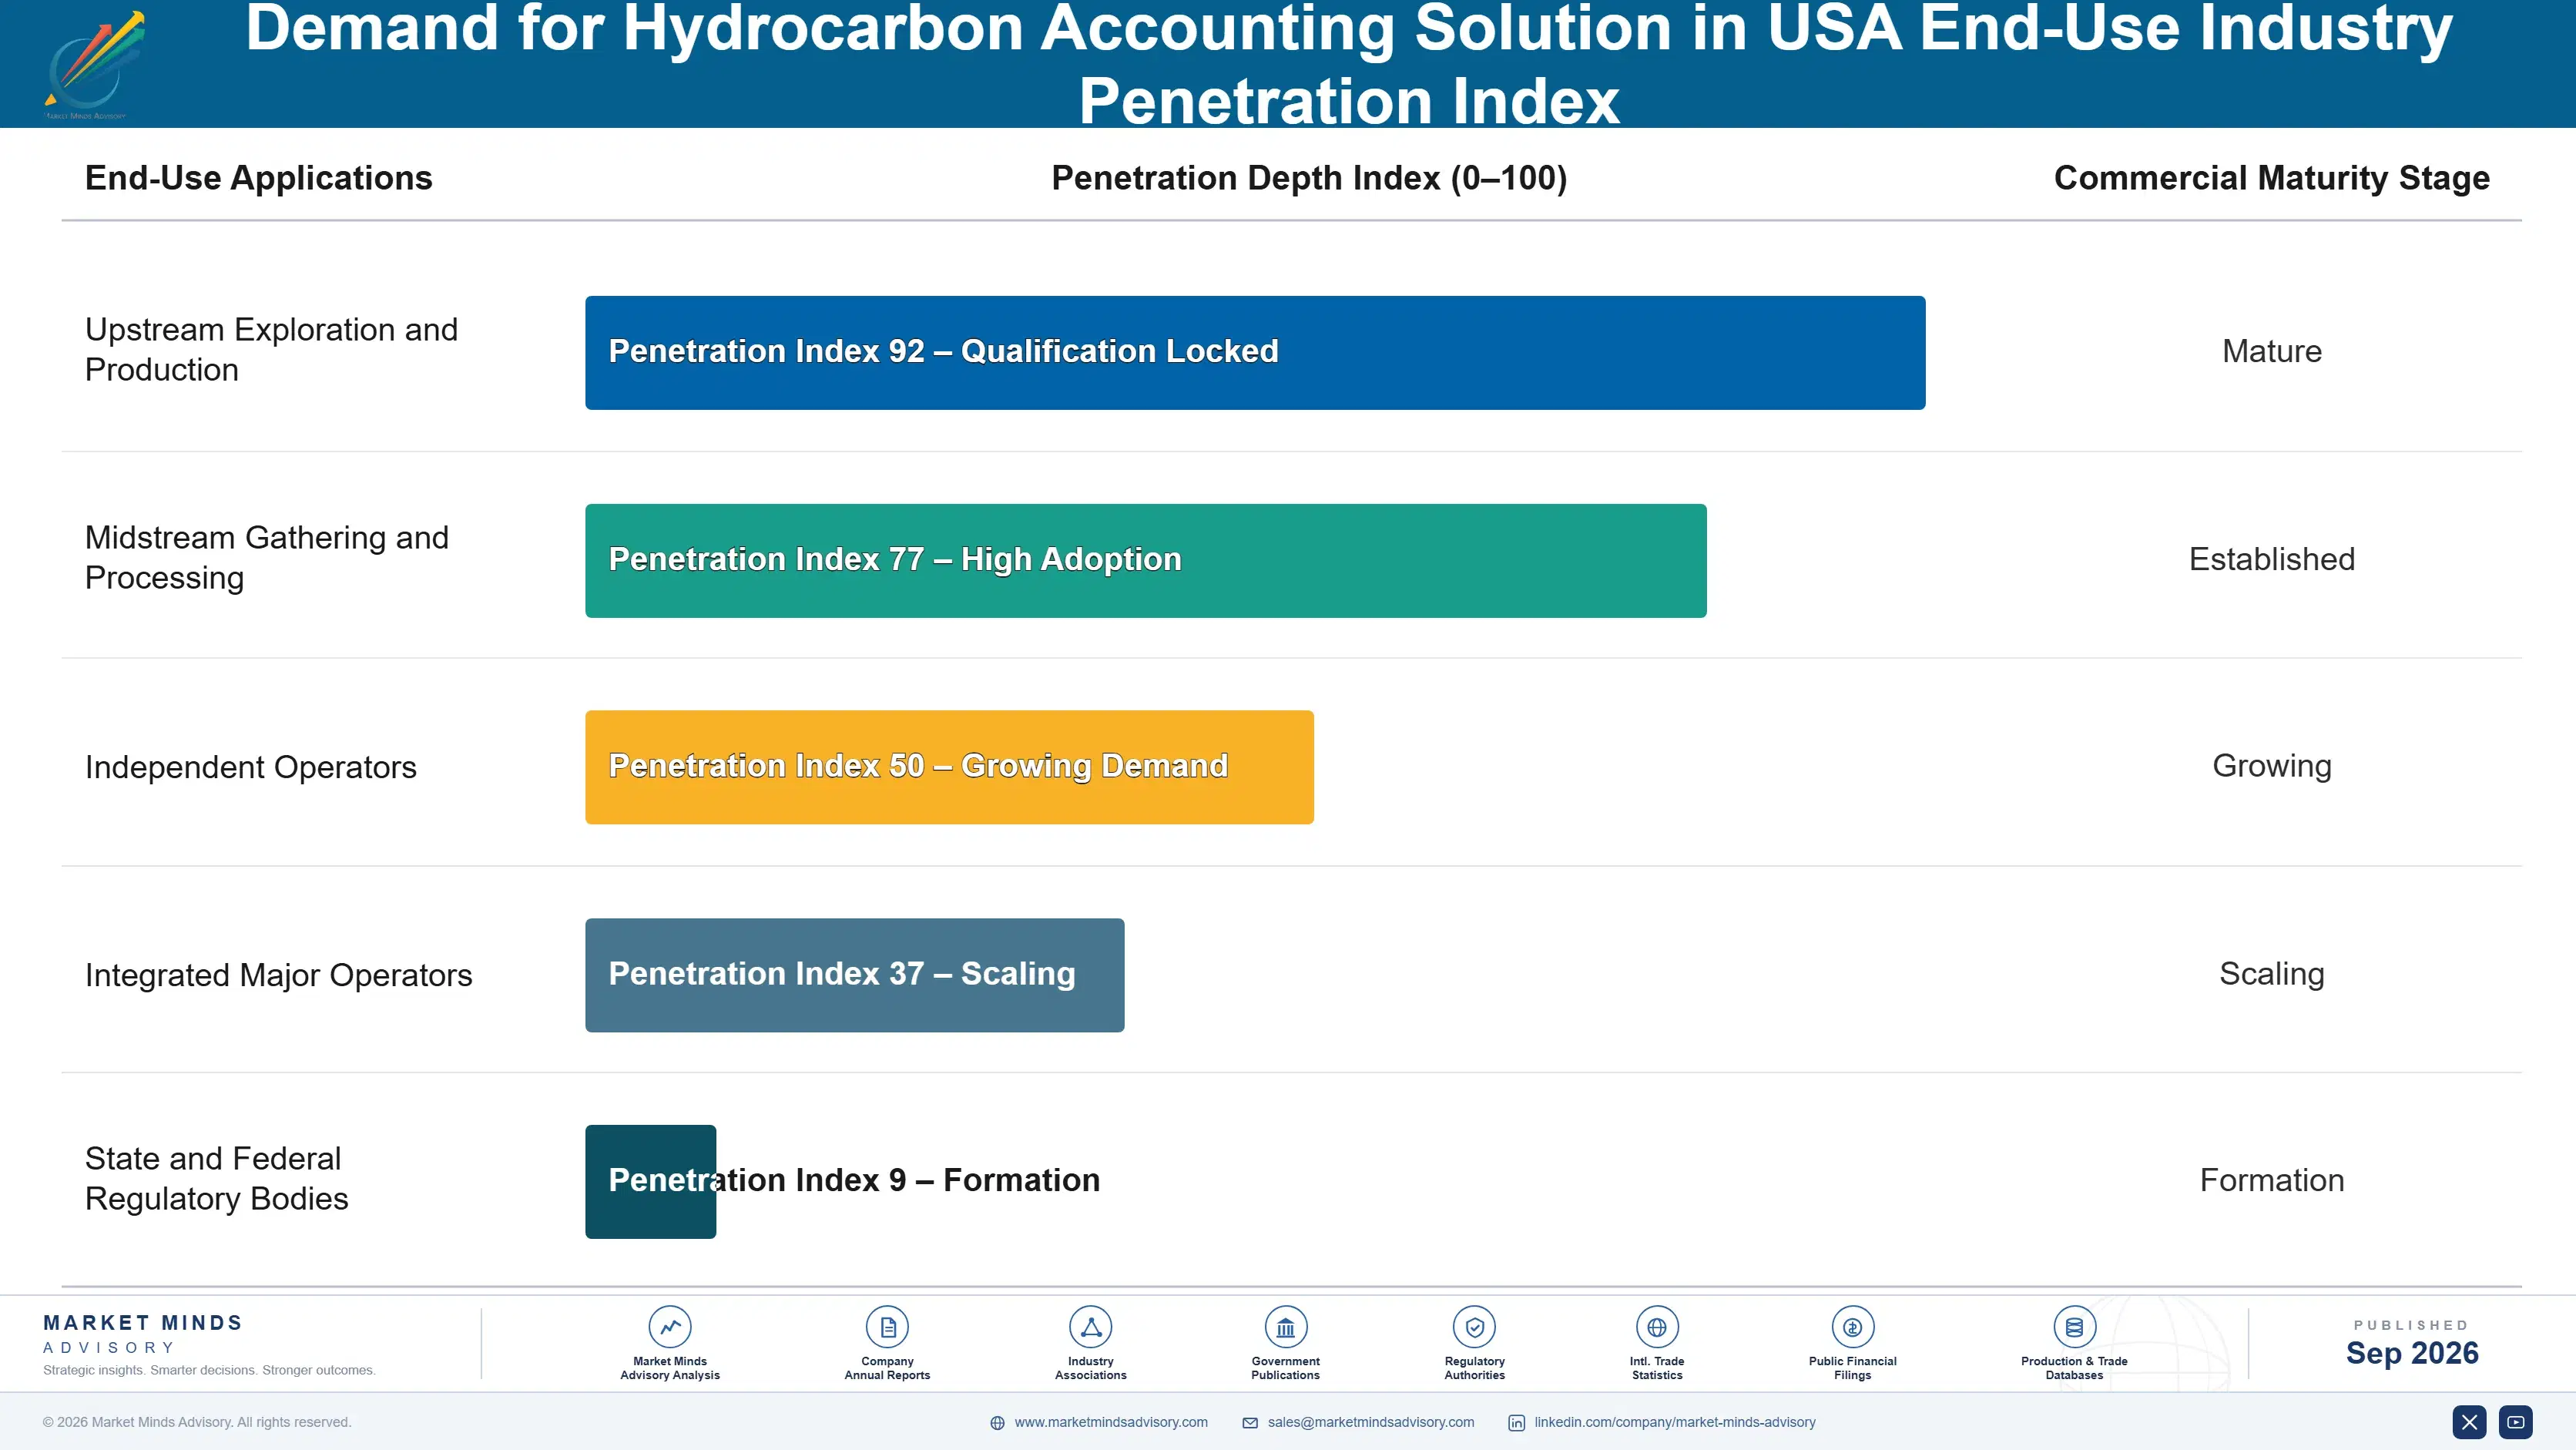
Compliance Creates Sticky Vendor Relationships

Once an operator configures its accounting platform for a specific regulatory reporting format and integrates it with field measurement systems, switching vendors requires re-validating that entire configuration against auditor expectations, a project most operators avoid unless the incumbent vendor genuinely fails to deliver. This creates annuity-like recurring revenue that persists across years of stable operator relationships and predictable, low-churn renewal cycles.
Adoption stickiness varies by end-use vertical: large integrated operators with dedicated IT staff show more willingness to switch vendors during platform modernization initiatives, while smaller independent operators with thin back-office teams show the deepest lock-in since they lack internal capacity to manage a disruptive migration project themselves. Midstream operators sit closer to the large-operator pattern, given their generally larger dedicated technical staff.

A generational shift in buyer profiles is underway as procurement decisions move from purely finance-focused accounting managers toward joint finance-and-compliance buying committees, reflecting how regulatory reporting has become a specification requirement rather than a downstream afterthought handled separately. Younger finance leaders increasingly expect vendors to demonstrate compliance capability upfront during initial evaluation rather than treating it as a later post-purchase feature request entirely.
united-states-hydrocarbon-accounting-solution-mark-end-use-penetration-index-1788419032244

MMA Verdict on Hydrocarbon Accounting

These are among the four positions where our research anticipates prominent divergence between winners and laggards over the coming forecast period. Each is grounded in the demand model, the regulatory perimeter, and the announced capacity pipeline.
01 / COMPLIANCE PRODUCT STRATEGY

Embed regulatory reporting into core platform now

Vendors still selling compliance reporting as a separate add-on module are losing renewal negotiations to competitors who built it directly into the core platform, since operators increasingly refuse to manage two separate vendor relationships for one connected workflow. Embedding compliance mapping within the next twelve months positions a vendor to capture the fastest-growing segment of this market before methane disclosure deadlines force a wave of switching activity industry-wide. Waiting longer risks losing existing customers during their very next renewal cycle.
02 / MIDSTREAM CROSS-SELL EXPANSION

Cross-sell midstream allocation modules to existing customers

Operators managing both upstream and midstream operations increasingly prefer a single vendor relationship spanning the full accounting workflow, and vendors without a midstream allocation module are ceding that cross-sell revenue to competitors who acquired or built one already. Roughly 30 percent of upstream customers now purchase at least one midstream module, a figure that will keep climbing as vendors improve integration between the two product lines further over time. This is a near-term revenue opportunity worth prioritizing immediately across the entire existing customer base.
03 / INDEPENDENT OPERATOR SEGMENT

Build simplified pricing tiers for smaller operators

Small independent operators remain an underserved segment because standard enterprise pricing structures do not fit their smaller operational scale and thinner IT budgets, leaving many still fully dependent on error-prone manual spreadsheet workflows for core accounting tasks. Vendors introducing simplified, lower-cost tiered pricing plans specifically for this segment can capture meaningful incremental customer volume that larger enterprise-focused competitors have effectively ignored for years. This addressable gap represents a genuine growth opportunity rather than a marginal afterthought vendors should keep deprioritizing.
04 / CLOUD COST MANAGEMENT

Negotiate multi-year committed-use cloud agreements early

Vendors without long-term committed-use cloud agreements remain exposed to future pricing volatility similar to the disruption that followed a major 2024 hyperscale provider price adjustment, which squeezed several smaller vendors' already thin operating margins for multiple quarters. Locking in multi-year committed-use terms now protects margin well before the next plausible pricing cycle, while vendors who wait risk repeating the same costly margin compression that hit competitors only recently. This is a near-term operational priority worth addressing before the next contract renewal cycle arrives.

Engagement Snapshot From the Field

A live engagement with an industry participant carrying material or product regulatory and market exposure ahead of a defining policy shift, showing how our research translates into a defensible multi-year portfolio strategy.
MARKET MINDS ADVISORY · CLIENT ENGAGEMENT SUMMARY
Demand for Hydrocarbon Accounting Solution in USA Producer Strategic Portfolio Review and Transition Roadmap 2026·Investment Scenario on Demand for Hydrocarbon Accounting Solution in USA Exposure Evaluation 2025-26
CLIENT PROFILE
The client is an independent Permian basin operator managing roughly 1,200 active producing wells, generating approximately $310 million in annual revenue (client-reported, unverified by MMA) prior to this engagement. The company had relied on a combination of legacy on-premise accounting software and manual spreadsheet reconciliation for regulatory reporting, a setup increasingly strained by growing well counts and expanding disclosure obligations.
STRATEGIC CHALLENGE
Rising state royalty audit frequency and looming federal methane disclosure deadlines were exposing gaps in the client's legacy reporting workflow, with two recent audits requiring costly manual reconstruction of historical volumetric records. Leadership needed an objective evaluation of whether to upgrade the existing legacy platform or migrate entirely to a modern cloud-native alternative, given the significant switching costs involved.
MMA APPROACH
MMA conducted structured interviews with the client's accounting, land, and compliance teams alongside a comparative evaluation of four candidate vendor platforms against regulatory reporting capability, migration risk, and total cost of ownership over a five-year horizon. The analysis modeled expected audit outcome improvement and analyst time savings under each vendor option relative to the client's current legacy baseline.
KEY FINDINGS
  1. The client's legacy system lacked native methane emissions reporting capability entirely, requiring an estimated 400 analyst hours annually to compile compliant disclosures manually.
  2. Three of the four evaluated vendors could deliver working compliance-mapped reporting output within six months of contract signature given existing template libraries.
  3. Full platform migration carried an estimated $1.2 million implementation cost (client-reported, unverified by MMA) with a projected two-year payback horizon for the client overall.
  4. Modeled analyst time savings from automated compliance reporting reached roughly 350 hours annually once the new platform reached full production deployment status.
CLIENT PROFILE
The client is an independent Permian basin operator managing roughly 1,200 active producing wells, generating approximately $310 million in annual revenue (client-reported, unverified by MMA) prior to this engagement. The company had relied on a combination of legacy on-premise accounting software and manual spreadsheet reconciliation for regulatory reporting, a setup increasingly strained by growing well counts and expanding disclosure obligations.
STRATEGIC CHALLENGE
Rising state royalty audit frequency and looming federal methane disclosure deadlines were exposing gaps in the client's legacy reporting workflow, with two recent audits requiring costly manual reconstruction of historical volumetric records. Leadership needed an objective evaluation of whether to upgrade the existing legacy platform or migrate entirely to a modern cloud-native alternative, given the significant switching costs involved.
MMA APPROACH
MMA conducted structured interviews with the client's accounting, land, and compliance teams alongside a comparative evaluation of four candidate vendor platforms against regulatory reporting capability, migration risk, and total cost of ownership over a five-year horizon. The analysis modeled expected audit outcome improvement and analyst time savings under each vendor option relative to the client's current legacy baseline.
KEY FINDINGS
  1. The client's legacy system lacked native methane emissions reporting capability entirely, requiring an estimated 400 analyst hours annually to compile compliant disclosures manually.
  2. Three of the four evaluated vendors could deliver working compliance-mapped reporting output within six months of contract signature given existing template libraries.
  3. Full platform migration carried an estimated $1.2 million implementation cost (client-reported, unverified by MMA) with a projected two-year payback horizon for the client overall.
  4. Modeled analyst time savings from automated compliance reporting reached roughly 350 hours annually once the new platform reached full production deployment status.
RECOMMENDED STRATEGY
Phase 1: Phase one: select and contract with a vendor offering proven compliance-mapped reporting capability already validated on comparable independent operator programs. Phase 2: Phase two: migrate historical volumetric and revenue data over four months, prioritizing the most recent three years of audit-relevant records first. Phase 3: Phase three: retire the legacy system entirely and redirect freed analyst hours toward higher-value production forecasting and variance analysis work.
OUTCOME
The client selected and deployed its new platform within seven months, ahead of the original nine-month target, avoiding a subsequent state royalty audit's manual reconstruction burden entirely. Annual compliance reporting hours fell by roughly 340 hours within the first full year of operation (client-reported, unverified by MMA), freeing meaningful analyst capacity for other priorities.

Frequently Asked Questions

Foundational context covering the market sizes, CAGR, scope, country, region and competition that inform every finding below. This section is provided to cover basics and most often pre-purchase conversations, answered from the MMA Primary Research Dataset.

What is the current size of the Demand for Hydrocarbon Accounting Solution in USA?

The market is valued at $0.9 billion in 2025 on a global vendor revenue basis. This figure covers volumetric accounting, revenue distribution, and regulatory reporting software serving US operators.

How large will the Demand for Hydrocarbon Accounting Solution in USA be by 2036?

The market is projected to reach $2.69 billion by 2036. Growth is driven primarily by regulatory reporting mandates and continued shale well count expansion nationwide.

What is the CAGR for the Demand for Hydrocarbon Accounting Solution in USA 2026 to 2036?

The market is expected to grow at a CAGR of 10.5 percent between 2026 and 2036. This reflects steady demand tied to compliance and production growth.

Which segment is growing fastest?

Regulatory Reporting and Compliance software leads at a 14.5 percent CAGR, roughly 1.38 times the overall market rate. Methane disclosure mandates drive this segment's outsized growth.

Who are the major companies in the Demand for Hydrocarbon Accounting Solution in USA?

Quorum Software, Enverus, SAP, Oracle, and W Energy Software lead the competitive landscape. Together these top five vendors hold 48 percent of global vendor revenue.

Which country is growing fastest?

Guyana leads at a 19.0 percent CAGR, driven by rapidly scaling offshore oil production requiring new accounting and allocation software. This outpaces every other country tracked.

Report Segmentation Architecture

The full report scope spans multiple orthogonal segmentation dimensions, with cross-tabulated demand data provided for each dimension pair. Coverage extends further to regional breakdowns, trend trajectories, and the competitive detail needed to support segment-level decision-making.

By Primary Market Dimension

  • Production and Volumetric Accounting
  • Revenue Accounting and Distribution
  • Joint Interest Billing
  • Land and Lease Management Integration
  • Midstream Allocation and Measurement
  • Regulatory Reporting and Compliance

By End-Use Industry

  • Upstream Exploration and Production
  • Midstream Gathering and Processing
  • Independent Operators
  • Integrated Major Operators
  • State and Federal Regulatory Bodies

By Commercial Dimension

  • Direct Software Licensing
  • Managed Compliance Services
  • Systems Integrator Channel
  • Cloud Subscription Model

By Region

  • North America
  • Western Europe
  • East Asia
  • South Asia and Pacific
  • Latin America
  • Middle East and Africa
  • Eastern Europe

Scope, Methodology, and Coverage

Every figure in this report is reproducible from documented input assumptions. The scope below maps the historical period, the forecast horizon, the segmentation dimensions, and the countries covered, alongside the underlying primary and qualitative methodology.
Historical Period
2020 to 2025
Forecast Period
2026 to 2036
Base Year
2025 (USD billions; MMA Primary Research Dataset, September 2026)
Market Definition
This report covers software platforms used by upstream and midstream oil and gas operators in the United States for production volumetric accounting, revenue distribution, joint interest billing, and regulatory reporting, measured on a global vendor revenue basis. It excludes general-purpose enterprise resource planning software not specifically configured for hydrocarbon measurement and allocation workflows.
Quantitative Units
USD billions, vendor revenue basis
Segmentation Dimensions
Functional module type (production accounting, revenue distribution, joint interest billing, land management, midstream allocation, regulatory reporting)
Regions Covered
North America, Western Europe, East Asia, South Asia and Pacific, Latin America, Middle East and Africa, Eastern Europe
Countries Covered
United States, Canada, Guyana, Brazil, Norway, United Kingdom, China, and 18 additional countries across all seven regions
Key Companies Profiled
Quorum Software, Enverus, SAP, Oracle, W Energy Software, and 15 additional named vendors
Quantitative Methodology
Primary survey, n=3,800 respondents, Q4 2025, six countries; demand-side model with trade association cross-validation
Qualitative Methodology
47 expert interviews, Q4 2025; applied to validate demand model assumptions, identify emerging dynamics, and assess competitive positioning
Report Format
PDF and XLSX data workbook (Word format preview document)
Publisher
Market Minds Advisory
Report Code
MMA-2026-ENE-132
Published
September 2026
Contact
sales@marketmindsadvisory.com | www.marketmindsadvisory.com

Purchase the full Demand for Hydrocarbon Accounting Solution in USA Report (2026 to 2036).

This report delivers a comprehensive analysis of the market for hydrocarbon accounting software serving US oil and gas operators through 2036. It combines primary survey data from 3,800 respondents across six countries with 47 expert interviews conducted in Q4 2025, alongside company disclosures and government regulatory data. Coverage spans market sizing, segmentation by functional module, regional dynamics across all seven regions, competitive positioning among twenty named vendors, input cost exposure, and forward-looking strategic verdicts. The analysis is designed for procurement, strategy, and investment decision-makers evaluating this category.
Full 2020-2036 historical and forecast data
Detailed segmentation by functional accounting module
All seven regional market breakdowns included
Competitive profiles of twenty named vendors
Input cost and cloud pricing exposure analysis
Strategic revenue lever and verdict recommendations

Built For The People Who Decide

From boardroom strategy to bench-side execution, this report is read cover-to-cover by leaders shaping the next decade of their industry, turning demand scenarios, market dynamics and valuation benchmarks into decisions.
CXOs/ Presidents/ VPs/ Managers
M&A and Corporate Development
Strategy Teams and R&D Heads
Procurement and Product Directors
Regulatory and Compliance Leaders
Investor Relations and Equity Analysts