Market Minds Advisory
United States Fixed Income Asset Management Market

United States Fixed Income Asset Management Market: United States Fixed Income Asset Management: Unownable Indices, Fee Compression and the Accounts Clients Now Hold Directly

The last corner of asset management where active managers still get paid properly, protected by a benchmark holding more than thirteen thousand line items that almost nobody can actually replicate.

Lead Analyst

Published

September 2026

Make Smarter Decisions with Customized Research Insights

Request a free sample report and evaluate market opportunities, growth trends, and competitive dynamics relevant to your business needs.

2025 MARKET VALUE$38.5BMarket Size 2025
2036 FORECAST VALUE$71.6BBase Case , 2026 to 2036
CAGR 2026 TO 20365.8 %Bull 7.0% / Bear 4.6%
INCREMENTAL OPPORTUNITY$30.8BNet 10- year value creation
EXPANSION MULTIPLE1.76x2036 value over 2026 base
Strategic Levers
M&A Pipeline
Regional Outlook
Country Rankings
Competitive Intelligence
Segmental Deep-dive
Call-Us : 91 93563 13602

Executive Snapshot and Market Trajectory.

Fixed income is the last part of American asset management where active managers still collect a real fee, and the reason is mechanical rather than clever. The broad domestic aggregate benchmark holds over thirteen thousand line items and most of them barely ever trade.
Index replication is therefore an approximation rather than a copy, which leaves room for a manager to add value and to charge for doing it. Roughly 68% of fixed income assets remain actively managed, against a far lower share on the equity side, and the blended fee near 24 basis points has compressed considerably more slowly than anybody predicted a decade ago. That advantage is genuine, and it is quite certainly not permanent.
Two things are eroding it from different directions. Active exchange traded funds now deliver the same portfolio managers at roughly half the mutual fund fee, and clients have noticed. Separately managed accounts, already 31% of assets, let a client own the bonds outright and harvest tax losses no fund can pass through. Securitised credit grows fastest at 8.7% because it is the hardest thing here to index at all.
Market Definition
Management and advisory fee revenue earned on fixed income assets managed for United States clients across mutual funds, exchange traded funds, collective investment trusts, separately managed accounts and institutional segregated mandates. Excludes performance fees on private credit and direct lending vehicles, securities lending revenue, custody, distribution and platform fees retained by intermediaries, and all equity or multi-asset mandates.
Base Year Value
$38.5B in 2025 (MMA Primary Research Dataset, August 2026)
Forecast Period
2026 to 2036, eleven discrete annual values
CAGR
5.8% base case. Bull 7.0%. Bear 4.6%.
Fastest Growth Segment
Securitised and Structured Credit: 8.7% CAGR
Fastest Growth Country
India: 7.8% CAGR
Fastest Growth Region
South Asia and Pacific: 7.8% CAGR
Largest Region
North America: 88% of 2025 global value
Market Leaders
PIMCO, BlackRock, Vanguard, Fidelity Investments and Capital Group lead on fixed income assets and attributable fee revenue. Source: company annual reports and MMA Primary Research Dataset, July 2026.
Primary Survey
n=3,800 procurement and R&D decision-makers, Q4 2025, six countries
Methodology
Demand-side build-up, cross-validated against public data, 47 expert interviews

United States Fixed Income Asset Management Market Forecast Scenarios

united-states-fixed-income-assets-management-indus-size-forecast-scenario-1787938844070
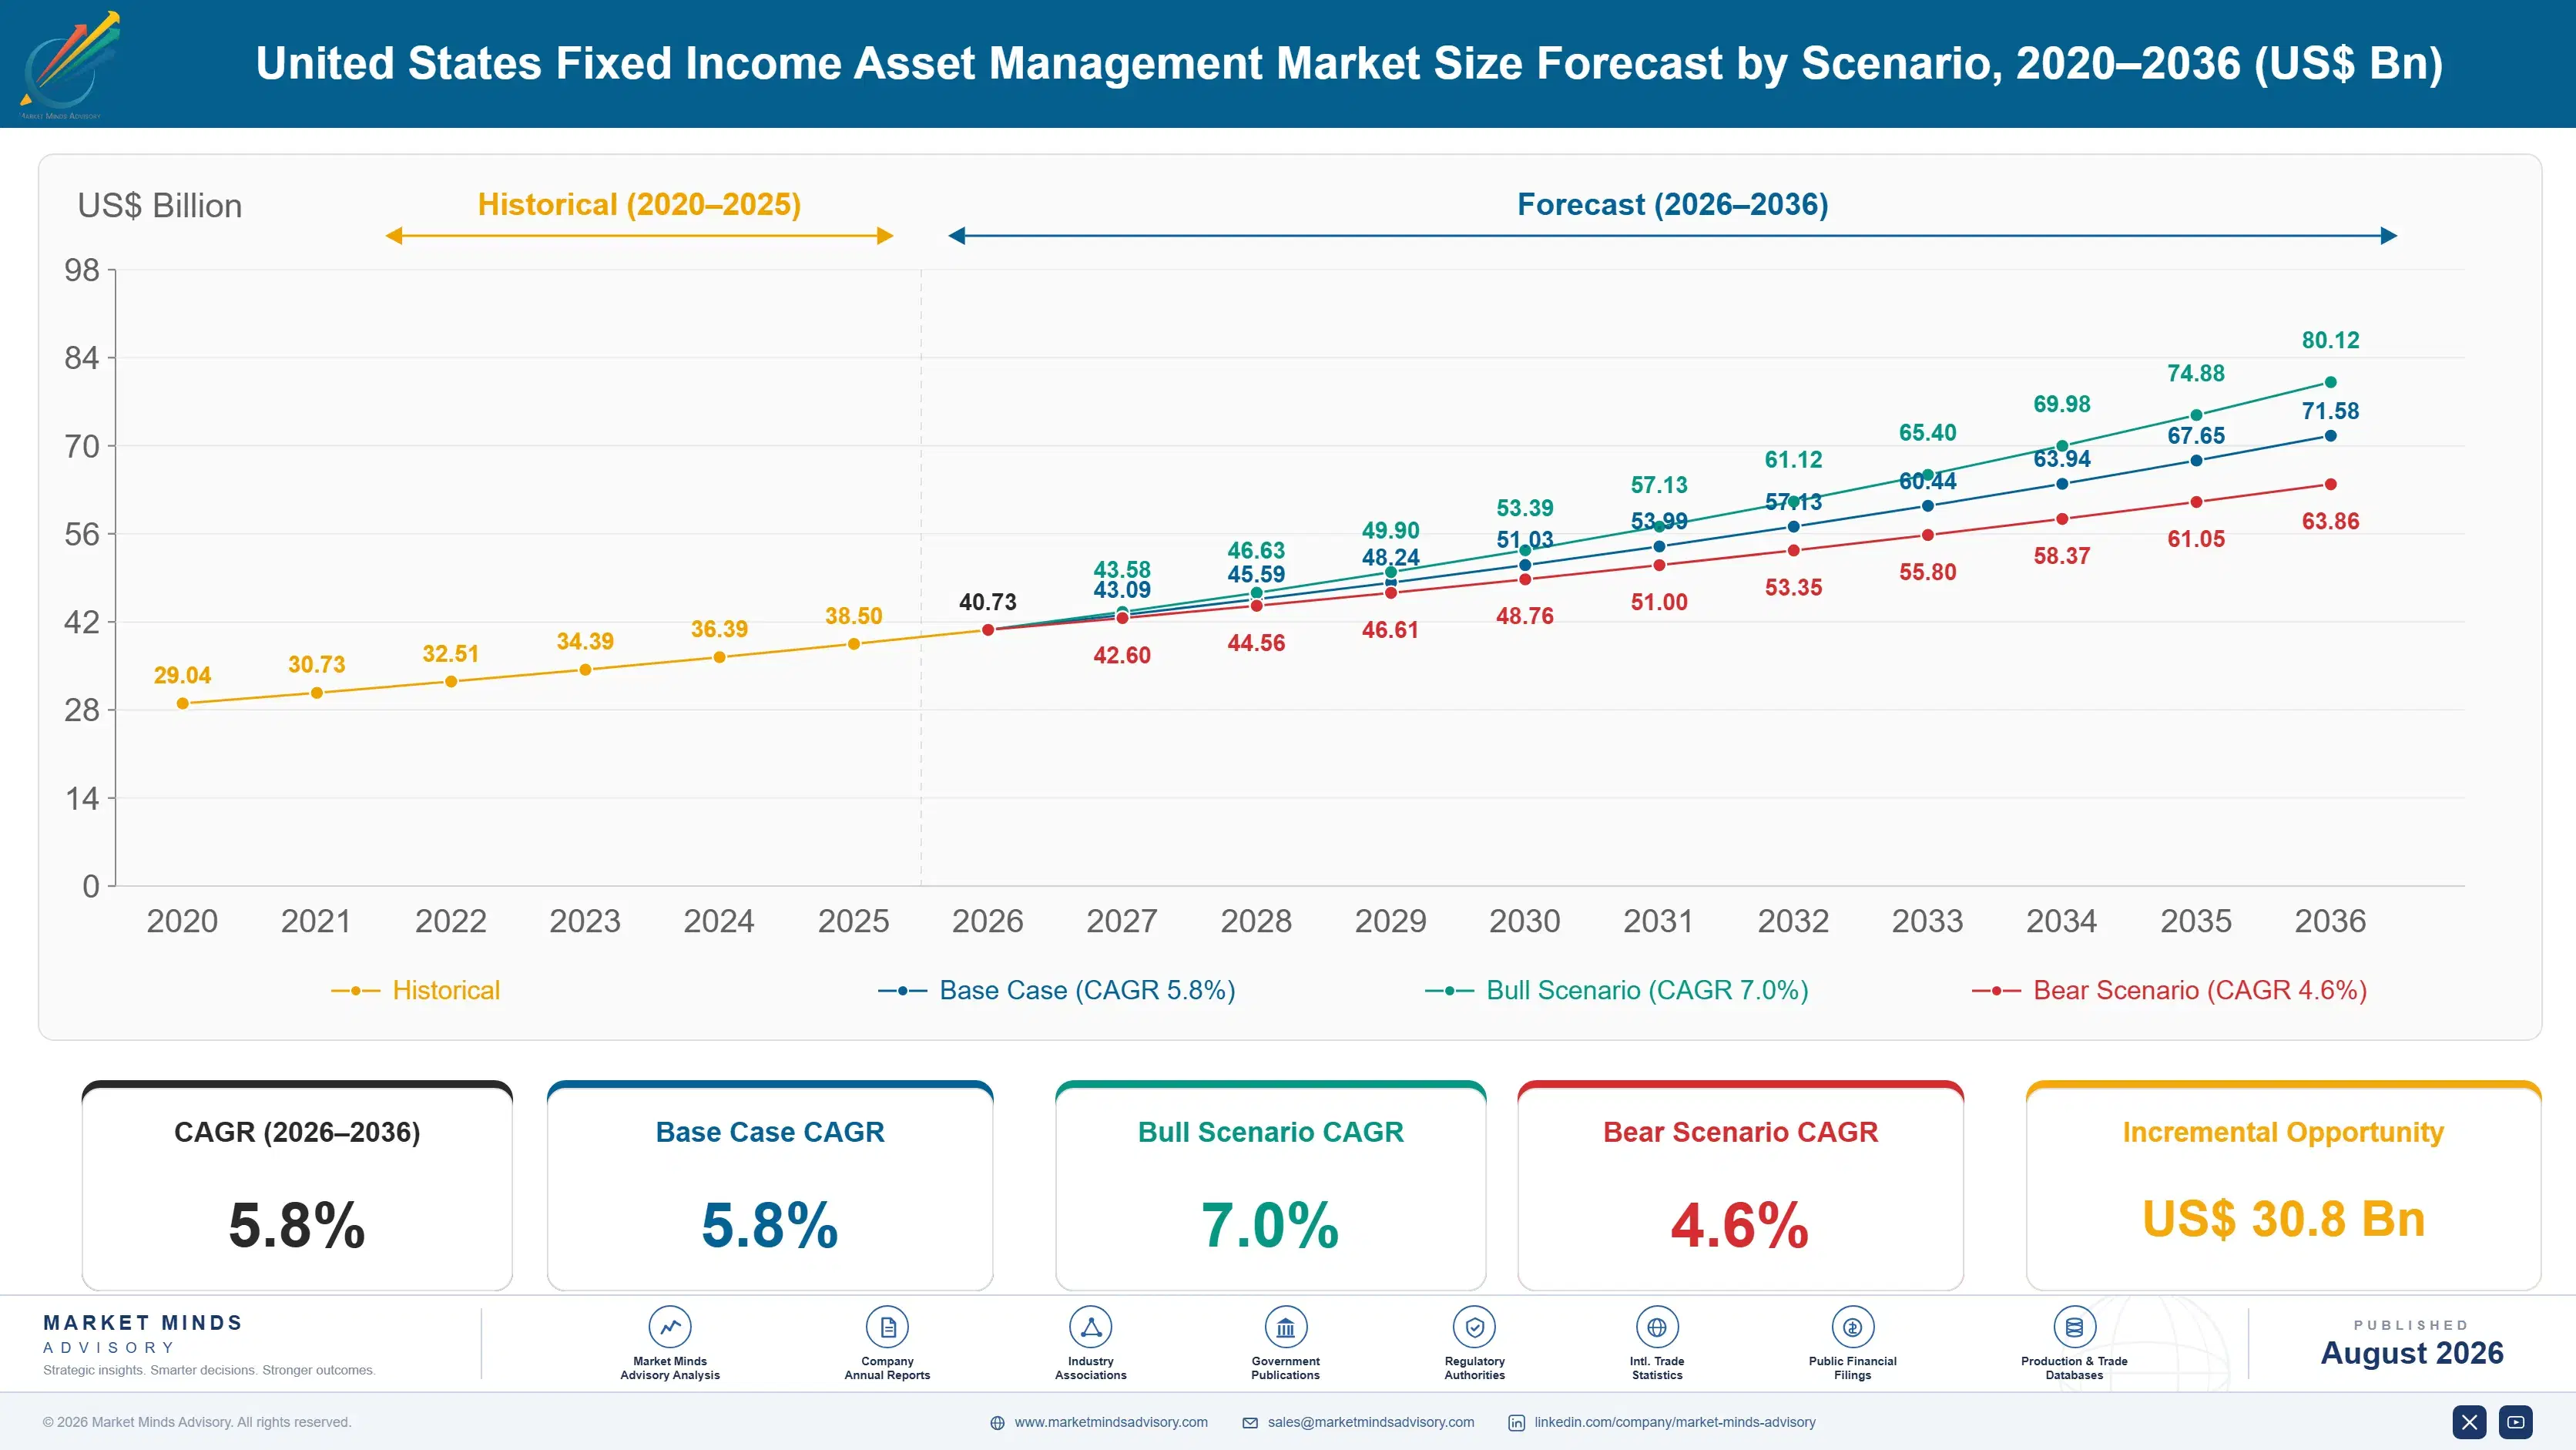
The 2020 to 2025 period contained the worst bond year on record and the best entry point in twenty years, arriving eighteen months apart. Rates near zero suppressed fee revenue through 2020 and 2021, then the 2022 drawdown removed value from every portfolio simultaneously, and recovery came only once yields made bonds worth owning again. Revenue compounded near 4.8% across the period despite that sequence.
Three mechanisms carry the base case. Demographic allocation continues shifting toward fixed income as the largest cohort in American history moves through retirement, which raises assets independently of market performance. Securitised and structured credit expands because it resists indexing more completely than any other sector. And separately managed accounts keep taking municipal assets from funds, at fee levels that are lower per dollar but attached to relationships that almost never leave.
The bull catalyst is a sustained period of elevated yields making bonds genuinely competitive with equities for retirement allocations, which would move assets on a scale no product launch achieves. The bear risk is active exchange traded funds compressing the blended fee faster than assets grow, since the same manager delivered at half the price is not a proposition anybody can defend for long.

Charging For What The Index Cannot Copy

Equity indexing worked because constituents are liquid, few and continuously priced. Bond indexing works less well, because the broad aggregate benchmark holds more than thirteen thousand securities, many of which do not trade on any given day and some of which cannot be bought in size. Index funds sample rather than replicate, and sampling is a choice. Decisions can be better or worse, which is what active managers sell.
MARKET CONCENTRATION CR542%Share of fixed income fee revenue held by leaders
BLENDED MANAGEMENT FEE24 basis pointsWeighted average charged across all managed fixed income
ACTIVE SHARE OF ASSETS68%Portion of assets managed against a benchmark actively
INDEX CONSTITUENT COUNT13,400Line items inside the broad domestic aggregate benchmark
SEPARATE ACCOUNT SHARE31%Assets held in client owned accounts rather than funds
ANNUAL NET FLOW RATE3.4%New money arriving measured against opening managed assets
That protection explains why roughly 68% of fixed income assets stay actively managed while equities went the other way. It also explains why the blended fee near 24 basis points held up better than equity fees over the same period. Managers calling this evidence of superior skill are describing a market structure. The distinction matters, because market structures change and skill arguments do not travel.
The client relationship is moving as much as the product is. Separately managed accounts already hold 31% of assets, and in municipals in particular the client owns individual bonds directly, permitting tax loss harvesting at the security level no pooled fund can deliver. Fee per dollar is lower there. Retention is far higher, because unwinding a customised account with embedded gains is painful.
"Bond managers have spent fifteen years explaining that their fees survived because of skill. Their fees survived because the index has thirteen thousand line items and half of them do not trade. Those are different arguments with very different shelf lives."
Director, Institutional Asset Management Practice · MMA Financial Services and Insurance Practice · August 2026

Market Trends

Active Exchange Traded Funds Reprice The Same Managers

Active fixed income exchange traded funds have grown from a rounding error into a genuine channel, and the difficulty for incumbents is that the portfolio manager is frequently the same person running the mutual fund at roughly twice the fee. Clients notice that comparison quickly once an intermediary puts both on the same screen. The regulatory groundwork was laid by exemptive relief permitting custom creation baskets, which made active management operationally workable inside the wrapper. Managers now choose between cannibalising their own fund revenue and watching somebody else do it.
Market Impact: Shifts 4% of assets annually
Municipal Separate Accounts Take Assets From Funds

Wealthy households buying municipal bonds increasingly hold them in separately managed accounts rather than funds, because direct ownership permits loss harvesting at the individual security level and allows state-specific customisation a national fund cannot offer. Fee per dollar is lower than a fund charges. Retention is far higher, since unwinding an account with embedded gains and customised holdings creates a tax event the client will not accept. Managers with account administration capability at scale are taking assets from those without it, permanently. Nobody is moving back toward pooled municipal funds at any point.
Market Impact: Lifted net flows 3.4% annually

Market Opportunities and Growth Drivers

Retirement Demographics Shift Allocations Toward Bonds

The largest cohort in American history is moving through the window where target date funds and financial advisors both reduce equity exposure and raise fixed income, and that reallocation happens on a schedule rather than in response to markets. Assets arrive whether or not yields look attractive at the time. This is the single most reliable source of growth in the industry and it requires no product development, no distribution investment and no performance from anybody. It also continues for roughly another fifteen years regardless of conditions. Very little else in this industry works that way.
Market Impact: Cuts fees by 12 basis points

Higher Yields Restored The Case For Owning Bonds

A decade of suppressed rates made fixed income difficult to sell to anybody who could tolerate volatility, since the income on offer barely justified the allocation. Yields returning to levels that compete with equity expected returns changed that conversation completely, and assets followed once the 2022 repricing was absorbed. Money market and ultra-short strategies captured much of it first, then extended as clients grew comfortable with duration again. The industry spent ten years arguing bonds still belonged in portfolios, and the rate cycle settled the argument instead. Ten years of argument settled in eighteen months.
Market Impact: Diverts 6% of credit allocations

Market Restraints and Challenges

Wrapper Competition Compresses Fees Without Reducing Cost

Delivering an identical strategy through an exchange traded fund at roughly half the mutual fund fee lowers revenue while the research, trading and risk infrastructure behind it costs the same. The root cause is that fee levels were set by distribution economics rather than by production cost, and the newer wrapper carries far less distribution burden. Managers mitigate by launching the cheaper wrapper themselves rather than ceding the channel, by shifting capacity toward strategies indices cannot copy, and by pricing institutional mandates separately from retail vehicles. The production cost did not move at all.
Market Impact: Halves fee on 22% of assets

Private Credit Competes For The Same Client Allocation

Institutional allocators funding private credit commitments frequently source that money from public credit sleeves, so growth in one comes partly at the expense of the other. The root cause is a yield premium that compensates for illiquidity in a way public markets cannot match while spreads stay tight. Public managers mitigate by launching adjacent private strategies themselves, by emphasising liquidity and daily pricing that private vehicles cannot offer, and by competing in securitised sectors where public market execution is a genuine advantage. Both allocations come out of the same institutional budget line.
Market Impact: Moves 31% of assets accountward
3 additional market trends, 4 additional growth drivers, and 2 additional restraints and challenges are covered in the full report. Contact sales@marketmindsadvisory.com to access the complete intelligence.

Segment CAGR and Growth Architecture

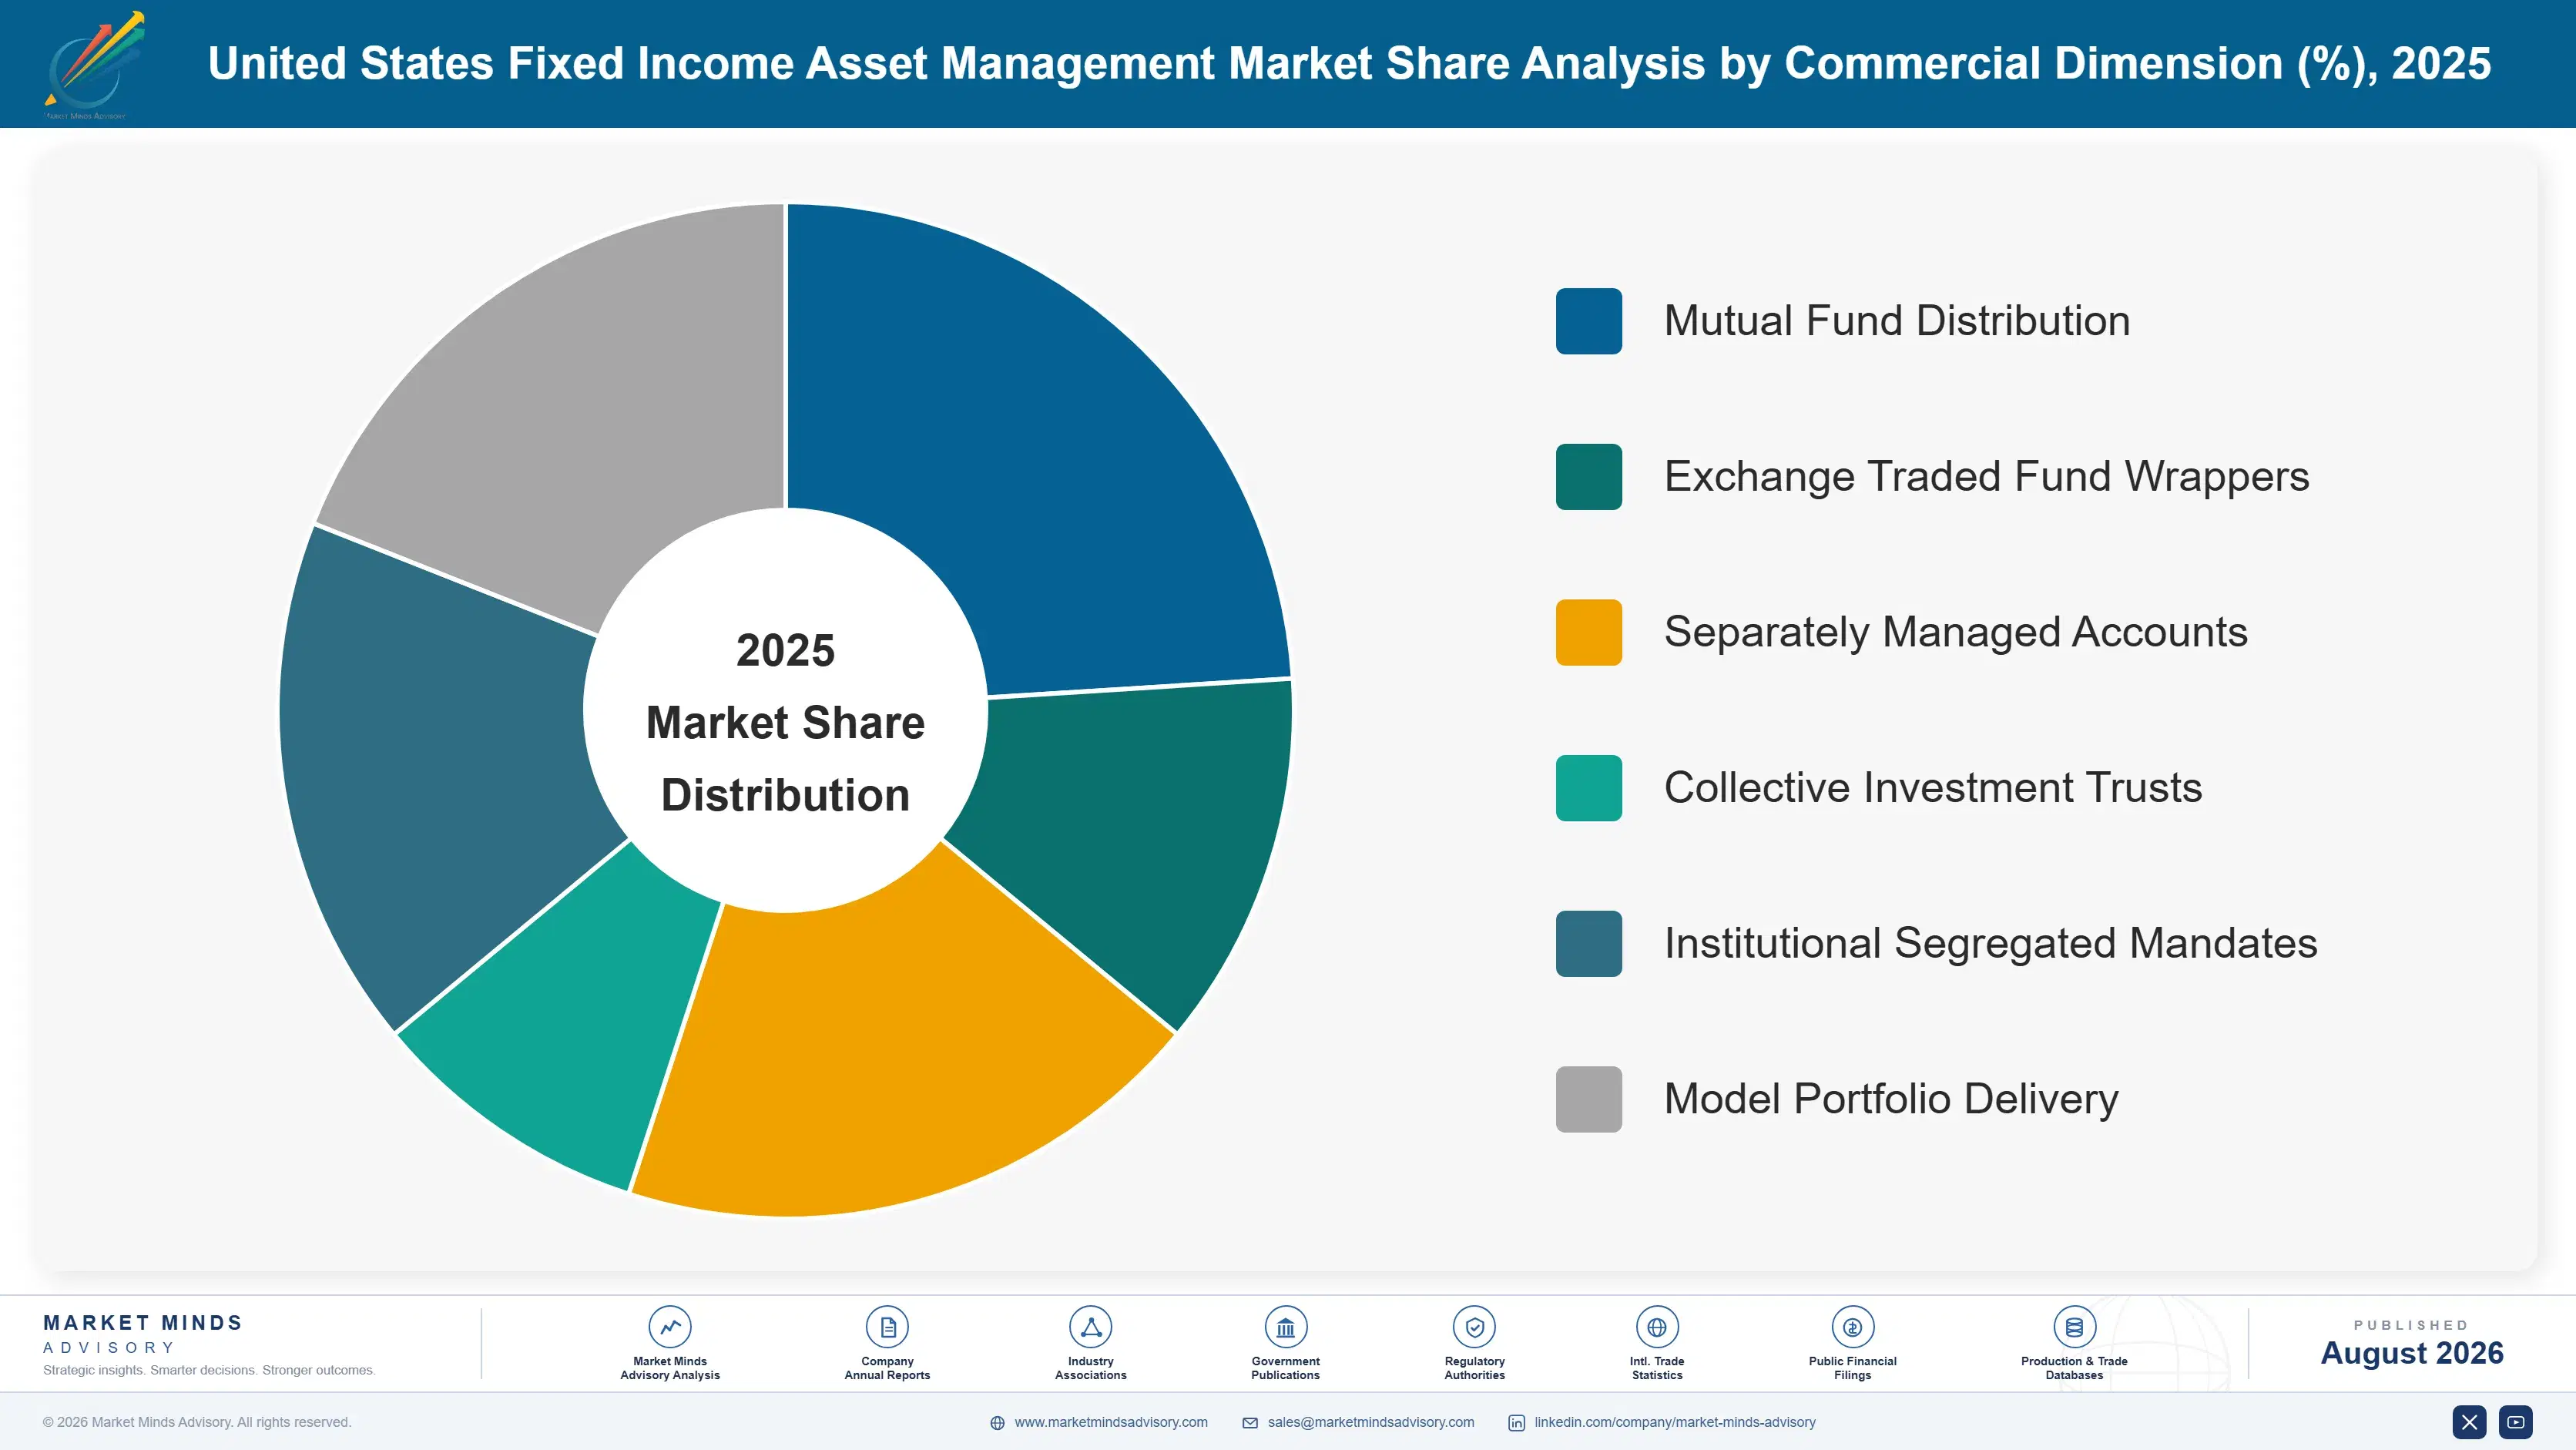
Segmentation follows fixed income strategy, since that determines the fee a manager can charge, the capacity a strategy holds and how completely an index can replicate it. Six strategies describe the market completely, from the core mandates that anchor most institutional relationships through to the securitised sectors that resist indexing more than anything else does.
united-states-fixed-income-assets-management-indus-market-share-analysis-1787938844638

Securitised and Structured Credit

The fastest strategy grows at 8.7%, half again the market rate of 5.8%, and it grows because it is the hardest sector in fixed income to index. Agency and non-agency mortgage securities, commercial mortgage credit, asset-backed paper and collateralised loan obligations all require analysis of underlying collateral and prepayment behaviour that no benchmark weighting captures. Deal structures differ individually rather than by category. Exchange traded vehicles have arrived in the most liquid corners, particularly senior collateralised loan obligation tranches, but the sectors requiring genuine underwriting remain firmly with active managers. Fee levels here sit well above core mandates and have compressed least of anything anywhere in this market. That is not an accident.
CAGR 8.7%

Municipal Bonds

Municipal strategies grow at 7.2%, driven less by market performance than by a change in how clients hold the assets. Wealthy households increasingly buy municipals through separately managed accounts rather than funds, because owning individual bonds permits loss harvesting at the security level and allows state-specific portfolios that a national fund cannot construct. The market itself is unusually fragmented, with tens of thousands of issuers and securities that frequently trade once and then never again, which makes indexing genuinely impractical and credit work genuinely valuable. Fee per dollar is lower in an account than a fund, and the relationship lasts considerably longer once embedded gains begin to accumulate inside of it.
CAGR 7.2%
Full segment breakdown across 6 segments available in the complete report.

Regional Architecture and Country Demand Map

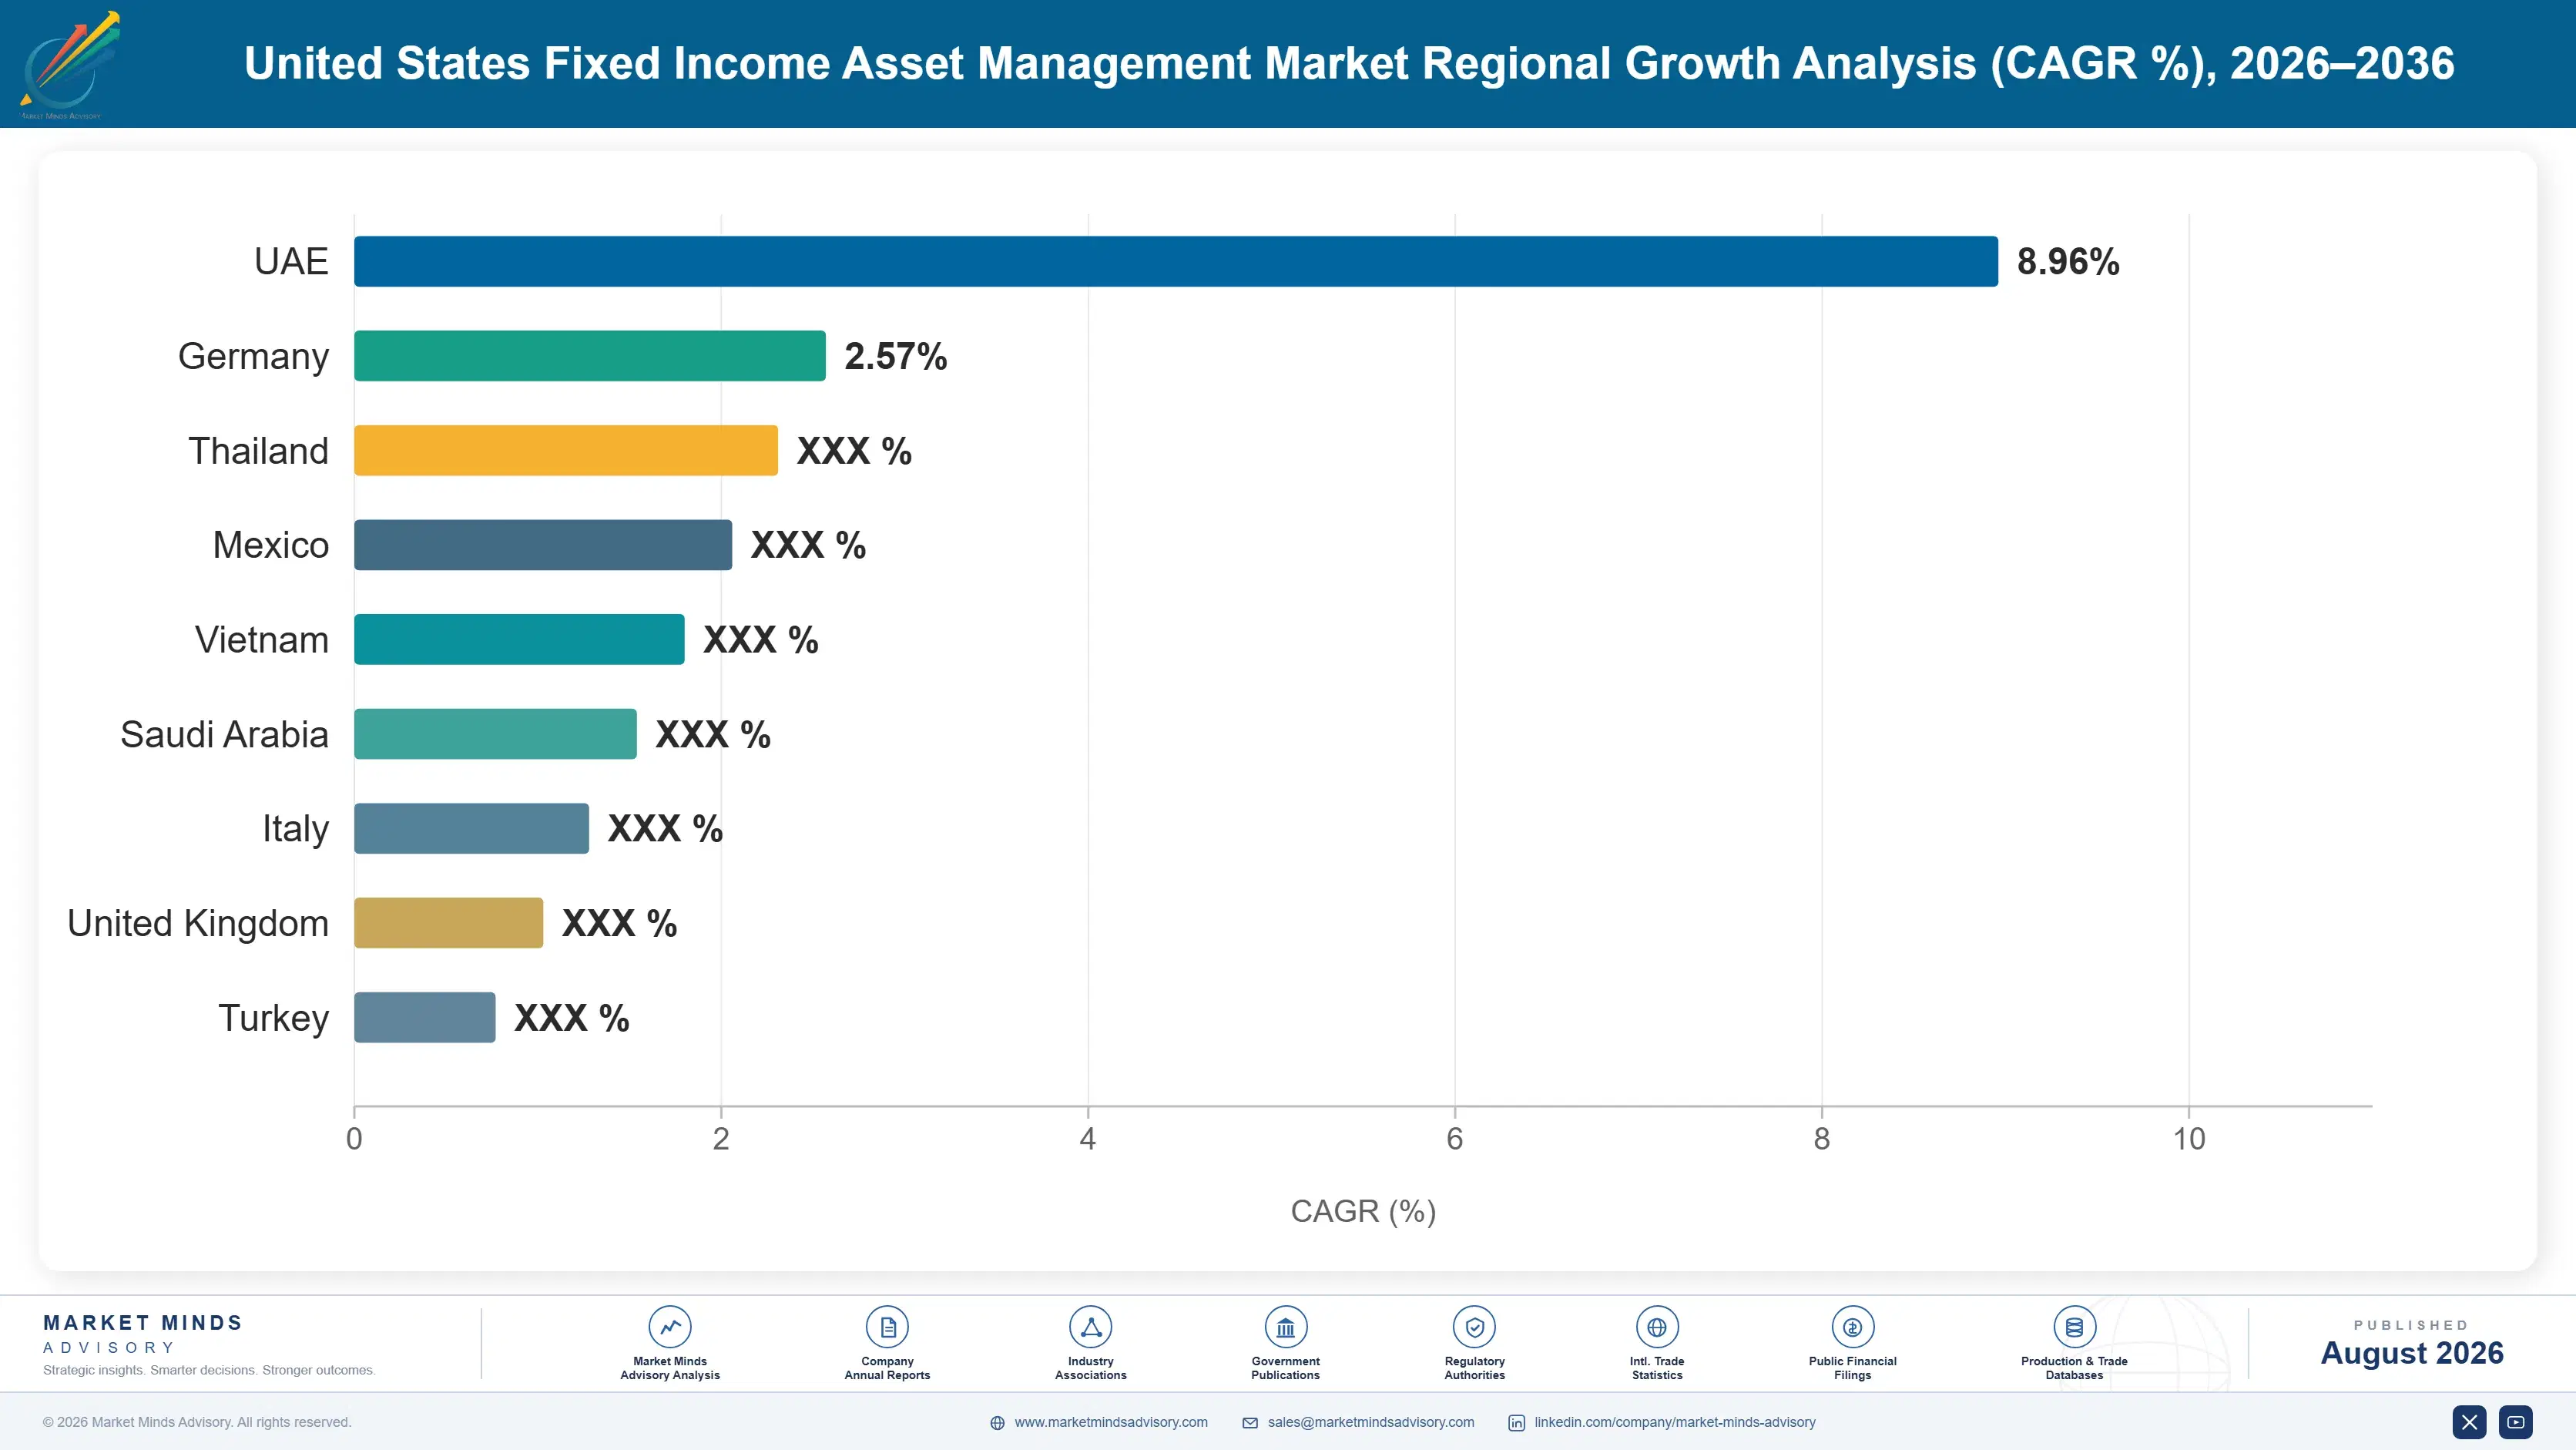
This is a United States market and effectively all fee revenue is earned domestically, which is the definition rather than a default. Other regions appear as sources of client capital, as offshore operating locations and as competing allocation destinations, none of which generate fee revenue counted within this scope.

North America

Effectively the whole market sits here, above the standard band, because this report measures fee revenue earned on assets managed for United States clients and that is where the clients are. Corporate and public pension systems, insurance general accounts and intermediated retail wealth together supply the assets, and the largest single influence on all three is the Treasury market that anchors every domestic bond portfolio. Regulatory changes such as central clearing requirements for Treasury trading will alter execution economics for every manager here without altering any fee schedule. That is the definition of this market rather than any default, and stating it plainly matters more than pretending the assets are distributed globally.
Share: 88% | CAGR: 5.4% (2026 to 2036)

Western Europe

Share sits below the standard band for the definitional reason that these are United States mandates. The genuine connection is client capital and competition. European insurers and pension funds allocate to dollar fixed income through separate vehicles that fall outside this scope, and European managers including Amundi compete directly for domestic mandates through American subsidiaries. Regulatory divergence matters as well, since European sustainability disclosure requirements shape products that American clients increasingly encounter through globally managed platforms and occasionally request domestically without understanding the difference. None of that produces fee revenue counted within this scope, though it does explain why several American managers now maintain product teams whose only job is reconciling two incompatible disclosure regimes.
Share: 5% | CAGR: 4.4% (2026 to 2036)
Regional intelligence for 5 additional markets available in the complete report: East Asia, South Asia and Pacific, Latin America, Middle East and Africa, Eastern Europe. Contact sales@marketmindsadvisory.com.
united-states-fixed-income-assets-management-indus-country-cagr-analysis-1787938845161

Where Fixed Income Fees Still Hold

Four levers work on where a manager competes and how the client holds the assets, rather than on fee level, which wrapper competition now sets from outside. Capacity allocation, account administration scale, wrapper self-cannibalisation and institutional pricing separation each address something a manager genuinely controls today. Fee level itself is no longer among them anywhere.

Move Capacity Toward Sectors Indices Cannot Copy

Fee compression has been sharpest where replication is easiest, so shifting research and risk capacity toward securitised credit, municipals and opportunistic sectors protects revenue directly. Securitised strategies carry fees 18 to 30 basis points above core mandates and have compressed least of anything in the market. The constraint is capability rather than intent: underwriting collateral and prepayment behaviour requires analysts a core team does not employ, and building that group takes three to four years before it produces anything a client will pay for. Three or four years is the honest timeline.
Market Impact: Earns around 24 basis points above core mandates

Build Account Administration Before Clients Demand It

Separately managed accounts already hold 31% of assets and municipals are moving fastest, but the operational requirement is substantial: security level tax lot tracking, harvesting across thousands of accounts, state-specific customisation and reporting a fund never needed. Managers with that infrastructure take assets from those without it, and retention on accounts runs roughly 40% higher than on comparable funds because embedded gains make leaving expensive. The infrastructure costs perhaps 8 to 12 million dollars to build properly and cannot be assembled quickly once clients start asking. Waiting until clients ask is already too late.
Market Impact: Lifts client retention by 40% against comparable funds

Launch The Cheaper Wrapper Before A Competitor Does

An active exchange traded fund run by the same portfolio manager at half the mutual fund fee cannibalises existing revenue, which is why so many managers hesitated and why several lost the assets anyway. Firms that launched early captured flows at a lower fee rather than losing them entirely, and the arithmetic favours action: retaining an asset at 30 basis points beats losing it at 60. The uncomfortable part is explaining to a board that revenue per dollar will fall deliberately and on purpose. Very few boards enjoy that particular conversation.
Market Impact: Retains those assets at 30 basis points instead

Price Institutional Mandates Apart From Retail Vehicles

Publishing a single fee philosophy across institutional and retail channels invites the largest clients to benchmark against the cheapest wrapper available, and sovereign and pension mandates already negotiate 10 to 15 basis points below the blended average. Separating the two, with institutional pricing tied to capacity, customisation and servicing intensity rather than to any retail comparison, protects roughly 6% of revenue that otherwise gets negotiated away. It requires discipline in a first meeting where the client arrives holding an exchange traded fund fact sheet. Most managers lose the argument in that meeting.
Market Impact: Protects around 6% of the total revenue annually

Who Controls the Margin Pool

Concentration is moderate. The five largest managers hold around 42% of fixed income fee revenue, lower than equity management because bond mandates fragment across strategy, client type and vehicle. The leader-to-challenger gap reflects distribution reach and institutional relationships rather than measurable capability. Below the top five sit specialists in municipals, securitised credit and high yield competing on sector depth. Sector depth is the whole basis of that tier.
Competition runs on three dimensions. Sector capability is first and most durable, since genuine securitised underwriting charges what core management cannot. Vehicle breadth is second, since clients expect the same strategy as a fund, an exchange traded fund and an account. Account administration scale is third, and has become decisive as separate accounts absorb more assets. Almost nobody in this market leads on more than one of the three.

Pressure arrives from wrapper economics, not from new competitors. Active exchange traded funds compress fees on assets that never leave, a revenue loss no outflow report captures. Private credit meanwhile competes for the same allocation with a yield premium public markets cannot match. Rankings shift against managers holding neither sector specialism nor account administration scale, since core management is where compression lands hardest.
united-states-fixed-income-assets-management-indus-company-positioning-matrix-1787938845673

Competitive Moat and Risk Dimensions

PIMCO

Moat: Sector depth and institutional relationships

PIMCO built research depth across securitised, credit and global sectors that supports mandates a core manager cannot compete for, and it holds institutional relationships measured in decades rather than product cycles. That combination lets it charge above the blended average across a large asset base. Assembling comparable sector coverage would take a competitor most of a decade.
PIMCO

Risk: Concentration in traditional fund vehicles

A large share of assets sits in mutual fund structures whose fees face direct comparison against active exchange traded funds running similar strategies at materially lower cost. Migrating those assets into cheaper wrappers reduces revenue per dollar even when the client stays. Declining to migrate them hands the decision to intermediaries who will make it anyway on the client's behalf.
BLACKROCK

Moat: Vehicle breadth and technology platform

BlackRock offers essentially every fixed income strategy in every wrapper a client might want, supported by a risk and portfolio system used by external institutions as well as internally. That breadth means a client changing vehicle preference rarely changes manager. Competitors must choose which wrappers to support and lose mandates on structure rather than on investment merit.
BLACKROCK

Risk: Fee mix weighted toward indexing

A substantial portion of fixed income assets sits in index and low-fee vehicles where revenue per dollar is a fraction of active mandates, so asset growth translates weakly into fee growth. Competing for active mandates against sector specialists means competing on capability rather than on scale. Breadth wins allocation decisions and rarely wins the highest-fee sleeves within them.

Players Tracked

Prominent Players

PIMCO
BlackRock
Vanguard
Fidelity Investments
Capital Group

Other Key Players

JPMorgan Asset Management
Franklin Templeton
Invesco
T Rowe Price
Nuveen
Loomis Sayles
Western Asset Management
MetLife Investment Management
Wellington Management
Guggenheim Investments
Lord Abbett
DoubleLine Capital
Voya Investment Management
Amundi US
Northern Trust Asset Management

Recent Developments

OCTOBER 2024

Institutional prime money market liquidity fees took effect

Amendments to money market fund rules introduced mandatory liquidity fees for institutional prime and tax exempt funds under defined redemption conditions, following earlier removal of redemption gates. This was regulatory implementation by the securities regulator rather than any commercial arrangement, and it reshaped where corporate cash sits.
Signal: Corporate cash migrated toward government funds and ultra-short strategies rather than accepting any fee uncertainty at all.
DECEMBER 2023

Central clearing mandate adopted for Treasury market trading

The securities regulator adopted rules requiring central clearing of a broad set of Treasury cash and repurchase transactions, with compliance phased over subsequent years. This was rulemaking by a federal regulator rather than any transaction between market participants, and it alters execution and margin economics for every bond manager.
Signal: Execution costs will rise across every domestic bond portfolio without a single fee schedule changing anywhere.
MAY 2023

Patent protection lapsed on the dual share class fund structure

Patent protection covering a structure allowing exchange traded fund share classes within existing mutual funds expired, opening the approach to other managers who subsequently filed for regulatory permission to use it. This was the lapse of an intellectual property right rather than any merger, acquisition or commercial agreement between firms.
Signal: Managers gained a route to offer cheaper wrappers without launching entirely separate funds alongside existing ones.

What Running A Bond Desk Costs

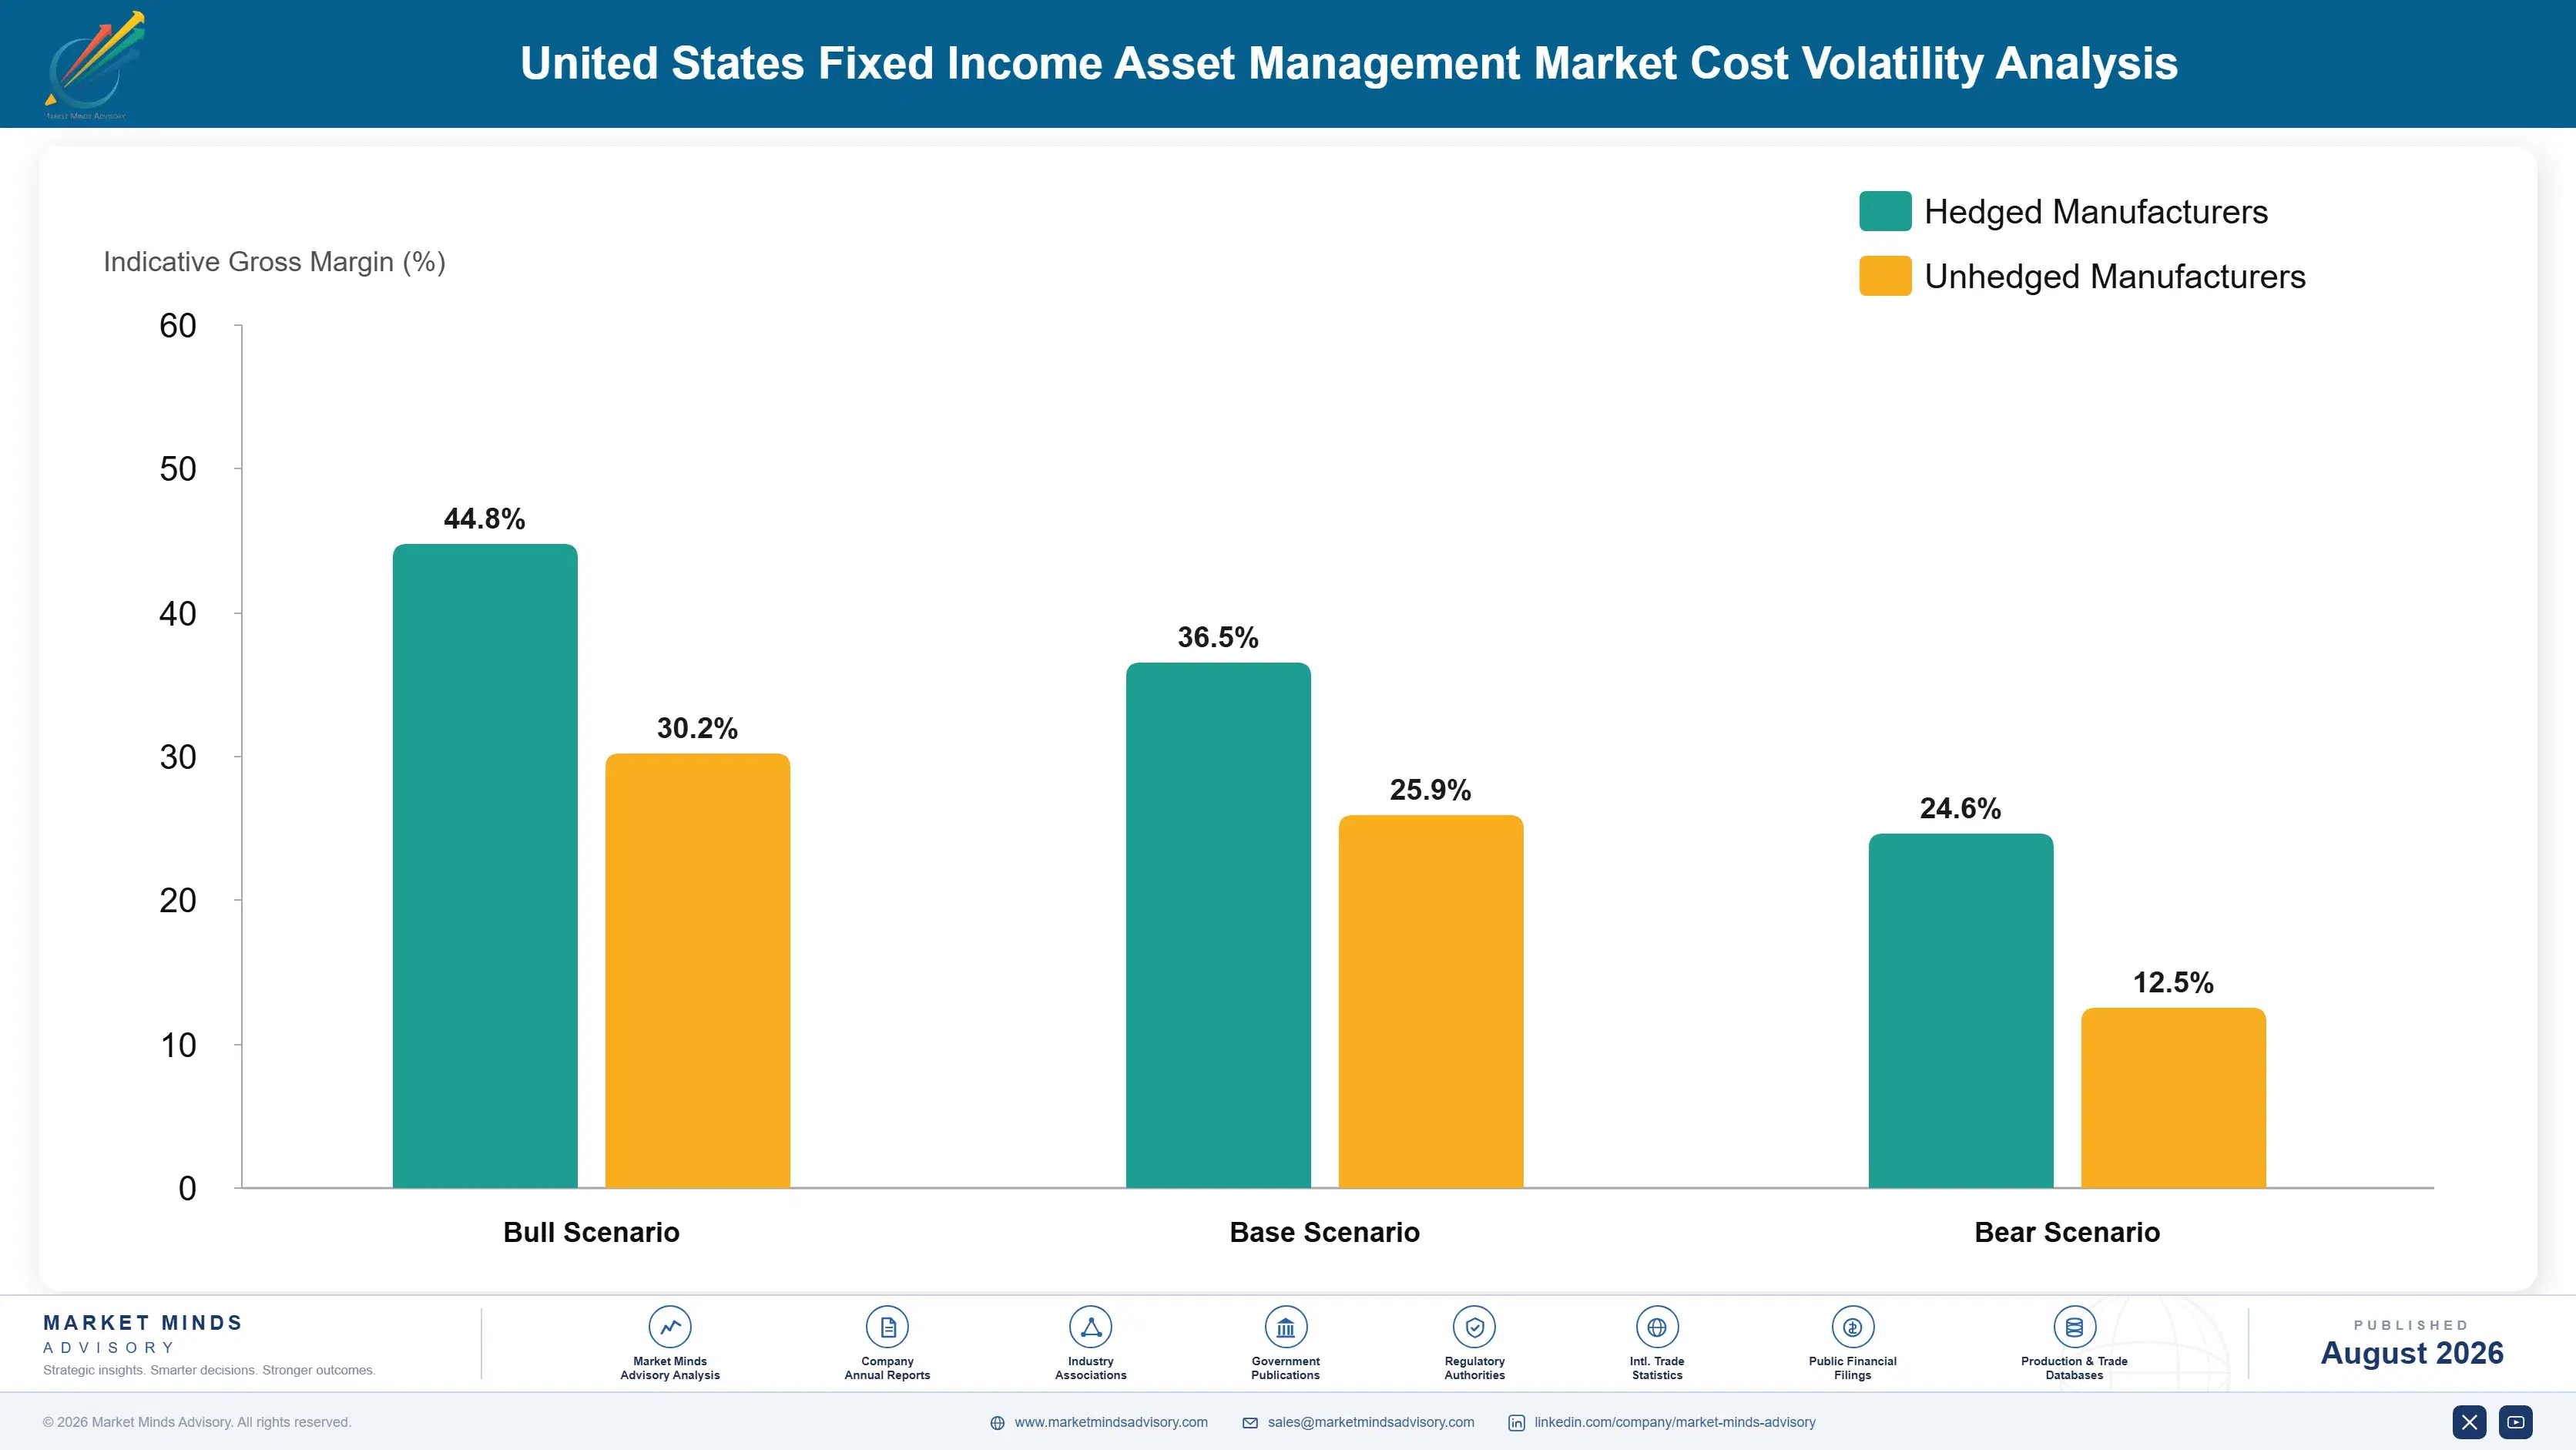
Cost divides into four components that scale very differently with assets. Investment personnel, covering portfolio managers, credit analysts and traders, absorb roughly 41% of operating cost and scale with sector coverage rather than with assets managed. Technology, data and analytics run near 24%, distribution and client service near 21%, and operations with compliance account for the remaining 14% at a large manager.
The 2022 drawdown demonstrated how badly the cost base behaves when assets fall. Portfolio values dropped sharply, fee revenue fell with them since fees are charged on assets, and none of the investment, technology or compliance cost reduced at all. BlackRock and Franklin Resources both disclosed compressed operating margins across that period in their annual reporting. Managers who added sector analysts during the preceding expansion carried that cost through a year with no revenue.

Exposure varies by strategy mix and it decides who survives compression. Core and government managers carry lighter research cost and the sharpest fee pressure, an uncomfortable pairing. Securitised and municipal specialists carry heavier analyst cost against fees that have held up. Separate account managers absorb tax lot administration expense pooled funds avoid, and that cost scales with account count rather than assets.
united-states-fixed-income-assets-management-indus-cost-volatility-analysis-1787938845871

Shared research coverage across vehicle structures

The same credit analysis supports a mutual fund, an exchange traded fund, a collective trust and separate accounts, so research cost should be allocated across all of them rather than duplicated by vehicle. Managers running separate teams by wrapper carry expense competitors do not. Consolidating coverage is organisationally uncomfortable and financially obvious to anybody examining the numbers.

Offshore analytics and reporting with retained investment staff

Performance reporting, reconciliation, portfolio analytics and increasingly parts of credit research support move to Indian delivery centres at a fraction of domestic cost, while portfolio managers and senior analysts stay onshore. Most large managers already operate this split. It is a significant part of why operating margins survived a decade of fee compression without any revenue growth behind them.

Account administration scale before account growth arrives

Tax lot tracking, loss harvesting and state-specific customisation across thousands of accounts cost far less per account at scale than at low volume, so building the platform ahead of demand converts a variable cost into a fixed one. Managers who waited until clients asked are paying per account rates that make the business marginal at best.

Portfolio Architecture for Margin Defence

The portfolio separates by how completely an index can replicate the strategy, because that single question determines the fee. Core, core plus and government mandates form the volume layer: enormous assets, thin fees, and direct comparison against index products that do a passable job of the same thing. Managers hold them because they anchor institutional relationships and carry the assets that support everything else, not because the fee justifies the research behind them.
Margin concentrates where replication genuinely fails. Securitised credit, municipals and opportunistic credit all require underwriting that no benchmark weighting substitutes for, and fees have compressed least in exactly those places. The tension is that these strategies hold less capacity than core mandates do, so a manager cannot simply reallocate the whole business toward them without running out of investable opportunity within a few years.

The most valuable position is the least visible one. Separately managed accounts earn a lower fee per dollar than funds do, and they retain assets far longer because embedded gains and customisation make leaving genuinely expensive. Managers measuring only fee rate consistently undervalue that book, and several have discovered the difference the hard way.

Volume / Commodity-Adjacent

Core, core plus and government mandates competing directly against index products. Range spans six points because scale advantages differ enormously between the largest managers and those running the same strategy on a fraction of the assets.
Gross Margin: 18-24%

Premium / Certified

Investment grade credit and high yield mandates where security selection genuinely matters. Range spans eight points because research cost scales with sector coverage while fees scale with assets, so the two diverge sharply by manager size.
Gross Margin: 32-40%

Sustainability / Regulatory / Next-Generation

Securitised credit, municipal separate accounts and active exchange traded wrappers. Range spans twelve points because account administration cost and wrapper economics differ so completely that comparable strategies produce entirely unlike margins.
Gross Margin: 36-48%
united-states-fixed-income-assets-management-indus-portfolio-architecture-1787938846365

High-value Sub-segments and Strategic Watch-out

Securitised and Structured Credit

High value and high growth at 8.7%, protected by collateral underwriting no benchmark weighting can substitute for. The eight point range reflects the gap between managers holding genuine analyst depth and those buying the sector through third party research. Third party research is not the same thing.
Gross Margin: 40-48%

Municipal Separately Managed Accounts

High value with moderate growth at 7.2%, taking assets from funds because direct ownership permits security level loss harvesting. The eight point range separates managers with account administration scale from those paying per account rates. Per account rates make the whole business marginal remarkably quickly.
Gross Margin: 34-42%

Core and Core Plus Mandates

The volume core and the anchor for most institutional relationships in the market. Fees face the sharpest compression because index products approximate the strategy adequately, and every manager competes for the same allocations repeatedly. Nobody wins that particular competition on price for very long anyway.
Gross Margin: 22-28%

Money Market and Ultra-Short

The strategic watch-out rather than a growth pool. Assets swelled on elevated rates and liquidity fee rules pushed corporate cash toward government funds, so the book is large, low fee and entirely dependent on a rate cycle nobody controls. That rate cycle has turned once already.
Gross Margin: Variable

Why Bond Mandates Stay Put

Fee revenue arrives as a percentage of assets every quarter without any transaction taking place, which is the cleanest annuity structure in financial services. An institutional mandate awarded after a nine month search runs for years because replacing it means repeating the search, and consultants rarely recommend changes absent genuine underperformance. Net flows near 3.4% annually therefore sit on a base that persists regardless of any individual quarter.
Depth varies sharply by client type and structure. Corporate defined benefit plans move slowly and only through consultants. Insurance general accounts almost never move at all, because the mandate is embedded in regulatory capital modelling and asset liability matching. Separately managed account clients are stickiest of all, since embedded gains create a tax cost on leaving. Intermediated retail assets are the least attached, moving whenever a platform changes its recommended list.

Client profiles are shifting in ways that favour customisation over pooling. Wealthy households increasingly want portfolios reflecting their own tax position and state of residence rather than a national fund's average. Institutions increasingly want a specific sector sleeve rather than a broad mandate. Managers built around pooled vehicles serve neither preference well, and rebuilding around accounts takes years nobody has spare.
united-states-fixed-income-assets-management-indus-end-use-penetration-index-1787938846854

Where Bond Managers Should Invest

These are among the four positions where our research anticipates prominent divergence between winners and laggards over the coming forecast period. Each is grounded in the demand model, the regulatory perimeter, and the announced capacity pipeline.
01 / SECTOR CAPACITY ALLOCATION

Move research capacity where the index genuinely fails

Fee compression has landed hardest where replication works adequately, so shifting research and risk capacity toward securitised credit, municipals and opportunistic sectors protects revenue far more reliably than any pricing decision available to anybody. Securitised strategies carry fees 18 to 30 basis points above core mandates and have compressed least of anything anywhere in this market. The constraint is capability rather than intent, since underwriting collateral behaviour needs analysts a core team does not employ and genuinely cannot hire quickly.
02 / ACCOUNT ADMINISTRATION SCALE

Build the account platform before clients start asking

Separately managed accounts already hold 31% of all assets and municipal money is moving fastest, but the operational demands are substantial: security level tax lot tracking, harvesting across thousands of accounts and state-specific customisation that no pooled fund has ever required. Retention on accounts runs roughly 40% above comparable funds because embedded gains make leaving genuinely expensive for the client. The platform costs perhaps 8 to 12 million dollars to build properly and cannot be assembled once the demand has actually arrived.
03 / WRAPPER SELF CANNIBALISATION

Launch the cheaper vehicle before somebody else does

An active exchange traded fund run by the same portfolio manager at half the mutual fund fee cannibalises existing revenue, which is exactly why so many managers hesitated and why several of them then lost those assets anyway. The arithmetic strongly favours acting: retaining an asset at 30 basis points beats losing it entirely at 60 basis points instead. The genuinely uncomfortable part is explaining to a board that revenue per dollar will now fall deliberately and entirely by design.
04 / INSTITUTIONAL PRICING SEPARATION

Stop benchmarking mandate fees against retail wrappers

Publishing one fee philosophy across institutional and retail channels invites the largest clients to benchmark themselves against the cheapest wrapper on offer, and sovereign and pension mandates already negotiate some 10 to 15 basis points below the blended average. Pricing institutional work against capacity, customisation and servicing intensity instead of that protects roughly 6% of total revenue that otherwise gets negotiated away entirely. It requires discipline in a meeting where the client arrives holding an exchange traded fund fact sheet.

Engagement Snapshot From the Field

A live engagement with an industry participant carrying material or product regulatory and market exposure ahead of a defining policy shift, showing how our research translates into a defensible multi-year portfolio strategy.
MARKET MINDS ADVISORY · CLIENT ENGAGEMENT SUMMARY
United States Fixed Income Asset Management Producer Strategic Portfolio Review and Transition Roadmap 2026·Investment Scenario on United States Fixed Income Asset Management Exposure Evaluation 2025-26
CLIENT PROFILE
A United States fixed income specialist managing core, core plus and investment grade credit mandates for corporate pension plans, insurance clients and intermediated retail wealth. The firm had held assets broadly flat for four years while fee revenue declined every year, and management attributed the gap to industry-wide compression rather than to anything specific about its own strategy mix or vehicle lineup.
STRATEGIC CHALLENGE
The board needed to understand whether revenue could be defended without winning new assets, given that flows were roughly neutral and the fee decline was accelerating. It also faced a decision on active exchange traded funds that split the executive team, since launching would cannibalise existing mutual fund revenue while declining risked losing those same assets to competitors who had already launched.
MMA APPROACH
MMA decomposed four years of fee revenue by strategy, vehicle and client type, separating compression on retained assets from mix shift and from outflows. Expert interviews with intermediary platforms, institutional consultants and account administration providers established what fee levels each channel would genuinely accept and what account infrastructure was obtainable at the firm's scale.
KEY FINDINGS
  1. Fee decline came almost entirely from compression on retained assets rather than from outflows, so no amount of new business at current pricing would have reversed it.
  2. Core and government mandates generated 61% of assets and 34% of revenue, while carrying research cost nearly identical to the credit strategies earning materially more.
  3. The firm held no securitised credit capability at all, despite institutional consultants naming it in searches the firm had been excluded from over the preceding two years.
  4. Separately managed account assets were administered through a third party at per account rates that made the municipal business marginal above a few thousand accounts.
CLIENT PROFILE
A United States fixed income specialist managing core, core plus and investment grade credit mandates for corporate pension plans, insurance clients and intermediated retail wealth. The firm had held assets broadly flat for four years while fee revenue declined every year, and management attributed the gap to industry-wide compression rather than to anything specific about its own strategy mix or vehicle lineup.
STRATEGIC CHALLENGE
The board needed to understand whether revenue could be defended without winning new assets, given that flows were roughly neutral and the fee decline was accelerating. It also faced a decision on active exchange traded funds that split the executive team, since launching would cannibalise existing mutual fund revenue while declining risked losing those same assets to competitors who had already launched.
MMA APPROACH
MMA decomposed four years of fee revenue by strategy, vehicle and client type, separating compression on retained assets from mix shift and from outflows. Expert interviews with intermediary platforms, institutional consultants and account administration providers established what fee levels each channel would genuinely accept and what account infrastructure was obtainable at the firm's scale.
KEY FINDINGS
  1. Fee decline came almost entirely from compression on retained assets rather than from outflows, so no amount of new business at current pricing would have reversed it.
  2. Core and government mandates generated 61% of assets and 34% of revenue, while carrying research cost nearly identical to the credit strategies earning materially more.
  3. The firm held no securitised credit capability at all, despite institutional consultants naming it in searches the firm had been excluded from over the preceding two years.
  4. Separately managed account assets were administered through a third party at per account rates that made the municipal business marginal above a few thousand accounts.
RECOMMENDED STRATEGY
Phase 1: Phase one: launch active exchange traded wrappers for the two largest credit strategies, accepting revenue per dollar decline in exchange for retaining assets at all. Phase 2: Phase two: recruit a securitised credit team and build the sector capability that consultants had repeatedly identified as the reason for exclusion. Phase 3: Phase three: bring account administration in house and reprice the municipal business against the cost structure that scale actually produces.
OUTCOME
The client reported fee revenue stabilising within four quarters and rising 3.1% in the fifth (client-reported, unverified by MMA), with exchange traded wrapper assets retaining flows that had previously been leaving. Securitised capability produced two consultant search shortlistings within a year. Account administration cost per account fell by roughly half after the platform moved in house.

Frequently Asked Questions

Foundational context covering the market sizes, CAGR, scope, country, region and competition that inform every finding below. This section is provided to cover basics and most often pre-purchase conversations, answered from the MMA Primary Research Dataset.

What is the current size of the United States Fixed Income Asset Management Market?

The market is valued at USD 38.5 billion in 2025, measured as management and advisory fee revenue earned on fixed income assets managed for United States clients across all vehicle types.

How large will the United States Fixed Income Asset Management Market be by 2036?

MMA forecasts USD 71.57 billion by 2036, up from USD 40.73 billion in 2026. That represents incremental revenue of USD 30.84 billion and an expansion multiple of 1.76 times.

What is the CAGR for the United States Fixed Income Asset Management Market 2026 to 2036?

The base case CAGR is 5.8%, with a bull case of 7.0% and a bear case of 4.6%. Retirement demographics and securitised credit growth supply most of that expansion.

Which segment is growing fastest?

Securitised and structured credit grows at 8.7%, half again the market rate of 5.8%. It resists indexing more completely than any other fixed income sector does.

Who are the major companies in the United States Fixed Income Asset Management Market?

PIMCO, BlackRock, Vanguard, Fidelity Investments and Capital Group lead on fixed income assets and fee revenue, holding around 42% between them right across the whole market.

Which country is growing fastest?

India grows fastest at 7.8%, reflecting expanding analytics, reporting and research support operations run for American managers. No fee revenue is earned there at all.

Report Segmentation Architecture

The full report scope spans multiple orthogonal segmentation dimensions, with cross-tabulated demand data provided for each dimension pair. Coverage extends further to regional breakdowns, trend trajectories, and the competitive detail needed to support segment-level decision-making.

By Fixed Income Strategy

  • Core and Core Plus
  • Government and Agency
  • Investment Grade Credit
  • High Yield and Bank Loans
  • Municipal Bonds
  • Securitised and Structured Credit

By End-Use Industry

  • Corporate Defined Benefit Plans
  • Public Pension Systems
  • Insurance General Accounts
  • Retail Intermediated Wealth
  • Endowments and Foundations
  • Corporate Treasury and Cash

By Commercial Dimension

  • Mutual Fund Distribution
  • Exchange Traded Fund Wrappers
  • Separately Managed Accounts
  • Collective Investment Trusts
  • Institutional Segregated Mandates
  • Model Portfolio Delivery

By Region

  • North America
  • Western Europe
  • East Asia
  • South Asia and Pacific
  • Latin America
  • Middle East and Africa
  • Eastern Europe

Scope, Methodology, and Coverage

Every figure in this report is reproducible from documented input assumptions. The scope below maps the historical period, the forecast horizon, the segmentation dimensions, and the countries covered, alongside the underlying primary and qualitative methodology.
Historical Period
2020 to 2025
Forecast Period
2026 to 2036
Base Year
2025 (USD billions; MMA Primary Research Dataset, August 2026)
Market Definition
Management and advisory fee revenue earned on fixed income assets managed for United States clients, spanning core and core plus, government and agency, investment grade credit, high yield and bank loans, municipal bonds and securitised credit, delivered through mutual funds, exchange traded funds, collective investment trusts, separately managed accounts and institutional segregated mandates. Performance fees on private credit and direct lending vehicles, securities lending revenue, custody, intermediary distribution and platform fees, and all equity or multi-asset mandates are excluded.
Quantitative Units
USD billions, management and advisory fee revenue
Segmentation Dimensions
Fixed income strategy, end-use client industry, commercial vehicle dimension, region
Regions Covered
North America, Western Europe, East Asia, South Asia and Pacific, Latin America, Middle East and Africa, Eastern Europe
Countries Covered
United States, with client capital and operating exposure across Western Europe, East Asia, Middle East and Africa, and South Asia and Pacific
Key Companies Profiled
PIMCO, BlackRock, Vanguard, Fidelity Investments, Capital Group, JPMorgan Asset Management, Franklin Templeton, Invesco, Nuveen, DoubleLine Capital
Quantitative Methodology
Primary survey, n=3,800 respondents, Q4 2025, six countries; demand-side model with trade association cross-validation
Qualitative Methodology
47 expert interviews, Q4 2025; applied to validate demand model assumptions, identify emerging dynamics, and assess competitive positioning
Report Format
PDF and XLSX data workbook (Word format preview document)
Publisher
Market Minds Advisory
Report Code
MMA-2026-TEC-421
Published
August 2026
Contact
sales@marketmindsadvisory.com | www.marketmindsadvisory.com

Purchase the full United States Fixed Income Asset Management Market Report (2026 to 2036).

The full report explains why fixed income fees survived a decade that destroyed equity fee levels, and shows exactly where that protection is now failing. It decomposes fee revenue by strategy, vehicle and client type, separating compression on retained assets from mix shift and from genuine outflows. Segment analysis covers all six strategies with particular attention to securitised credit, the sector that resists indexing most completely and has compressed least. Competitive assessment ranks twenty managers on fixed income assets and attributable fee revenue. Regional coverage addresses client capital, sovereign mandates and offshore operations as genuine influences on domestic economics.
Six strategy segmentation with growth rates
Fee compression separated from mix shift
Twenty manager assessment on fee revenue
Account administration cost against fund economics
Active wrapper cannibalisation arithmetic by strategy
Research cost allocated across vehicle structures

Built For The People Who Decide

From boardroom strategy to bench-side execution, this report is read cover-to-cover by leaders shaping the next decade of their industry, turning demand scenarios, market dynamics and valuation benchmarks into decisions.
CXOs/ Presidents/ VPs/ Managers
M&A and Corporate Development
Strategy Teams and R&D Heads
Procurement and Product Directors
Regulatory and Compliance Leaders
Investor Relations and Equity Analysts