Market Minds Advisory
Demand for Fitness Apps in USA

Demand for Fitness Apps in USA: Demand for Fitness Apps in USA. Wearable-Integrated Tracking and On-Demand Workout Platforms

Wearable device proliferation and employer wellness benefit expansion are pushing fitness app usage beyond standalone workout tracking into integrated recovery, nutrition, and corporate health platforms across most demographic segments nationwide.

Lead Analyst

Published

September 2026

Make Smarter Decisions with Customized Research Insights

Request a free sample report and evaluate market opportunities, growth trends, and competitive dynamics relevant to your business needs.

2025 MARKET VALUE$2.1BMarket Size 2025
2036 FORECAST VALUE$6.3BBase Case , 2026 to 2036
CAGR 2026 TO 203610.5 %Bull 11.8% / Bear 9.2%
INCREMENTAL OPPORTUNITY$4.0BNet 10- year value creation
EXPANSION MULTIPLE2.71x2036 value over 2026 base
Strategic Levers
M&A Pipeline
Regional Outlook
Country Rankings
Competitive Intelligence
Segmental Deep-dive
Call-Us : 91 93563 13602

Executive Snapshot and Market Trajectory.

Wearable device proliferation and employer wellness benefit expansion are pushing fitness app usage beyond standalone workout tracking into integrated recovery, nutrition, and corporate health platforms across most demographic segments currently nationwide. Employers now request quantified engagement outcomes before approving broader corporate wellness benefit budget expansion across most large organizations nationwide.
Consumers increasingly expect fitness apps to synchronize automatically across wearable devices, connected equipment, and nutrition tracking rather than operating as isolated single-function tools, since fragmented app usage genuinely reduces sustained engagement and subscription retention. Wearable-integrated tracking and on-demand workout streaming together account for the majority of total fitness app subscription revenue currently generated nationwide. Consumers increasingly treat app subscription decisions as a long-term health investment rather than a purely discretionary fitness purchase.
Competitive dynamics favor established platforms with existing wearable device partnerships over newer standalone workout-only entrants, since consumers increasingly demand unified health data visibility rather than isolated fitness tracking. Employer wellness benefit program expansion is reshaping near-term platform specification priorities across most major corporate health and insurance markets nationally. Suppliers investing early in wearable partnership depth are positioned to capture share as integrated health data demand expands broadly.
Market Definition
The Demand for Fitness Apps in USA report covers mobile and connected applications that track physical activity, deliver workout content, and monitor recovery and nutrition for United States consumers. It excludes standalone wearable hardware devices and general telehealth consultation platforms.
Base Year Value
$2.1B in 2025 (MMA Primary Research Dataset, September 2026)
Forecast Period
2026 to 2036, eleven discrete annual values
CAGR
10.5% base case. Bull 11.8%. Bear 9.2%.
Fastest Growth Segment
Recovery and Sleep Optimization Apps: 16.8% CAGR
Fastest Growth Country
United States: 10.9% CAGR
Fastest Growth Region
South Asia and Pacific: 12.5% CAGR
Largest Region
North America: 32% of 2025 global value
Market Leaders
Peloton Interactive, Strava, MyFitnessPal, Fitbit, and Nike lead the market. Source: MMA Analysis, July 2026.
Primary Survey
n=3,800 procurement and R&D decision-makers, Q4 2025, six countries
Methodology
Demand-side build-up, cross-validated against public data, 47 expert interviews

Demand for Fitness Apps in USA Market Forecast Scenarios

united-states-fitness-apps-market-size-forecast-scenario-1788424606387
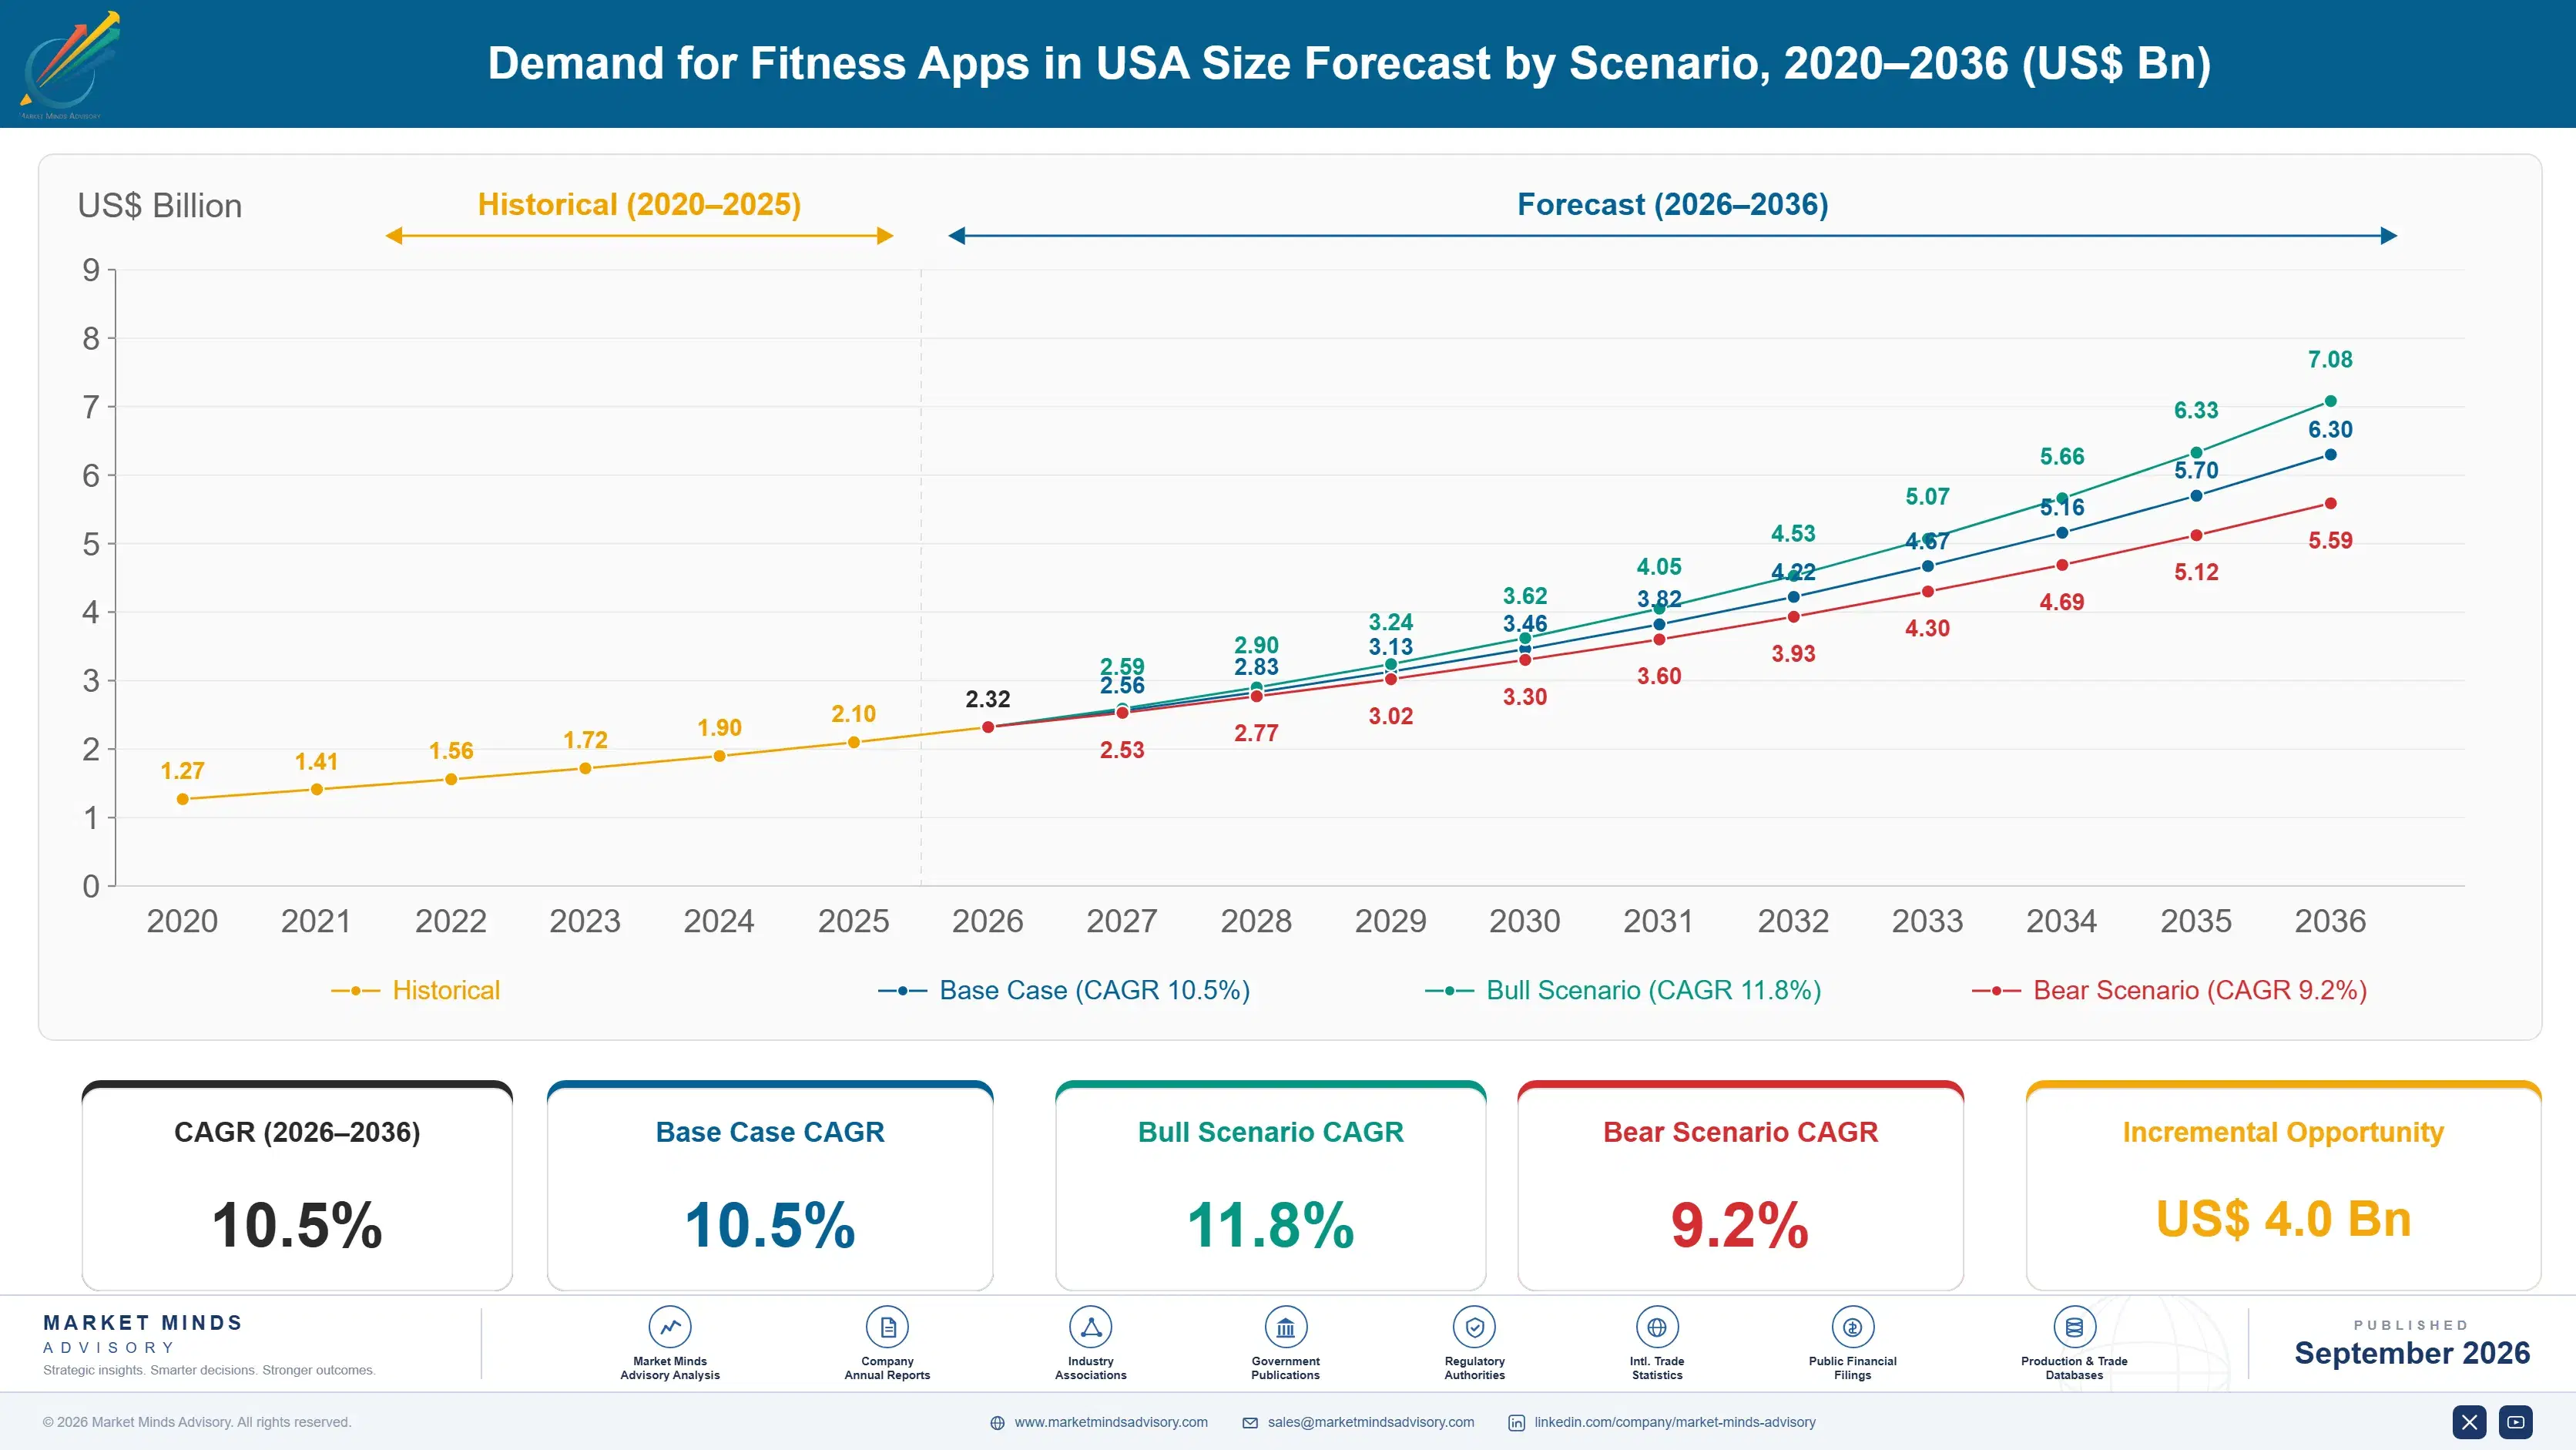
Between 2020 and 2025, fitness app demand grew steadily as pandemic-era home fitness adoption accelerated and consumers formed lasting digital workout habits across most demographic segments, with a historical CAGR near 9.5 percent driven largely by early connected fitness equipment app bundling programs. Growth moderated somewhat after 2022 as initial pandemic-driven adoption stabilized into steady renewal patterns across most established consumer segments.
The base case assumes continued wearable device integration expansion, growing employer wellness benefit program adoption tied to healthcare cost containment strategies, and rising consumer demand for unified recovery and nutrition tracking across most major demographic segments nationwide. These three mechanisms together sustain steady growth through 2036, reinforced by expanding artificial intelligence-driven personalized coaching capability and growing corporate wellness platform adoption across most major employer markets nationally. Vendors with strong wearable device partnerships capture disproportionate share of demand relative to standalone workout-only entrants.
A stronger bull case emerges if healthcare cost containment pressure accelerates employer wellness investment industry-wide, pulling forward subscription adoption meaningfully. The bear risk centers on consumer discretionary spending pullback, where a broader economic downturn would directly compress fitness app subscription renewals across households dependent on discretionary technology budgets rather than committed annual commitments. overall currently.

Wearable Integration Reshapes App Subscription Decisions

Consumers increasingly expect fitness apps to synchronize automatically across wearable devices and connected equipment rather than operating as isolated tracking tools, since fragmented data experiences genuinely reduce sustained subscription engagement. Vendors offering native cross-device data aggregation increasingly displace competitors relying on standalone tracking dashboards, since consumers now weigh unified health visibility more heavily than individual workout content quality alone during subscription renewal decisions.
MARKET CONCENTRATIONCR5 42%top five vendors hold notable but fragmented market share
AVERAGE SUBSCRIPTION PRICE$14typical monthly fitness app subscription spend range currently
WEARABLE INTEGRATION RATE56%share of users syncing app data with connected wearable devices
EMPLOYER BENEFIT ADOPTION34%share of large employers now offering fitness app subscription benefits
ANNUAL CHURN RATE38%typical share of subscribers who cancel within a given year
RENEWAL RETENTION RATE62%typical net subscriber retention among platform incumbents nationally
Employer wellness benefit programs continue gaining formal adoption as a healthcare cost containment strategy, though full engagement measurement across large distributed workforces remains genuinely challenging for benefits administrators to track accurately. This dynamic favors vendors with proven enterprise benefits administration integration over those relying primarily on individual consumer marketing, since large employer accounts increasingly require centralized reporting and utilization tracking across distributed workforces.
Retention-focused personalization is pulling investment toward vendors with proven machine learning coaching capability, a capability gap that favors established platforms over newer entrants lacking comparable behavioral data depth and history. This shift favors established platforms with existing behavioral data history over newer standalone entrants lacking comparable personalization depth, since consumers increasingly prefer apps that adapt meaningfully to individual fitness progression over generic content libraries.
"Nobody churns because the workouts got worse. They churn because the app stopped feeling like it knew them after week three."
Practice Lead, Consumer Health and Wellness Technology · MMA Consumer Health and Wellness Mobile Applications Practice · September 2026

Market Trends

Cross-Device Data Aggregation Becomes Subscription Standard

Fitness app users increasingly expect automatic data synchronization across wearable devices, connected equipment, and nutrition tracking rather than accepting fragmented single-purpose applications requiring manual data entry across multiple separate tools. Roughly 56 percent of users now sync app data with connected wearable devices, up meaningfully from levels reported just several years earlier as integration standards mature. Vendors offering native multi-device aggregation increasingly win competitive subscription retention against suppliers still relying primarily on standalone tracking requiring users to manually reconcile data across disconnected applications and devices. This shift continues broadly across most consumer demographic segments.
Market Impact: 41 percent cite containment as driver

Employer Wellness Benefits Expand Subscription Channels

Large employers increasingly formalize fitness app subscriptions as part of broader wellness benefit packages, treating employee health engagement as a genuine healthcare cost containment strategy rather than a discretionary perk offering. Roughly 34 percent of large employers now offer fitness app subscription benefits, reflecting genuine benefits program formalization rather than experimental pilot offerings alone. Vendors with established enterprise benefits administration integration increasingly win competitive evaluations against suppliers without comparable formal employer channel arrangements and utilization reporting capability for benefits administrators. This trend continues broadly across most large employer organizations and industries nationwide currently.
Market Impact: 37 percent increased spend for wearables

Market Opportunities and Growth Drivers

Healthcare Cost Containment Drives Employer Investment

Employers facing rising healthcare premium costs increasingly invest in preventive fitness benefit programs as a genuine cost containment strategy, treating employee engagement technology as a direct response to escalating group health insurance expenses across most industries and organization sizes. Roughly 41 percent of surveyed employers report healthcare cost containment as a primary driver behind recent wellness benefit investment decisions, a meaningfully higher share than reported five years earlier. Vendors with strong outcomes measurement and healthcare cost impact reporting capability increasingly win contracts among employers pursuing formal wellness program investment across competitive benefits markets.
Market Impact: 38 percent of subscribers cancel yearly

Wearable Device Proliferation Sustains App Engagement

Consumer wearable device adoption continues expanding across most demographic segments, directly sustaining fitness app subscription demand as device owners increasingly seek companion applications that translate raw sensor data into actionable coaching and recovery guidance. Roughly 37 percent of surveyed wearable device owners report increasing fitness app subscription spend specifically to complement device data, reflecting a genuine and lasting shift in consumer health technology behavior. Vendors with strong device data interpretation and personalized coaching capability increasingly win subscriber evaluations over generic workout content libraries lacking comparable device integration depth. Growth continues here.
Market Impact: 29 percent cite free alternatives

Market Restraints and Challenges

High Subscription Churn Constrains Revenue Predictability

Fitness app vendors routinely encounter genuinely high subscriber churn rates as initial motivation fades within the first few months of subscription, making sustained revenue predictability genuinely difficult compared with subscription categories exhibiting stronger habitual engagement patterns. The root cause traces to well-documented behavioral patterns around exercise motivation decay, not vendor product quality specifically. Roughly 38 percent of subscribers cancel within a given year, representing a persistent industry-wide retention challenge. Some vendors are pursuing habit-formation coaching features to address this churn pattern directly. This friction eases gradually across most subscriber segments over time.
Market Impact: 56 percent sync data with wearables

Free Alternative Content Limits Premium Conversion

Many consumers access substantial free workout content through social media platforms and basic wearable device applications, extending reliance on no-cost alternatives and delaying premium subscription conversion for vendors dependent on broader paid subscriber penetration. The underlying cause traces to genuinely abundant free content availability, not vendor pricing specifically. Roughly 29 percent of surveyed non-subscribers report free alternatives as the primary barrier preventing premium subscription conversion in the past year. Some vendors are introducing freemium tiers to capture this price-sensitive segment. This trend continues broadly across most price-sensitive consumer segments nationwide today.
Market Impact: 34 percent of employers offer benefits
4 additional market trends, 3 additional growth drivers, and 3 additional restraints and challenges are covered in the full report. Contact sales@marketmindsadvisory.com to access the complete intelligence.

Segment CAGR and Growth Architecture

The market spans six app categories organized by primary function, from wearable-integrated tracking through recovery and sleep optimization tools. Adoption pace varies sharply by category as employer wellness expansion and device integration reshape which segments see the fastest growth. Vendors increasingly design roadmaps around this functional divide rather than treating data personalization depth as a secondary specification decision.
Section default visual

Recovery and Sleep Optimization Apps

This segment covers applications that monitor sleep quality, heart rate variability, and recovery readiness using wearable device sensor data, directly addressing the growing consumer recognition that recovery genuinely matters as much as active workout intensity for sustained fitness progress. Adoption is concentrated among wearable device owners pursuing serious training programs, where recovery tracking increasingly informs daily workout intensity decisions rather than functioning as passive background monitoring. Growth is outpacing every other segment as wearable device sensor accuracy improves and consumer recovery awareness continues expanding across most demographic segments. Vendors here compete heavily on data interpretation depth rather than raw sensor accuracy alone. Program adoption is accelerating fastest among wearable owners with the most consistent daily usage patterns nationally.
CAGR 16.8%

Corporate Wellness and Employer-Sponsored Apps

This segment covers fitness applications distributed through formal employer wellness benefit programs, incorporating enterprise features including centralized reporting, utilization tracking, and healthcare cost impact measurement that consumer-only applications typically lack entirely. Adoption is concentrated among large employers pursuing formal healthcare cost containment strategies, where preventive engagement genuinely reduces long-term group insurance premium costs at meaningful organizational scale. Employers increasingly treat wellness app benefits as a genuine cost management tool rather than a discretionary employee perk offering. Growth here trails only recovery apps, reflecting similarly strong outcomes-driven demand momentum. Suppliers investing early in enterprise reporting depth are positioned to capture disproportionate share as employer wellness adoption continues expanding across most major industries and organization sizes nationally.
CAGR 13.5%
Full segment breakdown across 6 segments available in the complete report.

Regional Architecture and Country Demand Map

North America anchors global demand given this report's United States focus and the scale of domestic wearable device adoption and employer wellness spending nationwide. South Asia and Pacific expands fastest as regional smartphone penetration and health awareness accelerate across growing urban populations. East Asia follows closely behind.

North America

The United States drives the overwhelming majority of regional demand, reflecting this report's explicit domestic focus and substantial wearable device penetration alongside a large employer base increasingly offering formal wellness benefit programs. Federal healthcare cost containment incentives and state-level workplace wellness initiatives sustain steady demand across most employer categories nationwide, while consumer wearable adoption continues expanding across most demographic and income segments. Canada contributes a smaller but steadily growing share through comparable wearable adoption and employer wellness investment patterns. This concentration justifies North America's position at the top of its regional band given the report's United States-centered scope. Provincial funding programs continue supporting this steady growth. Enterprise buyers also increasingly favor domestic support networks.
Share: 32% | CAGR: 10.9% (2026 to 2036)

Western Europe

Germany, the United Kingdom, and France drive the bulk of regional demand, with national health technology adoption and employer wellness programs paralleling trends observed in the United States market though formal benefit program penetration remains somewhat less mature. Growth trails North America and East Asia somewhat, reflecting more conservative employer benefits budgets and correspondingly slower formal wellness program adoption across most established organizations. Nordic countries show disproportionately high per-capita adoption relative to population size, reflecting strong public health technology investment. European Union workplace wellness initiatives continue supporting steady baseline demand across member states broadly. Corporate wellness adoption continues expanding steadily across most major metropolitan business districts. Multinational corporate headquarters standardize procurement across subsidiaries.
Share: 21% | CAGR: 9.0% (2026 to 2036)
Regional intelligence for 5 additional markets available in the complete report: East Asia, South Asia and Pacific, Latin America, Middle East and Africa, Eastern Europe. Contact sales@marketmindsadvisory.com.
united-states-fitness-apps-market-market-share-analysis-1788424606927

Where Fitness App Vendors Can Defend Margin

Vendors face mounting pressure to prove engagement value as consumers scrutinize subscription costs more closely than in prior technology adoption cycles. Four commercial levers separate vendors sustaining premium pricing from those competing purely on price and basic tracking feature parity alone across most segments. Cross-device integration depth remains the biggest differentiator separating durable winners from commodity competitors.

Deepen Cross-Device Data Aggregation Investment Broadly

Vendors investing in mature cross-device data aggregation capture disproportionate share of the 56 percent of users now syncing wearable data, since unified health visibility directly addresses the fragmentation concerns dominating early platform evaluations. This capability commands measurable pricing premiums over vendors offering only standalone tracking during competitive subscription decisions. Vendors slow to build this depth risk losing large subscriber segments entirely to better-positioned competitors with proven integration accuracy track records across comparable wearable device categories. Consumers evaluating multiple apps increasingly treat integration depth as a baseline requirement rather than a differentiating premium feature.
Market Impact: Captures share of the 56 percent syncing data

Build Formal Employer Benefits Integration Capability

Vendors establishing formal employer benefits administration integration address the 34 percent of employers now offering this benefit, positioning themselves ahead of competitors lacking comparable enterprise reporting arrangements. This differentiation increasingly determines which vendors win large employer contract awards during competitive evaluations. Vendors without established benefits integration struggle to match the reporting depth of competitors already integrated with major benefits administration platforms across comparable employer segments and industries. Enterprises evaluating multiple vendors increasingly weight demonstrated integration depth heavily during formal multi-year contract negotiations. Referrals within regional benefits networks amplify this reputation advantage further across most industries.
Market Impact: Addresses the 34 percent offering benefits directly now

Strengthen Personalized Coaching Analytics Capability Now

Vendors building strong personalized coaching capability address the 41 percent of employers citing healthcare cost containment as a primary driver behind wellness investment, capturing share from competitors offering only generic content without outcomes measurement functionality. This positioning increasingly determines procurement outcomes among employers pursuing formal cost containment strategies. Vendors building this capability expand addressable market meaningfully beyond consumer-only buyers toward broader healthcare and benefits strategy budgets. Employer wellness leaders increasingly involve themselves directly in these procurement decisions given the cost stakes involved. This trend is expected to strengthen as cost containment strategies mature across most large organizations.
Market Impact: Addresses the 41 percent citing containment directly now

Develop Habit-Formation Retention Features Broadly Now

Vendors offering dedicated habit-formation coaching features address the 38 percent of subscribers who cancel within a given year, reducing the churn friction that otherwise limits sustained subscription revenue predictability considerably. This support builds genuine platform stickiness that extends well beyond initial signup into sustained long-term engagement outcomes. Vendors building this capability expand addressable market among subscribers with prior failed fitness app experiences lacking dedicated motivation and accountability support structures. Smaller vendors increasingly favor building this capability during initial platform relationship evaluations and outreach. Word-of-mouth referrals amplify this advantage meaningfully across most demographic segments.
Market Impact: Addresses the 38 percent who cancel yearly now

Who Controls the Margin Pool

Market concentration sits at roughly 42 percent among the top five vendors on a revenue basis, reflecting a moderately fragmented field where established platform incumbents compete alongside numerous specialized recovery-only and corporate wellness-only point solutions. The gap between leaders and mid-tier challengers has narrowed as smaller vendors match feature parity on core tracking capability. This dynamic pressures margin across most competitive subscriber evaluations. New entrants face a genuine time disadvantage measured in years.
Current competitive activity centers on cross-device data aggregation, employer benefits integration, and personalized coaching capability, with most major vendors racing to close gaps in whichever dimension they trail competitors most visibly. Platform consolidation deals remain common as broader wellness technology vendors acquire smaller specialized recovery and coaching tools. Cross-device integration program awards remain the single most contested battleground among the field's largest established suppliers currently.

Emerging pressure comes from wearable device manufacturers extending directly into companion app subscription functionality, gaining share among consumers prioritizing unified device and app relationships over standalone software subscriptions. Rankings could shift meaningfully if device-native entrants successfully replicate content depth at comparable scale. This convergence could meaningfully reshape the competitive field over the coming several years as adjacent categories continue merging.
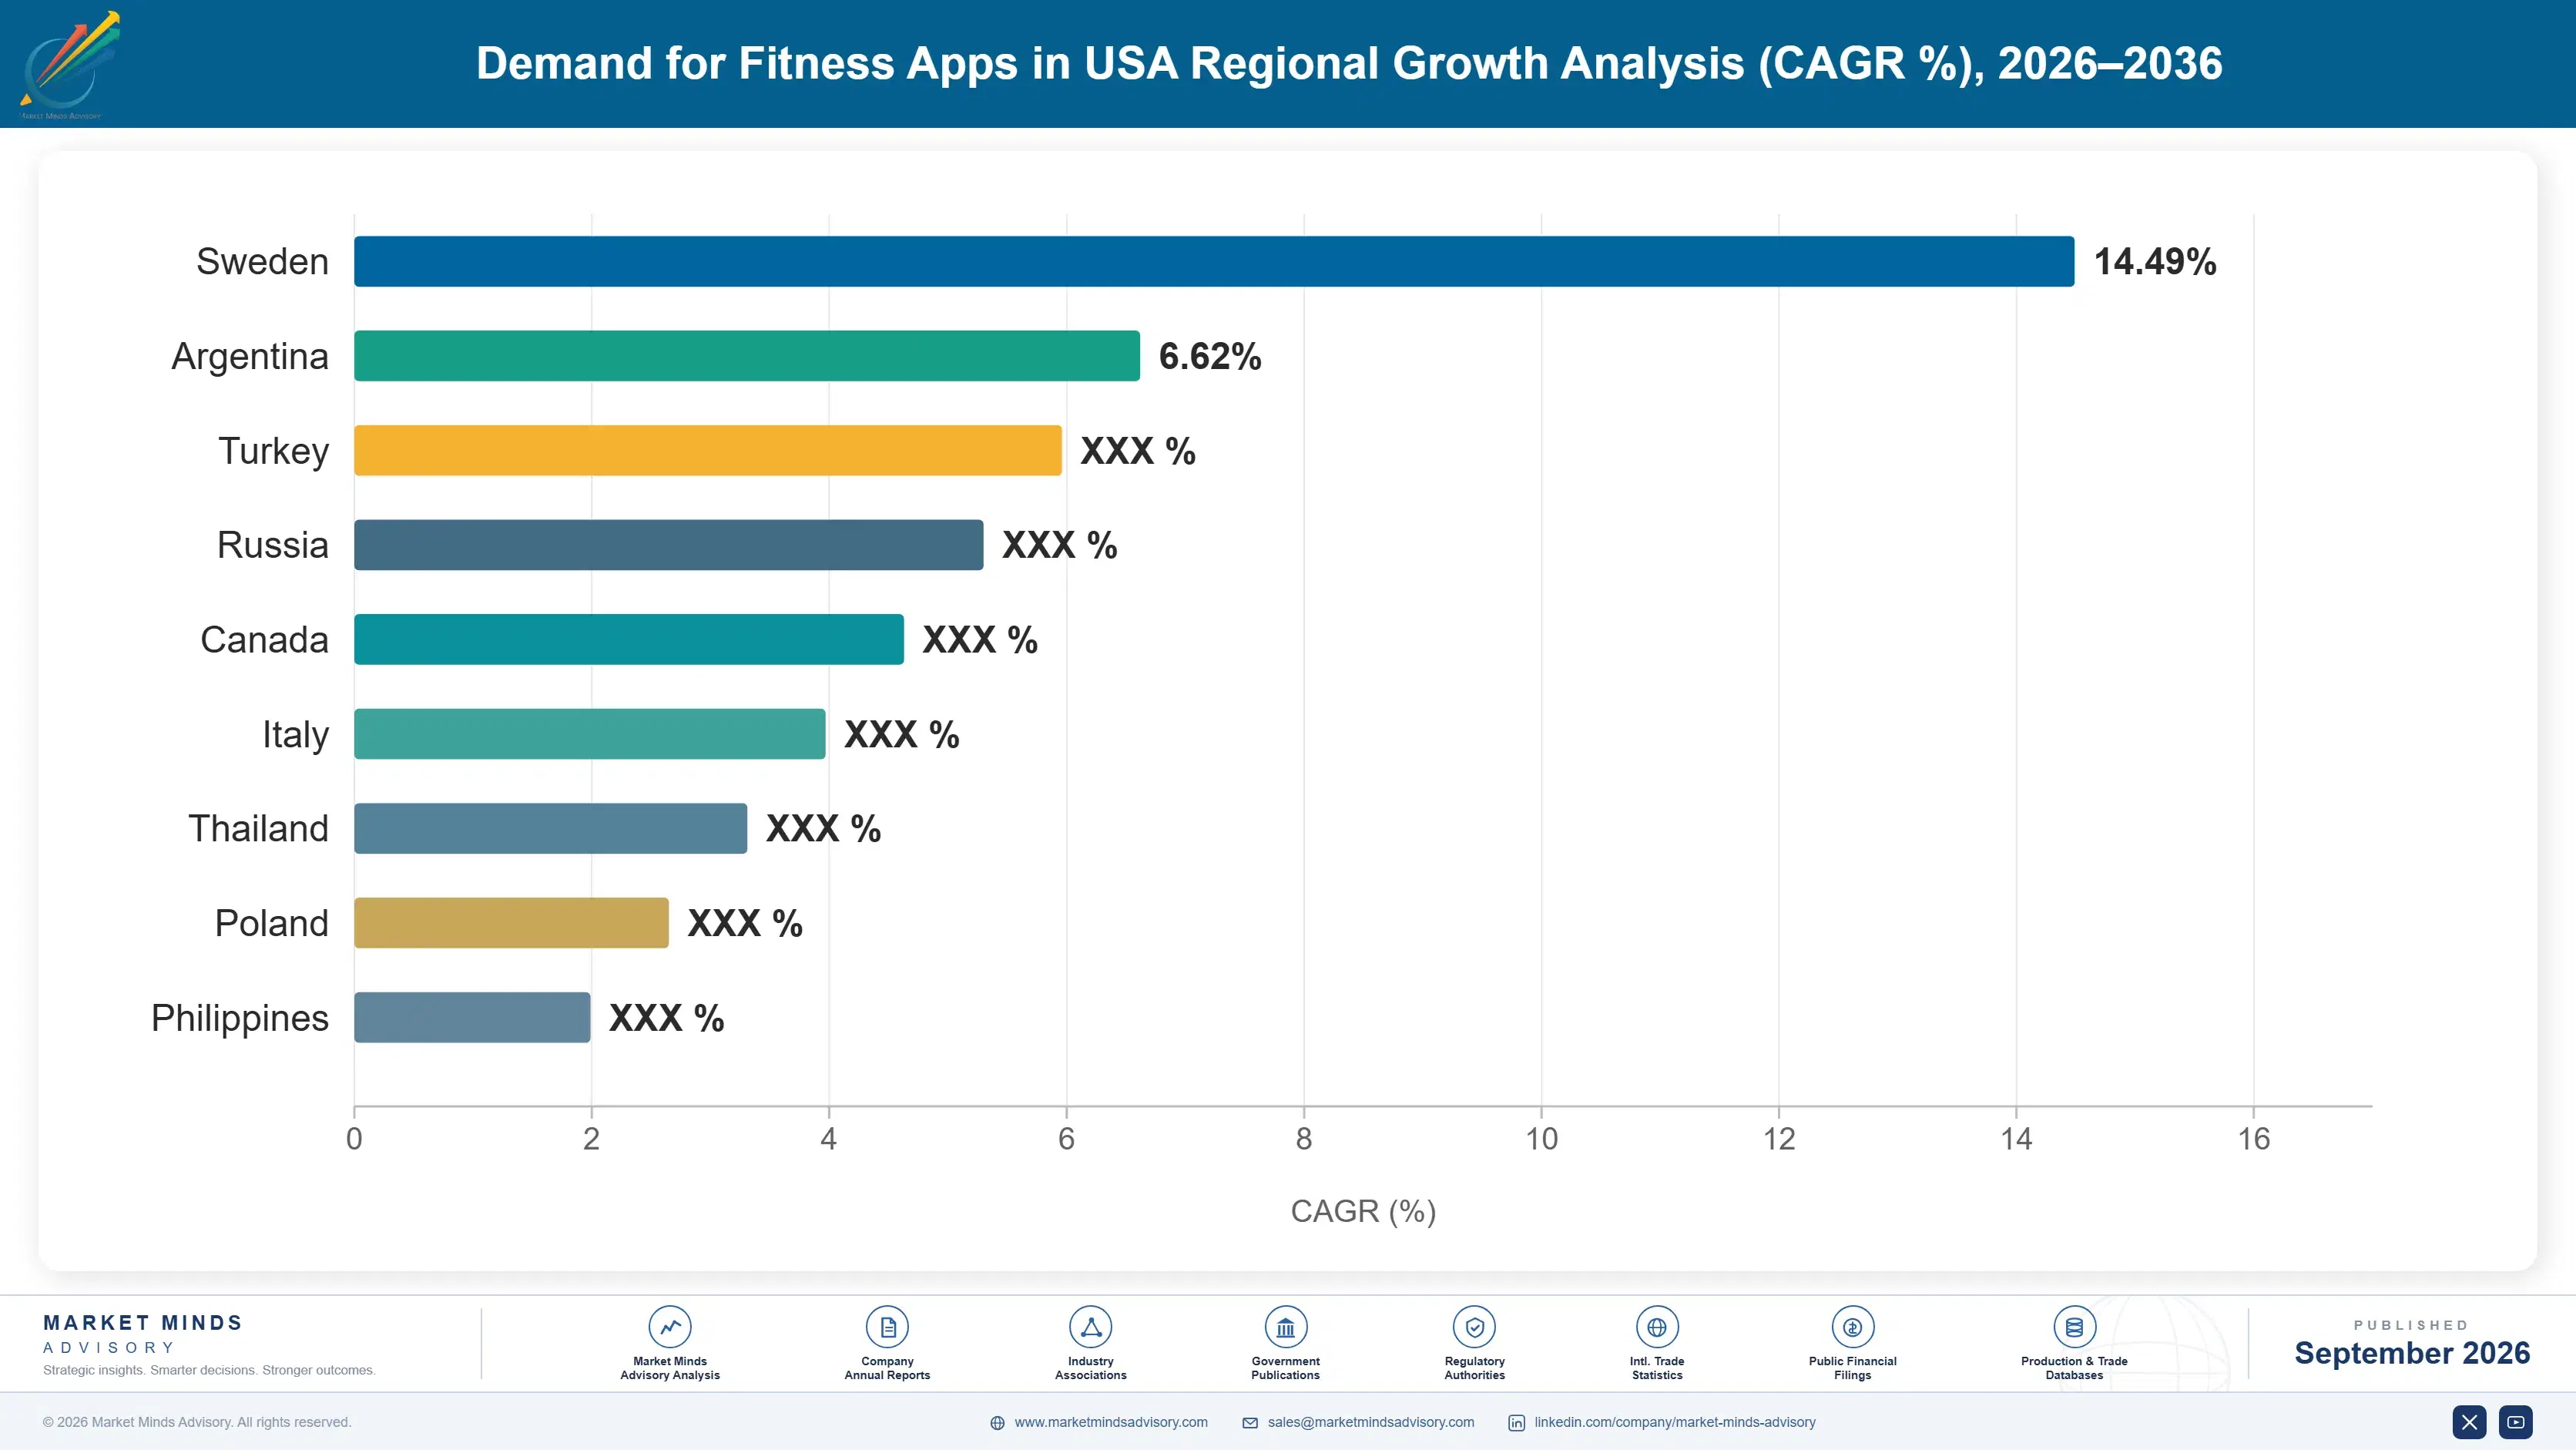
united-states-fitness-apps-market-country-cagr-analysis-1788424607447

Competitive Moat and Risk Dimensions

PELOTON INTERACTIVE

Moat: Deep Connected Equipment Integration

Peloton Interactive's tight integration between hardware equipment and app content gives it engagement advantages that standalone software-only competitors struggle to replicate, built over years of dedicated connected fitness product development. This breadth compounds into a durable advantage that competitors cannot shortcut through capital investment alone.
PELOTON INTERACTIVE

Risk: Hardware Dependency Limits Reach

Peloton Interactive's equipment dependency limits its addressable market relative to competitors offering hardware-agnostic subscriptions, particularly among cost-conscious consumers unwilling to invest in dedicated connected fitness equipment. Nimbler software-only competitors increasingly win price-sensitive evaluations before Peloton fully addresses this accessibility gap. Accessibility gaps remain a genuine strategic concern.
STRAVA

Moat: Strong Community Engagement Network

Strava's social and community engagement features, built over years of dedicated athlete community development, give it genuine retention depth that broader fitness platforms with less specialized social functionality struggle to match. This community depth increasingly determines competitive outcomes as consumers prioritize social accountability above nearly every other factor.
STRAVA

Risk: Limited Corporate Wellness Presence

Strava's consumer-focused positioning leaves it comparatively less integrated with formal employer wellness benefit programs that increasingly influence subscription decisions among enterprise-sponsored fitness app buyers. Competitors with established employer channels increasingly win enterprise accounts that Strava struggles to match. Diversifying into enterprise channels remains a genuine strategic priority.

Players Tracked

Prominent Players

Peloton Interactive
Strava
MyFitnessPal
Fitbit
Nike

Other Key Players

WHOOP
Apple
ClassPass
Freeletics
Aaptiv
Zwift
Tonal
JEFIT
Sworkit
Future
Ultrahuman
Ergatta
8fit
Noom
FitOn

Recent Developments

FEBRUARY 2026

Peloton Expands Recovery Tracking Features

Peloton Interactive announced expanded recovery and sleep tracking features integrating deeper wearable device data to help subscribers optimize training intensity based on recovery readiness scores. Observers view the expansion as reinforcing Peloton's position as the connected fitness leader. Industry analysts confirmed the feature rollout timeline.
Signal: Signals recovery tracking depth continues determining which vendors win subscriber retention. Rivals lacking comparable depth face a widening gap.
OCTOBER 2025

Strava Launches Employer Wellness Program

Strava introduced a new formal employer wellness benefit program targeting large corporate accounts pursuing healthcare cost containment strategies, building on its existing community engagement platform strength. The launch reflects continued investment in the fastest-growing subscription channel currently. Analysts view the launch as reinforcing Strava's community engagement leadership position.
Signal: Signals product investment continues concentrating around the fastest-growing subscription category. This category remains the field's most contested battleground currently.
MAY 2025

MyFitnessPal Acquires Coaching Analytics Startup

MyFitnessPal acquired a smaller personalized coaching analytics startup to strengthen its nutrition and training guidance product line ahead of an anticipated wave of healthcare cost containment technology requirements. The acquisition reflects growing supplier consolidation around specialized capability. The deal reflects growing demand for integrated personalized coaching functionality.
Signal: Signals consolidation is accelerating as platforms acquire specialized coaching capability directly. Expect further consolidation moves among mid-tier vendors soon.

Cloud Infrastructure and Content Production Exposure

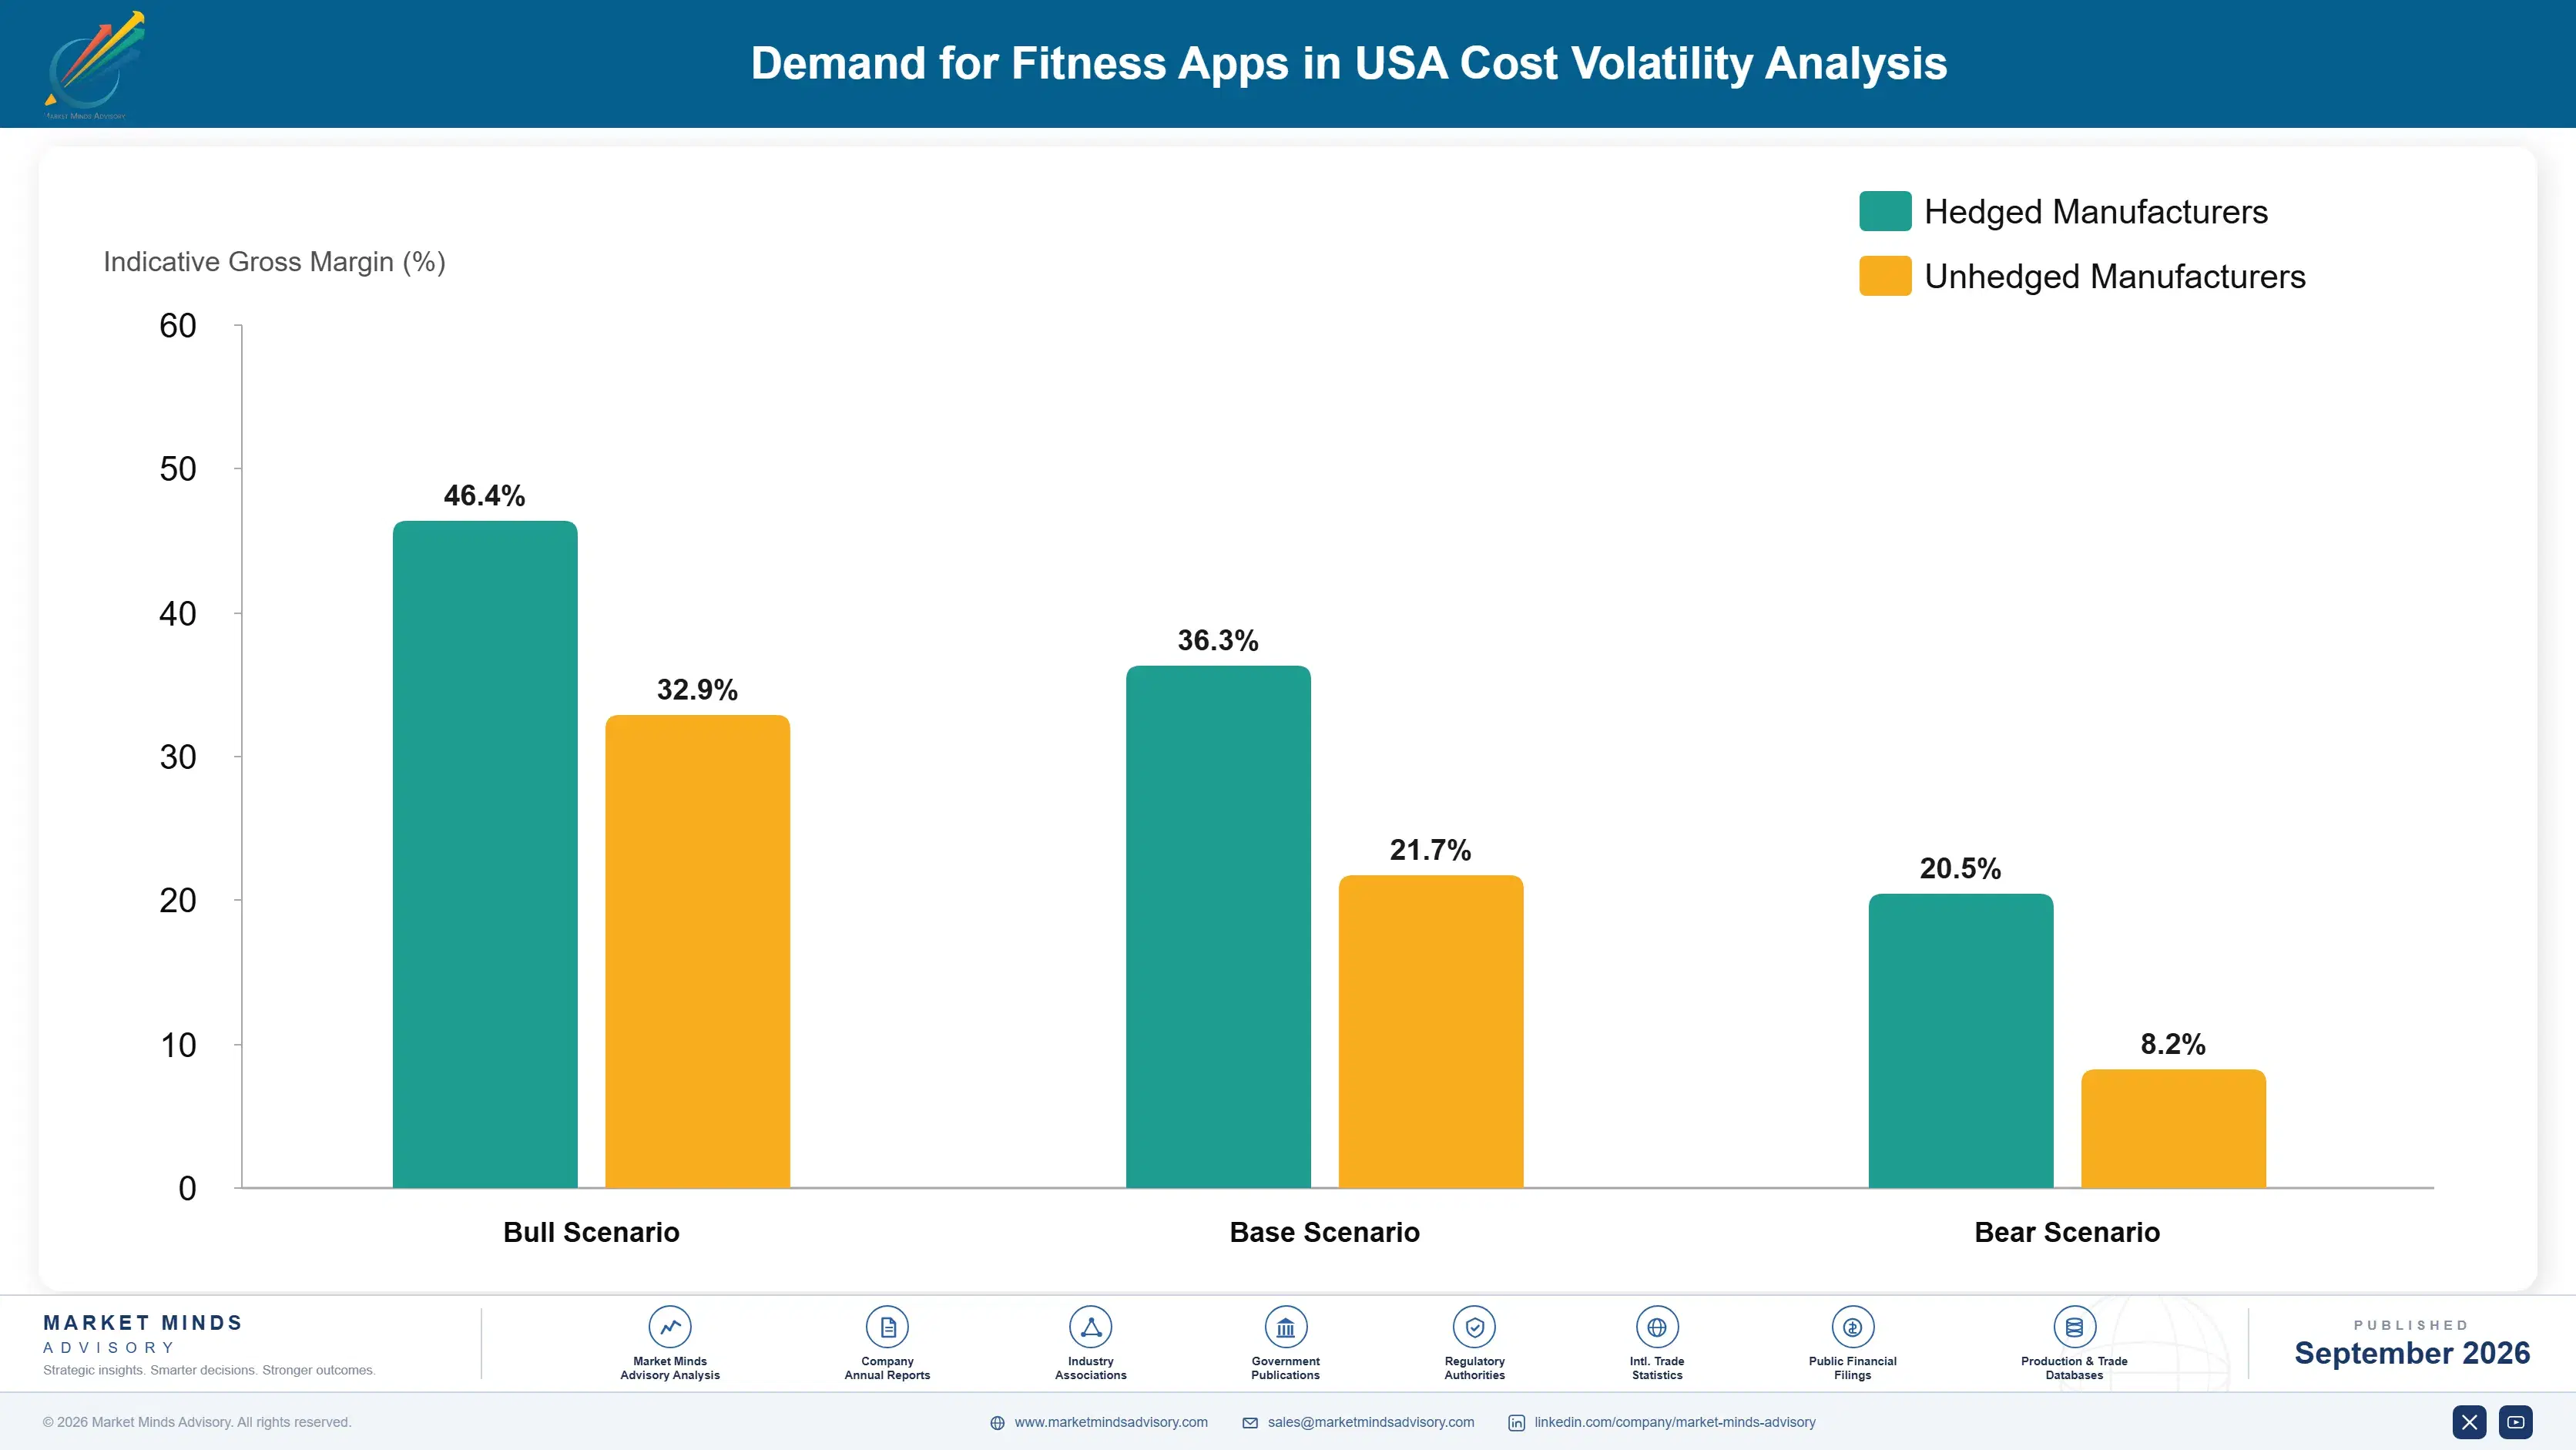
Cloud compute, storage, and video streaming delivery infrastructure represent roughly 24 to 32 percent of platform cost of goods sold for fitness app vendors, sourced primarily from hyperscale cloud providers including Amazon Web Services, Microsoft Azure, and Google Cloud. Instructor talent, video production, and workout content licensing form a second major cost category for on-demand streaming platforms nationwide.
Cloud compute and streaming delivery pricing rose meaningfully during 2024 as major hyperscale providers adjusted enterprise contract terms and data center capacity allocation, an effect documented in several hyperscale providers' annual reports citing rising data center capital expenditure and rack-level power constraints. Vendors holding older infrastructure contracts with favorable multi-year pricing terms absorbed comparatively less of this cost increase than newer market entrants generally did over the same period.

Smaller vendors lacking negotiating scale with hyperscale cloud providers face a genuine and persistent cost disadvantage relative to larger incumbents able to commit substantial multi-year cloud spending guarantees in exchange for meaningfully discounted rates. This gap widens further as video content library size climbs, since streaming delivery costs scale directly with subscriber viewing volume each platform processes across its user base daily.
united-states-fitness-apps-market-company-positioning-matrix-1788424607641

Negotiate Multi-Year Hyperscale Cloud Commitments

Vendors committing to multi-year cloud spending guarantees secure meaningfully discounted compute and storage rates from hyperscale providers, offsetting rising infrastructure costs directly and preserving margin as content library size and subscriber viewing volume continue climbing steadily across the installed base, particularly among enterprise wellness accounts renewing multi-year platform contracts each fiscal cycle rather than competing purely on price.

Optimize Video Delivery at the Network Edge

Vendors implementing edge-based content delivery caching reduce origin server load meaningfully, lowering per-subscriber streaming cost without sacrificing the video quality subscribers increasingly demand from premium fitness platforms competing on production value, catalogue depth, and playback reliability across peak evening usage windows nationwide each week during winter months and major seasonal fitness resolution marketing campaigns broadly.

Portfolio Architecture for Margin Defence

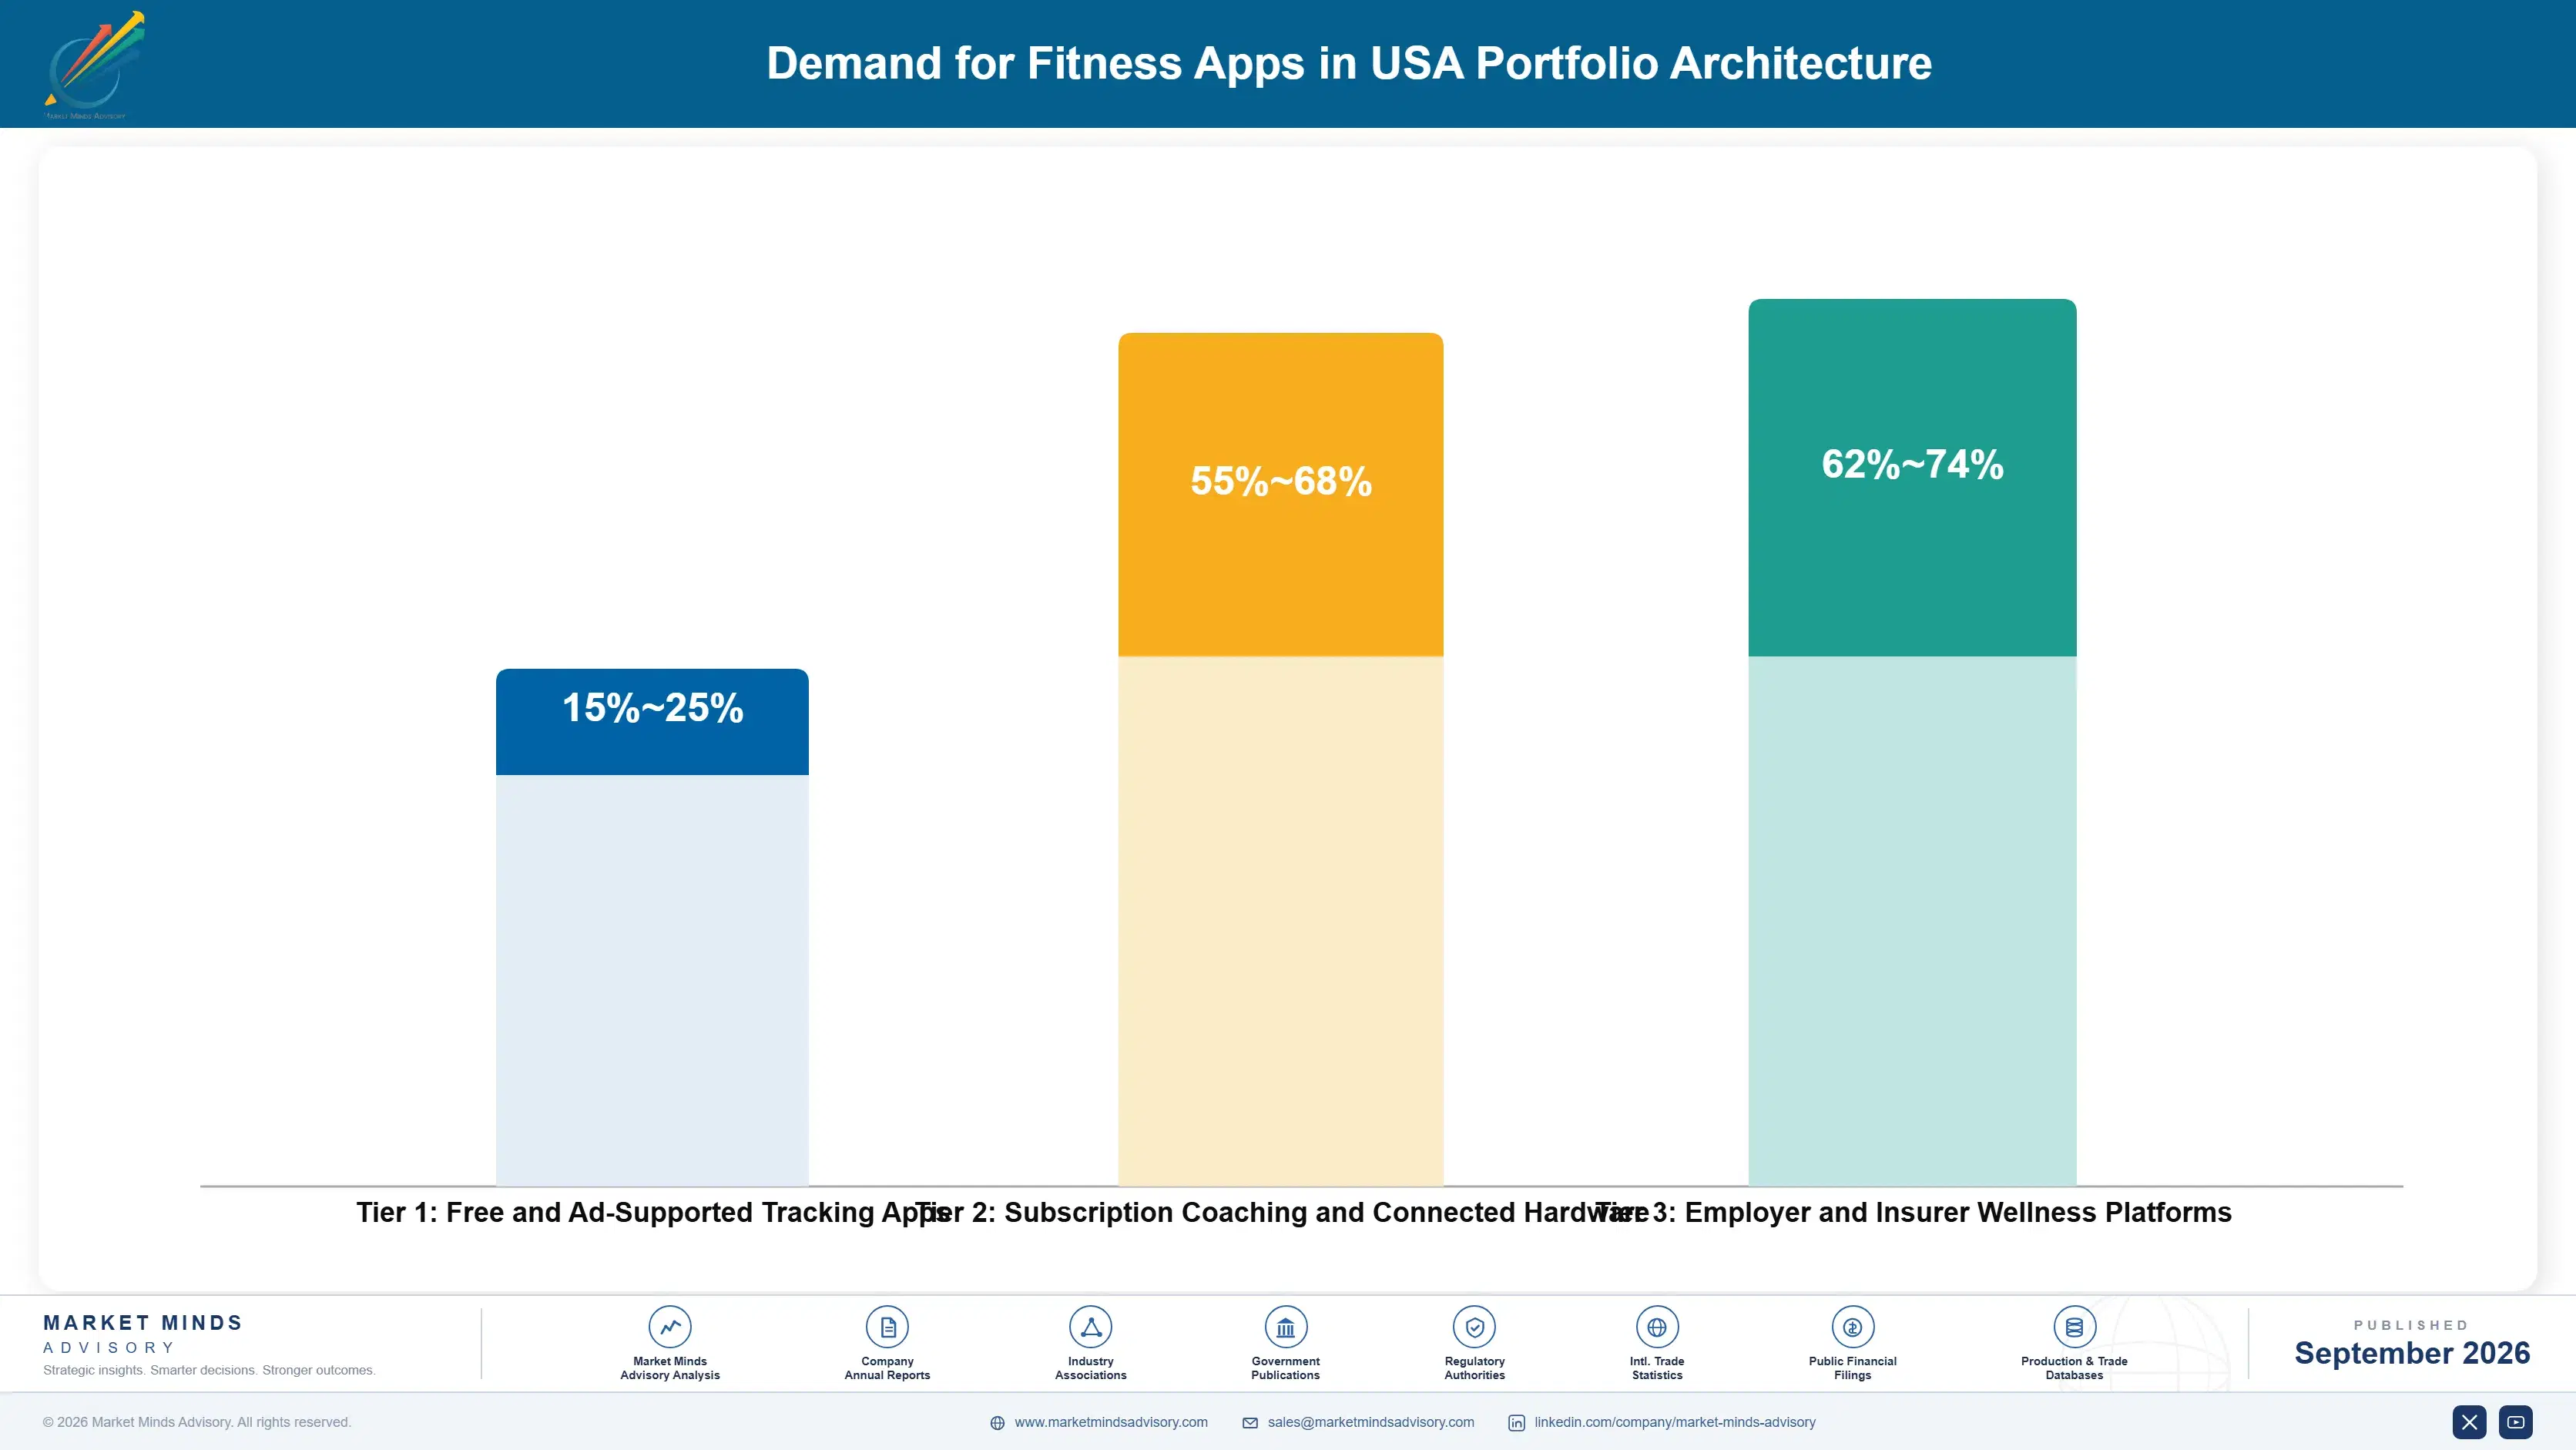
Fitness app vendors operate three distinct margin tiers, from ad-supported free tiers carrying minimal contribution margin through mid-priced subscription tracking apps and premium connected-hardware bundles carrying the richest gross margins in the category. Volume subscription tiers monetize primarily through advertising and low-price conversion funnels, while premium tiers monetize through hardware attach rates and annual commitment pricing structures that lock in multi-year subscriber relationships. Vendors that misjudge tier boundaries risk cannibalizing their own premium subscriber base.
Tension persists between volume growth, which favors low-friction free-to-paid conversion funnels built for scale, and premium positioning, which favors deeper personalization and coaching depth commanding materially higher willingness to pay among engaged subscribers. Vendors chasing both simultaneously often dilute brand positioning and confuse prospective subscribers evaluating competing tier structures across a crowded app store landscape.

High-value margin pools concentrate in employer-sponsored corporate wellness contracts and recovery-focused premium subscriptions, both of which command meaningfully higher annual contract values than direct-to-consumer tracking subscriptions sold individually. Vendors building durable enterprise sales motions and multi-year renewal cycles capture disproportionate margin relative to their subscriber base size, outperforming peers still reliant on churn-prone monthly consumer billing. This dynamic increasingly separates category leaders from smaller, undercapitalized challengers.

Free and Ad-Supported Tracking Apps

Basic activity tracking monetized through advertising and freemium upgrade prompts, carrying thin unit economics but broad reach across casual users exploring the category before committing to a paid subscription tier.
Gross Margin: 15-25%

Subscription Coaching and Connected Hardware

Paid subscriptions bundling personalized coaching, structured programming, and connected hardware integration, commanding stronger recurring revenue and materially higher gross margin than free tiers through annual commitment pricing and deeper subscriber engagement over time.
Gross Margin: 55-68%

Employer and Insurer Wellness Platforms

Enterprise contracts sold through employer benefits and insurer wellness programs, carrying the richest margin profile in the category given multi-year commitments, lower churn, predictable renewal-based revenue streams, and minimal customer acquisition cost per seat.
Gross Margin: 62-74%
united-states-fitness-apps-market-cost-volatility-analysis-1788424608138

High-value Sub-segments and Strategic Watch-out

Recovery and Sleep Optimization Apps

Fastest-growing and highest-value segment, combining premium pricing power with strong subscriber engagement metrics as wearable device integration deepens across recovery-focused fitness use cases nationwide, particularly among performance-oriented users tracking sleep, heart rate variability, and recovery metrics on a daily basis throughout the year. Vendors moving early capture outsized share.

Corporate Wellness and Employer-Sponsored Apps

High-value segment with moderate growth, anchored by multi-year enterprise contracts and lower churn than direct-to-consumer tiers, though enterprise sales cycles run considerably longer than typical consumer acquisition funnels given procurement, benefits committee approval steps, and annual budget renewal timing constraints. Long-term retention rewards patient sellers.

Core Activity Tracking and Logging Apps

Volume core of the market, delivering steady subscriber counts and modest margin, serving as the primary funnel into higher-tier coaching and connected hardware bundle upgrades over time as engagement and trust with the platform builds across a broad and diverse user base. Retention here anchors long-term valuation.

Free Ad-Supported Basic Tracking Apps

Strategic watch-out segment facing intensifying free-alternative competition, pressuring premium conversion rates and requiring vendors to differentiate through data depth, coaching quality, and wearable integration breadth rather than price alone going forward into the coming forecast period. Differentiation now determines survival later. Margin compression accelerates without it.

Engagement Depth Drives Renewal Economics

Fitness app subscriptions behave like annuities once a subscriber crosses roughly ninety days of sustained engagement, with renewal probability climbing sharply past that threshold as habit formation sets in. Vendors that front-load onboarding investment and early coaching touchpoints see meaningfully higher lifetime value per subscriber than those relying on passive tracking alone to sustain interest. Renewal past that point exceeds twice the rate seen among early churners.
Adoption stickiness varies considerably by end-use vertical. Corporate wellness deployments show the deepest stickiness given employer-subsidized pricing and integration with benefits administration systems, while general consumer tracking apps see materially higher voluntary churn absent a connected hardware anchor. Recovery-focused apps sit between these two poles, benefiting from wearable data lock-in effects that raise switching costs over time. This spread shapes vendor product investment across verticals.

Younger buyer cohorts increasingly expect fitness apps bundled within broader wearable device platforms rather than purchased as standalone subscriptions, shifting negotiating leverage toward device manufacturers that control the underlying data layer. Older subscriber cohorts still favor dedicated single-purpose apps, creating a generational split vendors must navigate carefully across pricing tiers and product design choices. Vendors ignoring this split risk losing one cohort while chasing the other.
Section default visual

What Fitness App Leaders Must Prioritize

These are among the four positions where our research anticipates prominent divergence between winners and laggards over the coming forecast period. Each is grounded in the demand model, the regulatory perimeter, and the announced capacity pipeline.
01 / WEARABLE DATA STRATEGY

Own the cross-device data layer before hardware makers do

Vendors that integrate deeply with wearable device platforms now will defend subscriber relationships as device manufacturers increasingly push their own bundled software offerings into the same competitive space. Waiting risks ceding the entire cross-device data layer to Apple, Fitbit, and other hardware incumbents already building proprietary tracking and coaching features directly into their devices. Early movers building broad device compatibility across multiple wearable brands will command materially stronger subscriber retention than single-device dependents locked into one manufacturer's closed platform over the coming forecast decade.
02 / ENTERPRISE CHANNEL BUILD

Invest now in employer wellness sales infrastructure

Corporate wellness contracts carry meaningfully lower churn and higher annual contract value than direct-to-consumer subscriptions sold individually to price-sensitive household budgets. Building a dedicated enterprise sales motion requires upfront investment in benefits integration and procurement relationships that many vendors defer in favor of near-term consumer growth. Those that commit early will capture disproportionate share as employer wellness budgets continue expanding across mid-size and large organizations nationwide, locking in multi-year renewal cycles that competitors entering later will struggle badly to displace.
03 / RETENTION PRODUCT DESIGN

Redesign onboarding around the ninety-day habit threshold

Subscriber renewal probability climbs sharply once engagement crosses roughly ninety days, making early onboarding the single highest-leverage retention investment available to fitness app vendors today. Vendors under-investing in this window lose subscribers before habit formation locks in, forcing them into a costly cycle of continuous paid reacquisition rather than organic retention. Restructuring onboarding flows explicitly around this ninety-day threshold delivers outsized lifetime value gains relative to comparable spend on late-stage win-back and retention campaigns launched after churn has already occurred.
04 / PREMIUM TIER DIFFERENTIATION

Separate free and premium tiers with real value gaps

Free alternatives increasingly erode premium conversion, forcing vendors to justify subscription pricing through genuine differentiation rather than incremental feature additions that free competitors can replicate quickly. Coaching depth, data personalization, and wearable integration breadth remain the clearest defensible levers available to premium vendors willing to invest in product depth. Vendors that blur tier boundaries risk losing subscribers to free substitutes entirely rather than converting them upward, eroding the premium base that sustains long-term margin, brand pricing power, and investor confidence in the model.

Engagement Snapshot From the Field

A live engagement with an industry participant carrying material or product regulatory and market exposure ahead of a defining policy shift, showing how our research translates into a defensible multi-year portfolio strategy.
MARKET MINDS ADVISORY · CLIENT ENGAGEMENT SUMMARY
Demand for Fitness Apps in USA Producer Strategic Portfolio Review and Transition Roadmap 2026·Investment Scenario on Demand for Fitness Apps in USA Exposure Evaluation 2025-26
CLIENT PROFILE
A mid-size regional fitness app operator offering activity tracking and on-demand workout content approached MMA seeking guidance on subscriber retention and premium tier expansion. The client operated across roughly a dozen metropolitan markets with a subscriber base skewing toward casual users rather than committed athletes, and had struggled to convert free users into paying subscribers at a sustainable rate.
STRATEGIC CHALLENGE
The client faced elevated monthly churn among free-to-paid converts and lacked a clear enterprise wellness sales channel despite growing employer interest in bundled fitness benefits. Leadership needed a defensible path to premium tier growth without materially increasing customer acquisition spend, which had already climbed faster than subscription revenue over the prior two fiscal years.
MMA APPROACH
MMA conducted subscriber cohort analysis alongside primary interviews with churned users to isolate the specific onboarding gaps driving early cancellation. The engagement benchmarked the client's retention curve against category leaders and modeled the revenue impact of a dedicated employer wellness channel launch across the client's existing metropolitan footprint. Findings were validated against comparable engagements across the broader consumer subscription category.
KEY FINDINGS
  1. Subscribers who completed a structured first-week onboarding flow renewed at nearly twice the rate of those left to self-navigate the app unaided.
  2. Employer-sponsored pilot cohorts showed churn roughly 40 percent lower than direct-to-consumer subscribers of comparable tenure and weekly usage frequency across the same period.
  3. Wearable-connected users generated meaningfully higher lifetime value than app-only subscribers, reflecting the data lock-in effect documented broadly across the fitness app category overall.
  4. Free-tier users citing free alternatives as a reason for non-conversion cited coaching depth, not price, as the primary gap versus premium apps.
CLIENT PROFILE
A mid-size regional fitness app operator offering activity tracking and on-demand workout content approached MMA seeking guidance on subscriber retention and premium tier expansion. The client operated across roughly a dozen metropolitan markets with a subscriber base skewing toward casual users rather than committed athletes, and had struggled to convert free users into paying subscribers at a sustainable rate.
STRATEGIC CHALLENGE
The client faced elevated monthly churn among free-to-paid converts and lacked a clear enterprise wellness sales channel despite growing employer interest in bundled fitness benefits. Leadership needed a defensible path to premium tier growth without materially increasing customer acquisition spend, which had already climbed faster than subscription revenue over the prior two fiscal years.
MMA APPROACH
MMA conducted subscriber cohort analysis alongside primary interviews with churned users to isolate the specific onboarding gaps driving early cancellation. The engagement benchmarked the client's retention curve against category leaders and modeled the revenue impact of a dedicated employer wellness channel launch across the client's existing metropolitan footprint. Findings were validated against comparable engagements across the broader consumer subscription category.
KEY FINDINGS
  1. Subscribers who completed a structured first-week onboarding flow renewed at nearly twice the rate of those left to self-navigate the app unaided.
  2. Employer-sponsored pilot cohorts showed churn roughly 40 percent lower than direct-to-consumer subscribers of comparable tenure and weekly usage frequency across the same period.
  3. Wearable-connected users generated meaningfully higher lifetime value than app-only subscribers, reflecting the data lock-in effect documented broadly across the fitness app category overall.
  4. Free-tier users citing free alternatives as a reason for non-conversion cited coaching depth, not price, as the primary gap versus premium apps.
RECOMMENDED STRATEGY
Phase 1: Phase one restructured onboarding around a guided first-week experience targeting the churn-prone early engagement window identified in the cohort analysis conducted. Phase 2: Phase two piloted an employer wellness channel across three metropolitan markets, using early results to build a repeatable enterprise sales playbook. Phase 3: Phase three expanded wearable device integration breadth, prioritizing the two device platforms with the highest subscriber overlap identified in research.
OUTCOME
Within two quarters of implementation, the client reported (client-reported, unverified by MMA) a meaningful improvement in ninety-day retention and early traction in its first employer wellness contracts, validating the phased approach MMA recommended and setting a template for continued enterprise channel investment. Leadership adopted the framework for its next fiscal year planning cycle.

Frequently Asked Questions

Foundational context covering the market sizes, CAGR, scope, country, region and competition that inform every finding below. This section is provided to cover basics and most often pre-purchase conversations, answered from the MMA Primary Research Dataset.

What is the current size of the Demand for Fitness Apps in USA?

The United States fitness app market was valued at approximately 2.1 billion dollars in 2025, driven by rising wearable device adoption and expanding employer-sponsored wellness programs nationwide.

How large will the Demand for Fitness Apps in USA be by 2036?

The market is projected to reach roughly 6.3 billion dollars by 2036, more than doubling from its 2026 base as wearable integration and coaching depth continue driving subscription growth.

What is the CAGR for the Demand for Fitness Apps in USA 2026 to 2036?

The market is forecast to grow at a compound annual rate of approximately 10.5 percent between 2026 and 2036, supported by sustained wearable adoption and employer wellness spending.

Which segment is growing fastest?

Recovery and Sleep Optimization Apps lead segment growth at approximately 16.8 percent annually, outpacing the broader market as wearable-integrated recovery tracking gains mainstream subscriber adoption nationwide.

Who are the major companies in the Demand for Fitness Apps in USA?

Peloton Interactive, Strava, MyFitnessPal, Fitbit, and Nike lead the competitive landscape, collectively holding the largest share on a revenue and active subscriber basis nationwide currently.

Which country is growing fastest?

The United States itself remains the fastest-growing market given the report's domestic focus, with growth concentrated in wearable-integrated and employer-sponsored subscription categories specifically across the forecast period.

Report Segmentation Architecture

The full report scope spans multiple orthogonal segmentation dimensions, with cross-tabulated demand data provided for each dimension pair. Coverage extends further to regional breakdowns, trend trajectories, and the competitive detail needed to support segment-level decision-making.

By Application Type

    By End-Use Vertical

      By Distribution and Monetization Model

        By Region

        • North America
        • Western Europe
        • East Asia
        • South Asia and Pacific
        • Latin America
        • Middle East and Africa
        • Eastern Europe

        Scope, Methodology, and Coverage

        Every figure in this report is reproducible from documented input assumptions. The scope below maps the historical period, the forecast horizon, the segmentation dimensions, and the countries covered, alongside the underlying primary and qualitative methodology.
        Historical Period
        2020 to 2025
        Forecast Period
        2026 to 2036
        Base Year
        2025 (USD billions; MMA Primary Research Dataset, September 2026)
        Market Definition
        This report covers consumer-facing mobile and connected fitness applications delivering activity tracking, workout content, and coaching within the United States, spanning free, subscription, and hardware-bundled monetization models. It excludes standalone wearable hardware sales, clinical telehealth software, and enterprise HR benefits administration platforms not bundled with fitness content.
        Quantitative Units
        USD billions, percent CAGR, percent share
        Segmentation Dimensions
        Application type, end-use vertical, distribution and monetization model
        Regions Covered
        North America, Western Europe, East Asia, South Asia and Pacific, Latin America, Middle East and Africa, Eastern Europe
        Countries Covered
        United States, with regional benchmarking against Western Europe, East Asia, South Asia and Pacific, Latin America, Middle East and Africa, and Eastern Europe
        Key Companies Profiled
        Peloton Interactive, Strava, MyFitnessPal, Fitbit, Nike, WHOOP, Apple, ClassPass, Freeletics, Aaptiv, Zwift, Tonal, JEFIT, Sworkit, Future, Ultrahuman, Ergatta, 8fit, Noom, FitOn
        Quantitative Methodology
        Primary survey, n=3,800 respondents, Q4 2025, six countries; demand-side model with trade association cross-validation
        Qualitative Methodology
        47 expert interviews, Q4 2025; applied to validate demand model assumptions, identify emerging dynamics, and assess competitive positioning
        Report Format
        PDF and XLSX data workbook (Word format preview document)
        Publisher
        Market Minds Advisory
        Report Code
        MMA-2026-TEC-571
        Published
        September 2026
        Contact
        sales@marketmindsadvisory.com | www.marketmindsadvisory.com

        Purchase the full Demand for Fitness Apps in USA Report (2026 to 2036).

        This report delivers a comprehensive assessment of the United States fitness app market, spanning market sizing, segmentation, competitive positioning, and regional demand dynamics through 2036. It profiles twenty leading vendors across free, subscription, and hardware-bundled tiers, benchmarking each on a consistent commercial basis. Readers gain a detailed view of revenue levers, input cost exposure, and margin architecture across the category. The analysis draws on primary survey data, expert interviews, and company disclosures to support strategic planning and investment decisions across the full ten-year forecast period ahead.
        Ten-year market sizing and forecast model
        Six-segment MECE market segmentation framework overview
        Twenty-company competitive benchmarking dataset included fully
        Seven-region demand share and CAGR analysis
        Input cost exposure and mitigation playbook
        Anonymized client engagement case study included

        Built For The People Who Decide

        From boardroom strategy to bench-side execution, this report is read cover-to-cover by leaders shaping the next decade of their industry, turning demand scenarios, market dynamics and valuation benchmarks into decisions.
        CXOs/ Presidents/ VPs/ Managers
        M&A and Corporate Development
        Strategy Teams and R&D Heads
        Procurement and Product Directors
        Regulatory and Compliance Leaders
        Investor Relations and Equity Analysts