Market Minds Advisory
United States & Europe Beverage Flavoring Market

United States & Europe Beverage Flavoring Market: Taste Repair, Provenance Proof, and the Fermentation Route Out of Agriculture

Beverage brands in the United States and Europe are reformulating faster than their flavour suppliers can validate, as sugar reduction mandates, clean-label retail specifications, and botanical sourcing volatility collide inside a single procurement cycle.

Lead Analyst

Lisa Gevelber

Published

September 2026

Make Smarter Decisions with Customized Research Insights

Request a free sample report and evaluate market opportunities, growth trends, and competitive dynamics relevant to your business needs.

2025 MARKET VALUE$7.2BMarket Size 2025
2036 FORECAST VALUE$13.4BBase Case , 2026 to 2036
CAGR 2026 TO 20365.8 %Bull 7.0% / Bear 4.6%
INCREMENTAL OPPORTUNITY$5.8BNet 10- year value creation
EXPANSION MULTIPLE1.76x2036 value over 2026 base
Strategic Levers
M&A Pipeline
Regional Outlook
Country Rankings
Competitive Intelligence
Segmental Deep-dive
Call-Us : 91 93563 13602

Executive Snapshot and Market Trajectory

Sugar reduction has quietly turned flavour houses into taste-repair contractors. When a carbonated soft drink loses 30% of its sucrose content, the brief stops being about aroma and becomes mouthfeel, bitterness masking, and a lingering sweetness curve that formulators must rebuild ingredient by ingredient, batch after failed batch.
Commercial power sits with suppliers who can document provenance. Retail private-label specifications in Germany, the United Kingdom, and the United States now push natural declaration status down the chain, while citrus, vanilla, and mint prices move on weather rather than on contract terms. Fermentation-derived aroma compounds grow fastest at 9.1%, roughly 1.57 times the market rate, because they deliver natural status without agricultural exposure. North America and Western Europe together hold 58% of value.
Five suppliers control roughly 62% of addressable spend, and the gap between them is one of application laboratories rather than molecules. EU Regulation 1334/2008 governs what may be called natural, while the FDA's 2018 withdrawal of seven synthetic flavouring substances still shapes American reformulation queues. Smaller houses win on speed and willingness to run small batches; the majors win when a brand needs forty markets launched simultaneously and identically.
Market Definition
This report covers flavour ingredients and flavour systems formulated for beverage applications: natural extracts and distillates, nature-identical and artificial aroma chemicals, fermentation-derived compounds, botanical preparations, and reaction-derived flavour bases sold to beverage manufacturers and co-packers. Commercial coverage centres on United States and European demand, with global supply and pricing context. Sweeteners, colours, acidulants, preservatives, functional actives, and finished beverage concentrates sold direct to consumers are excluded.
Base Year Value
$7.2B in 2025 (MMA Primary Research Dataset, August 2026)
Forecast Period
2026 to 2036, eleven discrete annual values
CAGR
5.8% base case. Bull 7.0%. Bear 4.6%.
Fastest Growth Segment
Fermentation-Derived and Biotransformed Aroma Compounds: 9.1% CAGR
Fastest Growth Country
India: 8.6% CAGR
Fastest Growth Region
South Asia and Pacific: 8.0% CAGR
Largest Region
North America: 32% of 2025 global value
Market Leaders
Givaudan, dsm-firmenich, International Flavors & Fragrances, Symrise, Sensient Technologies. Source: MMA Analysis based on company annual reports.
Primary Survey
n=3,800 procurement and R&D decision-makers, Q4 2025, six countries
Methodology
Demand-side build-up, cross-validated against public data, 47 expert interviews

United States & Europe Beverage Flavoring Market Forecast Scenarios

united-states-europe-beverage-flavoring-market-size-forecast-scenario-1787462522499
The 2020 to 2025 stretch was less about growth than about repair. Lockdown demand shifted from foodservice dispensing to packaged retail, then swung back, leaving flavour houses with mismatched inventory and a run of citrus oil shortages. Pricing carried more of the 4.9% historical CAGR than volume did, and several accounts changed supplier purely because someone else had stock. Sourcing policy still reflects it.
The 5.8% base case rests on three mechanisms. Sugar reduction reformulation keeps generating paid development work, because every recipe change triggers a new masking brief. Retailer clean-label specifications move volume from artificial compounds toward extracts and fermentation routes at higher unit prices. And energy, functional, and ready-to-drink coffee formats keep launching, each carrying more flavour cost per litre than carbonates. Volume growth stays modest; value growth comes from mix and from formulation complexity that customers have failed to insource.
The 7.0% bull case turns on GLP-1 driven reformulation of the entire sugary drinks shelf, which would pull masking and modulation work forward by several years. The 4.6% bear case is simpler: European private-label pressure compresses flavour spend per litre, and beverage majors move standard citrus and cola briefs to regional houses at half the price.

Why Taste Repair Became the Product

Three forces meet in a beverage flavour brief. Public health policy keeps removing sugar, which removes body and sweetness perception along with it. Retailers keep tightening declaration rules, which removes the cheapest synthetic tools. And agricultural supply keeps failing to behave, which removes pricing certainty from the natural alternatives that policy and retail both demand.
TOP-FIVE CONCENTRATION62%Share of addressable beverage flavour spend held collectively
AVERAGE SELLING PRICE$34.80/kgBlended beverage flavour compound price across natural and synthetic
NATURAL DECLARATION SHARE71%Portion of new beverage briefs requiring natural labelling status
CITRUS INPUT SHARE26%Citrus oils and derivatives as proportion of raw material cost
REFORMULATION CYCLE LENGTH14 monthsTypical brief to commercial launch duration for beverage accounts
TRADE INTENSITY44%Share of flavour compounds crossing a border before use
That leaves formulation skill as the scarce asset. A flavour house earns not on the compound but on the eighteen iterations required to make a reduced-sugar lemon-lime taste like the original at four degrees Celsius, after eleven weeks on shelf, in a PET bottle. Application laboratories in Cincinnati, Kemptthal, and Holzminden are where the margin sits, and they are expensive to run. Staffing one costs several million dollars a year before a single kilogram ships.
The next decade rewards suppliers who decouple natural declaration from farming. Fermentation and biotransformation deliver natural-status compounds at predictable cost, and beverage majors have started writing them into specifications by name rather than accepting botanical substitution. That shift changes what a flavour library is worth. Everyone else keeps hedging citrus and hoping Florida recovers, which on current agronomic evidence it will not.
"The most valuable thing a flavour house owns is not its molecule library, it is the record of what failed. Every rejected iteration on a reduced-sugar brief is proprietary data that a challenger simply cannot buy."
Director, Food and Beverage Ingredients Practice · MMA Food and Beverage Ingredients / Specialty Chemicals Practice · August 2026

Market Trends

Fermentation Routes Displace Agricultural Natural Sourcing

Vanillin from ferulic acid fermentation, valencene from engineered yeast, and nootkatone produced by biotransformation now carry natural declaration under EU Regulation 1334/2008 and the corresponding FDA definition, while sidestepping the crop failures that periodically double citrus and vanilla input prices. Beverage majors have begun naming fermentation-sourced compounds in specifications rather than accepting botanical equivalents. The route costs more per kilogram at small scale but prices flat across years, and procurement teams increasingly pay for that flatness. Capacity additions in Europe and Singapore during 2024 and 2025 confirm the direction. Qualification cycles at beverage majors typically run nine to twelve months.
Market Impact: Drives 71% of reformulation briefs

Taste Modulation Becomes a Separately Billed Service

Bitterness blockers, sweetness enhancers, and mouthfeel builders used to travel free inside a flavour quotation. They no longer do. As reformulation briefs multiplied after the UK Soft Drinks Industry Levy and comparable measures in Ireland, Portugal, and eight American jurisdictions, suppliers began pricing modulation development as a distinct workstream with its own milestones and exclusivity terms. A single reduced-sugar relaunch across four flavours now commonly carries a six-figure development fee before a kilogram ships. That converts application capacity from overhead into revenue. Suppliers lacking a modulation portfolio deep enough to quote are excluded before price is even discussed.
Market Impact: Lifts flavour cost 2.4x per litre

Market Opportunities and Growth Drivers

Sugar Levies Force Continuous Recipe Rework Across Portfolios

The UK Soft Drinks Industry Levy, applied at two thresholds since 2018, cut sugar in levied drinks sharply and pushed almost every major brand through reformulation. Portugal, Ireland, France, and Poland run comparable schemes, and Philadelphia, Seattle, Boulder, and Berkeley maintain municipal taxes in the United States. Each threshold change restarts the flavour brief, because sweetener substitution alters bitterness, aftertaste, and perceived thickness together. Suppliers with modulation portfolios capture that work repeatedly rather than once, which is why levy geographies show higher flavour spend per litre. American brands watch the European experience closely before committing.
Market Impact: Swings 26% of raw material cost

Energy and Functional Formats Carry Higher Flavour Loading

Energy drinks, protein beverages, and ready-to-drink coffee all need aggressive masking, because caffeine, taurine, whey, and botanical extracts each contribute bitterness or astringency that consumers reject. Flavour cost per litre in these formats runs roughly two to three times a standard carbonate. United States energy category volume has grown steadily through 2024 and 2025, and European functional launches have followed. The mix shift matters more than the volume: a supplier holding energy and functional accounts earns materially more per hectolitre than one holding cola and lemonade. Winning those accounts requires masking depth rather than aroma breadth.
Market Impact: Cuts spend 18% per litre

Market Restraints and Challenges

Citrus Greening Keeps Natural Input Costs Unpredictable

Huanglongbing has cut Florida orange production to a fraction of its historical level, and Brazilian groves now show rising infection. Orange and lemon oils are by-products of juice processing, so flavour supply falls whenever juice volume falls, independent of flavour demand. The root cause is agronomic and unsolved: no commercial cure exists, and replanting takes years. Suppliers respond with multi-origin contracting across Brazil, Mexico, Spain, and Argentina, forward positions of twelve to eighteen months, and accelerated qualification of fermentation-derived citrus aroma compounds as declarable substitutes. None of those responses restores the pricing stability that existed before 2018.
Market Impact: Adds 9.1% segment growth rate

Private-Label Growth Compresses Flavour Spend Per Litre

European retailers have expanded own-brand beverage ranges, and private-label briefs pay less, iterate less, and rarely fund exclusivity. The cause is straightforward: retailers compete on shelf price and treat flavour as a specification line rather than as brand equity. Volume moves to regional houses and to second-tier suppliers willing to work at thinner development margin. Participants counter by bundling flavour with colour and acidulant supply, by selling stock solutions that need no development, and by pricing application support separately so free work stops subsidising low-margin accounts. Retailers have shown little willingness to fund development directly.
Market Impact: Generates $180,000 average development fees
4 additional market trends, 3 additional growth drivers, and 2 additional restraints and challenges are covered in the full report. Contact sales@marketmindsadvisory.com to access the complete intelligence.

Segment CAGR and Growth Architecture

Segmentation follows production route, a single technical and regulatory logic. How a compound is made determines its declaration status, its cost behaviour, and the buyer approval path, so commercial position tracks the route rather than the finished beverage. Application formats and channel structures appear in the framework as separate dimensions. Mixing route with beverage format would double-count almost every compound.
united-states-europe-beverage-flavoring-market-market-share-analysis-1787462523086

Fermentation-Derived and Biotransformed Aroma Compounds

This is the only route that delivers natural declaration without agricultural exposure, and that single property explains the 9.1% rate, roughly 1.57 times the market. Vanillin from ferulic acid, valencene and nootkatone from engineered yeast, and a widening set of green notes and esters now qualify under EU Regulation 1334/2008. Unit costs remain above nature-identical equivalents, but they hold steady across seasons, which procurement values highly after five years of citrus volatility. Capacity is concentrated among the majors and a handful of biotechnology specialists, and beverage customers increasingly specify the route by name in briefs rather than accepting botanical substitution. Regulatory acceptance is settled in Europe and the United States, which removes the approval risk that slowed adoption before 2022.
CAGR 9.1%

Botanical Infusions and Concentrated Botanical Preparations

Botanicals ride the functional and adult non-alcoholic categories: hop extracts, gentian, elderflower, yuzu, ginseng, and the bitter aromatics that give alcohol-free spirits and hard-seltzer alternatives their credibility. Growth of 7.3% reflects launch intensity rather than base volume, since these preparations sit in premium formats with high flavour loading and short reformulation cycles. Sourcing is fragmented and largely European, which suits mid-sized houses with grower relationships. The commercial risk is fashion: a botanical that carries a category one year can vanish from briefs the next, so suppliers hold broad libraries and short inventory positions rather than committing to any single crop. Margins hold better than volume here, because buyers in premium formats rarely tender on price alone.
CAGR 7.3%
Full segment breakdown across 6 segments available in the complete report.

Regional Architecture and Country Demand Map

North America and Western Europe together take 58% of value, reflecting where reformulation budgets and premium beverage launches concentrate. East Asia follows on packaged tea and functional formats, while South Asia and Pacific grows fastest from a smaller and more price-sensitive demand base. Eastern Europe remains levy-driven and price-led.

North America

Energy drinks and reduced-sugar carbonates set the tone here. American beverage majors run continuous reformulation programmes, and the FDA's 2018 removal of seven synthetic flavouring substances from the approved list forced replacement work that is still filtering through smaller brands. Municipal sugar taxes in Philadelphia, Seattle, Boulder, and Berkeley create localised reformulation pressure without a federal mandate. Canada contributes through its front-of-pack nutrition symbol regulation, which pushes sugar below disclosure thresholds and triggers the same masking briefs. Mexico's dispensed and bottled beverage volume feeds American-owned flavour plants along the border. Application laboratories in Cincinnati, New Jersey, and Chicago carry most regional development work. Regional growth of 5.1% therefore reflects mix improvement more than volume expansion.
Share: 32% | CAGR: 5.1% (2026 to 2036)

Western Europe

Regulation writes the brief in Western Europe. EU Regulation 1334/2008 defines what may be declared natural, and retailer specifications in Germany, the Netherlands, and the United Kingdom then go further, restricting compounds that remain legally permitted. The UK levy and the Irish and Portuguese equivalents pushed sugar reduction earlier here than anywhere else, so the reformulation wave is mature rather than accelerating, which is why growth sits at 4.2%. Adult non-alcoholic beverages are the live opportunity: alcohol-free beer in Spain and Germany, and botanical spirits alternatives across the United Kingdom and France. Private-label expansion at Aldi, Lidl, and Carrefour caps pricing on standard briefs. Growth here is mix-led, since litres have been flat for several years.
Share: 26% | CAGR: 4.2% (2026 to 2036)
Regional intelligence for 5 additional markets available in the complete report: East Asia, South Asia and Pacific, Latin America, Middle East and Africa, Eastern Europe. Contact sales@marketmindsadvisory.com.
united-states-europe-beverage-flavoring-market-country-cagr-analysis-1787462523611

Where Flavour Suppliers Can Actually Earn

Selling kilograms of compound is the least profitable thing a flavour house does. The four moves below shift revenue toward work that customers cannot replicate internally: paid development, declarable fermentation routes, modulation exclusivity, and the sourcing intelligence that protects a beverage brand from its own agricultural exposure. None of the four requires new plant capacity.

Price Application Development as Standalone Contracted Work

Free development was affordable when briefs were rare. With reformulation now continuous, a supplier can burn 400 to 600 laboratory hours on a reduced-sugar relaunch and recover nothing if the brand switches. Convert development into milestone-billed contracts with defined iteration counts, exclusivity windows of 18 to 24 months, and a volume commitment that converts fee to credit. Accounts structured this way show gross margin roughly 8 to 11 points above equivalent unbilled relationships, and they qualify supplier seriousness in a way that discounting never does. Customers accept the structure faster than commercial teams expect.
Market Impact: Lifts account gross margin 8 to 11 points

Qualify Fermentation Substitutes Before Customers Ask

Every beverage brand holding a natural citrus or vanilla declaration carries an unhedged agricultural position. Suppliers that pre-qualify fermentation-derived equivalents, complete the sensory matching, and hold the regulatory dossier ready can convert a customer inside one quarter when crop prices spike, rather than losing the account to whoever moved first. The work costs perhaps $250,000 per compound family and pays back on a single displaced volume. It also raises switching cost permanently, because the customer's specification then names the route rather than the botanical. Two of the five majors already run this playbook.
Market Impact: Converts exposed accounts within 90 days of a spike

Bundle Modulation With Sweetener System Supply

Bitterness blockers sold alone invite comparison shopping. Sold as a validated system alongside a specified stevia, allulose, or sucralose blend, they become part of an approved formulation that no procurement team wants to reopen. Bundling raises the addressable spend per brief by roughly 30% to 45% and moves the conversation from unit price to shelf-life performance. It also gives the supplier visibility of sweetener switching plans a year ahead, which is commercially more useful than the incremental revenue itself. Sweetener suppliers rarely object, because the bundle expands their volume as well.
Market Impact: Raises addressable brief value by 30 to 45%

Sell Origin Intelligence as a Retained Service

Beverage procurement teams are rarely equipped to forecast citrus, vanilla, mint, or hop availability, yet those four inputs decide whether a launch happens. A supplier already tracking harvest conditions across Brazil, Madagascar, India, and the Pacific Northwest can package that view as a retained advisory carrying a 6 to 12 month forward outlook and contracted volume options. Fees are modest, around $75,000 annually per major account, but the position converts the supplier from vendor to planning partner and materially lengthens contract tenure. Few beverage groups have the staff to build this capability internally.
Market Impact: Extends average contract tenure 2 to 3 years

Who Controls the Margin Pool

Concentration is high and stable: the top five hold roughly 62% of beverage flavour participation, measured consistently here as beverage-attributable flavour revenue disclosed or estimated from segment reporting. The gap between the leaders and the next tier is not molecular. It is the number of application laboratories, the depth of regulatory affairs staff, and the ability to launch one formulation across forty markets without a single declaration failure.
Competition currently runs on three fronts. The first is fermentation capacity, where dsm-firmenich, Givaudan, and a small number of biotechnology partners are building declarable natural routes at scale. The second is application footprint: Symrise and IFF have both added beverage-specific laboratories close to customer innovation centres. The third is contractual, with suppliers pushing exclusivity and paid development terms that were unthinkable five years ago.

Pressure is building from two directions at once. Regional houses in Turkey, India, and China now match the majors on standard citrus and cola briefs at materially lower cost, taking private-label and second-tier volume. Meanwhile biotechnology specialists supply fermentation compounds directly to brand owners, bypassing the flavour house entirely on single-molecule needs. Rankings shift where those two pressures meet: mid-sized Western houses without fermentation access or low-cost compounding.
united-states-europe-beverage-flavoring-market-company-positioning-matrix-1787462524146

Competitive Moat and Risk Dimensions

GIVAUDAN

Moat: Application Laboratory Density

Givaudan operates beverage application facilities across North America, Europe, and Asia at a density no challenger matches, which lets it run parallel iterations on the same brief in three regions simultaneously. For a global brand relaunch, that compresses timelines by months. The capital and staffing required to replicate it deters entry more effectively than any patent position could.
GIVAUDAN

Risk: Premium Pricing Under Pressure

The company prices at the top of the market and defends it with service depth. Private-label expansion in Europe and the maturing of standard reformulation briefs both reduce willingness to pay for that depth. Where a customer only needs a proven lemon-lime at scale, regional compounders now deliver acceptable quality, and Givaudan's cost base makes matching them unattractive.
DSM-FIRMENICH

Moat: Integrated Biotechnology and Nutrition

The merged group pairs flavour formulation with fermentation know-how and a nutrition portfolio, letting it supply a declarable natural aroma compound, a sweetener system, and the vitamin premix inside one specification. Beverage customers pursuing reduced-sugar functional launches value that single-approval path, and no pure flavour house can assemble the same combination without partnering.
DSM-FIRMENICH

Risk: Integration Complexity Slows Response

Combining two large organisations has absorbed management attention and created overlapping account coverage that customers notice. Beverage briefs reward speed above almost everything else, and a supplier that takes an extra fortnight to route an enquiry loses work to nimbler mid-sized houses. Portfolio pruning announced across 2024 and 2025 adds further uncertainty for customers planning multi-year programmes.

Players Tracked

Prominent Players

Givaudan
dsm-firmenich
International Flavors & Fragrances
Symrise
Sensient Technologies

Other Key Players

Takasago International
Mane SA
Robertet
T. Hasegawa
Kerry Group
Doehler
Archer Daniels Midland
Tate & Lyle
McCormick & Company
Bell Flavors & Fragrances
Treatt plc
Iberchem
Synergy Flavours
Prova
Flavorchem Corporation

Recent Developments

MARCH 2025

Givaudan expands Cincinnati beverage application capability

Givaudan completed an expansion of its Cincinnati site adding beverage-specific pilot and sensory capacity, positioning development work closer to American soft drink and energy customers. The investment targets reduced-sugar and functional briefs where iteration speed decides which supplier holds the account through relaunch. Commissioning completed during the first quarter.
Signal: Application proximity, not molecule libraries, is now the most contested competitive asset in American beverage accounts.
SEPTEMBER 2024

Symrise commissions additional European citrus processing capacity

Symrise brought forward capacity for citrus fractionation and terpene handling in Europe, reducing dependence on spot purchases of imported oils. The move followed two seasons of constrained Florida and Brazilian availability that disrupted delivery schedules across several European beverage accounts during 2023 and 2024. Output began ramping late that year.
Signal: Vertical positioning in citrus is becoming a defensive necessity for suppliers rather than an optional margin play.
JUNE 2025

dsm-firmenich scales fermentation-derived aroma production

dsm-firmenich increased output of fermentation-derived aroma compounds intended for natural declaration in beverage applications, citing customer demand for supply predictability. The expansion covers vanillin and selected citrus-character molecules that have historically depended on harvest outcomes in Madagascar, Florida, and Brazil. Beverage customers were named as the primary demand source.
Signal: Declarable natural status decoupled from farming is becoming the principal differentiator in premium beverage flavour supply.

Citrus, Vanilla, and Energy Exposure

Raw materials run roughly 55% to 62% of cost of goods for a beverage flavour house. Citrus oils and derivatives alone take 26%, sourced from Brazil, Florida, Mexico, and Spain as juice-processing by-products. Aroma chemicals derived from petrochemical and pine feedstocks contribute a further 19%, largely from European, Chinese, and American producers. Vanilla, mint, and specialty botanicals account for most of the remainder.
The 2023 to 2024 Florida orange harvest fell to its lowest level in nearly nine decades under Huanglongbing pressure and hurricane damage, according to USDA crop production reporting. Orange oil, a by-product of juicing, tightened with it, and spot prices for cold-pressed oil roughly tripled from 2022 levels. Symrise and Givaudan both flagged citrus input cost in their 2024 annual reporting, and several European bottlers accepted reformulated profiles rather than pay through the spike.

Exposure is uneven by player type. Houses with in-house citrus processing and multi-origin contracts absorbed the 2024 spike inside normal price bands. Mid-sized compounders buying on spot passed costs through late and lost accounts. Regional houses in Turkey and India, closer to alternative origins and operating on thinner overhead, held price better than their European equivalents and took share in private-label supply.
united-states-europe-beverage-flavoring-market-cost-volatility-analysis-1787462524352

Multi-origin citrus contracting with rolling forward cover

Contract orange, lemon, and lime oil across Brazil, Mexico, Spain, and Argentina simultaneously, with rolling twelve to eighteen month forward positions covering perhaps 60% of expected requirement. The remaining exposure stays on spot deliberately, so the position benefits when harvests recover rather than locking in peak pricing across a full cycle. Spot exposure is a deliberate choice.

Pre-qualified fermentation substitutes held in reserve

Maintain regulatory dossiers and completed sensory matching for fermentation-derived equivalents of the most exposed natural compounds, without commercialising them until price signals justify it. When citrus or vanilla spikes, conversion takes a quarter rather than a year, and the customer relationship survives the disruption intact rather than moving to whichever supplier had stock. Timing matters more than cost.

Indexed pricing clauses tied to published crop benchmarks

Write beverage supply agreements with pass-through mechanisms referencing published agricultural benchmarks rather than supplier assertion. Customers resist initially, then accept once they understand the alternative is a renegotiation every season. Indexed contracts also shorten the argument when prices fall, which builds the credibility needed to raise them when harvests disappoint again. Both directions need the same clause.

Portfolio Architecture for Margin Defence

The portfolio splits into three tiers separated by declaration status rather than by chemistry. Commodity compounds and standard artificial profiles compete on landed cost against regional compounders and earn 22% to 30%. Certified natural extracts and premium botanical preparations earn 38% to 48%, because the customer is buying documented provenance as much as taste. Fermentation-derived and modulation compounds earn most of all.
The tension is real and unresolved. Volume tiers keep plants loaded and justify the compounding footprint, but they invite exactly the price comparison that destroys premium positioning. Several European houses have exited standard carbonate briefs entirely, accepting lower utilisation for better mix. Others cross-subsidise, using volume work to fund the application laboratories that win premium accounts. Both approaches work; running them without deciding does not.

High-value pools concentrate where declaration risk is highest. Reduced-sugar reformulation, alcohol-free adult beverages, and functional formats all combine regulatory exposure with intense consumer sensory scrutiny, and buyers in those categories pay for certainty rather than for novelty. They also renew faster, because the specification is written around a supplier's documented capability rather than around a compound that anyone can quote. That is where portfolio effort belongs.

Volume / Commodity-Adjacent Tier

Standard artificial and nature-identical profiles for carbonates, syrups, and private label. Competes on landed cost against Turkish, Indian, and Chinese compounders. The wide margin range reflects large gaps in plant scale and regional labour cost.
Gross Margin: 22%-30%

Premium / Certified Tier

Natural extracts, distillates, and botanical preparations carrying full declaration documentation and traceability. Buyers pay for provenance evidence and audit readiness. Range width reflects the difference between commodity citrus extracts and single-origin certified botanicals within the same tier.
Gross Margin: 38%-48%

Sustainability / Regulatory / Next-Generation Tier

Fermentation-derived aroma compounds and taste modulation systems sold with development contracts and exclusivity terms. Margin reflects scarcity of qualified supply and the switching cost embedded in customer specifications naming the route.
Gross Margin: 52%-64%
united-states-europe-beverage-flavoring-market-portfolio-architecture-1787462524890

High-value Sub-segments and Strategic Watch-out

Fermentation-Derived Natural Aroma Compounds

Highest value and fastest growth at 9.1%. Declarable natural status without harvest exposure, specified by name in beverage briefs. Supply remains concentrated among majors and biotechnology partners, and qualified capacity is the binding constraint rather than customer demand. Pricing power should hold through the forecast period.
Gross Margin: 55%-64%

Taste Modulation and Masking Systems

High value, moderate growth, tied directly to sugar reduction volume rather than to novelty. Sold increasingly as billed development plus supply. Range width reflects the gap between off-the-shelf bitterness blockers and bespoke systems carrying exclusivity terms. Demand here tracks levy geographies rather than category fashion cycles.
Gross Margin: 48%-60%

Standard Citrus and Cola Flavour Compounds

The volume core, and the segment losing ground fastest on price. Regional compounders in Turkey, India, and China now meet specification at materially lower landed cost. Retaining this work requires plant scale, not formulation skill, and margin reflects that. Exiting deliberately beats losing the work slowly.
Gross Margin: 20%-28%

Vanilla and Single-Origin Botanical Extracts

The strategic watch-out. Premium pricing depends on natural declaration that fermentation routes increasingly satisfy at lower and steadier cost. Madagascar supply concentration adds political and weather risk that no contracting structure fully removes, and customer patience with volatility is thinning. Reprice or reposition before customers force the question.
Gross Margin: 34%-46%

How Beverage Accounts Actually Renew

Beverage flavour revenue is annuity revenue disguised as project work. Once a compound is written into a specification and the shelf-life data is signed off, it ships every month until the recipe changes, and recipes change slowly. Typical account tenure runs seven to nine years for a core profile. The development fee is visible; the ten years of unremarkable monthly shipment behind it is where the money actually accumulates.
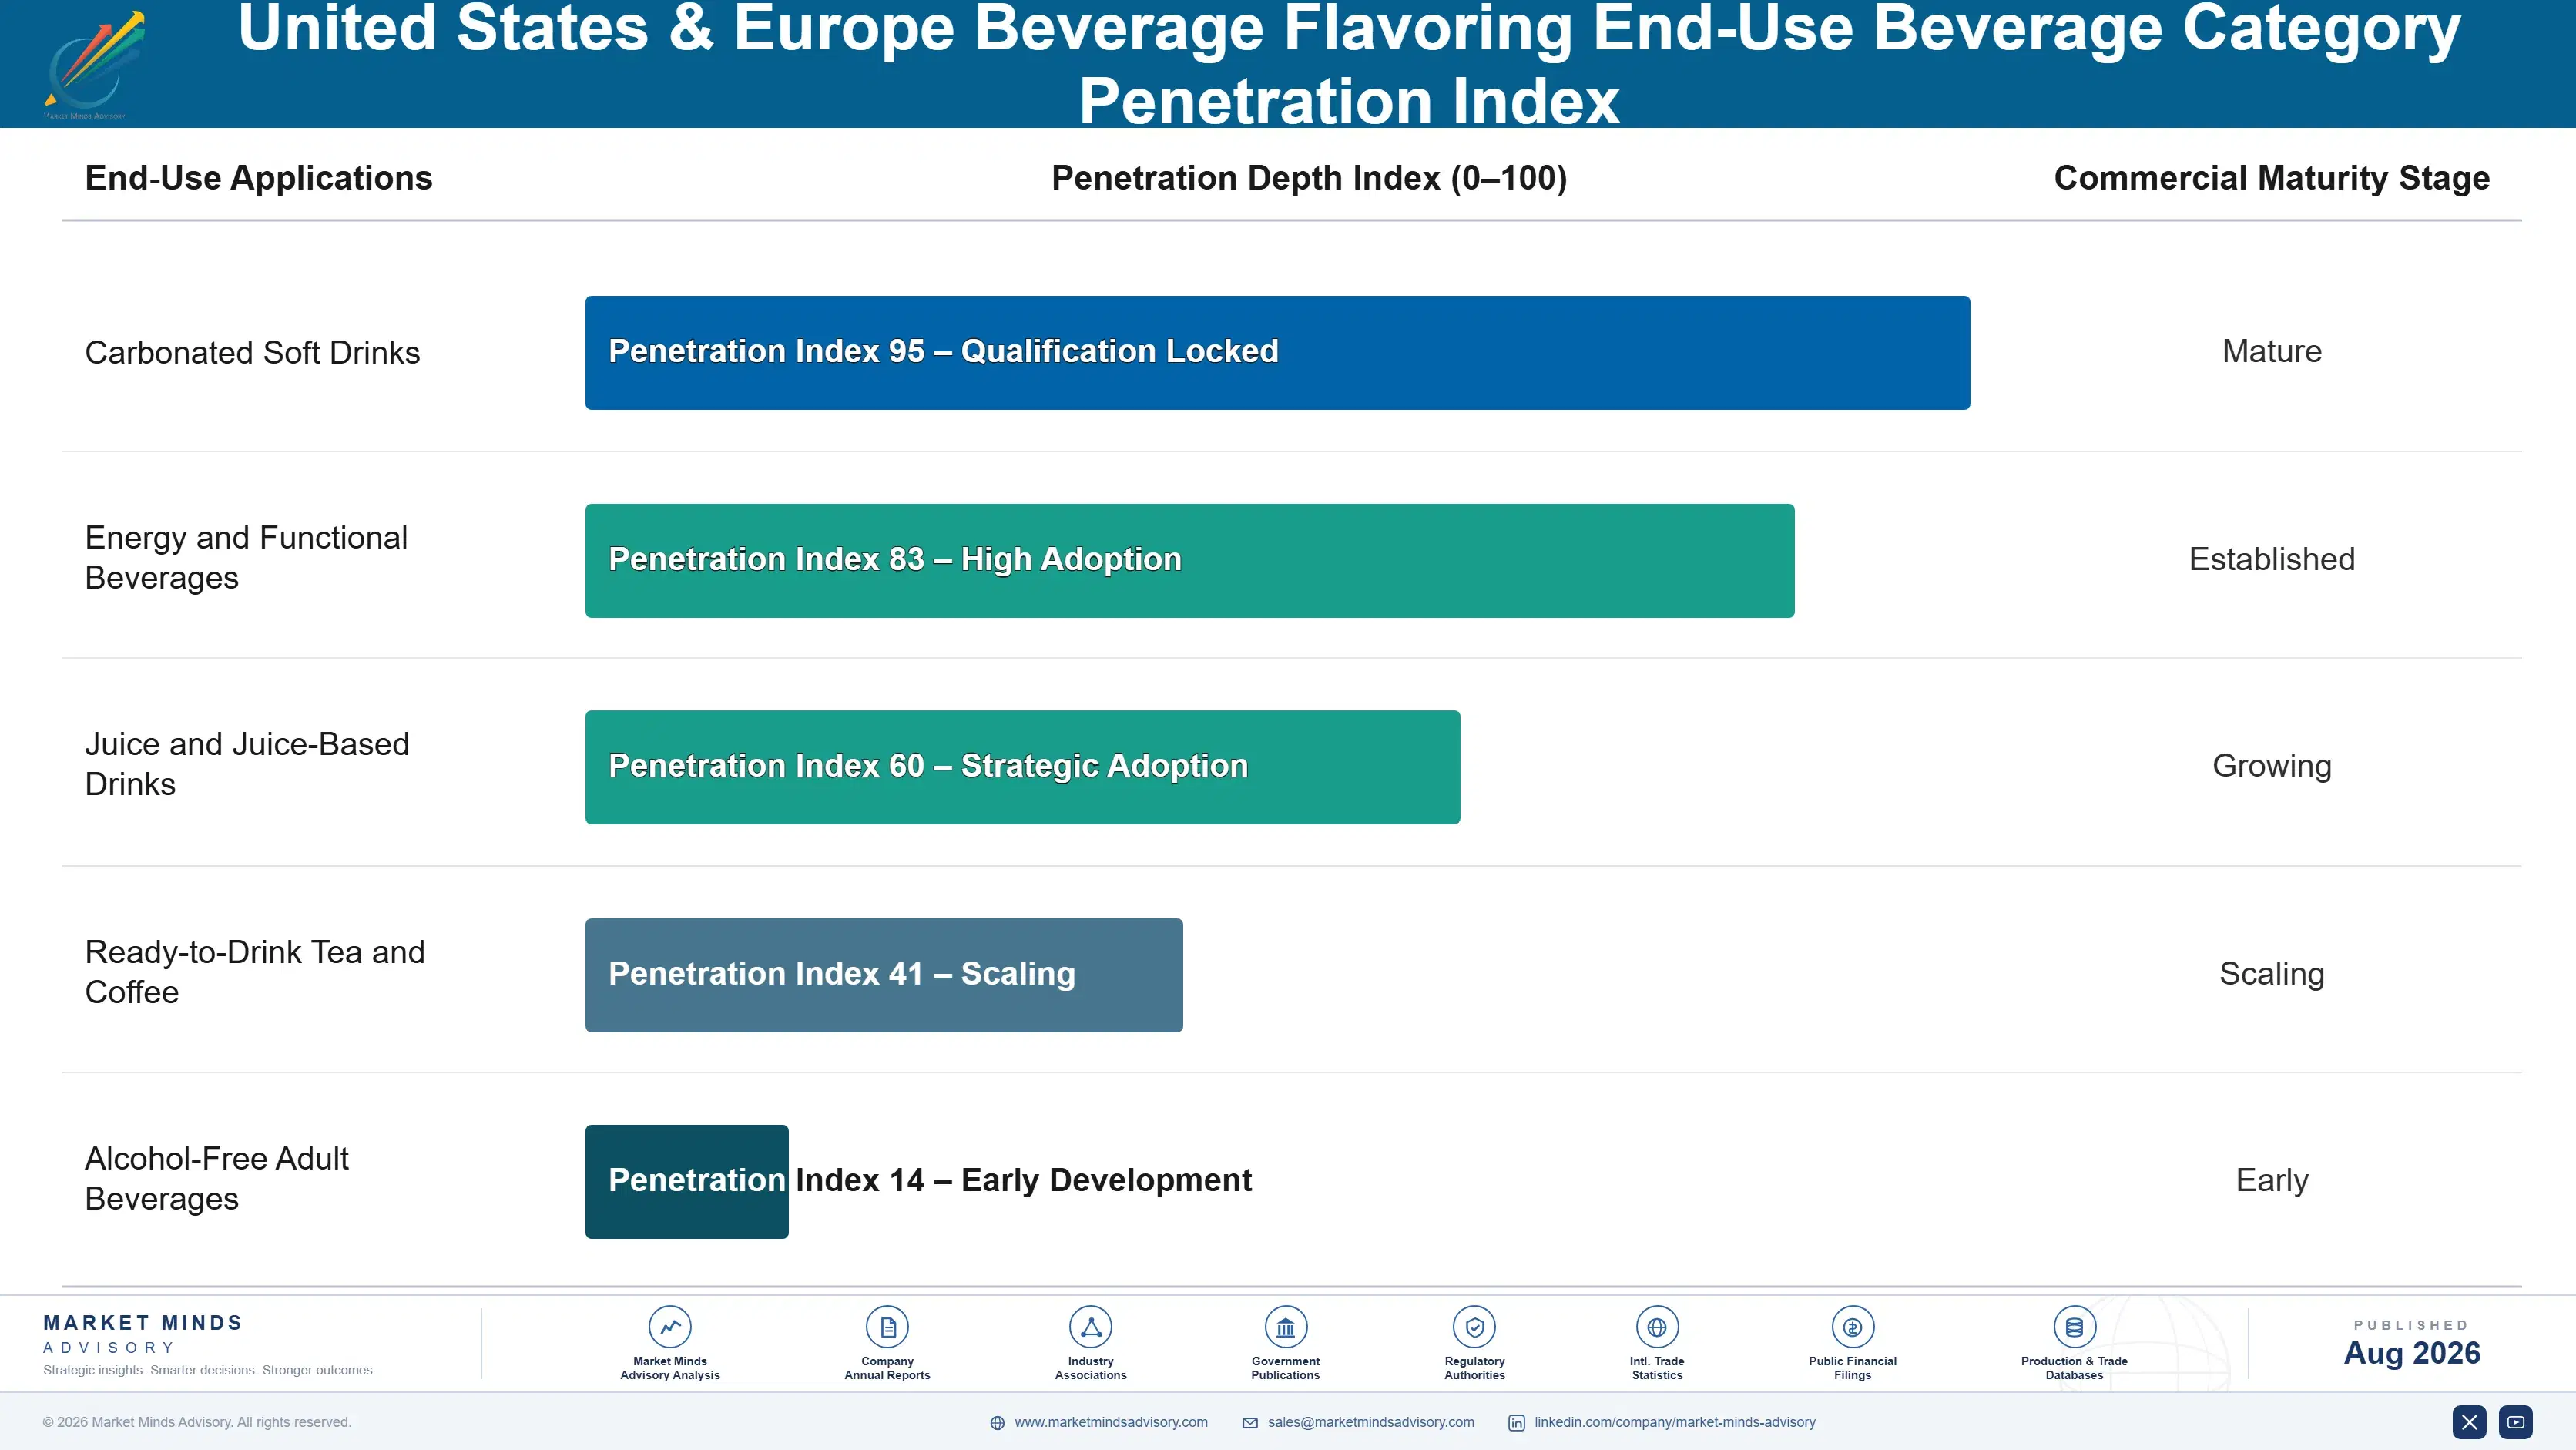
Stickiness varies sharply by vertical. Carbonated soft drinks are the stickiest, because sensory parity across decades is the brand promise itself and reopening a cola specification is close to unthinkable. Energy and functional accounts churn faster, since brands reposition constantly and flavour follows. Dairy-based and ready-to-drink coffee sit in between. Alcohol-free adult beverages are the least sticky of all, because the category is still finding its palate.

Buyer profiles have shifted noticeably since 2020. Procurement now sits alongside regulatory affairs and sustainability leads in supplier reviews, and questions about origin traceability routinely arrive before questions about unit price. A younger generation of category managers treats declaration integrity as a brand risk rather than a compliance chore, which favours suppliers able to produce audit evidence on demand.
united-states-europe-beverage-flavoring-market-end-use-penetration-index-1787462525399

What We Would Tell Boards

These are among the four positions where our research anticipates prominent divergence between winners and laggards over the coming forecast period. Each is grounded in the demand model, the regulatory perimeter, and the announced capacity pipeline.
01 / FERMENTATION CAPACITY POSITIONING

Secure declarable natural routes before the next citrus failure

Fermentation-derived compounds grow at 9.1%, roughly 1.57 times the market, because they deliver natural declaration without agricultural exposure, and beverage customers have begun naming the route in specifications. The suppliers holding qualified capacity when the next citrus harvest fails will convert accounts inside a single quarter while everyone else is still explaining price increases to procurement. Building or contracting that capacity costs less than the volume lost in one bad season, and it permanently raises switching cost across the remaining portfolio.
02 / DEVELOPMENT FEE DISCIPLINE

Stop giving away application work that customers now expect to buy

Continuous reformulation has made free development financially untenable, since a single reduced-sugar relaunch can absorb 600 laboratory hours across four flavours with no guaranteed volume at the end of it. Converting that work into milestone-billed contracts with defined iteration counts and exclusivity windows raises account gross margin by roughly 8 to 11 points and filters out brands that were never going to commit. The suppliers who moved first report that customers accepted the structure faster than their own commercial teams predicted.
03 / VOLUME TIER DECISION

Choose whether standard carbonate briefs stay in the portfolio

Regional compounders in Turkey, India, and China now meet specification on standard citrus and cola profiles at landed costs that Western houses cannot match without rebuilding their plant footprint. Holding that volume keeps compounding assets loaded, but it invites the line-by-line price comparison that erodes premium positioning across every other product in the same account. Either commit capital to compounding scale that competes on cost, or exit deliberately and accept lower utilisation in exchange for a cleaner and more defensible margin structure.
04 / ORIGIN RISK OWNERSHIP

Sell agricultural intelligence rather than absorbing the exposure quietly

Beverage brands carry unhedged positions in citrus, vanilla, mint, and hops without the internal capability to forecast any of them. A supplier already tracking those origins can package the view as a retained advisory at around $75,000 per major account annually, which is cheap relative to the information it buys. The fee matters less than the position it creates: planning partner rather than vendor, with sight of reformulation intent a year before the brief arrives and contract tenure extended by two to three years.

Engagement Snapshot From the Field

A live engagement with an industry participant carrying material or product regulatory and market exposure ahead of a defining policy shift, showing how our research translates into a defensible multi-year portfolio strategy.
MARKET MINDS ADVISORY · CLIENT ENGAGEMENT SUMMARY
United States & Europe Beverage Flavoring Producer Strategic Portfolio Review and Transition Roadmap 2026·Investment Scenario on United States & Europe Beverage Flavoring Exposure Evaluation 2025-26
CLIENT PROFILE
A Western European beverage group operating carbonated soft drink, juice-based, and alcohol-free adult beverage lines across nine countries, with annual revenue near EUR 1.9 billion (client-reported, unverified by MMA). The group had grown through acquisition and inherited four separate flavour supply relationships with overlapping specifications, inconsistent declaration standards, and no consolidated view of agricultural input exposure across its portfolio.
STRATEGIC CHALLENGE
Two sugar levies and a major retailer's revised own-brand specification landed within eleven months of each other. The group needed to reformulate 34 recipes while cutting flavour spend, yet discovered its four suppliers held incompatible masking approaches and that roughly 40% of its natural declarations depended on citrus oils from a single Brazilian origin.
MMA APPROACH
MMA mapped every active specification against declaration requirements in each of the nine markets, then modelled input exposure by compound family using origin-level harvest data. Supplier capability was assessed on fermentation access, application laboratory proximity, and demonstrated modulation depth rather than on quoted price. Findings were tested against 47 expert interviews conducted during Q4 2025.
KEY FINDINGS
  1. Roughly 40% of natural declarations traced to a single Brazilian citrus origin, leaving the reduced-sugar relaunch programme exposed to one harvest outcome.
  2. Two of the four incumbent suppliers held no qualified fermentation-derived alternatives, meaning any citrus disruption would force recipe changes rather than supplier substitution.
  3. Consolidating masking work with one modulation-capable supplier would cut development timelines by an estimated five months across the 34 affected recipes, chiefly by removing duplicated sensory validation.
  4. Retailer own-brand specifications were stricter than any national regulation in force, making retail compliance rather than legislation the binding constraint on formulation.
CLIENT PROFILE
A Western European beverage group operating carbonated soft drink, juice-based, and alcohol-free adult beverage lines across nine countries, with annual revenue near EUR 1.9 billion (client-reported, unverified by MMA). The group had grown through acquisition and inherited four separate flavour supply relationships with overlapping specifications, inconsistent declaration standards, and no consolidated view of agricultural input exposure across its portfolio.
STRATEGIC CHALLENGE
Two sugar levies and a major retailer's revised own-brand specification landed within eleven months of each other. The group needed to reformulate 34 recipes while cutting flavour spend, yet discovered its four suppliers held incompatible masking approaches and that roughly 40% of its natural declarations depended on citrus oils from a single Brazilian origin.
MMA APPROACH
MMA mapped every active specification against declaration requirements in each of the nine markets, then modelled input exposure by compound family using origin-level harvest data. Supplier capability was assessed on fermentation access, application laboratory proximity, and demonstrated modulation depth rather than on quoted price. Findings were tested against 47 expert interviews conducted during Q4 2025.
KEY FINDINGS
  1. Roughly 40% of natural declarations traced to a single Brazilian citrus origin, leaving the reduced-sugar relaunch programme exposed to one harvest outcome.
  2. Two of the four incumbent suppliers held no qualified fermentation-derived alternatives, meaning any citrus disruption would force recipe changes rather than supplier substitution.
  3. Consolidating masking work with one modulation-capable supplier would cut development timelines by an estimated five months across the 34 affected recipes, chiefly by removing duplicated sensory validation.
  4. Retailer own-brand specifications were stricter than any national regulation in force, making retail compliance rather than legislation the binding constraint on formulation.
RECOMMENDED STRATEGY
Phase 1: Phase 1 (months one to four): consolidate masking and modulation work with a single supplier under a milestone-billed development contract carrying exclusivity. Phase 2: Phase 2 (months five to twelve): qualify fermentation-derived citrus and vanilla equivalents across the twelve highest-exposure recipes without commercialising them immediately. Phase 3: Phase 3 (months thirteen to twenty-four): renegotiate remaining supply on indexed pricing tied to published crop benchmarks, retiring two overlapping relationships.
OUTCOME
The group completed 29 of 34 reformulations within eighteen months and reported flavour development cost down 17% against the prior programme (client-reported, unverified by MMA). Citrus origin concentration fell below 20% of natural declarations. Two supplier relationships were retired, and the retained development contract has since been extended.

Frequently Asked Questions

Foundational context covering the market sizes, CAGR, scope, country, region and competition that inform every finding below. This section is provided to cover basics and most often pre-purchase conversations, answered from the MMA Primary Research Dataset.

What is the current size of the United States & Europe Beverage Flavoring Market?

The market was valued at USD 7.2 billion in 2025, rising to an estimated USD 7.6 billion in 2026. North America and Western Europe together account for 58% of that value.

How large will the United States & Europe Beverage Flavoring Market be by 2036?

MMA forecasts USD 13.4 billion by 2036 under the base case, an expansion multiple of 1.76 times the 2026 level. Incremental value creation over the period reaches USD 5.8 billion.

What is the CAGR for the United States & Europe Beverage Flavoring Market 2026 to 2036?

The base case CAGR is 5.8%, with a bull case of 7.0% and a bear case of 4.6%. Historical growth between 2020 and 2025 ran at 4.9%.

Which segment is growing fastest?

Fermentation-derived and biotransformed aroma compounds, at 9.1%, roughly 1.57 times the overall market rate. They deliver natural declaration status without exposure to citrus and vanilla harvest volatility.

Who are the major companies in the United States & Europe Beverage Flavoring Market?

Givaudan, dsm-firmenich, International Flavors & Fragrances, Symrise, and Sensient Technologies lead, holding roughly 62% of beverage flavour participation between them. Takasago, Mane, Robertet, and Kerry Group follow.

Which country is growing fastest?

India, at 8.6%, driven by packaged beverage penetration and demand for traditional flavour profiles that imported libraries cover poorly. Growth comes from volume expansion rather than reformulation work.

Report Segmentation Architecture

The full report scope spans multiple orthogonal segmentation dimensions, with cross-tabulated demand data provided for each dimension pair. Coverage extends further to regional breakdowns, trend trajectories, and the competitive detail needed to support segment-level decision-making.

By Production Route

  • Natural Extracts, Essential Oils and Distillates
  • Fermentation-Derived and Biotransformed Aroma Compounds
  • Nature-Identical Synthesised Aroma Chemicals
  • Artificial Flavour Compounds
  • Botanical Infusions and Concentrated Botanical Preparations
  • Reaction and Process-Derived Flavour Bases

By End-Use Beverage Category

  • Carbonated Soft Drinks
  • Energy and Functional Beverages
  • Juice and Juice-Based Drinks
  • Ready-to-Drink Tea and Coffee
  • Alcohol-Free Adult Beverages

By Commercial Dimension

  • Global Brand Owners
  • Regional and Independent Bottlers
  • Retail Private Label
  • Contract Manufacturers and Co-Packers

By Region

  • North America
  • Western Europe
  • East Asia
  • South Asia and Pacific
  • Latin America
  • Middle East and Africa
  • Eastern Europe

Scope, Methodology, and Coverage

Every figure in this report is reproducible from documented input assumptions. The scope below maps the historical period, the forecast horizon, the segmentation dimensions, and the countries covered, alongside the underlying primary and qualitative methodology.
Historical Period
2020 to 2025
Forecast Period
2026 to 2036
Base Year
2025 (USD billions; MMA Primary Research Dataset, August 2026)
Market Definition
The market comprises flavour ingredients and formulated flavour systems supplied to beverage manufacturers, bottlers, and co-packers, covering natural extracts and distillates, fermentation-derived and biotransformed aroma compounds, nature-identical and artificial aroma chemicals, botanical preparations, and reaction-derived flavour bases. Commercial coverage centres on United States and European demand with global supply and pricing context. Sweeteners, colours, acidulants, preservatives, functional actives, and consumer-facing beverage concentrates fall outside scope.
Quantitative Units
USD billions (current prices); tonnes of flavour compound; USD per kilogram average selling price
Segmentation Dimensions
By Production Route; By End-Use Beverage Category; By Commercial Dimension; By Region
Regions Covered
North America, Western Europe, East Asia, South Asia and Pacific, Latin America, Middle East and Africa, Eastern Europe
Countries Covered
USA, China, Germany, France, UK, Japan, South Korea, India, Australia, Canada, Brazil, Mexico, Indonesia, Vietnam, Thailand, Malaysia, UAE, Saudi Arabia, South Africa, Nigeria, Turkey, Poland, Netherlands, Italy, Spain, Sweden, Switzerland, Argentina, Colombia, Singapore, and additional markets relevant to this sector
Key Companies Profiled
Givaudan, dsm-firmenich, International Flavors & Fragrances, Symrise, Sensient Technologies, Takasago International, Mane SA, Robertet, T. Hasegawa, Kerry Group, Doehler, Archer Daniels Midland, Tate & Lyle, McCormick & Company, Bell Flavors & Fragrances, Treatt plc, Iberchem, Synergy Flavours, Prova, Flavorchem Corporation
Quantitative Methodology
Primary survey, n=3,800 respondents, Q4 2025, six countries; demand-side model with trade association cross-validation
Qualitative Methodology
47 expert interviews, Q4 2025; applied to validate demand model assumptions, identify emerging dynamics, and assess competitive positioning
Report Format
PDF and XLSX data workbook (Word format preview document)
Publisher
Market Minds Advisory
Report Code
MMA-2026-CHM-118
Published
August 2026
Contact
sales@marketmindsadvisory.com | www.marketmindsadvisory.com

Purchase the full United States & Europe Beverage Flavoring Market Report (2026 to 2036).

The full report sizes beverage flavour demand across six production routes and seven regions, with 2026 to 2036 forecasts under base, bull, and bear cases. It maps declaration requirements market by market, showing where retailer specifications bind tighter than national regulation. Competitive profiles cover twenty suppliers assessed on beverage-attributable participation, application laboratory footprint, and fermentation access. Input cost modelling traces citrus, vanilla, mint, and aroma chemical exposure to origin level. Commercial guidance covers development fee structures, modulation bundling, origin risk pricing, and the volume tier exit decision now facing mid-sized houses.
Six production routes sized and forecast separately
Seven regional demand maps with country detail
Twenty supplier profiles on consistent participation basis
Citrus and vanilla origin exposure modelling
Declaration rules compared across nine regulatory jurisdictions
Development fee and exclusivity contracting benchmarks

Built For The People Who Decide

From boardroom strategy to bench-side execution, this report is read cover-to-cover by leaders shaping the next decade of their industry, turning demand scenarios, market dynamics and valuation benchmarks into decisions.
CXOs/ Presidents/ VPs/ Managers
M&A and Corporate Development
Strategy Teams and R&D Heads
Procurement and Product Directors
Regulatory and Compliance Leaders
Investor Relations and Equity Analysts