Market Minds Advisory
United States End-of-Line Packaging Market

United States End-of-Line Packaging Market: Retailer Chargebacks Fund More Automation Than Efficiency Does

American grocers and mass retailers now issue financial penalties for pallet and case non-compliance, and those chargebacks have justified rather more end-of-line investment than any efficiency calculation ever really managed.

Lead Analyst

Published

September 2026

Make Smarter Decisions with Customized Research Insights

Request a free sample report and evaluate market opportunities, growth trends, and competitive dynamics relevant to your business needs.

2025 MARKET VALUE$8.0BMarket Size 2025
2036 FORECAST VALUE$19.4BBase Case , 2026 to 2036
CAGR 2026 TO 20368.4 %Bull 9.6% / Bear 7.2%
INCREMENTAL OPPORTUNITY$10.8BNet 10- year value creation
EXPANSION MULTIPLE2.24x2036 value over 2026 base
Strategic Levers
M&A Pipeline
Regional Outlook
Country Rankings
Competitive Intelligence
Segmental Deep-dive
Call-Us : 91 93563 13602

Executive Snapshot and Market Trajectory

American retailers issue chargebacks for pallet and case non-compliance covering label placement, pallet pattern and load damage. Those penalties have justified more end-of-line capital than efficiency arguments ever did, and the practice is far more aggressive in the United States than anywhere else. Finance approves against penalties.
North America takes 32% of value because end-of-line automation intensity is the highest anywhere and American labour scarcity rather than volume growth is what drives it. Palletising and case packing are the hardest jobs in a plant to staff, and automation happens because nobody applies. Collaborative and flexible robotic cells grow at 12.6%, half again the market rate of 8.4%. Nobody automates to save a wage they are not paying.
Concentration is low at 29% and the constraint is not equipment supply. Systems integrators who install and commission these lines are fully booked, so quoted lead times reflect integrator availability rather than machine build time. Buyers who understand that plan differently, and builders without integration capacity of their own compete for somebody else's schedule. Buyers who understand that plan around it, and everyone else is surprised. Efficiency projections were routinely refused by the same committees.
Market Definition
The market covers equipment used after primary packaging is complete, including case packing and cartoning systems, palletising and depalletising systems, stretch wrapping and load containment, strapping and banding systems, collaborative and flexible robotic cells, and end-of-line vision and verification systems. Filling, sealing and primary packaging machinery, container manufacture, warehouse storage and retrieval systems, conveyor supplied as building infrastructure, and packaging materials are excluded. Systems integration services sold separately fall outside scope.
Base Year Value
$8.0B in 2025 (MMA Primary Research Dataset, August 2026)
Forecast Period
2026 to 2036, eleven discrete annual values
CAGR
8.4% base case. Bull 9.6%. Bear 7.2%.
Fastest Growth Segment
Collaborative and Flexible Robotic Cells: 12.6% CAGR
Fastest Growth Country
India: 10.6% CAGR
Fastest Growth Region
South Asia and Pacific: 10.4% CAGR
Largest Region
North America: 32% of 2025 global value
Market Leaders
ProMach, Barry-Wehmiller, Coesia, Duravant, Krones. Source: MMA Analysis based on disclosed packaging machinery and automation revenue, company annual reports 2025.
Primary Survey
n=3,800 procurement and R&D decision-makers, Q4 2025, six countries
Methodology
Demand-side build-up, cross-validated against public data, 47 expert interviews

United States End-of-Line Packaging Market Forecast Scenarios

united-states-end-of-line-packaging-market-size-forecast-scenario-1787696176968
Growth from 2020 to 2025 ran at 7.4% and American labour conditions drove most of it. Manufacturing plants struggled to staff palletising and case packing positions, which are physically demanding and unpopular, and automation followed recruitment failure rather than any rise in production volume. Retailer chargeback enforcement also tightened across the period, which converted compliance from an operational irritation into a capital justification finance teams accepted.
The 8.4% base case rests on three mechanisms. Flexible robotic cells keep displacing hard-tooled equipment because American retail assortments change faster than fixed automation can be retooled to follow. Vision and verification investment continues as chargeback exposure grows and quality problems from upstream surface at end-of-line. And Asian manufacturing capacity keeps expanding, which drives end-of-line demand in regions where automation intensity is still well below American levels. Each mechanism works independently of the others.
The bull case at 9.6% turns on integrator capacity expanding enough to shorten lead times, since projects are currently deferred by scheduling rather than by capital availability. The bear case at 7.2% is manufacturing investment slowing in a softer economy, which removes the plant expansion projects that carry most new end-of-line equipment into service. Neither turns on equipment capability itself.

Penalties Rather Than Payback

The financial case for end-of-line automation in the United States rarely rests on labour savings alone. Major grocers and mass retailers issue chargebacks for pallet and case non-compliance, covering label placement, pallet patterns, load stability and documentation, and those penalties reach around 1.8% of supplier revenue annually. Finance directors recognise that number immediately, and the practice is far more aggressive here than anywhere.
FIVE-FIRM CONCENTRATION29%Share of packaging machinery revenue held by leading suppliers
ROBOTIC PALLETISER COST$285,000Typical installed cost of one robotic palletising cell
TOP CONSUMING COUNTRYUSA 27%American share of global end-of-line packaging equipment demand
ANNUAL CHARGEBACK EXPOSURE1.8% of revenueSupplier revenue lost to retailer compliance penalties each year
INTEGRATOR LEAD TIME38 weeksTypical wait for systems integration capacity on a project
UNFILLED PALLETISING ROLES4 in 10Manual palletising positions reported vacant across surveyed plants
Labour rather than volume is what actually pushes plants to automate. Manual palletising and case packing are physically demanding, unpopular and among the hardest positions in any plant to fill, with roughly four in ten roles reported vacant across surveyed sites. Plants automate because recruitment produced nobody rather than because production grew. A supplier selling throughput is addressing a problem the plant does not have.
Equipment availability is not the constraint and everybody in the industry knows it. Systems integrators who install, commission and debug these lines are booked roughly 38 weeks out, so quoted project timelines reflect integrator scheduling rather than machine build. Buyers who understand this plan around it. Builders without integration capacity of their own are effectively competing for a slot in somebody else's calendar.
"Nobody signs off a palletiser to save labour any more, because there is no labour to save. They sign it off because a retailer sent an invoice for a crooked pallet."
Director, Packaging Automation and End-of-Line Practice · MMA Industrial Equipment Practice · August 2026

Market Trends

Flexible Robotic Cells Displace Hard-Tooled Automation

American retail assortments change faster than fixed automation can be retooled to follow, and a hard-tooled case packer becomes an obstacle the moment a pack format shifts. Collaborative and flexible robotic cells reprogram rather than retool, which turns a mechanical change into a software one. Growth at 12.6% follows that directly. Cells cost less to install than dedicated lines and run more slowly, which suits plants where changeover frequency rather than peak throughput determines what actually leaves the building. Changeover frequency rather than peak speed decides output. Displacement drives this, not new automation.
Market Impact: Recovers 1.8% of lost revenue
Vision Systems Bought As Chargeback Insurance

A mis-labelled case, an under-weight pack or an unstable pallet is detected at end-of-line if it is detected at all, which makes vision and verification the last chance to catch problems originating anywhere upstream. With chargeback exposure around 1.8% of supplier revenue, that equipment is justified as insurance rather than as quality improvement. Growth at 10.4% reflects finance teams approving it on avoided penalties, which is a considerably easier conversation than one about defect rates. Finance approves insurance more readily than improvement. A penalty figure beats a defect rate. Insurance sells more easily.
Market Impact: Replaces 4 in 10 vacant roles

Market Opportunities and Growth Drivers

Retailer Compliance Penalties Justify Capital Directly

American grocers and mass retailers enforce pallet and case compliance through chargebacks covering label placement, pallet patterns, load stability and advance shipping documentation, and exposure reaches roughly 1.8% of supplier revenue annually. Finance teams approve equipment against avoided penalties far more readily than against efficiency projections. That mechanism is considerably more aggressive in the United States than elsewhere, which is a large part of why American end-of-line automation intensity leads the world by a clear margin. Nothing else approves capital this reliably. American practice leads the world here. Automation intensity follows it.
Market Impact: Delays projects by 38 weeks

Manual Palletising Roles Cannot Be Filled

Stacking cases onto pallets by hand is physically demanding, repetitive and unpopular, and roughly four in ten of those positions are reported vacant across surveyed plants. Automation therefore follows recruitment failure rather than production growth, which changes the whole commercial argument. A supplier selling throughput improvement addresses a problem the plant does not have, while one selling a solution to an unfillable rota addresses the reason the capital request was raised in the first place. The wage is not being paid and the work is not being done, which changes the argument entirely.
Market Impact: Constrains changes across 6 formats

Market Restraints and Challenges

Integrator Capacity Rather Than Equipment Sets Lead Times

Systems integrators who install, commission and debug end-of-line equipment are booked roughly 38 weeks out, so project timelines reflect their scheduling rather than machine manufacture. Root cause is a skilled controls and commissioning workforce that takes years to build and that grew far slower than automation demand did. The commercial impact is projects deferred by calendar rather than by budget, and builders without owned integration capacity competing for somebody else's slot. Mitigation involves developing integration capability internally, which several suppliers have begun. Owning that capability is the only answer. Several suppliers have started.
Market Impact: Reprograms rather than retools 6 formats

Fixed Automation Becomes An Obstacle When Formats Change

A hard-tooled case packer or palletiser configured for a specific pack format requires mechanical change parts and downtime when that format shifts, and American retail assortments change frequently. Root cause is that the equipment was specified when long production runs were normal. The commercial impact is capital installed a few years ago now limiting what a plant can accept from its own commercial team. Mitigation runs toward flexible robotic cells, which reprogram rather than retool and which are displacing fixed equipment steadily. Software replaces mechanical change parts. Assortments moved underneath the equipment.
Market Impact: Protects 1.8% of annual revenue
3 additional market trends, 4 additional growth drivers, and 2 additional restraints and challenges are covered in the full report. Contact sales@marketmindsadvisory.com to access the complete intelligence.

Segment CAGR and Growth Architecture

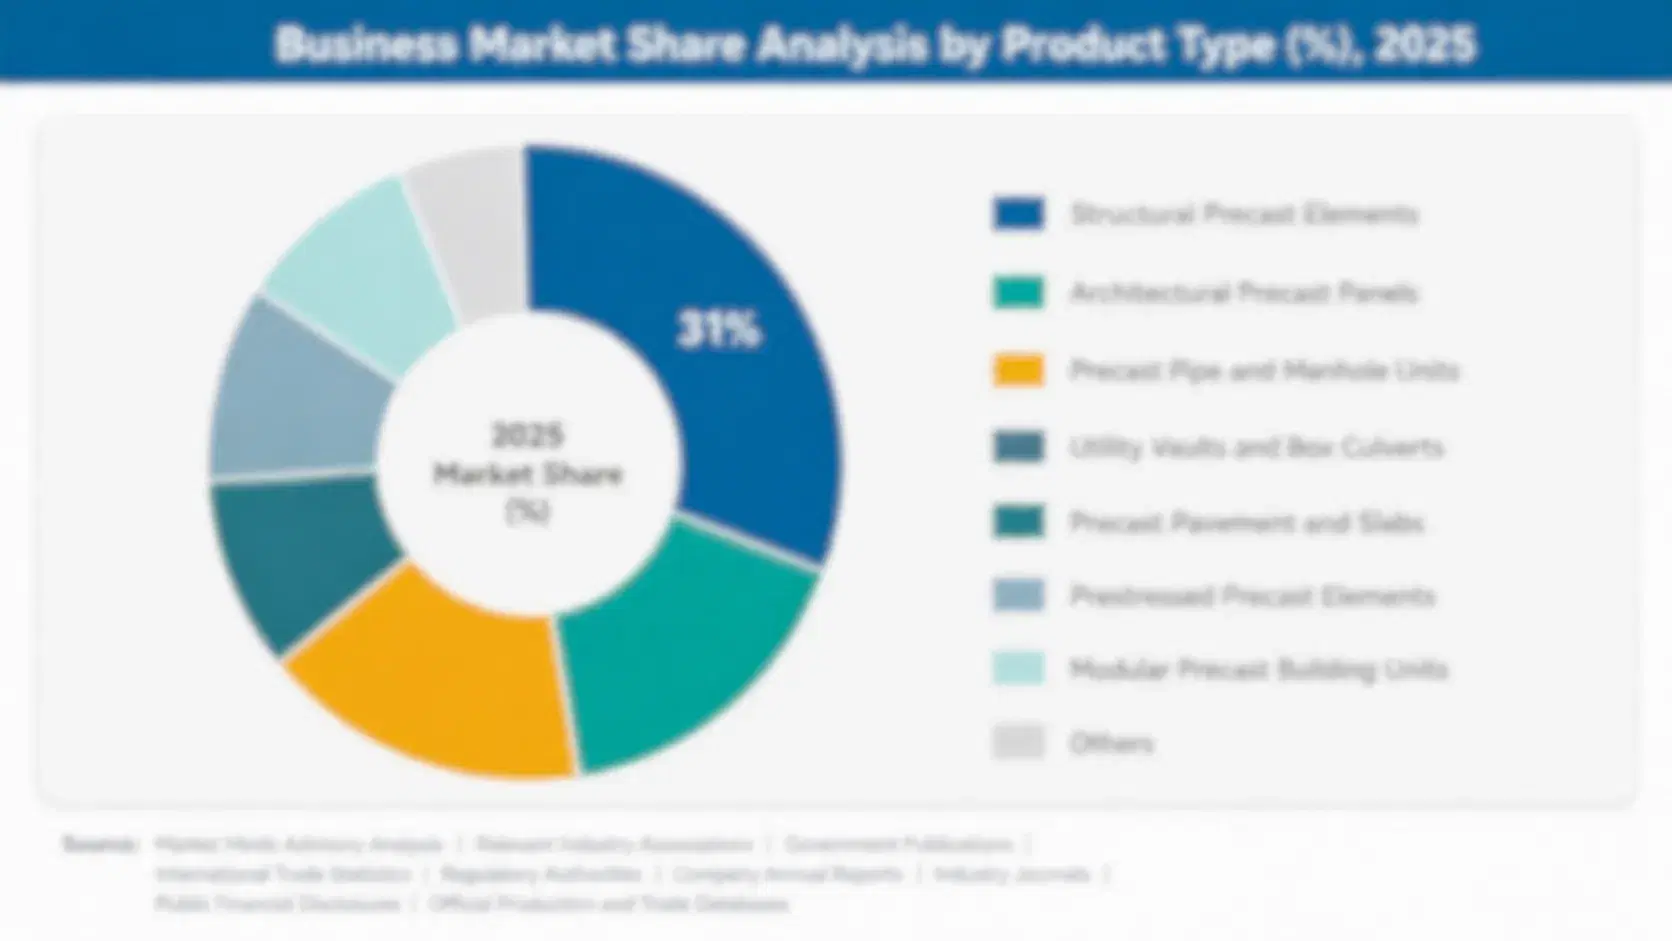
Segmentation follows equipment function: what each system does to the pack, the case or the pallet after primary packaging finishes, rather than which product runs through it. Six functions cover the market without overlap, from case packing through to vision and verification. End-use industry and commercial arrangement are treated separately here. Both cut across all six functions.
united-states-end-of-line-packaging-market-market-share-analysis-1787696177247

Collaborative and Flexible Robotic Cells

Reprogramming a robotic cell for a new pack format takes software rather than mechanical change parts and downtime, which matters enormously where retail assortments shift faster than fixed automation can follow. Growth at 12.6%, half again the market rate of 8.4%, comes from displacing hard-tooled equipment rather than from automating manual operations that were never automated at all. Cells run more slowly than dedicated lines and cost considerably less to install, which suits plants where changeover frequency rather than peak throughput determines how much product actually leaves the building each week. Displacement rather than new automation is what drives this segment forward. Cost of installation is considerably lower too, which suits plants that never needed peak throughput.
CAGR 12.6%

End-of-Line Vision and Verification Systems

Everything that went wrong upstream shows up at end-of-line or reaches a retailer, which makes vision and verification the last opportunity to catch a mis-labelled case, an under-weight pack or an unstable load before penalties follow. With chargeback exposure at roughly 1.8% of supplier revenue, finance teams approve this equipment as insurance rather than as quality improvement. Growth at 10.4% follows that framing. Suppliers presenting defect detection rates are making a technical argument where a financial one is available and considerably more persuasive to whoever signs. Detection rates are the wrong argument entirely when a penalty figure is available. Whoever signs the capital request is reading a penalty line rather than a specification sheet.
CAGR 10.4%
Full segment breakdown across 6 segments available in the complete report.

Regional Architecture and Country Demand Map

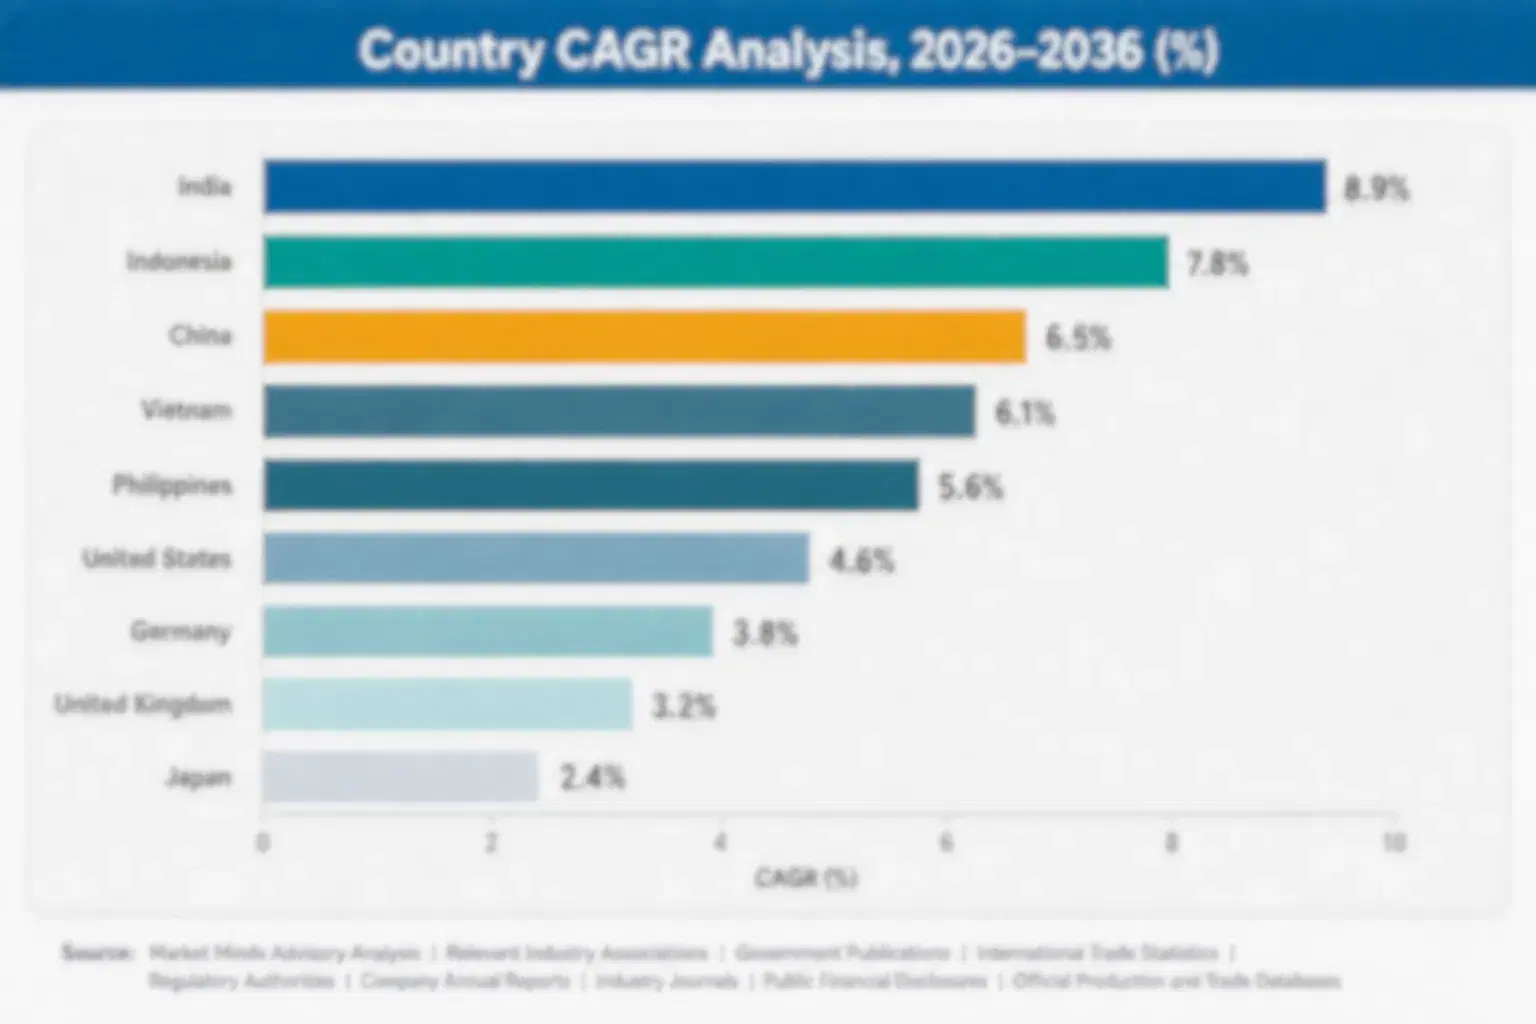
Geography follows automation intensity and labour cost rather than manufacturing volume alone, which is why American demand exceeds its share of production. East Asia follows on manufacturing scale, and South Asia grows fastest from lower automation levels. Labour scarcity rather than wage cost is the American driver.

North America

American end-of-line automation intensity is the highest anywhere, driven by labour scarcity in physically demanding roles and by retailer chargebacks that convert compliance into a capital justification finance teams accept readily. Roughly four in ten manual palletising positions are reported vacant across surveyed plants. Systems integrator capacity rather than equipment availability sets project timelines throughout the region. Retail assortment change is faster here than elsewhere, which pushes buyers toward flexible cells. Canadian plants follow similar patterns, and Mexican manufacturing has automated rapidly with nearshoring investment across the past several years. Retail assortment change is faster here than elsewhere, which pushes buyers toward flexible cells rather than hard-tooled equipment on every new project.
Share: 32% | CAGR: 7.6% (2026 to 2036)

Western Europe

European end-of-line automation is well established and driven more by regulation, ergonomics rules and manufacturing consolidation than by the retailer penalty mechanism that shapes American investment. German, Italian and Dutch builders supply equipment used worldwide, making the region a larger producer than consumer. Retail compliance is enforced through commercial agreements rather than the aggressive chargeback culture found in American grocery. Energy and labour costs support continued automation, though plant expansion is slower than in growth regions and much demand is replacement rather than addition. Much regional demand is replacement rather than addition, since plant expansion is slower than across the growth markets that drive equipment volume. Ergonomics rules drive it here.
Share: 21% | CAGR: 6.8% (2026 to 2036)
Regional intelligence for 5 additional markets available in the complete report: East Asia, South Asia and Pacific, Latin America, Middle East and Africa, Eastern Europe. Contact sales@marketmindsadvisory.com.
united-states-end-of-line-packaging-market-country-cagr-analysis-1787696177533

Selling Against Retailer Penalty Exposure

Chargeback exposure runs around 1.8% of supplier revenue, integrators are booked 38 weeks out, and roughly four in ten palletising roles sit vacant. Four levers work on financial framing, integration capacity, format flexibility and labour reality rather than on throughput, which nobody is buying against. Nobody is buying on cases per minute. Throughput reaches none of it.

Quantify Chargeback Exposure Before Quoting Equipment

Retailer penalties for pallet and case non-compliance reach roughly 1.8% of supplier revenue annually, which is a figure finance directors recognise immediately and approve against far more readily than efficiency projections. Suppliers who obtain a prospect's own chargeback data and build the avoided penalty case reframe the entire purchase. The work is commercial analysis rather than product development, and it reaches the person signing rather than the engineer specifying, which is where these decisions actually get made. Around 1.8% of revenue is a number nobody argues with. Engineering never sees that data.
Market Impact: Recovers the 1.8% of revenue currently lost annually

Build Owned Integration Capacity Not Partnerships

Systems integrators are booked roughly 38 weeks out and project timelines follow their calendars rather than machine build schedules, which means a builder without owned integration capability is quoting somebody else's availability. Developing that capacity internally costs recruitment of controls and commissioning engineers who are genuinely scarce and takes years to assemble. It also converts lead time from a constraint into a competitive advantage, since a builder who can commission sooner wins projects on schedule alone. Around 38 weeks is what competitors quote. Owning the calendar wins awards. Scarce engineers are the barrier.
Market Impact: Compresses a 38 week project lead time materially

Sell Format Flexibility Rather Than Line Speed

American retail assortments change faster than hard-tooled equipment can be retooled to follow, and a fixed case packer becomes an obstacle when the commercial team launches a new pack format. Flexible cells reprogram in software instead. Growth at 12.6% follows that reality, and suppliers quoting cases per minute are answering a question that stopped mattering when assortments began changing continuously. The argument requires understanding a customer's own format change frequency rather than any product capability. Format change frequency is the number that matters. Retooling downtime is the real cost. Commercial teams launch constantly.
Market Impact: Handles 6 pack formats without any retooling downtime

Address The Rota Rather Than The Labour Cost

Roughly four in ten manual palletising positions are reported vacant, which means plants automate because recruitment produced nobody rather than because labour became expensive. A supplier presenting payback against wage cost is answering the wrong question entirely, since the wage is not being paid and the work is not being done. Framing the equipment as a solution to an unfillable rota reaches the operations manager who raised the capital request and explains what actually prompted it. Roughly 4 in 10 positions sit empty, which is the fact behind the request rather than any wage calculation.
Market Impact: Fills the 4 in 10 vacant palletising positions

Who Controls the Margin Pool

Measured on disclosed packaging machinery and automation revenue, the five leading suppliers hold a CR5 of 29%, which is low and reflects a market assembled from many specialist builders serving distinct end-of-line functions. ProMach, Barry-Wehmiller, Coesia and Duravant have each grown through acquisition of function specialists, while robot suppliers participate through cells that integrators rather than builders assemble. Function specialists rather than integrated builders assembled this industry.
Three contests define activity. Conventional case packing and palletising compete on price and service within regional territories, where equipment is broadly comparable. Flexible robotic cells compete on programming and changeover capability rather than throughput. Vision and verification competes on financial framing, reaching finance rather than engineering. A builder strong in one of those three contests reaches an entirely different buyer from the others, since engineering, operations and finance evaluate on unrelated criteria.

Pressure comes from robot manufacturers whose cells reach customers through integrators without any traditional builder involved, and from Chinese equipment in price-sensitive functions. Rankings shift where integration capacity decides project awards, since a builder who can commission sooner wins on schedule regardless of specification. Schedule now beats specification consistently.
united-states-end-of-line-packaging-market-company-positioning-matrix-1787696177833

Competitive Moat and Risk Dimensions

PROMACH

Moat: Function Breadth Across The Line

ProMach assembled specialist builders across case packing, palletising, labelling and inspection, which lets a customer source a whole end-of-line from one accountable supplier rather than integrating several. That breadth matters most when a plant wants one party responsible for whether the line runs. A single-function specialist leaves the customer coordinating interfaces between suppliers.
PROMACH

Risk: Integration Capacity Dependency

Project timelines follow systems integrator availability at roughly 38 weeks rather than equipment manufacture, and breadth of equipment portfolio does not shorten that queue. Customers increasingly award on schedule rather than specification. Owning integration capability matters more than owning another machine brand, and acquisition strategy has largely pursued the latter across this industry.
BARRY-WEHMILLER

Moat: Installed Base Service Density

Barry-Wehmiller supports a large installed base through service networks that reach plants quickly when a line stops, and end-of-line downtime halts everything upstream of it immediately. That response capability is genuinely valuable and slow to replicate across a continent. A competitor with better equipment still competes against a supplier whose engineer arrives the same day.
BARRY-WEHMILLER

Risk: Flexible Cell Displacement

Growth is concentrating in flexible robotic cells at 12.6%, which reach customers through integrators and robot suppliers rather than through traditional machinery channels. An installed base of hard-tooled equipment is exactly what those cells displace when formats change. Service density protects existing revenue without providing entry to the segment replacing it.

Players Tracked

Prominent Players

ProMach
Barry-Wehmiller
Coesia
Duravant
Krones

Other Key Players

Syntegon
Marchesini Group
IMA Group
Fanuc
ABB
KUKA
Universal Robots
Columbia Machine
Brenton
Signode
Mollers
Beumer Group
Cama Group
Schneider Packaging Equipment
Delkor Systems

Recent Developments

FEBRUARY 2025

Consumer goods manufacturer approves palletising capital against chargeback exposure

A consumer goods manufacturer approved robotic palletising capital justified against retailer chargeback exposure rather than labour saving, a capital decision rather than any supplier partnership. Compliance penalties for pallet pattern and load stability had become a visible cost line that finance leadership could evaluate directly against equipment investment.
Signal: Penalty avoidance is now the accepted capital justification, which reaches finance rather than plant engineering entirely.
JUNE 2025

Machinery builder acquires systems integration business outright

An end-of-line machinery builder acquired a systems integration business, a corporate acquisition rather than a partnership or supply agreement. Integrator scheduling had been setting project timelines across the industry, and owning commissioning capacity converts lead time from a shared constraint into a controllable competitive variable.
Signal: Builders are buying integration capacity because schedule now wins projects that equipment specification alone does not.
OCTOBER 2025

Food producer replaces hard-tooled case packer with flexible cell

A food producer replaced a hard-tooled case packing line with a collaborative robotic cell, a capital replacement decision rather than any commercial arrangement. The existing equipment had required mechanical change parts and downtime whenever pack formats shifted, which its commercial team was doing several times each year.
Signal: Fixed automation installed for long runs is now being replaced early because assortments changed underneath it.

What End-of-Line Costs

Bought-in automation components dominate. Robots, servo drives, controls, vision hardware and structural fabrication together run 48 to 55% of manufacturing cost for a typical end-of-line system, with robots and controls the largest purchased elements. Assembly and factory testing carry part of the remainder, and commissioning cost rises with plant complexity rather than with machine capability, which is why identical equipment costs differently to install at different sites.
The volatility that matters is controls availability and skilled labour. Industrial control and servo lead times extended well past production assumptions through 2021 and 2022, and commissioning engineers remain genuinely scarce across the American market. IEA industrial energy data documents the European fabrication cost increases that compounded matters for imported equipment. Builders with allocation and owned commissioning met schedules; others quoted dates they did not control.

Exposure divides by integration model and manufacturing location. Builders owning commissioning capacity carry payroll through quiet periods and control their own schedules. Those relying on third-party integrators carry no payroll and no schedule control either. Western builders carry higher fabrication and labour cost on broadly comparable equipment. Buyers notice only the quoted price and the promised date, which is where those cost differences actually surface.
united-states-end-of-line-packaging-market-cost-volatility-analysis-1787696178114

Secure control component allocation against quoted schedules

Servo and control lead times extended well past production assumptions through 2021 and 2022, and builders without allocation quoted commissioning dates they could not meet. Allocation agreements cost working capital and inventory risk. They prevent the failure that loses a capital order outright, since a plant expansion has a production start date that moves for nobody at all.

Carry commissioning engineers rather than subcontracting

Commissioning engineers are scarce and integrator scheduling sets project timelines across this industry at roughly 38 weeks. Carrying that payroll through quiet periods is expensive and converts lead time into something a builder controls. Suppliers subcontracting commissioning quote dates set by a third party whose priorities are somebody else's projects entirely. Nobody else prioritises your customer.

Standardise cells across function families

Building each end-of-line function from unrelated designs carries engineering and inventory cost that shared robotic platforms remove. Standardising cell architecture across palletising, case packing and inspection is design work taken once that determines cost position for years. Competitors improving assembly efficiency later cannot reach a position established during original platform design. Platform decisions taken once govern cost for years.

Portfolio Architecture for Margin Defence

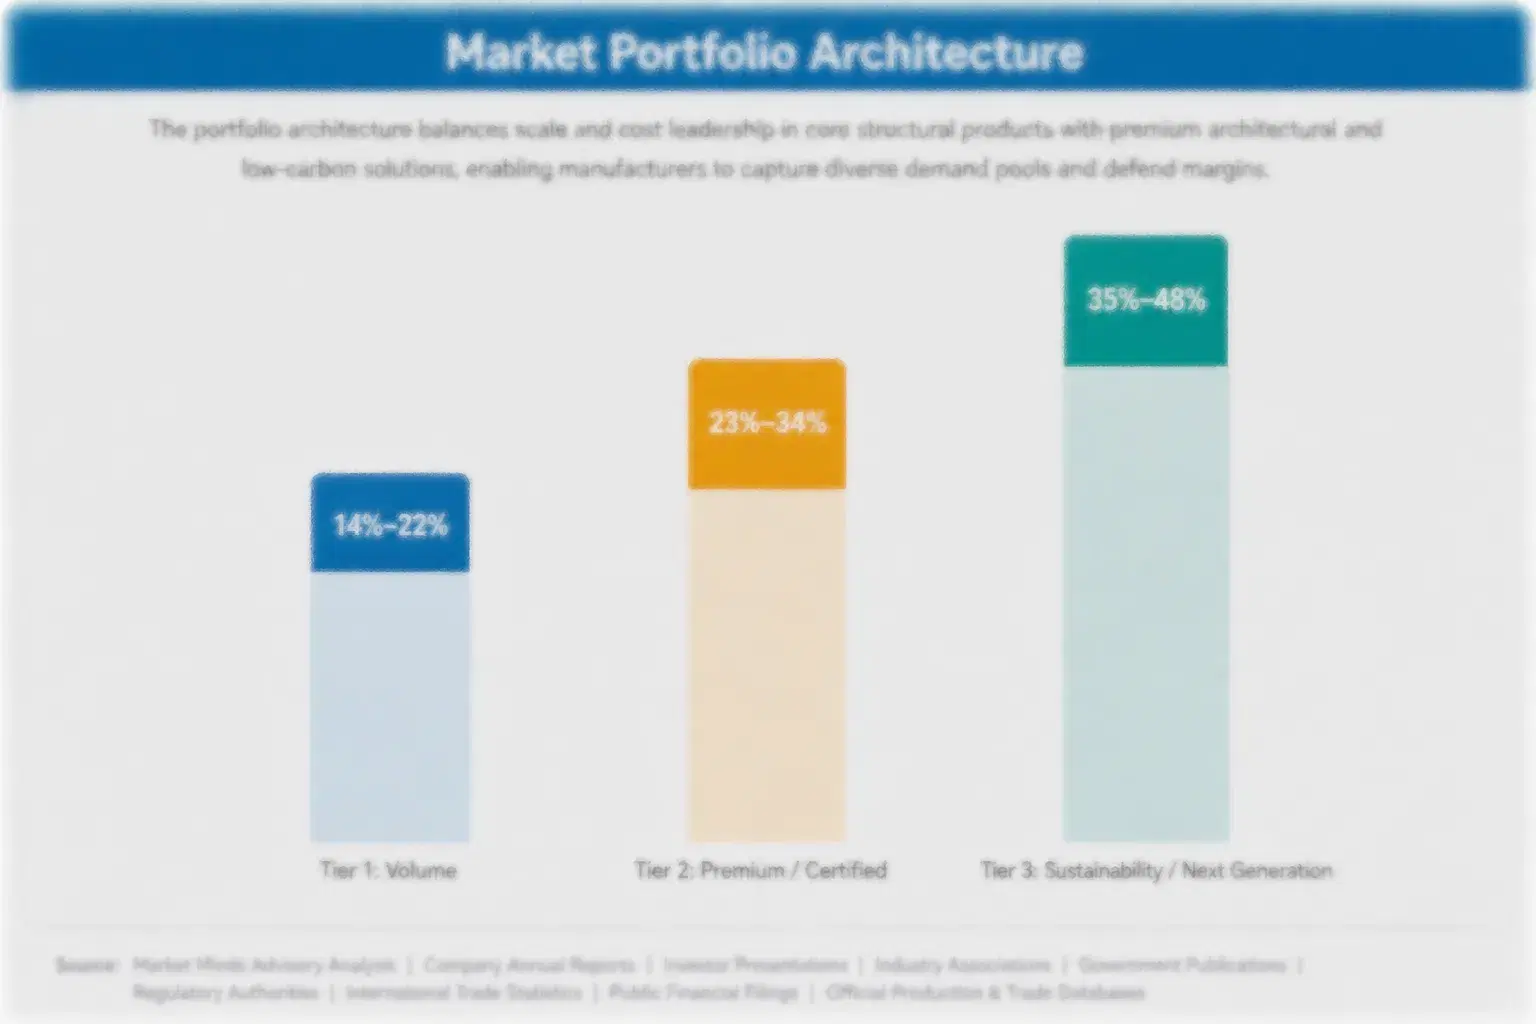
Margin follows how comparable the equipment looks and who signs for it. Conventional palletising and strapping are broadly comparable across builders and priced accordingly within regional territories. Case packing earns better where format handling genuinely differentiates. Flexible robotic cells earn more because the benefit shows in a customer's own changeover schedule. Vision and verification earns most, because it is approved against avoided penalties rather than compared on specification.
The tension is that the growth is reaching customers through channels traditional builders do not own. Flexible cells arrive via integrators and robot suppliers, and vision is justified to finance rather than specified by engineering. Builders whose commercial organisation calls on plant engineering are absent from both conversations, and acquisition strategy across this industry has mostly bought more machine brands rather than the capabilities those conversations require.

High-value pools sit in three places. Vision and verification sold against quantified chargeback exposure. Flexible robotic cells sold on format change frequency rather than throughput. And owned integration capacity, which is not sold to anybody directly and increasingly decides which builder wins a project at all. Two of the three sit outside the machinery channel entirely.

Volume / Commodity-Adjacent

Conventional palletisers, strapping and stretch wrapping equipment supplied against broadly comparable competitor specifications. The 7-point range separates builders with standardised platforms and component allocation from those engineering each order individually and buying controls at prevailing spot terms.
Gross Margin: 19-26%

Premium / Certified

Case packing, cartoning and integrated end-of-line supply requiring format handling capability and commissioning support. The 7-point spread separates builders offering full line accountability with owned commissioning from those supplying machines into installations that third parties integrate and guarantee.
Gross Margin: 31-38%

Sustainability / Regulatory / Next-Generation

Flexible robotic cells and end-of-line vision and verification systems. The 22-point range is wide because vision is approved against quantified penalty avoidance while robotic cells compete partly against robot suppliers reaching customers through integrator channels instead.
Gross Margin: 36-58%
united-states-end-of-line-packaging-market-portfolio-architecture-1787696178445

High-value Sub-segments and Strategic Watch-out

Vision And Verification Systems

Highest value here, approved by finance against chargeback exposure of roughly 1.8% of revenue rather than compared on detection specification by engineers. The risk is that the argument requires obtaining a prospect's own penalty data, which most commercial organisations are not equipped to request. Finance holds the data.
Gross Margin: 55-58%

Flexible Robotic Cells

Fastest growth at 12.6%, displacing hard-tooled equipment as retail assortments change faster than mechanical retooling can follow them. The risk is channel, since these cells frequently reach customers through integrators and robot suppliers rather than through traditional machinery builders at all. Builders miss that channel.
Gross Margin: 44-47%

Conventional Palletising

The volume core, broadly comparable across builders and priced within regional service territories where response time matters as much as capability. Builders hold the position because installed base carries the service revenue and the relationships through which higher value systems sell. Service revenue follows it.
Gross Margin: 20-23%

Third Party Integration Dependency

The strategic watch-out. Builders without owned commissioning capacity quote lead times set by integrators booked around 38 weeks out and prioritising other customers. The risk is losing projects on schedule alone, regardless of how competitive the equipment specification or the price happens to be. Nothing compensates for it.
Gross Margin: 25-28%

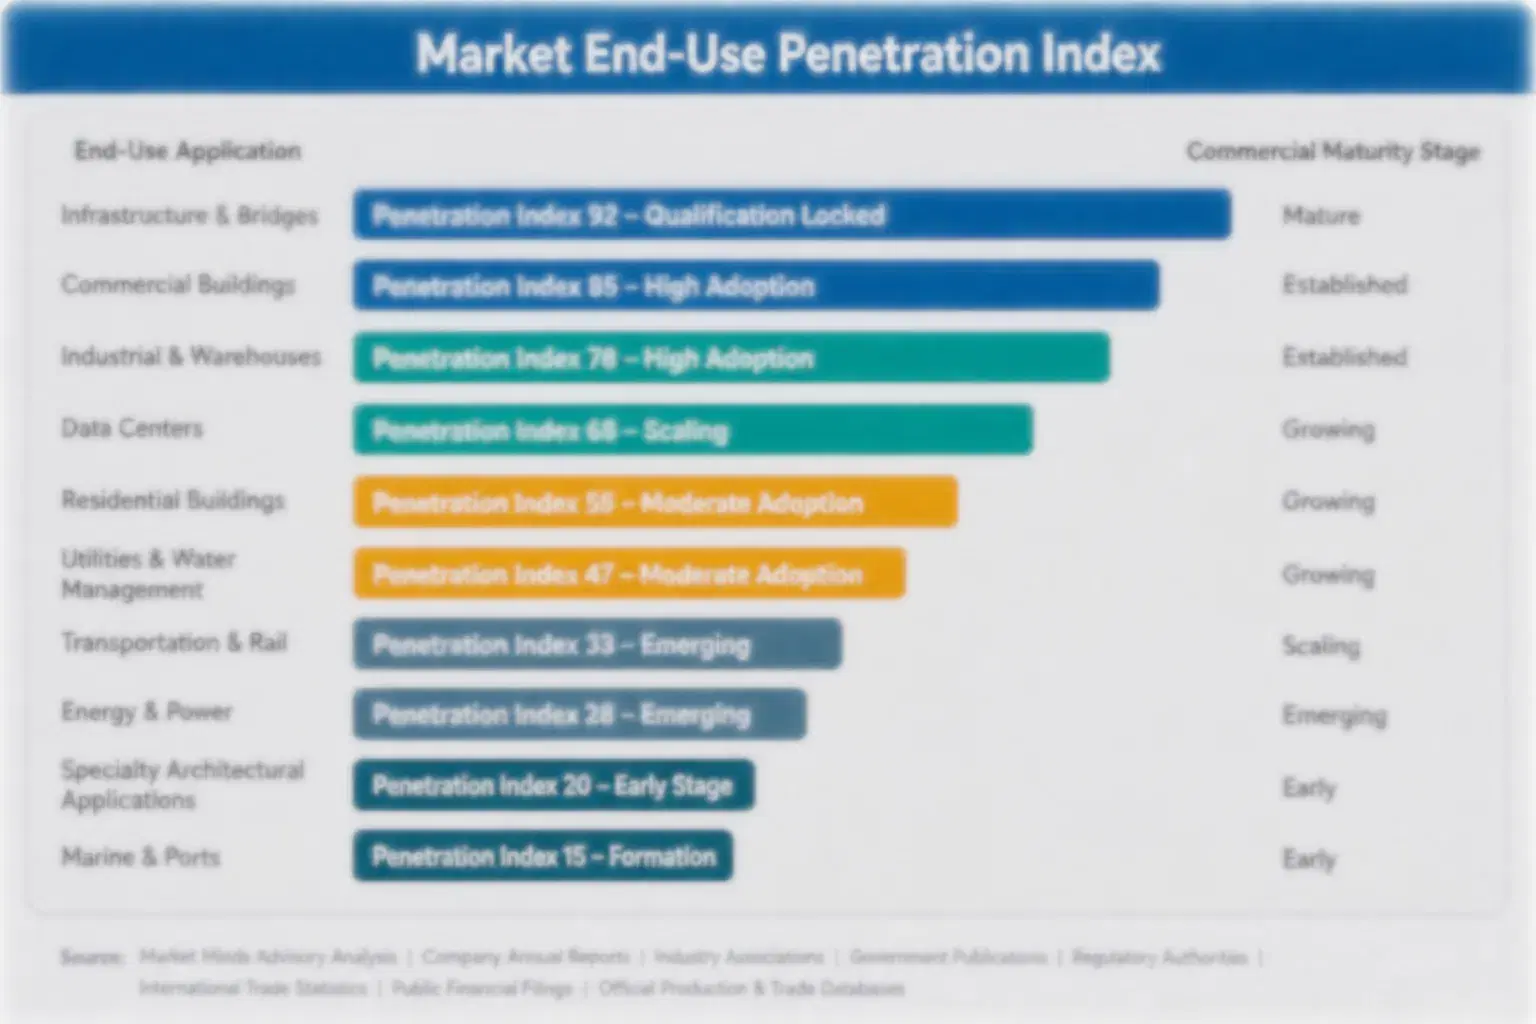
Capital Approved On Penalties

End-of-line equipment runs for fifteen years or more and the purchase is revisited only when a plant expands, a format changes beyond what the machine handles, or a retailer penalty makes compliance a board matter. Machine revenue is therefore lumpy while parts and service recur across that whole life. Builders treating service as an afterthought are surrendering the only continuous income the business generates, which is a common mistake in capital equipment generally.
Stickiness depends on integration depth and service reach. A complete end-of-line commissioned by one builder is effectively permanent, since replacing any station means revalidating interfaces nobody wants to revisit. Individual machines inside somebody else's line are replaced more readily. Flexible cells move most freely of all, since reprogramming rather than retooling means the switching cost that protected fixed automation simply does not exist.

Approval has moved from plant engineering toward finance. A palletiser justified on labour saving was an engineering request; one justified on avoided retailer chargebacks is a finance decision supported by data the plant does not own. Builders whose commercial organisation calls on engineering are addressing people who specify equipment while somebody in finance decides whether the capital exists at all.
united-states-end-of-line-packaging-market-end-use-penetration-index-1787696178740

What Actually Signs The Cheque

These are among the four positions where our research anticipates prominent divergence between winners and laggards over the coming forecast period. Each is grounded in the demand model, the regulatory perimeter, and the announced capacity pipeline.
01 / PENALTY EXPOSURE QUANTIFICATION

Chargebacks approve capital that payback cannot

Retailer penalties for pallet and case non-compliance reach roughly 1.8% of supplier revenue annually, which is a figure finance directors recognise instantly and approve against far more readily than any efficiency projection. Suppliers who obtain a prospect's own chargeback data and build the avoided penalty case reframe the entire purchase decision. The required work is commercial analysis rather than any product development at all, and it reaches the person who signs the cheque rather than the engineer who writes the specification.
02 / INTEGRATION CAPACITY OWNERSHIP

Schedule wins projects that specification does not

Systems integrators are currently booked roughly 38 weeks out, and project timelines follow their calendars rather than any machine build schedule, so a builder without owned integration capability is effectively quoting somebody else's availability. Developing that capacity internally means recruiting controls and commissioning engineers who are genuinely scarce, and it takes several years to assemble the team properly. It converts lead time from a shared industry constraint into a genuine competitive advantage that wins project awards outright on schedule alone.
03 / FORMAT CHANGE SELLING

Assortments change faster than tooling can

American retail assortments now change considerably faster than hard-tooled equipment can be retooled to follow them, and a fixed case packer becomes an outright obstacle the moment a commercial team launches any new pack format. Flexible robotic cells reprogram in software instead, which is exactly why growth at 12.6% concentrates there rather than in any conventional equipment. Suppliers still quoting cases per minute are answering a question that stopped mattering entirely once retail assortments began changing continuously through the year.
04 / LABOUR REALITY FRAMING

Nobody is saving a wage they cannot pay

Roughly four in ten manual palletising positions are reported vacant across surveyed plants, which means automation follows recruitment failure rather than any calculation about labour becoming expensive. A supplier presenting payback against wage cost is answering entirely the wrong question here, since that wage is not being paid at all and the work is simply not getting done. Framing the equipment as a solution to an unfillable rota reaches the operations manager who actually raised the capital request in the first place.

Engagement Snapshot From the Field

A live engagement with an industry participant carrying material or product regulatory and market exposure ahead of a defining policy shift, showing how our research translates into a defensible multi-year portfolio strategy.
MARKET MINDS ADVISORY · CLIENT ENGAGEMENT SUMMARY
United States End-of-Line Packaging Producer Strategic Portfolio Review and Transition Roadmap 2026·Investment Scenario on United States End-of-Line Packaging Exposure Evaluation 2025-26
CLIENT PROFILE
An end-of-line machinery builder supplying palletising and case packing equipment across North America, with reported revenue of 186 million dollars (client-reported, unverified by MMA). Quotations led on throughput and labour payback across every product family. All commissioning was subcontracted to third-party integrators, and the commercial organisation of 34 people called on plant engineering and maintenance functions exclusively.
STRATEGIC CHALLENGE
Win rates had fallen for three consecutive years and several losses came against equipment the company considered technically inferior. Management was funding throughput improvements to widen the specification gap. Nobody had established why those projects were lost, or who inside the customer had actually made the decision. Neither question had been asked.
MMA APPROACH
MMA reconstructed fourteen lost projects, tracing the justification submitted, the approver and the deciding criterion, which the company had never documented. Sixteen expert interviews with plant managers, finance directors and integrators established how end-of-line capital is genuinely approved. The analysis separated specification from justification, which internal reporting had conflated throughout.
KEY FINDINGS
  1. Nine of fourteen losses were decided on commissioning schedule rather than equipment, with competitors quoting earlier dates because they owned integration capacity.
  2. Capital was approved by finance against retailer chargeback exposure in most cases, and the client's quotations never mentioned compliance penalties at all.
  3. Labour payback calculations were dismissed by customers who explained the positions were vacant rather than expensive, which the sales team had not registered.
  4. Acquiring integration capacity modelled better win rates than any throughput development would deliver (client-reported, unverified by MMA). Specification was never the issue.
CLIENT PROFILE
An end-of-line machinery builder supplying palletising and case packing equipment across North America, with reported revenue of 186 million dollars (client-reported, unverified by MMA). Quotations led on throughput and labour payback across every product family. All commissioning was subcontracted to third-party integrators, and the commercial organisation of 34 people called on plant engineering and maintenance functions exclusively.
STRATEGIC CHALLENGE
Win rates had fallen for three consecutive years and several losses came against equipment the company considered technically inferior. Management was funding throughput improvements to widen the specification gap. Nobody had established why those projects were lost, or who inside the customer had actually made the decision. Neither question had been asked.
MMA APPROACH
MMA reconstructed fourteen lost projects, tracing the justification submitted, the approver and the deciding criterion, which the company had never documented. Sixteen expert interviews with plant managers, finance directors and integrators established how end-of-line capital is genuinely approved. The analysis separated specification from justification, which internal reporting had conflated throughout.
KEY FINDINGS
  1. Nine of fourteen losses were decided on commissioning schedule rather than equipment, with competitors quoting earlier dates because they owned integration capacity.
  2. Capital was approved by finance against retailer chargeback exposure in most cases, and the client's quotations never mentioned compliance penalties at all.
  3. Labour payback calculations were dismissed by customers who explained the positions were vacant rather than expensive, which the sales team had not registered.
  4. Acquiring integration capacity modelled better win rates than any throughput development would deliver (client-reported, unverified by MMA). Specification was never the issue.
RECOMMENDED STRATEGY
Phase 1: Phase one: halt throughput development and pursue owned commissioning capacity, since schedule rather than specification is deciding these awards. Equipment was not the problem. Phase 2: Phase two: rebuild quotations around avoided chargeback exposure using each prospect's own compliance penalty data instead of labour payback. Penalties were never mentioned. Phase 3: Phase three: redirect commercial coverage toward finance and operations leadership, who approve the capital that engineering merely specifies. Finance decides this capital.
OUTCOME
An integration business was acquired within the review period and quoted lead times shortened materially. Chargeback-based justification replaced labour payback in quotations and win rates recovered (client-reported, unverified by MMA). Commercial coverage was extended to finance functions, which produced access to projects the company had never previously been invited to bid.

Frequently Asked Questions

Foundational context covering the market sizes, CAGR, scope, country, region and competition that inform every finding below. This section is provided to cover basics and most often pre-purchase conversations, answered from the MMA Primary Research Dataset.

What is the current size of the United States End-of-Line Packaging Market?

The market was worth 8.0 billion dollars in 2025, covering case packing, palletising, stretch wrapping, strapping, robotic cells and vision verification. It reaches 8.67 billion dollars in 2026.

How large will the United States End-of-Line Packaging Market be by 2036?

MMA forecasts 19.43 billion dollars by 2036, an increase of 10.76 billion dollars over the 2026 base. That represents an expansion multiple of 2.24 times across the forecast period.

What is the CAGR for the United States End-of-Line Packaging Market 2026 to 2036?

The base case compounds at 8.4% annually. MMA's bull case reaches 9.6% if integrator capacity expands and shortens lead times, while the bear case sits at 7.2% on slower manufacturing investment.

Which segment is growing fastest?

Collaborative and flexible robotic cells, at 12.6%, half again the market rate of 8.4%. They reprogram rather than retool, which suits assortments that change several times a year.

Who are the major companies in the United States End-of-Line Packaging Market?

ProMach, Barry-Wehmiller, Coesia, Duravant and Krones lead on disclosed packaging machinery and automation revenue. Syntegon, Columbia Machine, Delkor Systems and Schneider Packaging compete in specific functions.

Which country is growing fastest?

India at 10.6%, driven by manufacturing expansion and automation replacing manual end-of-line work that labour cost previously made uneconomic. China follows on rising automation intensity.

Report Segmentation Architecture

The full report scope spans multiple orthogonal segmentation dimensions, with cross-tabulated demand data provided for each dimension pair. Coverage extends further to regional breakdowns, trend trajectories, and the competitive detail needed to support segment-level decision-making.

By Equipment Function

  • Case Packing and Cartoning Systems
  • Palletising and Depalletising Systems
  • Stretch Wrapping and Load Containment
  • Strapping and Banding Systems
  • Collaborative and Flexible Robotic Cells
  • End-of-Line Vision and Verification Systems

By End-Use Industry

  • Food and Beverage Manufacturing
  • Consumer Packaged Goods
  • Pharmaceutical and Healthcare
  • Building Materials and Chemicals
  • Distribution and Fulfilment
  • Pet Food and Nutrition

By Commercial Dimension

  • Direct Capital Purchase
  • Integrated Line Contract
  • Systems Integrator Specified
  • Equipment Lease Arrangement
  • Service Contract Attached Supply
  • Retrofit and Upgrade Project

By Region

  • North America
  • Western Europe
  • East Asia
  • South Asia and Pacific
  • Latin America
  • Middle East and Africa
  • Eastern Europe

Scope, Methodology, and Coverage

Every figure in this report is reproducible from documented input assumptions. The scope below maps the historical period, the forecast horizon, the segmentation dimensions, and the countries covered, alongside the underlying primary and qualitative methodology.
Historical Period
2020 to 2025
Forecast Period
2026 to 2036
Base Year
2025 (USD billions; MMA Primary Research Dataset, August 2026)
Market Definition
Scope covers equipment used after primary packaging is complete, spanning case packing and cartoning systems, palletising and depalletising systems, stretch wrapping and load containment equipment, strapping and banding systems, collaborative and flexible robotic cells configured for end-of-line functions, and end-of-line vision, weighing and verification systems. Filling, sealing, labelling of primary containers and other primary packaging machinery, container manufacture, automated storage and retrieval systems, conveyor supplied as building infrastructure, and packaging materials including film, board and strapping consumables are excluded. Systems integration and commissioning services sold separately from equipment fall outside the boundary.
Quantitative Units
USD billions (current prices); systems installed; pallets handled per hour; chargeback exposure; integrator lead time
Segmentation Dimensions
By Equipment Function; By End-Use Industry; By Commercial Dimension; By Region
Regions Covered
North America, Western Europe, East Asia, South Asia and Pacific, Latin America, Middle East and Africa, Eastern Europe
Countries Covered
USA, China, Germany, Japan, India, Italy, Mexico, Canada, UK, Brazil, South Korea, Poland, Vietnam, Australia, Saudi Arabia
Key Companies Profiled
ProMach, Barry-Wehmiller, Coesia, Duravant, Krones, Syntegon, Marchesini Group, IMA Group, Fanuc, ABB, KUKA, Universal Robots, Columbia Machine, Brenton, Signode, Mollers, Beumer Group, Cama Group, Schneider Packaging Equipment, Delkor Systems
Quantitative Methodology
Primary survey, n=3,800 respondents, Q4 2025, six countries; demand-side model with trade association cross-validation
Qualitative Methodology
47 expert interviews, Q4 2025; applied to validate demand model assumptions, identify emerging dynamics, and assess competitive positioning
Report Format
PDF and XLSX data workbook (Word format preview document)
Publisher
Market Minds Advisory
Report Code
MMA-2026-CON-134
Published
August 2026
Contact
sales@marketmindsadvisory.com | www.marketmindsadvisory.com

Purchase the full United States End-of-Line Packaging Market Report (2026 to 2036).

The full report runs to 175 pages and covers all six equipment function segments, seven regions and 20 profiled companies in detail, with United States dynamics examined throughout as the analytical focus. It includes the complete segment CAGR set, regional automation intensity data, and chargeback exposure modelling across retail channels. Company profiles carry evaluation on disclosed packaging machinery and automation revenue, with moat and risk assessment for the top five builders. The competitive section extends to 15 tracked corporate developments across 2024 and 2025, each with commercial interpretation. Primary research inputs include a quantitative survey of 3,800 respondents and 47 expert interviews conducted in Q4 2025.
Six equipment function segments with individual CAGR forecasts
Seven regional markets with automation intensity and demand data
Twenty company profiles on consistent revenue evaluation basis
Fifteen tracked corporate developments with commercial interpretation notes
Retailer chargeback exposure modelled across major grocery channels
Integrator capacity and lead time analysis by region and function

Built For The People Who Decide

From boardroom strategy to bench-side execution, this report is read cover-to-cover by leaders shaping the next decade of their industry, turning demand scenarios, market dynamics and valuation benchmarks into decisions.
CXOs/ Presidents/ VPs/ Managers
M&A and Corporate Development
Strategy Teams and R&D Heads
Procurement and Product Directors
Regulatory and Compliance Leaders
Investor Relations and Equity Analysts