Market Minds Advisory
Demand for Displays in USA

Demand for Displays in USA: Demand for Displays in USA. Trends and Forecast 2026 to 2036

Display makers are shifting capital from mature LCD production toward OLED and MicroLED capacity, forcing panel suppliers to justify premium pricing against buyers accustomed to steadily falling per-inch display costs across devices.

Lead Analyst

Published

September 2026

Make Smarter Decisions with Customized Research Insights

Request a free sample report and evaluate market opportunities, growth trends, and competitive dynamics relevant to your business needs.

2025 MARKET VALUE$32.0BMarket Size 2025
2036 FORECAST VALUE$78.5BBase Case , 2026 to 2036
CAGR 2026 TO 20368.5 %Bull 9.8% / Bear 7.2%
INCREMENTAL OPPORTUNITY$43.8BNet 10- year value creation
EXPANSION MULTIPLE2.26x2036 value over 2026 base
Strategic Levers
M&A Pipeline
Regional Outlook
Country Rankings
Competitive Intelligence
Segmental Deep-dive
Call-Us : 91 93563 13602

Executive Snapshot and Market Trajectory.

Display demand across televisions, smartphones, laptops, and automotive dashboards continues shifting toward OLED and emerging MicroLED technology, as consumers and enterprise buyers increasingly value contrast and power efficiency improvements over the incremental brightness gains that dominated LCD generation upgrades throughout the previous decade of steady category growth nationwide.
Automotive displays represent the fastest-growing application as vehicles add larger, higher-resolution dashboard and infotainment screens across nearly every price tier, while consumer electronics buyers increasingly demand OLED picture quality even in mid-range television and monitor price segments previously reserved exclusively for premium product lines sold at higher price points. South Korean and Chinese panel manufacturers continue expanding OLED and MicroLED production capacity ahead of confirmed demand, betting on continued technology transition momentum across end markets.
Competitive dynamics remain intense as Chinese panel makers close the technology gap with South Korean incumbents faster than most industry observers expected, compressing average selling prices across mature LCD segments considerably across nearly every price tier and product category. Trade policy uncertainty around semiconductor and display component tariffs adds meaningful near-term cost planning complexity for United States brand owners sourcing panels internationally.
Market Definition
The Demand for Displays Market covers finished display panels and modules across LCD, OLED, and MicroLED technologies used in televisions, smartphones, laptops, monitors, and automotive applications, measured by shipment revenue at the panel and module level. It excludes display driver semiconductors sold separately, raw glass substrate manufacturing, and downstream device assembly not involving the display module itself.
Base Year Value
$32.0B in 2025 (MMA Primary Research Dataset, September 2026)
Forecast Period
2026 to 2036, eleven discrete annual values
CAGR
8.5% base case. Bull 9.8%. Bear 7.2%.
Fastest Growth Segment
MicroLED Display Panels: 15.5% CAGR
Fastest Growth Country
South Korea: 12.5% CAGR
Fastest Growth Region
South Asia and Pacific: 10.5% CAGR
Largest Region
North America: 31% of 2025 global value
Market Leaders
Leading participants include Samsung Display, LG Display, BOE Technology Group, TCL CSOT, and Sharp Corporation. Source: MMA Primary Research Dataset, July 2026.
Primary Survey
n=3,800 procurement and R&D decision-makers, Q4 2025, six countries
Methodology
Demand-side build-up, cross-validated against public data, 47 expert interviews

Demand for Displays in USA Market Forecast Scenarios

united-states-displays-market-size-forecast-scenario-1788452765875
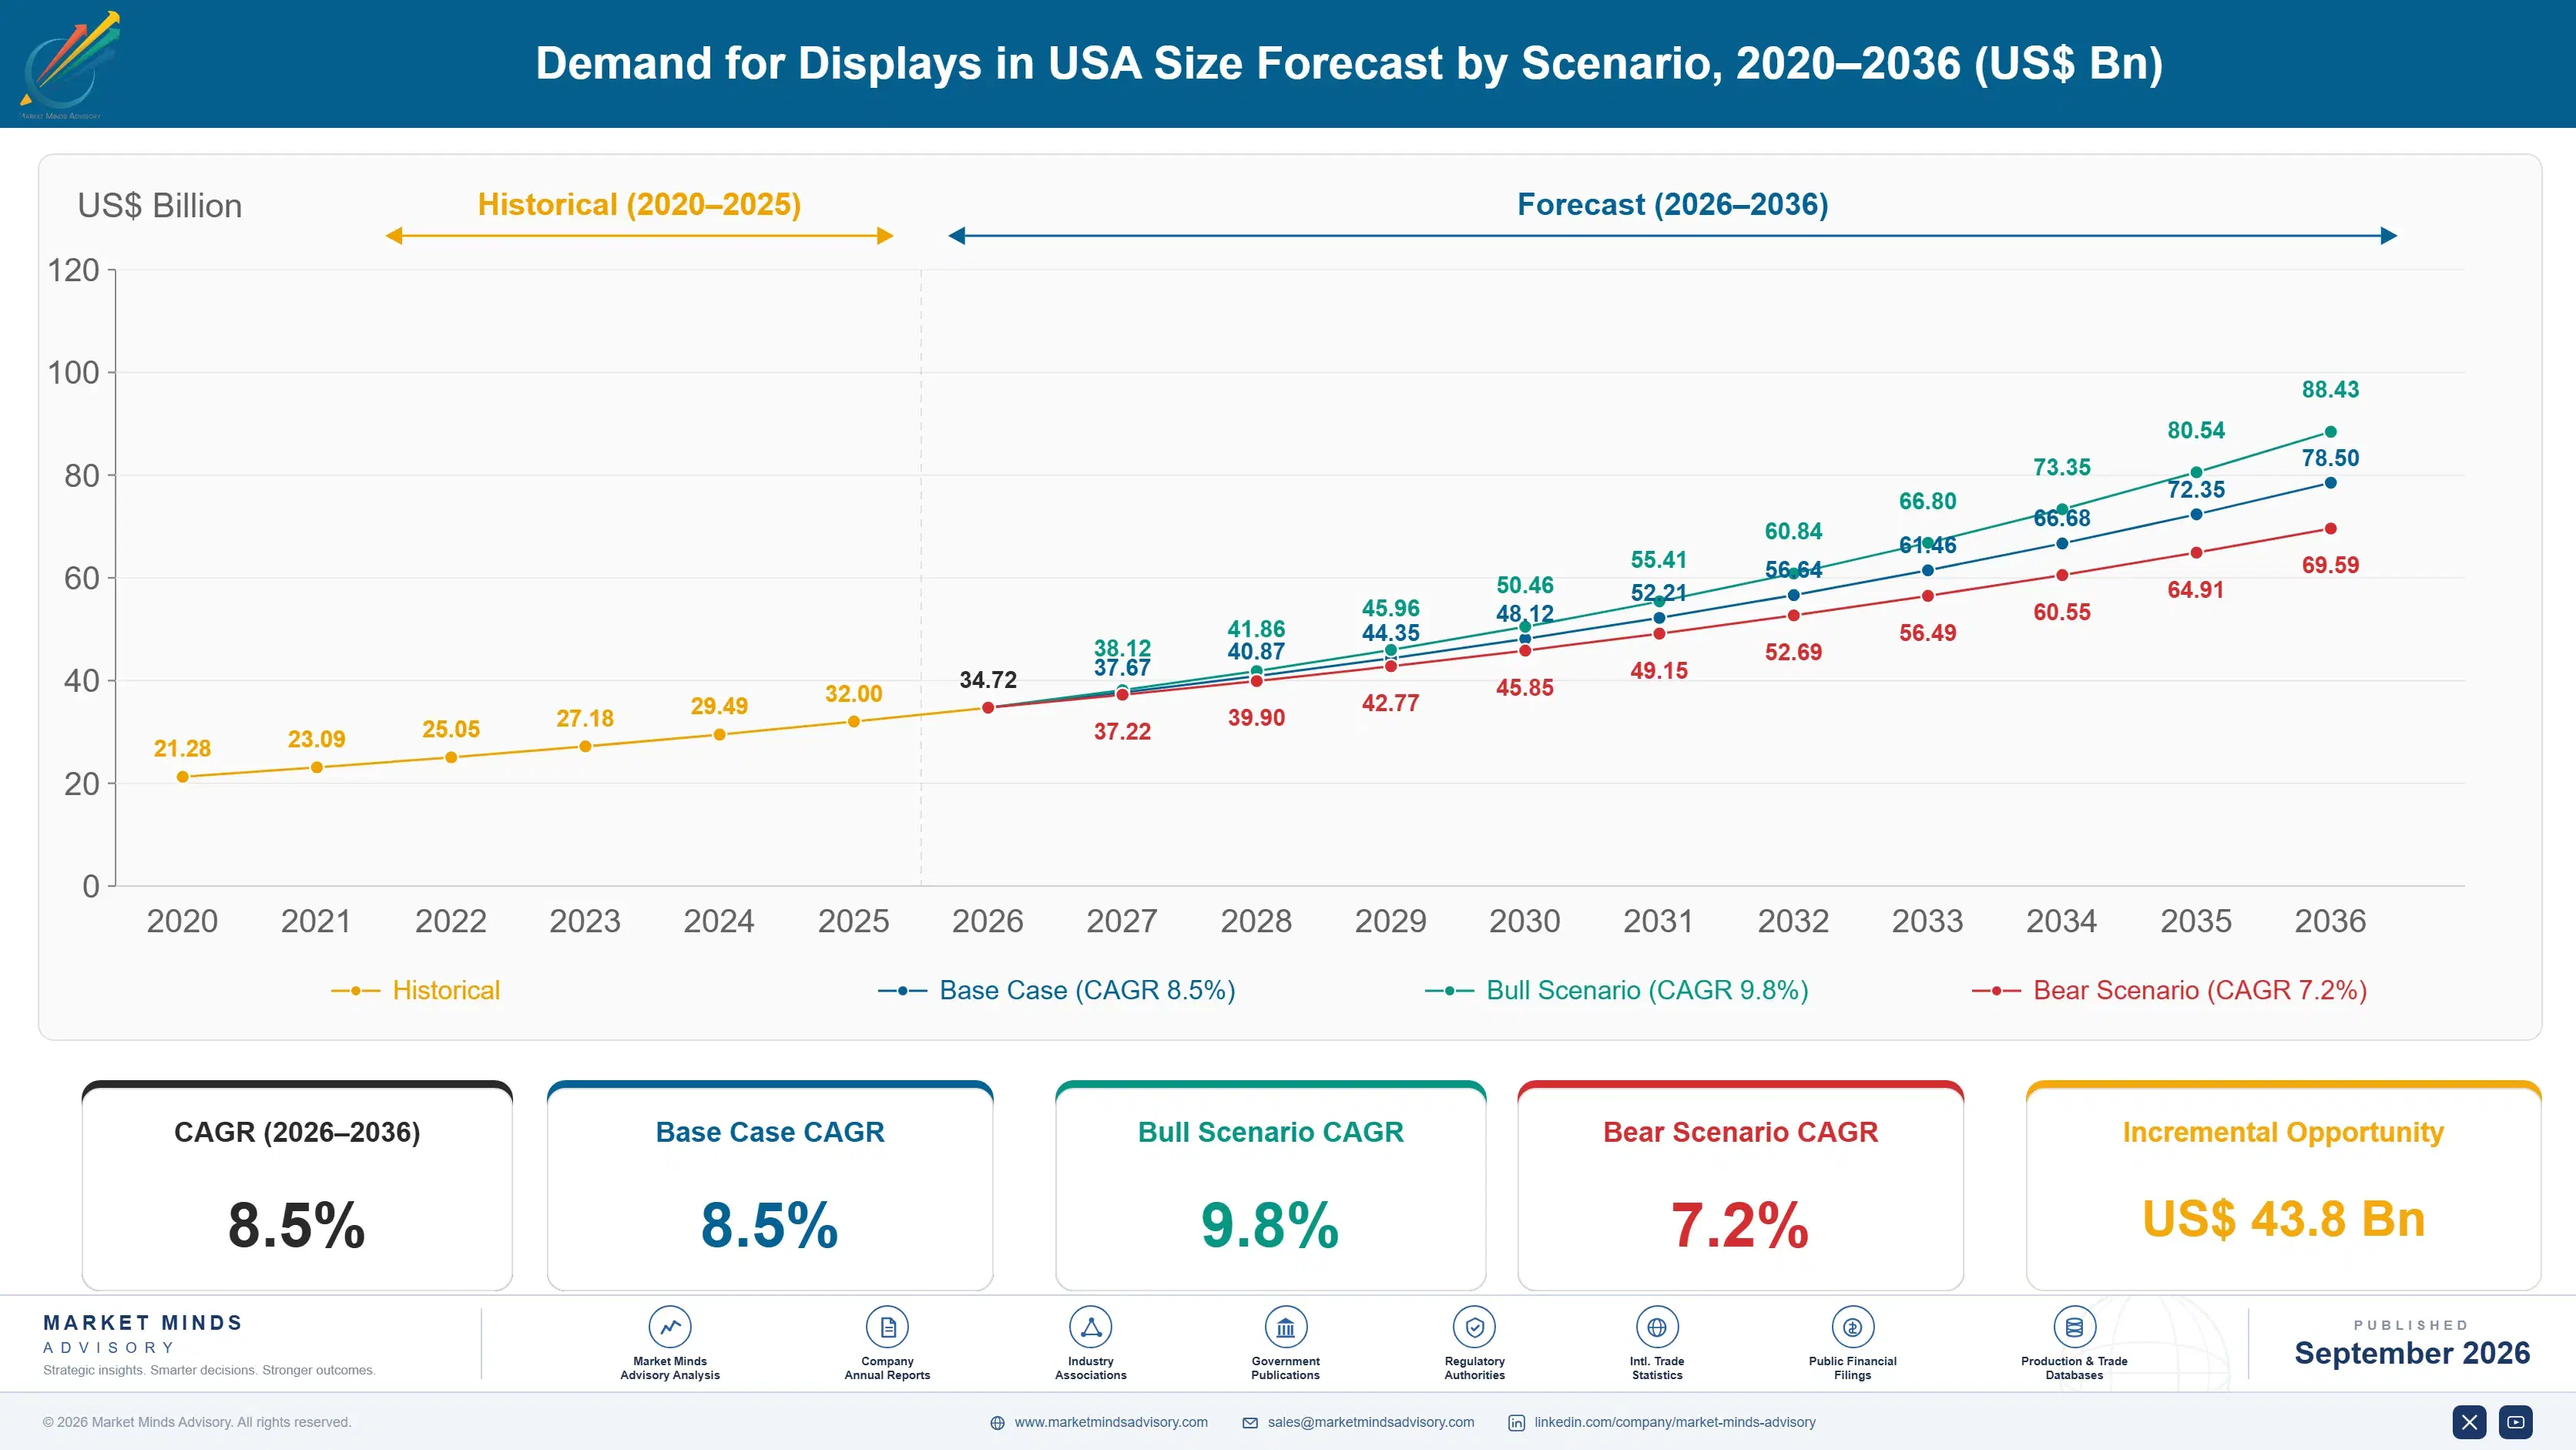
The display panel market grew steadily between 2020 and 2025, expanding at roughly 7.5 percent annually as OLED adoption spread beyond premium smartphones and televisions into mid-range product tiers across nearly every major consumer electronics category. Automotive display integration accelerated meaningfully during this period as vehicles added larger dashboard and infotainment screens across nearly every price tier and vehicle segment sold.
MMA's base case projects 8.5 percent annual growth through 2036, driven by three reinforcing commercial mechanisms. First, automotive OEMs increasingly specify larger, higher-resolution displays as standard equipment rather than premium options, expanding average display area per vehicle considerably. Second, OLED production cost reductions continue narrowing the price gap with LCD panels, accelerating technology transition across mid-range consumer electronics segments. Third, MicroLED technology maturation opens entirely new commercial applications in large-format and wearable display categories that LCD and OLED technology cannot practically address.
A genuine bull catalyst would be MicroLED manufacturing yield improvements reaching commercial viability faster than expected, enabling premium pricing across large-format television and wearable device categories simultaneously and considerably. The primary bear risk is prolonged consumer electronics demand softness compressing panel shipment volumes across mature LCD and OLED segments, delaying planned capacity expansion investment industry wide.

Where LCD Economics Meet Their Ceiling

Display demand has entered a genuinely bifurcated phase, where LCD panel pricing continues its decades-long decline even as OLED and MicroLED technology command meaningful premiums for improved contrast, power efficiency, and form factor flexibility. Panel makers increasingly compete on technology transition speed rather than pure manufacturing scale alone, since brand owners now expect a steady cadence of picture quality improvements at stable or declining price points across nearly every product category.
MARKET CONCENTRATION58% CR5 basisTop five panel makers hold a concentrated position
AVERAGE PANEL SELLING PRICE$85 per television-sized panelPrices continue falling despite improving picture quality standards
TOP PRODUCING COUNTRY SHARE38% South KoreaSouth Korea leads premium panel manufacturing capacity globally
OLED PENETRATION RATE42% of total category revenueOLED share climbs steadily across nearly every product tier
CAPACITY UTILIZATION RATE82% average fabrication utilizationUtilization stays high despite persistent oversupply concerns industry wide
AUTOMOTIVE DISPLAY GROWTH18% year over yearVehicles increasingly specify larger dashboard and infotainment screens
Automotive applications have emerged as the category's most reliable growth engine, as vehicle manufacturers specify larger, higher-resolution dashboard and infotainment displays across nearly every price tier rather than reserving advanced displays for premium trim levels alone. This shift diversifies panel maker revenue away from historically cyclical consumer electronics demand toward considerably more predictable automotive design cycles.
Capacity discipline remains a persistent industry challenge, as Chinese manufacturers continue expanding fabrication capacity ahead of confirmed demand, periodically triggering oversupply cycles that compress pricing across mature LCD segments considerably. MMA expects capacity rationalization to remain an important theme through the remainder of the forecast period as manufacturers balance growth ambitions against genuine profitability pressure across their global panel production networks.
"Nobody pays more for a bigger screen anymore. They pay more for a better screen, and that distinction is rewriting who wins in this category."
Senior Analyst, Display Technology and Consumer Electronics Practice · MMA Technology Practice · September 2026

Market Trends

OLED Adoption Spreads Into Mid-Range Price Tiers

OLED display technology, once confined almost exclusively to flagship smartphones and premium televisions, increasingly appears in mid-range product tiers as manufacturing costs continue falling toward parity with mature LCD production. Consumer electronics brands increasingly market OLED picture quality as a genuine differentiator even at price points that would have seemed implausible just a few years ago, forcing competitors without comparable OLED supply access to compete primarily on price within an increasingly crowded LCD segment. This dynamic pressures panel makers still concentrated in pure LCD production to accelerate their own technology transition investment.
Market Impact: Automotive display revenue grew 24 percent

Automotive Displays Grow Larger and Higher Resolution

Vehicle manufacturers increasingly replace traditional analog instrument clusters and center console controls with large, high-resolution digital displays across nearly every price tier, transforming automotive from a niche display application into one of the category's most reliable growth engines. Average display area per vehicle has expanded considerably as manufacturers consolidate multiple physical controls into unified digital display interfaces, creating sustained panel demand that persists independent of broader consumer electronics purchasing cycles. Panel makers increasingly develop automotive-specific product lines meeting stringent temperature and reliability requirements that consumer electronics displays do not need to satisfy.
Market Impact: OLED production costs fell 18 percent

Market Opportunities and Growth Drivers

Automotive OEMs Standardize Larger Digital Dashboard Displays

Automakers increasingly treat large digital dashboard and infotainment displays as standard equipment across nearly every trim level rather than reserving them for premium vehicle configurations, fundamentally expanding the addressable automotive display market beyond luxury segments alone. This standardization reflects genuine consumer expectation shifts, as buyers increasingly compare vehicle infotainment capability the way they once compared engine specifications, forcing manufacturers to compete on display quality regardless of price segment. Panel makers serving automotive customers benefit from meaningfully longer design cycles and more predictable multi-year volume commitments than consumer electronics customers typically offer.
Market Impact: Oversupply compressed prices 15 percent

OLED Manufacturing Costs Fall Toward LCD Parity

Continued yield improvements and manufacturing scale across South Korean and Chinese OLED fabrication facilities have narrowed the cost gap with mature LCD production considerably faster than most industry observers projected just a few years earlier. This cost convergence enables OLED adoption across mid-range consumer electronics segments that previously could not justify the price premium OLED technology historically commanded over comparable LCD alternatives. Panel makers that invested early in OLED manufacturing capacity now benefit from this favorable cost trajectory, while competitors still concentrated in pure LCD production face mounting pressure to accelerate their own technology transition.
Market Impact: Yield limitations added 35 percent

Market Restraints and Challenges

Persistent Panel Oversupply Compresses Pricing Industry Wide

Chinese manufacturers continue expanding LCD and OLED fabrication capacity ahead of confirmed demand, periodically triggering oversupply cycles that compress average selling prices across mature panel segments considerably faster than manufacturing cost reductions can offset. The root cause traces to aggressive government-subsidized capacity expansion pursued for strategic industrial policy reasons rather than purely commercial return calculations, distorting normal supply and demand signals that would otherwise moderate capacity investment timing. This oversupply directly compresses margins across the industry, forcing even efficient manufacturers to operate at reduced profitability. Leading manufacturers increasingly diversify into higher-margin automotive and specialty display segments.
Market Impact: OLED mid-range penetration rose 28 percent

MicroLED Manufacturing Yields Limit Commercial Scaling

MicroLED technology promises meaningful picture quality and power efficiency advantages over OLED, but manufacturing yield rates remain considerably below the levels required for cost-competitive mass production across mainstream consumer electronics categories. The root cause lies in the technical difficulty of precisely placing millions of microscopic LED elements onto a single display substrate without defects, a manufacturing challenge considerably more demanding than existing OLED or LCD production processes. This yield limitation confines MicroLED to premium, low-volume applications where customers tolerate meaningfully higher prices. Manufacturers continue investing heavily in mass transfer technology improvements to address this constraint.
Market Impact: Display area per vehicle grew 22%
2 additional market trends, 4 additional growth drivers, and 3 additional restraints and challenges are covered in the full report. Contact sales@marketmindsadvisory.com to access the complete intelligence.

Segment CAGR and Growth Architecture

MMA identifies six primary display technology categories within the panel demand market, segmented by underlying display technology rather than by end-use application, device category, or brand positioning. MicroLED panels lead category growth from a small base given superior contrast and power efficiency, followed by OLED panels continuing their steady expansion across mid-range price tiers.
united-states-displays-market-market-share-analysis-1788452766411

MicroLED Display Panels

MicroLED display panels lead category growth by a substantial margin despite representing a small share of total revenue currently, driven by superior contrast, power efficiency, and form factor flexibility that neither OLED nor LCD technology can practically match at comparable performance levels. Manufacturing yield limitations currently confine MicroLED to premium, low-volume applications including luxury televisions and specialized wearable devices, where customers tolerate meaningfully higher prices for genuinely differentiated picture quality. Vendors competing here differentiate primarily on mass transfer manufacturing technology and yield improvement roadmaps rather than pricing alone, since achieving commercial-scale production remains the primary bottleneck limiting broader category adoption. MMA estimates this segment will grow considerably faster than any other through 2036 as yield rates improve steadily.
CAGR 15.5%

OLED Display Panels

OLED display panels represent the second fastest-growing segment, anchored by continued manufacturing cost reductions that increasingly bring OLED technology within reach of mid-range consumer electronics price points previously served exclusively by LCD alternatives. South Korean and Chinese manufacturers compete aggressively for OLED production capacity leadership, driving steady price declines that expand the addressable market considerably faster than premium-only positioning would allow. Automotive applications increasingly adopt OLED technology for dashboard and infotainment displays, valuing its superior contrast and flexible form factor for curved dashboard integration that traditional LCD panels cannot easily accommodate at comparable cost. This segment carries meaningfully higher average selling prices than standard LCD panels despite considerable recent cost convergence.
CAGR 12.0%
Full segment breakdown across 6 segments available in the complete report.

Regional Architecture and Country Demand Map

North America anchors global display panel demand given concentrated consumer electronics and automotive purchasing power, while East Asia builds substantial parallel scale through manufacturing capacity and heavy domestic consumption, and South Asia Pacific delivers the fastest regional growth of any market covered in this report.

North America

United States consumers and enterprises drive the largest share of category demand, reflecting concentrated purchasing power across televisions, laptops, and an automotive market that increasingly specifies larger digital dashboard displays as standard equipment across nearly every trim level. Apple, major television brands, and domestic automotive manufacturers collectively source substantial panel volume from Samsung Display, LG Display, and Chinese suppliers, giving American brand owners considerable negotiating leverage over global panel pricing and allocation decisions. Consumer electronics retail replacement cycles remain shorter than most other regions, sustaining steady baseline demand even during periods of broader economic uncertainty. Canada contributes a smaller but meaningfully growing share through similar consumer electronics and automotive purchasing patterns.
Share: 31% | CAGR: 9.5% (2026 to 2036)

Western Europe

Western Europe's display demand follows a more measured replacement cycle than North America, with German automotive manufacturers driving substantial premium display demand for dashboard and infotainment systems across their global vehicle platforms and export markets worldwide and beyond considerably. France and the United Kingdom contribute steady consumer electronics demand, though household replacement cycles run longer than American peers given generally more conservative consumer spending patterns overall. The region's stronger environmental regulation increasingly shapes panel disposal and recycling requirements, adding compliance considerations that panel importers must factor into product lifecycle planning. Nordic countries show above-average OLED television adoption relative to regional income levels, reflecting genuine consumer preference for premium picture quality.
Share: 20% | CAGR: 7.0% (2026 to 2036)
Regional intelligence for 5 additional markets available in the complete report: East Asia, South Asia and Pacific, Latin America, Middle East and Africa, Eastern Europe. Contact sales@marketmindsadvisory.com.
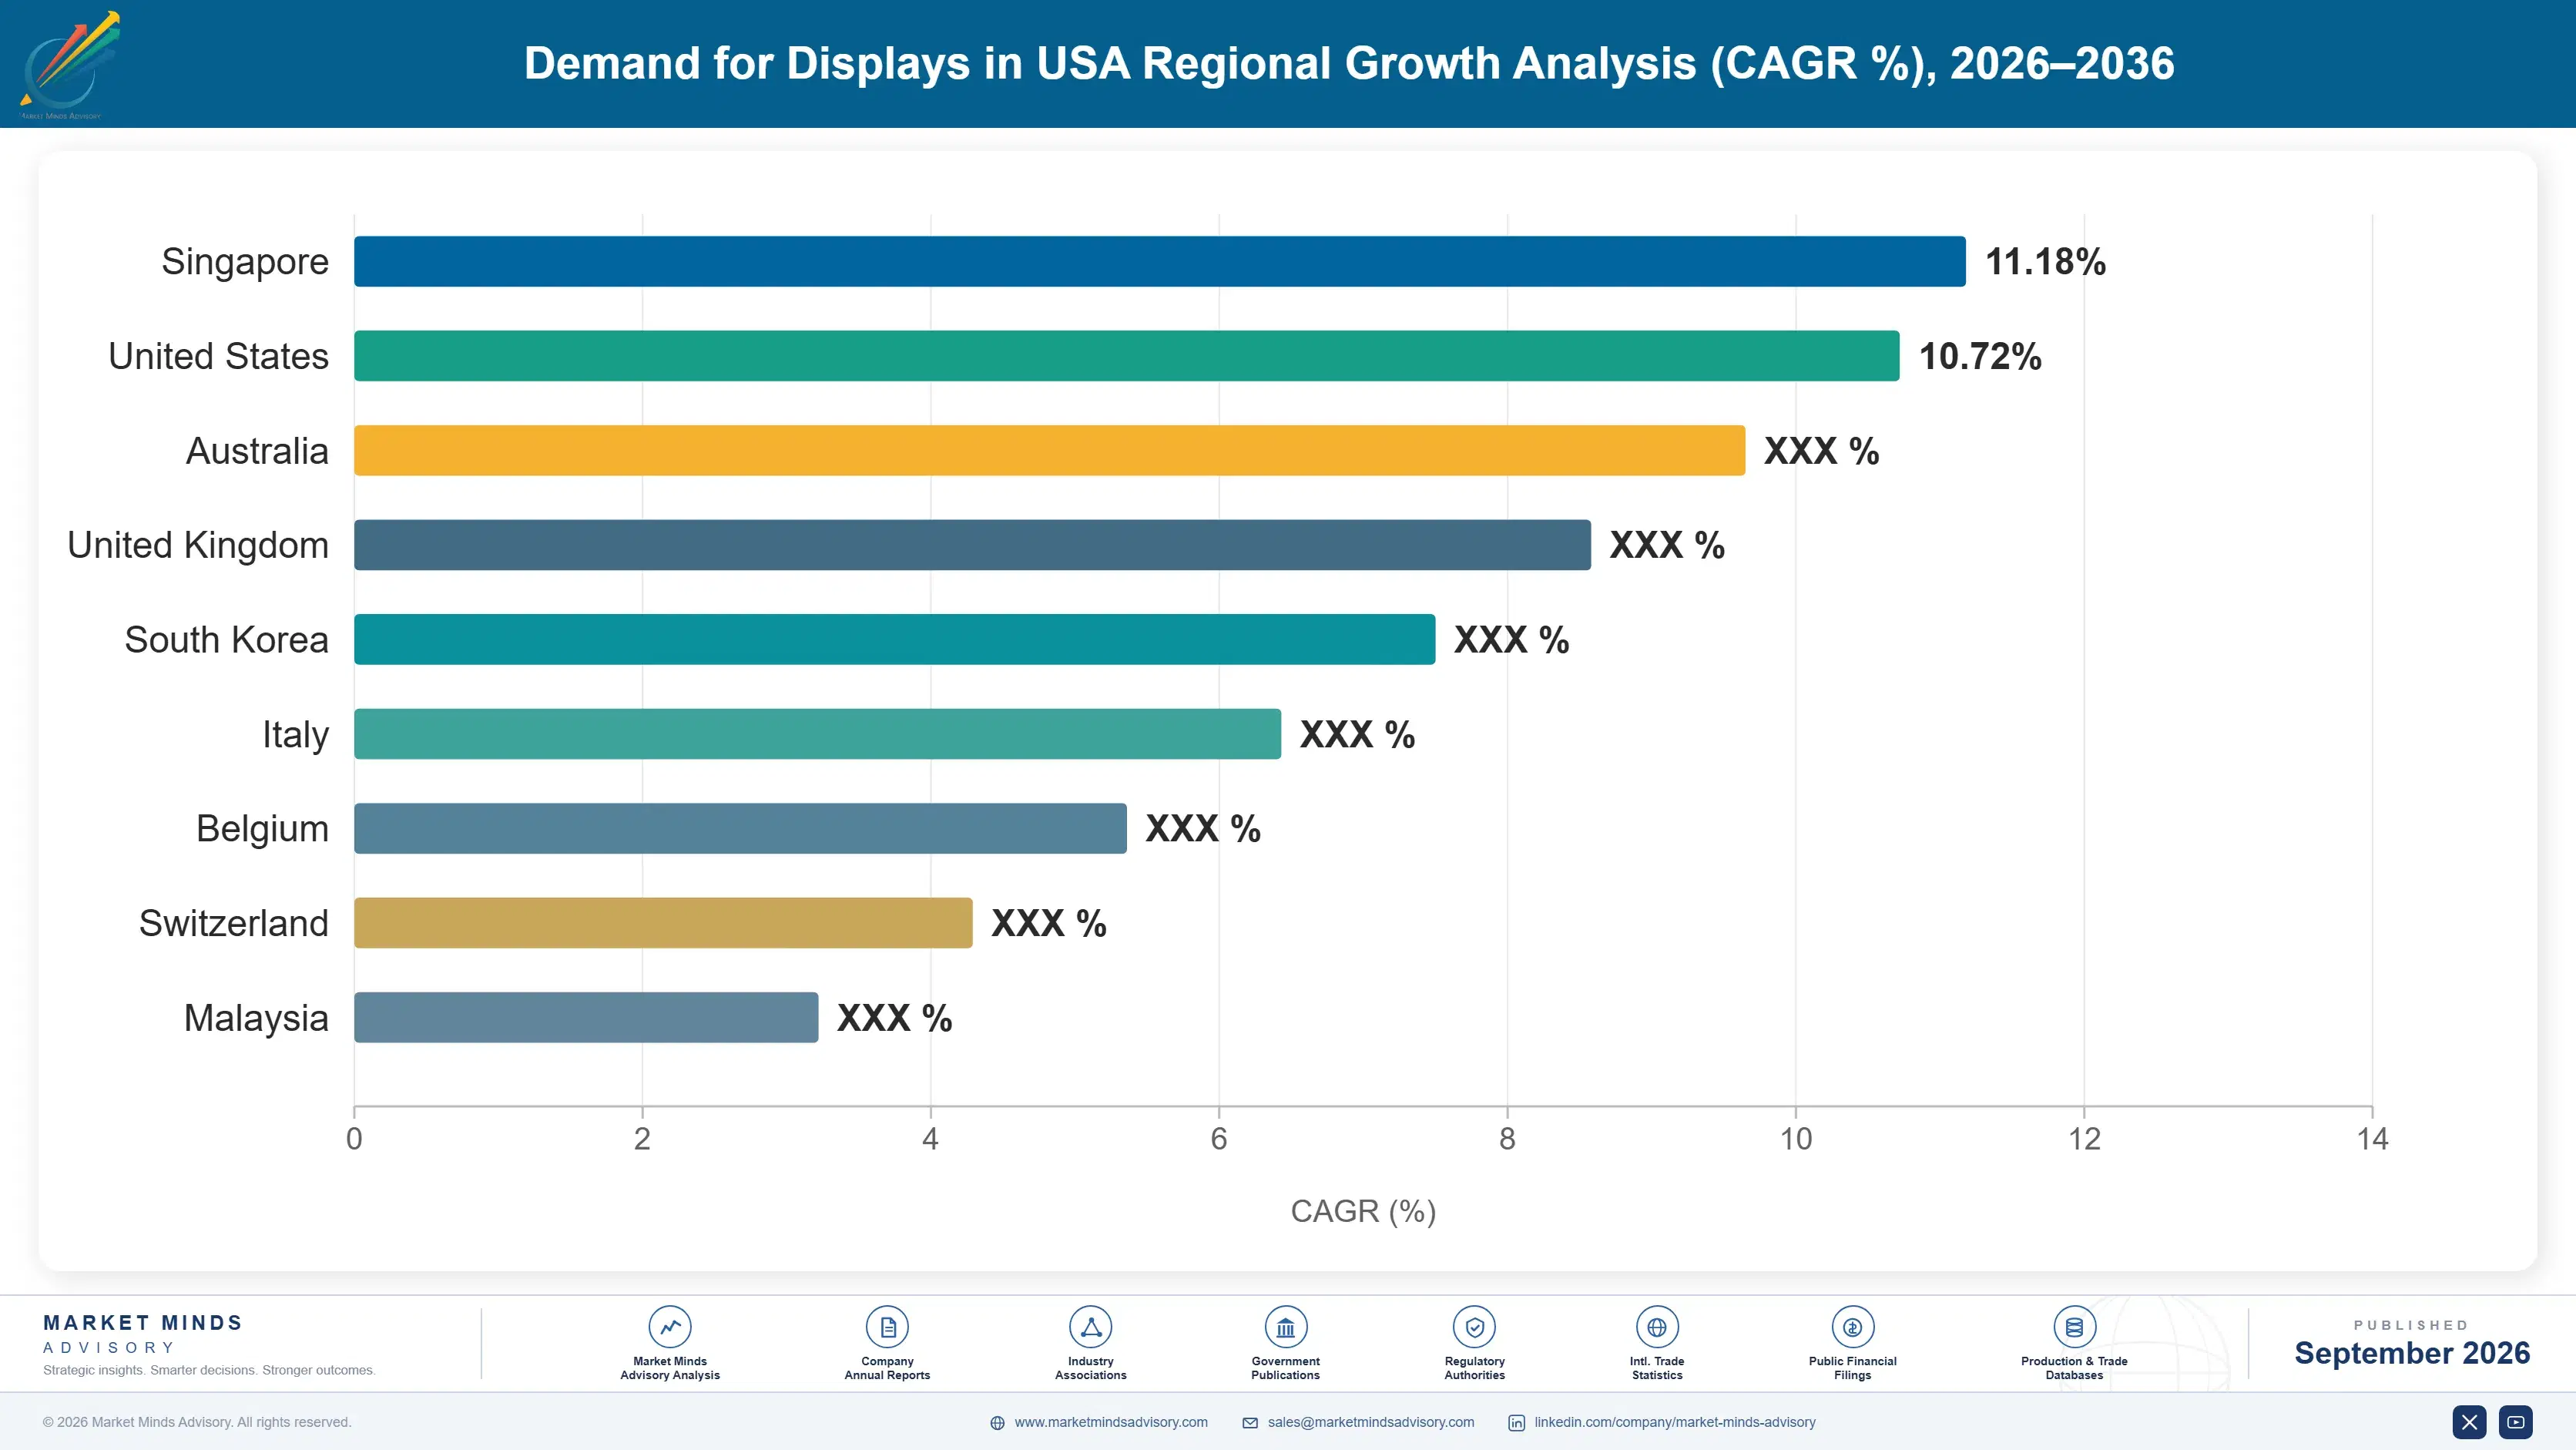
united-states-displays-market-country-cagr-analysis-1788452766927

How Panel Makers Capture Premium Value

Panel makers capturing outsized returns increasingly move beyond commodity LCD volume toward automotive design wins, early OLED capacity positioning, integrated module bundling, and proprietary process licensing, all of which measurably lift average selling prices and deepen customer relationships across multi-year design and supply cycles considerably across major device categories worldwide and across most regions.

Prioritize Automotive Design Wins Over Consumer Electronics

Panel makers that secure automotive design wins typically lock in multi-year supply agreements worth 30 to 45 percent more per unit than comparable consumer electronics contracts, since automotive customers value supply reliability and long product lifecycles over the aggressive annual price negotiations common in consumer electronics. Automotive qualification processes take considerably longer than consumer electronics onboarding, but once secured, these relationships persist across entire vehicle platform generations spanning five to seven years. Panel makers that invest early in automotive-specific reliability and temperature certification capability gain a durable advantage over competitors still focused primarily on consumer electronics volume.
Market Impact: Automotive design wins add 30 to 45 percent

Accelerate OLED Capacity Investment Ahead of Demand

Manufacturers that commit OLED fabrication capacity ahead of confirmed demand typically capture 20 to 30 percent higher margins than competitors scrambling to add capacity once demand signals become obvious to the entire industry simultaneously and unmistakably. This approach requires meaningful capital risk tolerance, since capacity investments take years to complete and demand forecasts carry genuine uncertainty across most product categories. Manufacturers that timed previous LCD-to-OLED capacity transitions well captured disproportionate share of the resulting demand surge, while slower-moving competitors found themselves supply-constrained during the most profitable period of the transition cycle and beyond.
Market Impact: Early OLED capacity commitment lifts margins 20 to 30 percent

Bundle Display Modules with Touch and Sensor Integration

Panel makers that integrate touch sensors, ambient light sensors, and driver electronics directly into finished display modules rather than selling bare panels typically capture 15 to 25 percent higher module-level revenue than competitors selling components separately. Brand owners increasingly prefer sourcing fully integrated modules to simplify their own device assembly process and reduce the number of supplier relationships they must manage across complex global supply chains. Vendors offering this integrated approach build considerably deeper technical relationships with brand owner engineering teams, raising switching costs for customers considering alternative suppliers in future product generations.
Market Impact: Integrated modules capture 15 to 25 percent more revenue

License Proprietary Manufacturing Process Technology to Competitors

Leading manufacturers that develop proprietary manufacturing process improvements, such as advanced OLED deposition techniques, can license this technology to smaller competitors lacking equivalent research capability, typically generating 8 to 15 percent incremental revenue without directly cannibalizing core panel sales or existing customer relationships nationwide and internationally. This licensing approach monetizes research investments that would otherwise benefit only the originating manufacturer's own production lines, extracting additional value from accumulated engineering expertise. Leading manufacturers increasingly treat process technology licensing as a distinct commercial revenue stream separate from core panel manufacturing and sales operations.
Market Impact: Process licensing adds 8 to 15 percent revenue

Who Controls the Margin Pool

Concentration in display panel manufacturing runs higher than most technology hardware categories, with the top five participants controlling an estimated 58 percent of category revenue on a revenue basis. Samsung Display holds the clearest technology leadership position in premium OLED production, while BOE Technology Group commands the largest manufacturing scale given aggressive government-subsidized Chinese capacity expansion. LG Display and TCL CSOT compete from strong positions in specific niches. The gap between the top two players and smaller manufacturers has widened as OLED leadership determines positioning.
Current competitive activity centers on OLED and MicroLED capacity expansion, with manufacturers racing to secure automotive design wins and premium consumer electronics contracts rather than competing on mature LCD volume alone. Partnership announcements between panel makers and automotive OEMs have become increasingly common, replacing the purely transactional sourcing relationships common in earlier display generations. Pricing competition remains intense within mature LCD segments.

Emerging pressure comes from Chinese manufacturers closing the OLED technology gap faster than South Korean incumbents expected, threatening premium pricing power Samsung Display and LG Display have long enjoyed in flagship segments. Rankings could shift if MicroLED yields improve enough to reach commercial viability, a transition several manufacturers are racing to achieve first.
united-states-displays-market-company-positioning-matrix-1788452767457

Competitive Moat and Risk Dimensions

SAMSUNG DISPLAY

Moat: Premium OLED Technology Leadership

Samsung Display maintains the industry's most advanced OLED manufacturing process technology, giving it privileged access to the highest-margin flagship smartphone and premium television contracts that competitors cannot easily replicate given years of accumulated process engineering expertise. This technology lead compounds as continued research investment widens the quality gap with less advanced competitors.
SAMSUNG DISPLAY

Risk: Narrowing Chinese Technology Gap

Chinese manufacturers have closed the OLED quality gap with Samsung Display faster than most industry observers expected just a few years ago, threatening the premium pricing power that historically justified Samsung's considerable research and development investment. Continued narrowing could compress margins meaningfully across the company's most profitable product lines within the coming years.
BOE TECHNOLOGY GROUP

Moat: Government-Backed Manufacturing Scale

BOE Technology Group benefits from substantial Chinese government subsidies and policy support that fund manufacturing capacity expansion at a scale few competitors can match without comparable state backing, giving it considerable cost advantages in mature LCD and increasingly OLED production categories across global markets and export destinations.
BOE TECHNOLOGY GROUP

Risk: Trade and Export Restrictions

BOE Technology Group's close association with Chinese state industrial policy creates meaningful exposure to trade restrictions and tariff actions from United States and allied governments increasingly scrutinizing Chinese technology manufacturers, potentially limiting its access to some premium Western brand owner contracts over the coming years.

Players Tracked

Prominent Players

Samsung Display
LG Display
BOE Technology Group
TCL CSOT
Sharp Corporation

Other Key Players

AU Optronics
Innolux Corporation
Japan Display Inc.
Visionox
Tianma Microelectronics
Truly International Holdings
HKC Corporation
CEC Panda
Universal Display Corporation
eMagin Corporation
Kopin Corporation
Himax Technologies
Novaled
Corning Incorporated
Applied Materials

Recent Developments

OCTOBER 2025

Samsung Display announced a multi-year supply agreement with a major United States automaker in October 2025 to provide OLED dashboard and infotainment displays across the manufacturer's next-generation electric vehicle platform, marking one of the company's largest automotive design wins outside its traditional consumer electronics customer base.
Signal: Signals panel makers increasingly diversifying revenue toward automotive customers amid persistent consumer electronics demand volatility and cyclicality
JANUARY 2026

BOE Technology Group opened a new advanced OLED fabrication facility in Chengdu in January 2026, adding substantial manufacturing capacity specifically targeting mid-range smartphone and automotive display segments where Chinese manufacturers increasingly compete directly against South Korean incumbents on both price and overall technical quality standards.
Signal: Signals Chinese manufacturers continuing to expand OLED fabrication capacity well ahead of confirmed near-term demand growth
APRIL 2026

LG Display signed a technology licensing agreement with a specialized MicroLED startup in April 2026 to accelerate mass transfer manufacturing yield improvements, aiming to reach commercial-scale MicroLED production for premium television applications considerably faster than internal research alone would have achieved within a comparable timeframe.
Signal: Signals established manufacturers increasingly partnering externally to accelerate MicroLED manufacturing yield improvement timelines considerably faster overall

Glass Substrate and Rare Material Costs

Glass substrate and specialized rare materials including indium tin oxide represent significant cost inputs for display panel manufacturers, typically comprising 25 to 35 percent of cost of goods sold depending on panel technology and size. Corning Incorporated and a small number of Asian glass manufacturers supply the overwhelming majority of large-format display glass substrate, concentrating supply origin risk regardless of which panel maker ultimately purchases the material.
Corning Incorporated's 2025 annual report disclosed display technologies segment revenue fluctuations tied directly to panel maker capacity utilization cycles, with glass substrate pricing power shifting meaningfully during periods of display industry oversupply versus tight supply conditions. Panel makers without long-term glass supply agreements faced meaningfully higher per-unit substrate costs during recent tight supply periods, compressing margins for smaller manufacturers lacking negotiating leverage comparable to the largest global panel producers.

Smaller panel manufacturers lacking long-term glass and rare material supply agreements pay meaningfully higher effective input costs than scale leaders like Samsung Display and BOE Technology Group, which negotiate substantial volume discounts unavailable to smaller competitors. This cost disadvantage compounds for manufacturers serving the fastest-growing MicroLED segment, since rare material requirements per unit exceed those of mature LCD production considerably.
united-states-displays-market-cost-volatility-analysis-1788452767653

Long-Term Glass Supply Agreements Stabilize Input Costs

Panel makers increasingly negotiate long-term glass substrate supply agreements with Corning and Asian glass manufacturers rather than relying on spot market purchasing, securing more predictable per-unit input costs regardless of broader industry capacity cycles. This approach requires meaningful advance commitment, but reduces exposure to the pricing volatility that spot market purchasers experience during tight glass substrate supply periods.

Alternative Rare Material Sourcing Reduces Indium Dependency

Some manufacturers now develop alternative transparent conductive materials that reduce dependency on indium tin oxide, whose supply concentrates among a small number of specialized mining and refining operations globally. This approach requires meaningful research investment and manufacturing process adaptation, but reduces exposure to indium price volatility that has periodically disrupted display panel production planning in past years.

Portfolio Architecture for Margin Defence

Display panel manufacturers organize commercial strategy around three tiers separated by technology maturity and margin profile rather than by end-use application alone. Volume tier products, largely standard LCD panels, carry gross margins in the 8 to 15 percent range typical of mature, highly commoditized manufacturing. Premium certified tier offerings, built around OLED and automotive-qualified panels, command materially higher margins given technology differentiation and longer qualification cycles that discourage customer migration.
Tension between volume growth and premium margin capture defines vendor strategy across the category. Pursuing broad LCD volume dilutes average selling price and invites aggressive price competition from lower-cost Chinese entrants, while premium OLED and MicroLED focus limits addressable customer count but sustains materially healthier unit economics and deeper automotive design relationship retention over multi-year contract cycles industry wide.

High-value revenue pools concentrate overwhelmingly in OLED and emerging MicroLED technology, where technical differentiation and automotive qualification create durable barriers smaller volume-tier competitors cannot easily cross. Vendors positioned in these premium pools increasingly command design-win retention rates exceeding 80 percent annually, reflecting genuine technical switching cost depth rather than simple customer inertia alone across most product lines.

Standard LCD panels licensed at competitive price points across mature consumer electronics categories, with gross margins around 8 to 15 percent reflecting decades of manufacturing scale and intense global price competition among numerous producers.
Gross Margin

OLED and automotive-qualified panels serving customers requiring superior contrast, power efficiency, or extended reliability certification, commanding gross margins around 25 to 35 percent given technology differentiation and longer qualification cycles.
Gross Margin

MicroLED and other next-generation display technologies purpose-built for premium and specialized applications, currently commanding premium pricing while manufacturing yield rates and mass production economics remain in early, evolving stages worldwide.
Gross Margin
united-states-displays-market-portfolio-architecture-1788452768155

High-value Sub-segments and Strategic Watch-out

MicroLED Display Panels

MicroLED display panels combine the fastest segment growth rate in the category with premium next-generation pricing, making it the single most attractive investment target for manufacturers and investors alike. MMA expects this segment's revenue share to expand meaningfully faster than any other through 2036, driven by yield improvements.

OLED Display Panels

OLED display panels deliver strong premium-tier margins with moderately slower growth than MicroLED, anchored by continued cost reductions that expand OLED adoption into mid-range price segments previously served exclusively by LCD. Manufacturers serving this segment benefit from multi-year automotive design cycles and high switching costs once qualified.

Standard LCD Panels

Standard LCD panels remain the largest single revenue base by shipment volume, though margins run considerably lower than premium segments given intense price competition and low switching costs among commoditized suppliers. This segment anchors overall category volume even as its share of total revenue gradually declines over time.

E-Paper and Reflective Display Panels

E-paper and reflective display panels have grown well below overall category average as demand concentrates among a narrow set of e-reader and signage applications rather than broadening across additional device categories as initially anticipated. Manufacturers concentrated here risk share erosion unless they diversify into adjacent display technology segments.

Why Display Design Wins Persist

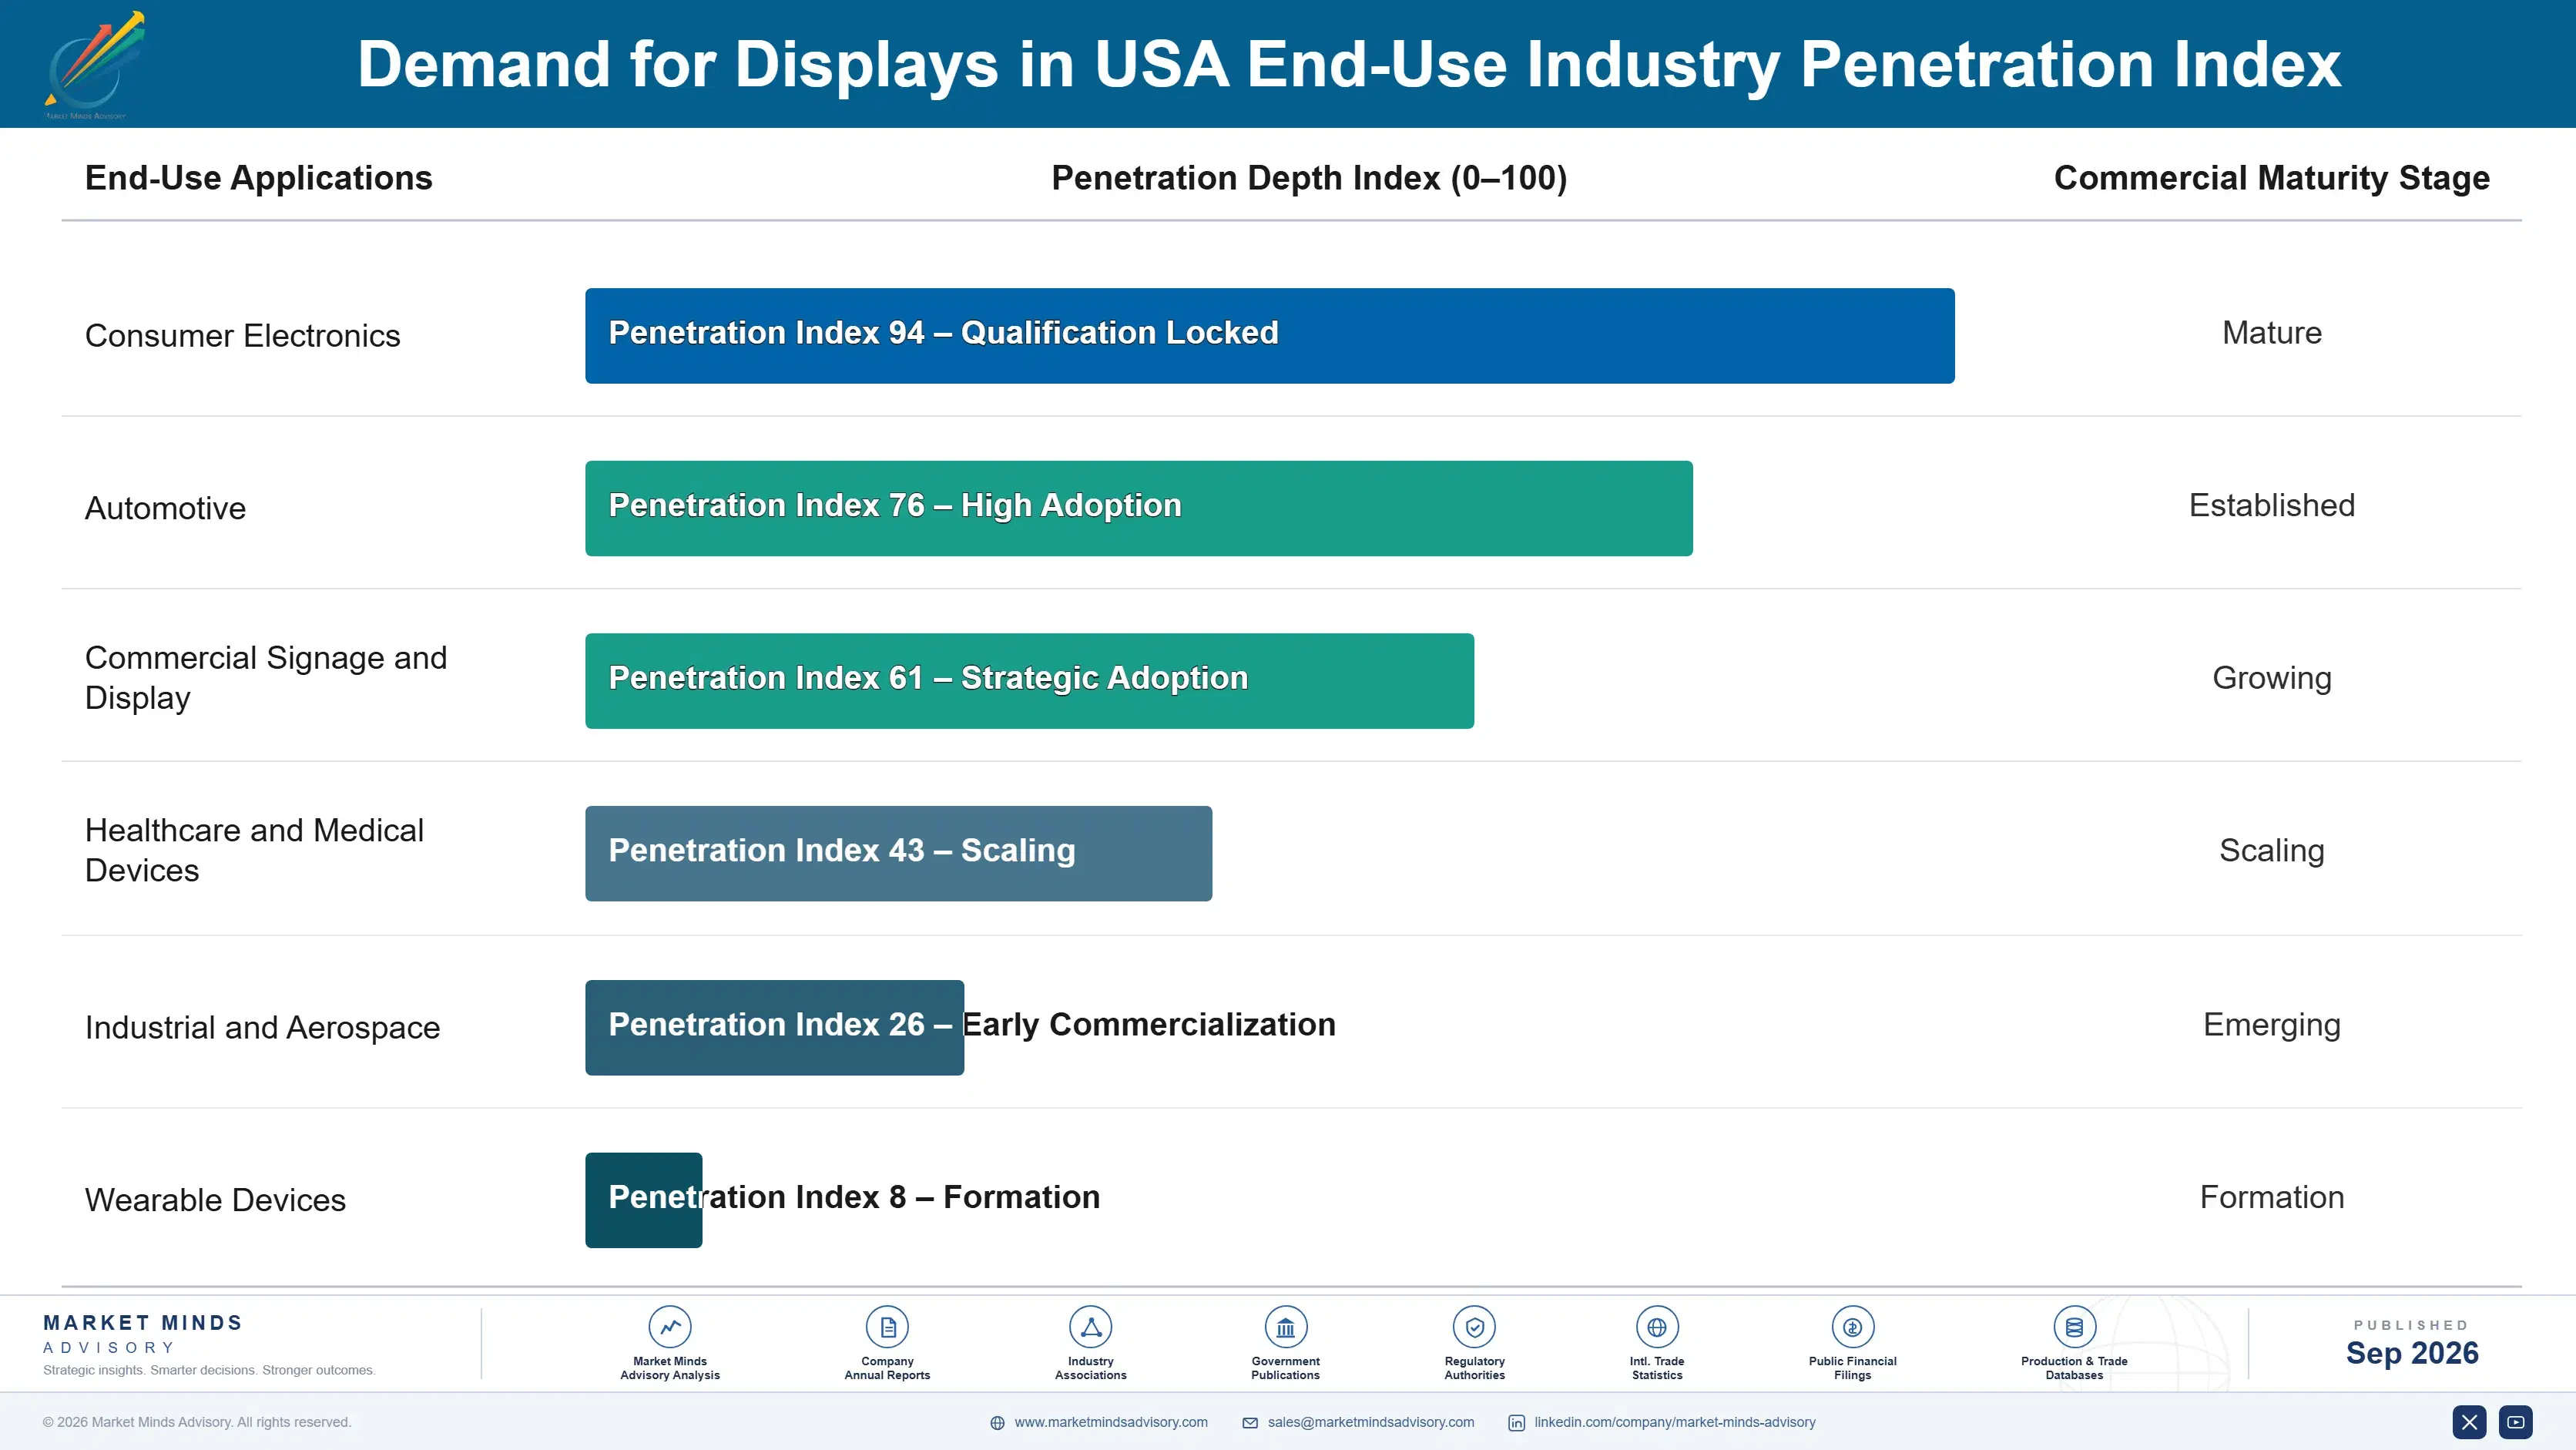
Automotive and premium consumer electronics display contracts increasingly behave like annuity relationships rather than one-time component sales, since brand owners that qualify a specific panel maker's technology for a vehicle platform or product line rarely switch mid-cycle given the extensive requalification cost involved. Design win retention rates for automotive-qualified panels now regularly exceed 80 percent across full platform generations, reflecting genuine technical dependency rather than simple contractual inertia.
Stickiness varies considerably by end-use vertical. Automotive customers embed panel specifications deeply into vehicle platform engineering, making supplier switching costly and operationally risky once dashboard integration and safety certification depend on a specific panel maker's exact dimensions and interface protocol. Consumer electronics customers show shallower stickiness, since annual product refresh cycles create more frequent opportunities to switch suppliers based purely on price.

Buyer profiles are shifting as procurement decisions move from pure component sourcing teams toward integrated design engineering teams who evaluate panel makers based on total module capability rather than bare panel specifications alone. Younger automotive engineering talent increasingly expects panel makers to deliver fully integrated display modules with embedded touch and sensor technology, accelerating the industry's shift toward module-level rather than component-level competition.
united-states-displays-market-end-use-penetration-index-1788452768634

Where Display Investment Pays Off

These are among the four positions where our research anticipates prominent divergence between winners and laggards over the coming forecast period. Each is grounded in the demand model, the regulatory perimeter, and the announced capacity pipeline.
01 / AUTOMOTIVE DESIGN STRATEGY

Prioritize automotive design wins over volatile consumer electronics contracts

Automotive design wins carry meaningfully higher per-unit value and considerably longer relationship duration than consumer electronics contracts, given multi-year platform cycles that persist regardless of near-term consumer purchasing volatility across broader economic cycles and shifting industry conditions worldwide. Manufacturers spreading resources evenly across both customer types dilute their ability to build the automotive-specific reliability and certification capability that vehicle manufacturers genuinely require before committing to a multi-year design relationship. MMA recommends prioritizing automotive qualification investment over incremental consumer electronics volume expansion.
02 / OLED CAPACITY TIMING

Commit OLED capacity ahead of confirmed mid-range demand signals

Manufacturers that commit OLED fabrication capacity ahead of confirmed mid-range demand consistently capture disproportionate share of the resulting demand surge, while slower-moving competitors find themselves supply-constrained during the most profitable period of any given technology transition cycle across the broader industry landscape and supply chain. Waiting for demand signals to become obvious to the entire industry simultaneously means competing for capacity against every other manufacturer reaching the same conclusion at once. MMA recommends committing capacity investment proactively rather than reactively.
03 / MODULE INTEGRATION STRATEGY

Bundle touch and sensor integration into finished display modules

Brand owners increasingly prefer sourcing fully integrated display modules with embedded touch and sensor technology rather than bare panels requiring separate component integration, simplifying their own device assembly process considerably across increasingly complex global supply chains and vendor relationships worldwide. Panel makers still selling bare components risk losing design wins to integrated module competitors offering meaningfully simpler procurement and assembly relationships for brand owner engineering teams. MMA recommends building integrated module capability rather than remaining a pure component supplier indefinitely.
04 / MICROLED YIELD INVESTMENT

Invest early in MicroLED yield improvement before mass adoption

MicroLED manufacturing yield improvement represents the single most important technology transition currently underway in the display category, and manufacturers achieving commercial-scale yields first will likely capture disproportionate share of the resulting premium demand surge across multiple device categories and applications worldwide. Competitors waiting for yield improvements to become obvious industry wide will find themselves competing for scarce manufacturing equipment and specialized engineering talent against every other manufacturer reaching the same conclusion simultaneously. MMA recommends investing in yield improvement research now.

Engagement Snapshot From the Field

A live engagement with an industry participant carrying material or product regulatory and market exposure ahead of a defining policy shift, showing how our research translates into a defensible multi-year portfolio strategy.
MARKET MINDS ADVISORY · CLIENT ENGAGEMENT SUMMARY
Demand for Displays in USA Producer Strategic Portfolio Review and Transition Roadmap 2026·Investment Scenario on Demand for Displays in USA Exposure Evaluation 2025-26
CLIENT PROFILE
The client is a major United States automaker developing a next-generation electric vehicle platform requiring substantially larger and higher-resolution dashboard and infotainment displays than its current model lineup, competing against rivals already offering advanced digital cockpit experiences. Facing pressure to differentiate on technology while managing considerable cost constraints, leadership sought an independent panel supplier evaluation before finalizing platform design decisions.
STRATEGIC CHALLENGE
The automaker's existing display suppliers offered mature LCD technology adequate for current vehicle generations but potentially insufficient for the premium digital cockpit experience the new platform required to compete against technology-forward rivals. Leadership needed to evaluate whether transitioning to OLED display technology across the new platform justified the higher per-unit cost and longer supplier qualification timeline involved.
MMA APPROACH
MMA conducted a structured supplier evaluation combining expert interviews with the automaker's design and procurement leadership, competitive benchmarking across five leading display panel manufacturers, and analysis of documented reliability outcomes from peer automakers that had already deployed OLED technology in comparable vehicle platforms. The engagement produced a phased supplier qualification framework prioritizing reliability testing before final commercial commitment.
KEY FINDINGS
  1. Peer automakers using OLED dashboard displays reported customer satisfaction scores improving by approximately 15 percent (client-reported, unverified by MMA), primarily driven by perceived technology differentiation versus competing vehicle models.
  2. Vendor pricing models varied considerably, with OLED panels costing meaningfully more per unit than LCD alternatives, though the price gap narrowed faster than most industry projections anticipated over the qualification period.
  3. Reliability testing data from peer automakers showed OLED displays meeting automotive temperature and durability requirements, though qualification timelines ran longer than initial supplier estimates suggested.
  4. Integration with the automaker's existing infotainment software stack proved more technically complex than most suppliers initially represented during sales evaluation, extending the typical implementation timeline by several additional months.
CLIENT PROFILE
The client is a major United States automaker developing a next-generation electric vehicle platform requiring substantially larger and higher-resolution dashboard and infotainment displays than its current model lineup, competing against rivals already offering advanced digital cockpit experiences. Facing pressure to differentiate on technology while managing considerable cost constraints, leadership sought an independent panel supplier evaluation before finalizing platform design decisions.
STRATEGIC CHALLENGE
The automaker's existing display suppliers offered mature LCD technology adequate for current vehicle generations but potentially insufficient for the premium digital cockpit experience the new platform required to compete against technology-forward rivals. Leadership needed to evaluate whether transitioning to OLED display technology across the new platform justified the higher per-unit cost and longer supplier qualification timeline involved.
MMA APPROACH
MMA conducted a structured supplier evaluation combining expert interviews with the automaker's design and procurement leadership, competitive benchmarking across five leading display panel manufacturers, and analysis of documented reliability outcomes from peer automakers that had already deployed OLED technology in comparable vehicle platforms. The engagement produced a phased supplier qualification framework prioritizing reliability testing before final commercial commitment.
KEY FINDINGS
  1. Peer automakers using OLED dashboard displays reported customer satisfaction scores improving by approximately 15 percent (client-reported, unverified by MMA), primarily driven by perceived technology differentiation versus competing vehicle models.
  2. Vendor pricing models varied considerably, with OLED panels costing meaningfully more per unit than LCD alternatives, though the price gap narrowed faster than most industry projections anticipated over the qualification period.
  3. Reliability testing data from peer automakers showed OLED displays meeting automotive temperature and durability requirements, though qualification timelines ran longer than initial supplier estimates suggested.
  4. Integration with the automaker's existing infotainment software stack proved more technically complex than most suppliers initially represented during sales evaluation, extending the typical implementation timeline by several additional months.
RECOMMENDED STRATEGY
Phase 1: Pilot OLED display technology within the highest-trim vehicle configuration first, measuring documented customer satisfaction and reliability outcomes over one full model year. Phase 2: Expand OLED deployment to mid-tier trim levels following successful pilot validation, negotiating volume pricing once qualification timelines and reliability data become clearer. Phase 3: Integrate display supplier reliability data directly into the automaker's ongoing quality assurance and warranty tracking systems, creating a permanent institutional capability.
OUTCOME
(Client-reported, unverified by MMA) The pilot program validated OLED display reliability across the highest-trim vehicle configuration while customer satisfaction scores improved by an estimated 12 percent compared to the previous LCD-equipped model generation. Leadership subsequently approved expanded OLED deployment across two additional trim levels beginning with the following model year.

Frequently Asked Questions

Foundational context covering the market sizes, CAGR, scope, country, region and competition that inform every finding below. This section is provided to cover basics and most often pre-purchase conversations, answered from the MMA Primary Research Dataset.

What is the current size of the Demand for Displays in USA?

The Demand for Displays market reached an estimated $32.0 billion in 2025, reflecting steady consumer electronics and automotive demand across LCD, OLED, and emerging MicroLED display technologies.

How large will the Demand for Displays in USA be by 2036?

MMA projects the market will reach approximately $78.5 billion by 2036, driven by continued OLED cost reductions and expanding automotive dashboard display integration across nearly every vehicle price tier.

What is the CAGR for the Demand for Displays in USA 2026 to 2036?

The market is expected to grow at a compound annual growth rate of 8.5 percent between 2026 and 2036, reflecting steady technology transition momentum across major end-use categories.

Which segment is growing fastest?

MicroLED display panels are the fastest-growing segment, expanding at approximately 15.5 percent annually, roughly 1.82 times the overall market growth rate as manufacturing yields gradually improve.

Who are the major companies in the Demand for Displays in USA?

Leading participants include Samsung Display, LG Display, BOE Technology Group, TCL CSOT, and Sharp Corporation, together holding an estimated 58 percent of category revenue on a consistent revenue basis.

Which country is growing fastest?

South Korea shows the fastest national growth trajectory at approximately 12.5 percent annually, driven by continued premium OLED and MicroLED manufacturing investment and technology leadership.

Report Segmentation Architecture

The full report scope spans multiple orthogonal segmentation dimensions, with cross-tabulated demand data provided for each dimension pair. Coverage extends further to regional breakdowns, trend trajectories, and the competitive detail needed to support segment-level decision-making.

By Primary Market Dimension

  • MicroLED Display Panels
  • OLED Display Panels
  • Mini-LED Backlit LCD Panels
  • QLED Display Panels
  • E-Paper and Reflective Display Panels
  • Standard LCD Panels

By End-Use Industry

  • Consumer Electronics
  • Automotive
  • Commercial Signage and Display
  • Healthcare and Medical Devices
  • Industrial and Aerospace
  • Wearable Devices

By Commercial Dimension

  • OEM Direct Supply Agreements
  • Automotive Design-Win Contracts
  • Distributor and Retail Channel Sales
  • Module Integration Partnerships

By Region

  • North America
  • Western Europe
  • East Asia
  • South Asia and Pacific
  • Latin America
  • Middle East and Africa
  • Eastern Europe

Scope, Methodology, and Coverage

Every figure in this report is reproducible from documented input assumptions. The scope below maps the historical period, the forecast horizon, the segmentation dimensions, and the countries covered, alongside the underlying primary and qualitative methodology.
Historical Period
2020 to 2025
Forecast Period
2026 to 2036
Base Year
2025 (USD billions; MMA Primary Research Dataset, September 2026)
Market Definition
The Demand for Displays Market covers finished display panels and modules across LCD, OLED, and MicroLED technologies used in televisions, smartphones, laptops, monitors, and automotive applications, measured by shipment revenue at the panel and module level. It excludes display driver semiconductors sold separately, raw glass substrate manufacturing, and downstream device assembly not involving the display module itself.
Quantitative Units
USD billions, market share percentage, CAGR percentage
Segmentation Dimensions
By Primary Market Dimension, By End-Use Industry, By Commercial Dimension, By Region
Regions Covered
North America, Western Europe, East Asia, South Asia and Pacific, Latin America, Middle East and Africa, Eastern Europe
Countries Covered
United States, Canada, South Korea, China, Japan, Germany, France, United Kingdom, India, Australia, Brazil, Mexico, United Arab Emirates, Saudi Arabia, South Africa, Poland
Key Companies Profiled
Samsung Display, LG Display, BOE Technology Group, TCL CSOT, Sharp Corporation, AU Optronics, Innolux Corporation, Japan Display Inc., Visionox, Tianma Microelectronics, Truly International Holdings, HKC Corporation, CEC Panda, Universal Display Corporation, eMagin Corporation, Kopin Corporation, Himax Technologies, Novaled, Corning Incorporated, Applied Materials
Quantitative Methodology
Primary survey, n=3,800 respondents, Q4 2025, six countries; demand-side model with trade association cross-validation
Qualitative Methodology
47 expert interviews, Q4 2025; applied to validate demand model assumptions, identify emerging dynamics, and assess competitive positioning
Report Format
PDF and XLSX data workbook (Word format preview document)
Publisher
Market Minds Advisory
Report Code
MMA-2026-TEC-644
Published
September 2026
Contact
sales@marketmindsadvisory.com | www.marketmindsadvisory.com

Purchase the full Demand for Displays in USA Report (2026 to 2036).

The full report provides comprehensive market sizing, ten-year forecasts, competitive benchmarking, and regional analysis for display panel demand across LCD, OLED, and MicroLED technologies, drawing on primary survey data and expert interviews across major consumer electronics and automotive markets. It examines segment-level growth trajectories, vendor positioning, revenue diversification strategies, and input cost exposure in meaningful analytical detail. Readers gain access to the complete data tables underlying every chart and figure referenced throughout the summary analysis. The report also includes an extended case study and a detailed methodology appendix.
Full segment-level revenue and CAGR breakdowns
Detailed competitive profiles of twenty market participants
Regional forecast data for all seven covered geographies
Complete input cost and mitigation strategy analysis
Extended case study library with additional client engagements
Downloadable data tables in spreadsheet format

Built For The People Who Decide

From boardroom strategy to bench-side execution, this report is read cover-to-cover by leaders shaping the next decade of their industry, turning demand scenarios, market dynamics and valuation benchmarks into decisions.
CXOs/ Presidents/ VPs/ Managers
M&A and Corporate Development
Strategy Teams and R&D Heads
Procurement and Product Directors
Regulatory and Compliance Leaders
Investor Relations and Equity Analysts