Market Minds Advisory
Demand for Cloud ELN Service in USA

Demand for Cloud ELN Service in USA: Demand for Cloud ELN Service in USA: Bought as a Legal Record, Sold as Productivity, Used by Rather Fewer People Than Anybody Reports

Around 38% of deployed seats record an experiment on a typical day, because an electronic notebook competes with paper and a pen and loses on speed until templates are built.

Lead Analyst

Published

September 2026

Make Smarter Decisions with Customized Research Insights

Request a free sample report and evaluate market opportunities, growth trends, and competitive dynamics relevant to your business needs.

2025 MARKET VALUE$1.4BMarket Size 2025
2036 FORECAST VALUE$5.8BBase Case , 2026 to 2036
CAGR 2026 TO 203613.8 %Bull 15.0% / Bear 12.6%
INCREMENTAL OPPORTUNITY$4.2BNet 10- year value creation
EXPANSION MULTIPLE3.64x2036 value over 2026 base
Strategic Levers
M&A Pipeline
Regional Outlook
Country Rankings
Competitive Intelligence
Segmental Deep-dive
Call-Us : 91 93563 13602

Executive Snapshot and Market Trajectory.

Electronic notebooks are sold as productivity tools and bought as legal records. In the United States the purchase is driven by patent evidence and inspection readiness, which is why the decision sits with legal and quality functions rather than with anybody at a bench. The bench was not consulted.
Academic and small biotech labs grow at 20.7%, half again the market rate of 13.8%, because cloud pricing near USD 1,450 a seat finally reached organisations that could never fund an enterprise deployment. Contract research platforms follow at 16.4%. North America takes 44% of value on biotech density, research funding and patent evidence requirements together. Regulated quality laboratories at 10.4% grow slowest of all, since most of them already had systems in place.
Concentration sits near 41% across the top five on measured subscription and service revenue. The number nobody publishes is usage: roughly 38% of deployed seats record anything on a given day, and about 44% of laboratories keep parallel paper records regardless of what they have installed. Deployment numbers therefore overstate adoption badly, and renewal conversations are about to get considerably harder than the deployment ones were.
Market Definition
This market covers cloud-delivered electronic laboratory notebook services and directly attached configuration and integration work, spanning academic and small biotech labs, contract research organisation platforms, pharmaceutical discovery research, chemicals and materials laboratories, regulated quality control laboratories, and food, agriculture and environmental labs. Revenue is measured as subscription, configuration and attributable integration value at supplier level, with the United States treated as the analytical centre within a global sizing frame. Laboratory information management systems sold separately, scientific data management platforms, instrument control software, and on-premises notebook licences are excluded.
Base Year Value
$1.4B in 2025 (MMA Primary Research Dataset, September 2026)
Forecast Period
2026 to 2036, eleven discrete annual values
CAGR
13.8% base case. Bull 15.0%. Bear 12.6%.
Fastest Growth Segment
Academic and Small Biotech Labs: 20.7% CAGR
Fastest Growth Country
India: 17.4% CAGR
Fastest Growth Region
South Asia and Pacific: 16.0% CAGR
Largest Region
North America: 44% of 2025 global value
Market Leaders
Benchling, Dotmatics, LabWare, Revvity Signals and Sapio Sciences lead on measured subscription and service revenue. Source: MMA Primary Research Dataset, July 2026.
Primary Survey
n=3,800 procurement and R&D decision-makers, Q4 2025, six countries
Methodology
Demand-side build-up, cross-validated against public data, 47 expert interviews

Demand for Cloud ELN Service in USA Market Forecast Scenarios

united-states-cloud-eln-service-market-size-forecast-scenario-1788453010415
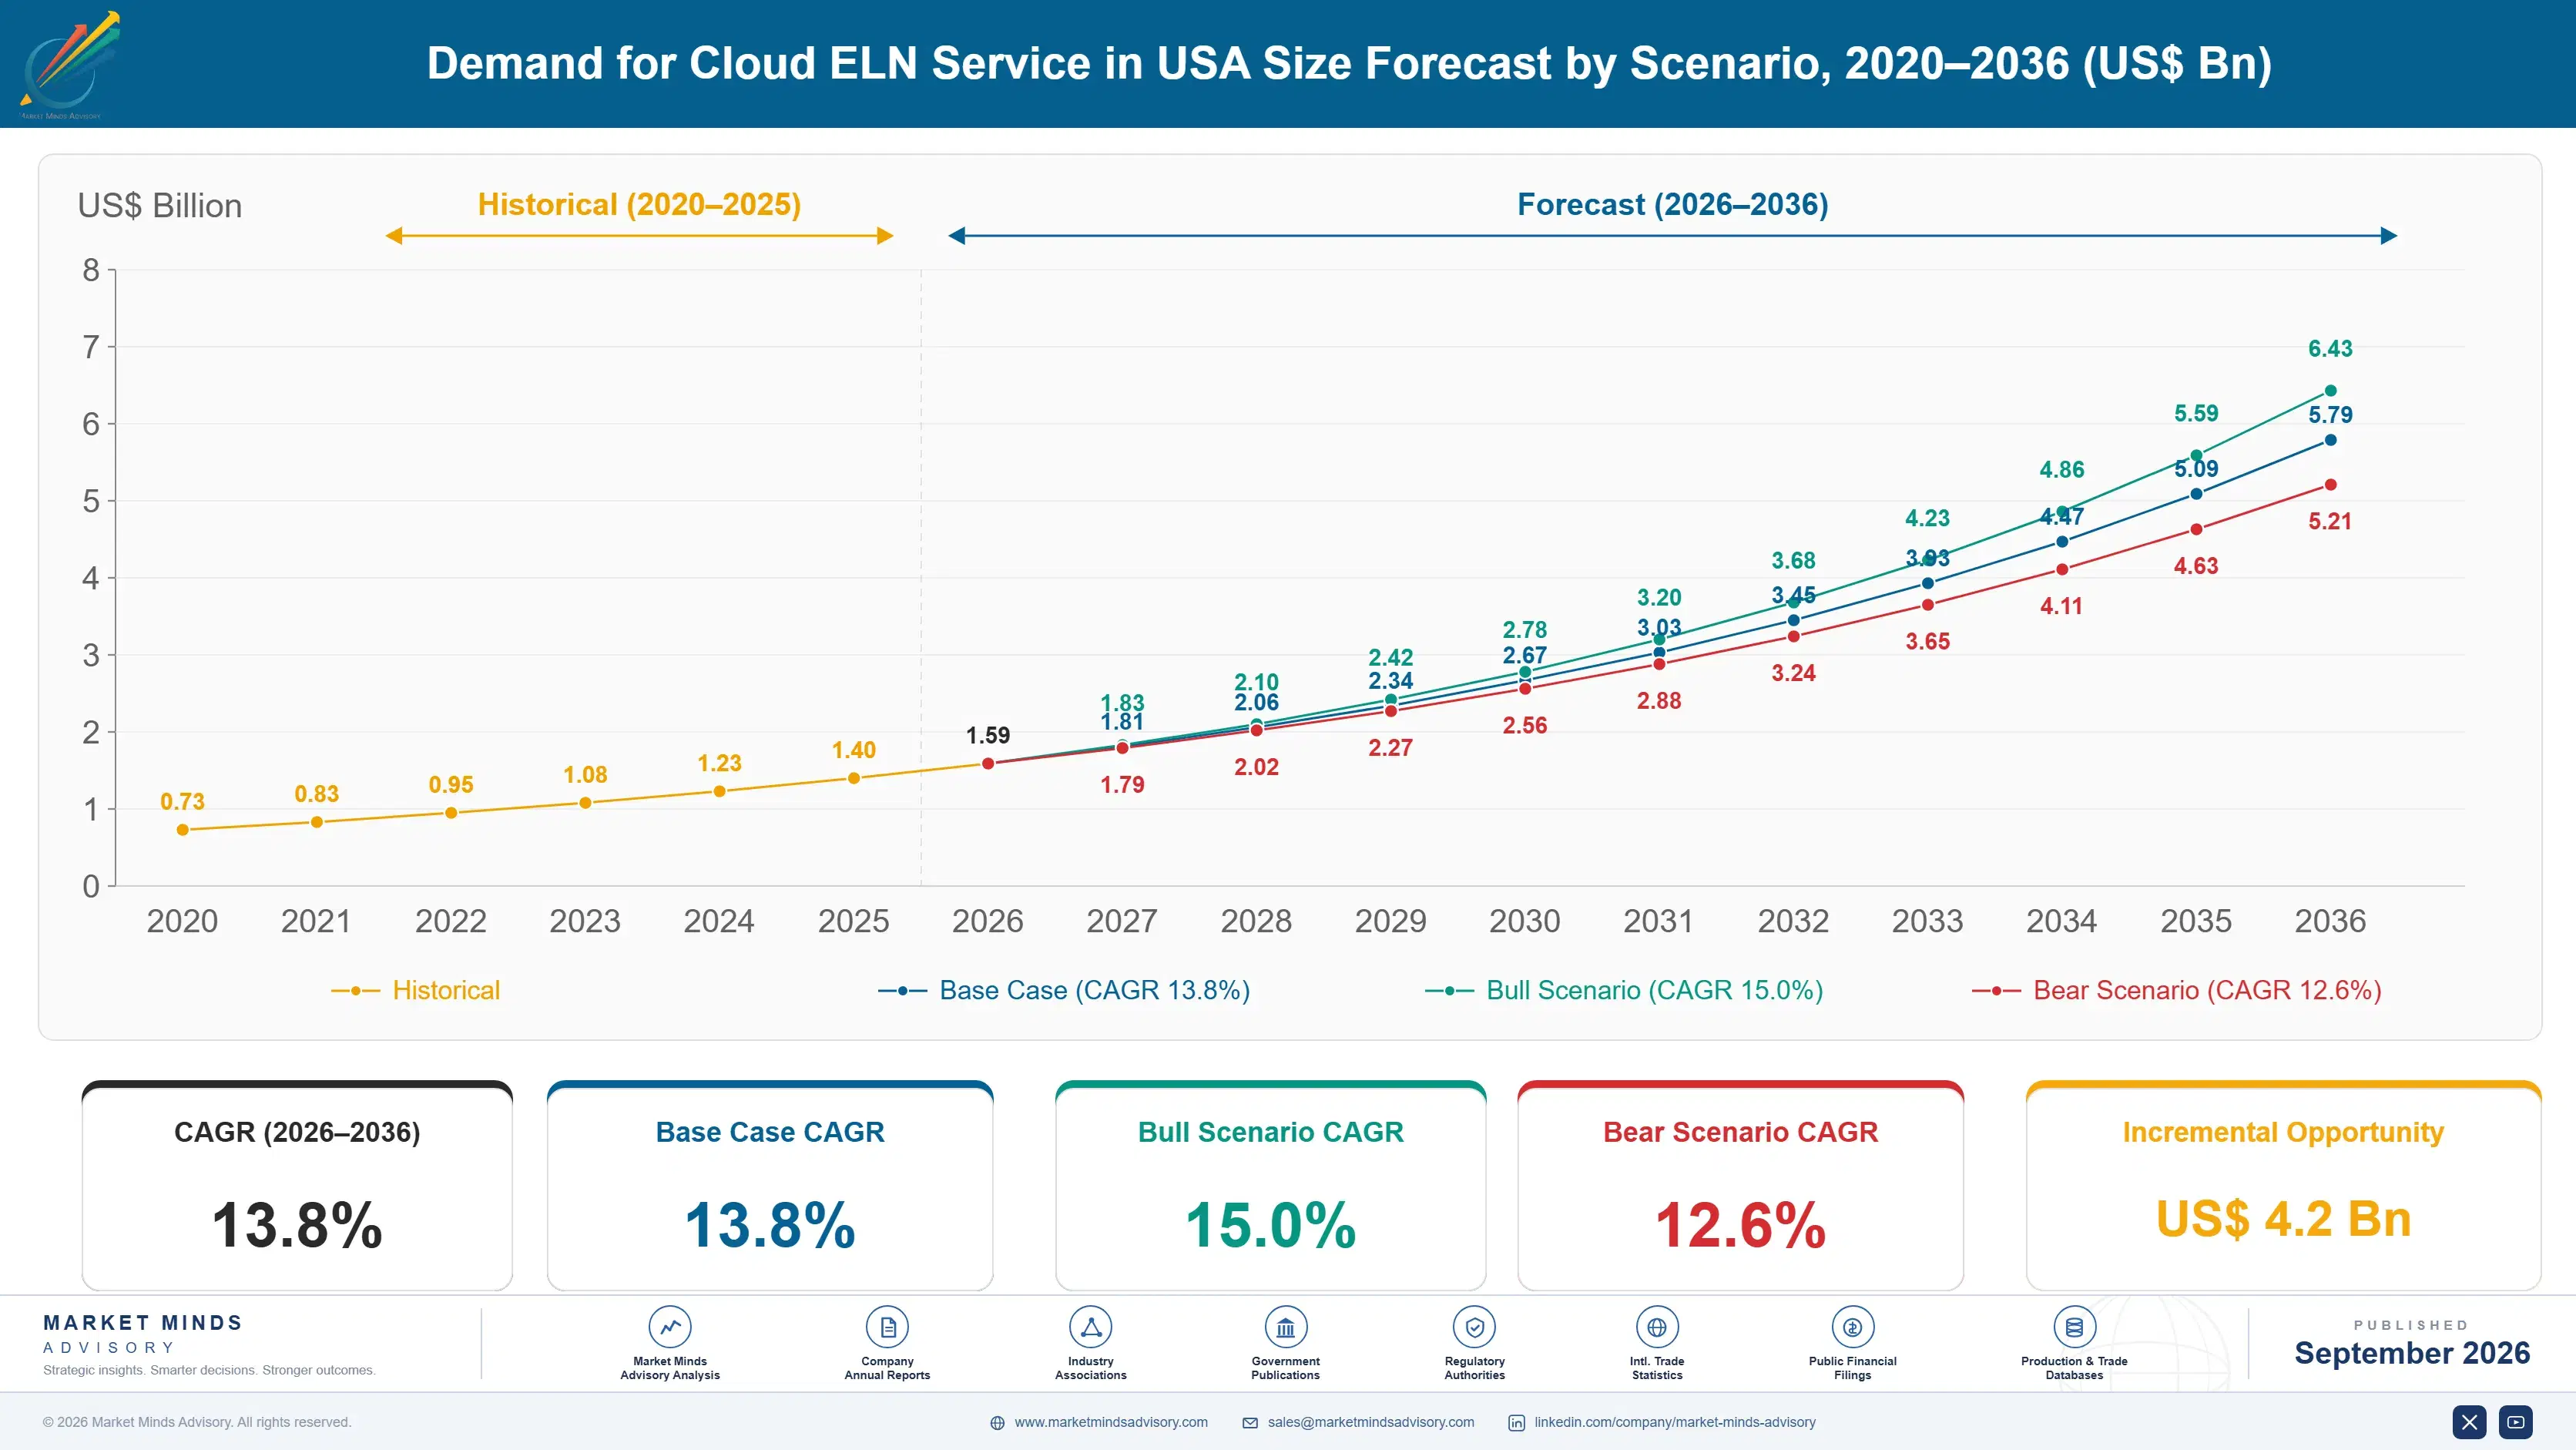
Growth ran at 12.4% from 2020 to 2025 and the composition changed sharply inside the period. Large pharmaceutical organisations had already deployed notebooks and spent those years consolidating platforms acquired through mergers rather than adding new ones. What genuinely expanded the market was cloud pricing reaching small biotechnology companies and academic laboratories that had always needed the record and never been able to fund an enterprise system.
The base case at 13.8% rests on three mechanisms. Patent evidence requirements and inspection expectations make the notebook a legal record rather than a convenience, which is why the purchase survives budget scrutiny that productivity software rarely does. Subscription pricing near USD 1,450 per seat reaches organisations enterprise licensing never could. Third, contract research organisations need a platform their sponsors can audit, which turns the notebook into a commercial requirement rather than an internal preference.
The bull case at 15.0% assumes instrument integration improves beyond the roughly 27% of instruments currently feeding results without transcription, which is what actually makes scientists use these systems. The bear case at 12.6% is that usage near 38% of deployed seats becomes widely measured, at which point renewal conversations become considerably harder than the deployment conversations were.

Competing With a Pen

The reason organisations buy an electronic notebook and the reason vendors sell one have never matched. Vendors present collaboration, search and productivity. American buyers are purchasing a legal record: patent evidence that survives challenge, and documentation an inspector will accept. That is why the decision sits with legal, quality and research operations rather than the scientists asked to use it daily.
TOP FIVE CONCENTRATION41%Moderately concentrated across cloud laboratory informatics platform providers
DAILY ACTIVE USAGE38%Deployed seats recording experiments on a typical working day
PAPER NOTEBOOK PERSISTENCE44%Laboratories still keeping parallel handwritten records alongside deployment
TEMPLATE CONFIGURATION TIME9 monthsPeriod before scientists record faster than on paper
ANNUAL SEAT PRICEUSD 1,450Typical annual subscription cost for each laboratory user
INSTRUMENT INTEGRATION SHARE27%Laboratory instruments feeding results without any manual transcription
The adoption problem follows directly from that mismatch. An electronic notebook competes with a paper notebook and a pen, which are extraordinarily fast for recording as it happens, and it loses until templates and instrument connections are built. Configuration takes around 9 months before recording is genuinely faster than writing. Until then usage sits near 38% of deployed seats and roughly 44% of laboratories keep paper running alongside.
Cloud pricing changed who can buy, which is the actual growth story. A seat near USD 1,450 annually reaches small biotechnology companies and academic laboratories that always needed a defensible record and could never fund an enterprise deployment. Those buyers behave nothing like pharmaceutical customers: they self-serve, they switch readily, and no compliance obligation compels them to stay. Vendors built for enterprise procurement reach them badly or not at all.
"Every vendor demonstration shows a scientist finding an experiment from three years ago. Nobody demonstrates the scientist recording today's experiment faster than they would with a pen, because until somebody has spent nine months on templates that demonstration would not go well."
Director, Laboratory Informatics and Research Technology Practice · MMA Healthcare Practice · September 2026

Market Trends

Cloud Pricing Opened Laboratories That Never Qualified

Subscription pricing near USD 1,450 per seat reaches small biotechnology companies and academic groups that always needed a defensible record and could never justify an enterprise deployment with its implementation programme attached. Academic and small biotech labs grow at 20.7% on that alone, which is faster than anything else here. These buyers purchase self-service, evaluate in weeks rather than quarters and switch when dissatisfied, since no compliance obligation compels them to remain anywhere. Vendors built for pharmaceutical procurement reach them poorly. Retention rather than acquisition is the real commercial problem in this segment.
Market Impact: Serves 2 legal functions directly
Instrument Integration Decides Whether Anybody Uses It

Only about 27% of laboratory instruments feed results into a notebook without manual transcription, and the gap is what makes electronic recording slower than paper for most bench work. Every result typed by hand is a reason to keep the paper notebook that roughly 44% of laboratories still maintain. Vendors investing in instrument connectivity raise daily usage substantially above the 38% typical figure, which is the metric renewals will eventually be measured against. Integration is unglamorous engineering that decides commercial outcomes. Nobody demonstrates instrument connectivity in a sales meeting because it does not show well.
Market Impact: Grows at 16.4% each year

Market Opportunities and Growth Drivers

Patent Evidence Makes the Notebook a Legal Record

A laboratory notebook is evidence in patent proceedings and in regulatory inspection, and an electronic record with reliable timestamps, audit trails and witnessing is considerably stronger than a bound paper book with contested handwriting. That reframes the purchase entirely: it is bought by legal and quality functions against risk rather than by research management against productivity. The distinction matters commercially, since risk budgets survive scrutiny that productivity software cannot. American patent practice makes this argument stronger here than elsewhere. A contested paper notebook and a timestamped audit trail are not remotely comparable evidence.
Market Impact: Persists in 44% of laboratories

Sponsors Require Auditable Platforms From Contract Labs

Contract research organisations work for sponsors who need to inspect the underlying records, which turns notebook selection from an internal preference into a commercial requirement that affects which contracts a laboratory can win. Sponsors increasingly specify platform capabilities in agreements. Contract research platforms grow at 16.4% on that pressure rather than on any internal efficiency case. The buying organisation is business development as much as laboratory operations, which changes both the sales conversation and how quickly decisions get taken. Losing a bid for want of a qualifying platform concentrates attention rather effectively. Nobody argues afterwards.
Market Impact: Consumes 9 months configuring

Market Restraints and Challenges

Scientists Keep the Paper Notebook Anyway

Roughly 44% of laboratories maintain handwritten records alongside a deployed electronic system, because writing an observation as it happens remains faster than any interface until templates and instrument connections are built. The root cause is that the notebook competes against a pen rather than against another system. Commercially this means deployment numbers overstate adoption badly, and renewal conversations become difficult once anybody measures usage. Vendors mitigate through template libraries and integration, which take around 9 months to deliver. Deployment numbers look excellent and describe nothing at all about whether anybody records anything daily.
Market Impact: Reaches labs at USD 1,450 seats

Configuration Takes Longer Than Anybody Budgets

Templates that make recording faster than paper take around 9 months to build properly for a given laboratory's actual workflows, and the effort falls on scientists who did not ask for the system. The root cause is that laboratories differ enormously in what they record and how, so generic templates fit nobody particularly well. Commercially this creates a long trough between purchase and value where dissatisfaction accumulates. Mitigation runs through discipline-specific template libraries, which reduce the effort without removing it. Scientists who did not choose the system are asked to configure it themselves.
Market Impact: Connects only 27% of instruments
4 additional market trends, 3 additional growth drivers, and 2 additional restraints and challenges are covered in the full report. Contact sales@marketmindsadvisory.com to access the complete intelligence.

Segment CAGR and Growth Architecture

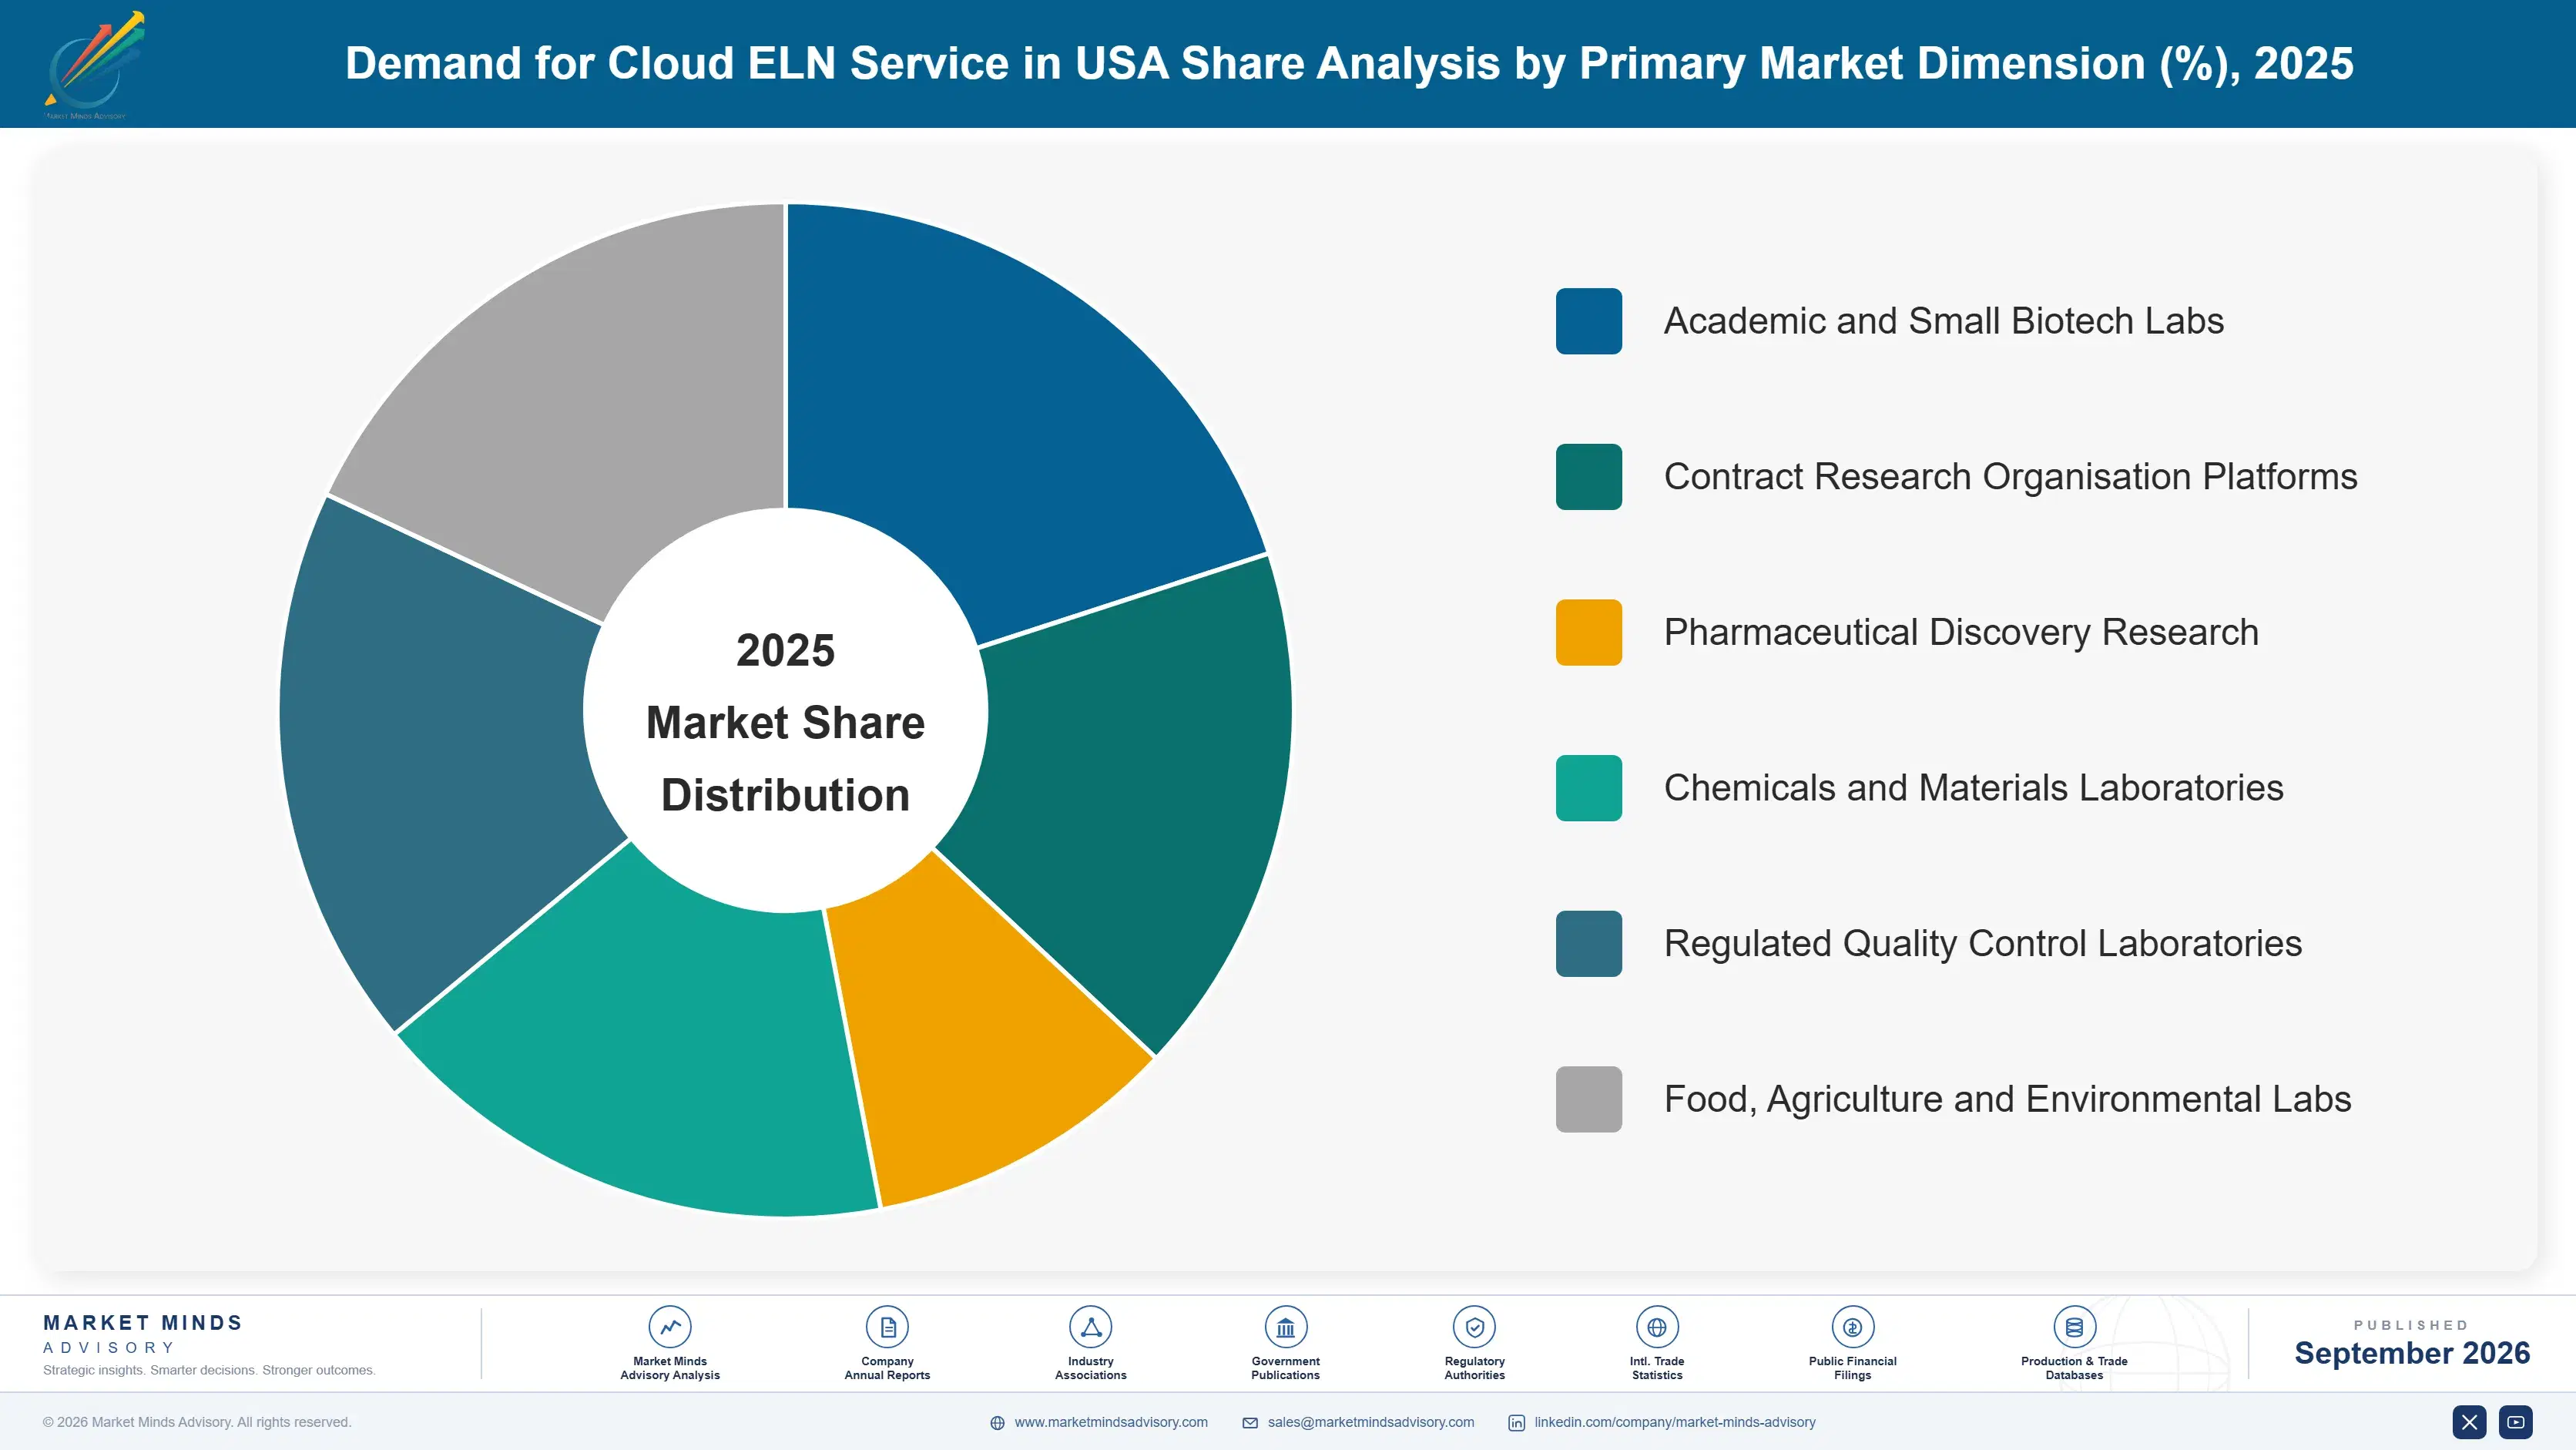
Segmentation follows laboratory type, because that determines who buys, what compels them to stay and how the record will eventually be used. A regulated quality laboratory and an academic research group both need defensible records, and everything about how they purchase, configure and renew a system differs completely. Only the underlying legal record is common.
united-states-cloud-eln-service-market-market-share-analysis-1788453010948

Academic and Small Biotech Labs

Academic and small biotech laboratories grow at 20.7%, half again the market rate of 13.8%, because subscription pricing near USD 1,450 a seat finally reached organisations that always needed a defensible record and never had enterprise budgets. These buyers evaluate in weeks, purchase without procurement processes and switch when dissatisfied, since no regulatory obligation ties them to any platform. That makes the segment fast growing and genuinely churn-prone in a way pharmaceutical accounts never are. Vendors built around enterprise selling reach these laboratories badly, and self-service onboarding rather than sales capability determines who captures them. Retention rather than acquisition is the commercial problem here, and most vendors have that inverted entirely.
CAGR 20.7%

Contract Research Organisation Platforms

Contract research platforms grow at 16.4% because sponsors need to inspect underlying records and increasingly specify platform capability in agreements, which turns notebook selection into a commercial requirement affecting which contracts a laboratory can win. The buying decision therefore involves business development alongside laboratory operations, and it moves faster than internal efficiency arguments ever do. Multi-sponsor working creates data separation requirements that general notebooks handle poorly. Vendors supporting sponsor-specific access controls and audit views hold positions that a general platform cannot easily contest afterwards. Sponsors rarely change platform requirements once written into an agreement, which makes these positions considerably more durable than the self-service accounts growing faster alongside them. Sponsors rarely revisit those clauses.
CAGR 16.4%
Full segment breakdown across 6 segments available in the complete report.

Regional Architecture and Country Demand Map

This report is United States centred within a global sizing frame, so regional shares describe where comparable value is bought worldwide. Funded laboratory density and patent practice explain the pattern rather better than research spending totals do. Laboratory count rather than research budget predicts this market best.

North America

North America holds 44%, above the regional band, because the United States hosts more funded academic laboratories and small biotechnology companies than any comparable market and each is now an addressable buyer at cloud pricing. Patent evidence practice makes the legal record argument stronger here than elsewhere, which puts the purchase with legal and quality functions whose budgets survive scrutiny. Large pharmaceutical organisations deployed years ago and are consolidating platforms rather than expanding seat counts. Contract research demand is substantial and driven by sponsor requirements rather than by internal choice. Usage measurement is arriving here first as research organisations professionalise software management, which will make renewal conversations considerably harder than the deployment ones were.
Share: 44% | CAGR: 14.8% (2026 to 2036)

Western Europe

European demand rests on academic research systems that are substantial and funded differently, with institutional procurement processes that slow adoption considerably against American self-service purchasing. Data protection requirements shape platform selection, particularly for laboratories handling human subject data across borders. Pharmaceutical research organisations deployed early and are consolidating like their American counterparts. Growth at 12.2% is the slowest anywhere, reflecting procurement processes and institutional decision-making rather than any weaker requirement for defensible records. Institutional procurement rather than self-service purchasing dominates, which slows adoption considerably against the American pattern and favours vendors with tender capability. Usage measurement is less advanced here, which postpones the renewal difficulty arriving elsewhere. Pharmaceutical research organisations here deployed early and consolidate like their American peers.
Share: 24% | CAGR: 12.2% (2026 to 2036)
Regional intelligence for 5 additional markets available in the complete report: East Asia, South Asia and Pacific, Latin America, Middle East and Africa, Eastern Europe. Contact sales@marketmindsadvisory.com.
united-states-cloud-eln-service-market-country-cagr-analysis-1788453011520

Making Scientists Actually Use It

Deployment is not the problem in this market and has not been for years. Usage is. Around 38% of seats record anything on a given day, and renewal conversations get harder every year that figure stays unpublished by anybody. Usage is the whole problem. Everything worth doing attacks the gap between purchase and daily use.

Build Discipline-Specific Template Libraries Before Anything Else

Configuration takes around 9 months before recording becomes faster than paper, and that work falls on scientists who never asked for the system, which is where dissatisfaction accumulates and renewals get lost. Prebuilt templates for common disciplines cut that trough by roughly 60% and move a laboratory into genuine use inside a quarter. The library investment is substantial and it compounds across every customer afterwards. Vendors selling configurable platforms without templates are selling a project rather than a product. A configurable platform without templates is really a project the customer has to finish.
Market Impact: Cuts the configuration trough by roughly 60% overall

Invest in Instrument Connectivity Above Features

Only about 27% of instruments feed results without manual transcription, and every hand-typed result is a reason for a scientist to keep the paper notebook that 44% of laboratories still maintain. Connectivity work raises daily usage well above the 38% typical figure, which is the metric renewals will eventually be judged against once buyers start measuring it. It is unglamorous engineering competing internally against features that demonstrate better. Usage rather than capability determines who renews. Every result typed by hand is another reason for a scientist to keep writing on paper. Nothing else changes that.
Market Impact: Lifts daily usage above the 38% typical figure

Serve Small Laboratories Through Genuine Self-Service

Academic and small biotech laboratories grow at 20.7% and buy without procurement processes, evaluating in weeks and switching when dissatisfied, which is a completely different motion from pharmaceutical enterprise selling. Vendors with genuine self-service onboarding acquire these customers at roughly 8% of the sales cost enterprise motion requires. It needs product simplicity that enterprise configurability tends to destroy. Most vendors serve this segment with a cut-down enterprise process and wonder why acquisition costs stay high. Adding a single onboarding call to improve activation destroys the economics that made the segment attractive. Simplicity is the product.
Market Impact: Acquires at roughly 8% of the enterprise cost

Sell the Legal Record, Not the Productivity

American buyers purchase patent evidence and inspection readiness, and the decision sits with legal and quality functions whose budgets survive scrutiny that productivity software reliably fails. Vendors presenting collaboration and search are addressing research management, who like the idea and rarely hold the budget. Proposals framed around record defensibility close at roughly 2 times the rate of productivity framing. The productivity case is genuine and it reaches the wrong person entirely. Legal and quality functions are also the ones who will be asked to defend the record later, which makes them attentive buyers.
Market Impact: Closes at roughly 2 times the usual rate

Who Controls the Margin Pool

Concentration sits near 41% across the top five on measured subscription and service revenue, and the market divides into two groups that barely compete. Enterprise platforms serve pharmaceutical and regulated customers through procurement processes measured in quarters. Self-service products serve academic and small biotechnology laboratories that evaluate in weeks. Very few vendors operate both motions successfully, because the product simplicity one demands conflicts with the configurability the other requires.
Competition runs on three dimensions. Template and discipline coverage is first, since configuration duration determines whether a laboratory reaches genuine use before dissatisfaction sets in. Second is instrument connectivity, which decides daily usage and eventually renewal. Third is regulatory and audit capability for contract research and quality laboratories, where sponsor and inspector expectations rather than user preference set the requirement.

Two pressures will move positions. Usage measurement is arriving as buyers professionalise their software management, and vendors whose deployments sit near 38% daily use will face renewal conversations they have not had before. Meanwhile small laboratory growth at 20.7% rewards self-service capability that enterprise vendors find genuinely difficult to build without compromising the configurability their larger customers demand.
united-states-cloud-eln-service-market-company-positioning-matrix-1788453012046

Competitive Moat and Risk Dimensions

BENCHLING

Moat: Biology workflow depth

Benchling built around biological research workflows rather than as a general notebook, which means its templates and data structures match what molecular biology laboratories actually record daily. That reduces the configuration trough that stops adoption elsewhere. Its position among biotechnology companies scales as those organisations grow, which turns small early accounts into substantial ones over several years.
BENCHLING

Risk: Discipline breadth limits

Chemistry, materials and analytical laboratories record entirely different things, and depth built around biology does not transfer to them without substantial template and data model work. Those segments grow steadily and are served by competitors with matching depth. Enterprise pharmaceutical accounts also demand configurability that conflicts with the opinionated structure making the product fast to adopt.
DOTMATICS

Moat: Chemistry and analytical breadth

Dotmatics covers chemistry, biology and analytical workflows across an assembled platform, which suits pharmaceutical customers consolidating multiple systems inherited through acquisition. Its instrument and application connectivity spans more of a laboratory than notebook-only products reach. Enterprise relationships with research organisations renew across multi-year agreements that self-service products never establish.
DOTMATICS

Risk: Small laboratory reach

Academic and small biotech laboratories grow at 20.7% and buy through self-service evaluation in weeks, which an enterprise sales and implementation motion cannot serve at acceptable acquisition cost. Product simplicity required there conflicts with configurability enterprise customers demand. Building both within one organisation has defeated most vendors who have attempted it seriously.

Players Tracked

Prominent Players

Benchling
Dotmatics
LabWare
Revvity Signals
Sapio Sciences

Other Key Players

Thermo Fisher Scientific
LabArchives
SciNote
Labguru
eLabNext
Scilligence
Bruker
STARLIMS
LabVantage
IDBS
CDD Vault
Colabra
Rspace
Uncountable
Genemod

Recent Developments

MARCH 2025

Buyers begin measuring notebook usage against deployed seat counts

Research organisations professionalising software management started reporting daily active usage rather than deployment numbers, finding figures substantially below what renewal assumptions had implied. Several reduced seat counts at renewal to match measured use rather than headcount. Deployment numbers had been reported internally as adoption for several years.
Signal: Usage measurement is arriving now, and deployment-based renewal assumptions will not survive it in most accounts.
JULY 2025

Sponsors specify notebook platform capability in research contracts

Pharmaceutical sponsors added explicit record platform and audit access requirements to contract research agreements, making notebook selection a condition of winning work rather than an internal operational choice. Contract laboratories without qualifying platforms lost bidding opportunities directly. Internal efficiency arguments had never once moved these decisions before.
Signal: Platform selection has become a commercial qualification for contract laboratories rather than an internal efficiency decision.
NOVEMBER 2025

Self-service adoption accelerates among academic and startup laboratories

Small laboratories purchased notebook subscriptions directly at seat pricing without procurement involvement, evaluating over weeks and deploying without implementation projects. Switching between products was frequent, since no compliance obligation tied these buyers to any particular platform. Procurement was not involved at any point in any of these purchases.
Signal: The fastest growing buyer group churns freely, which makes retention rather than acquisition the harder problem.

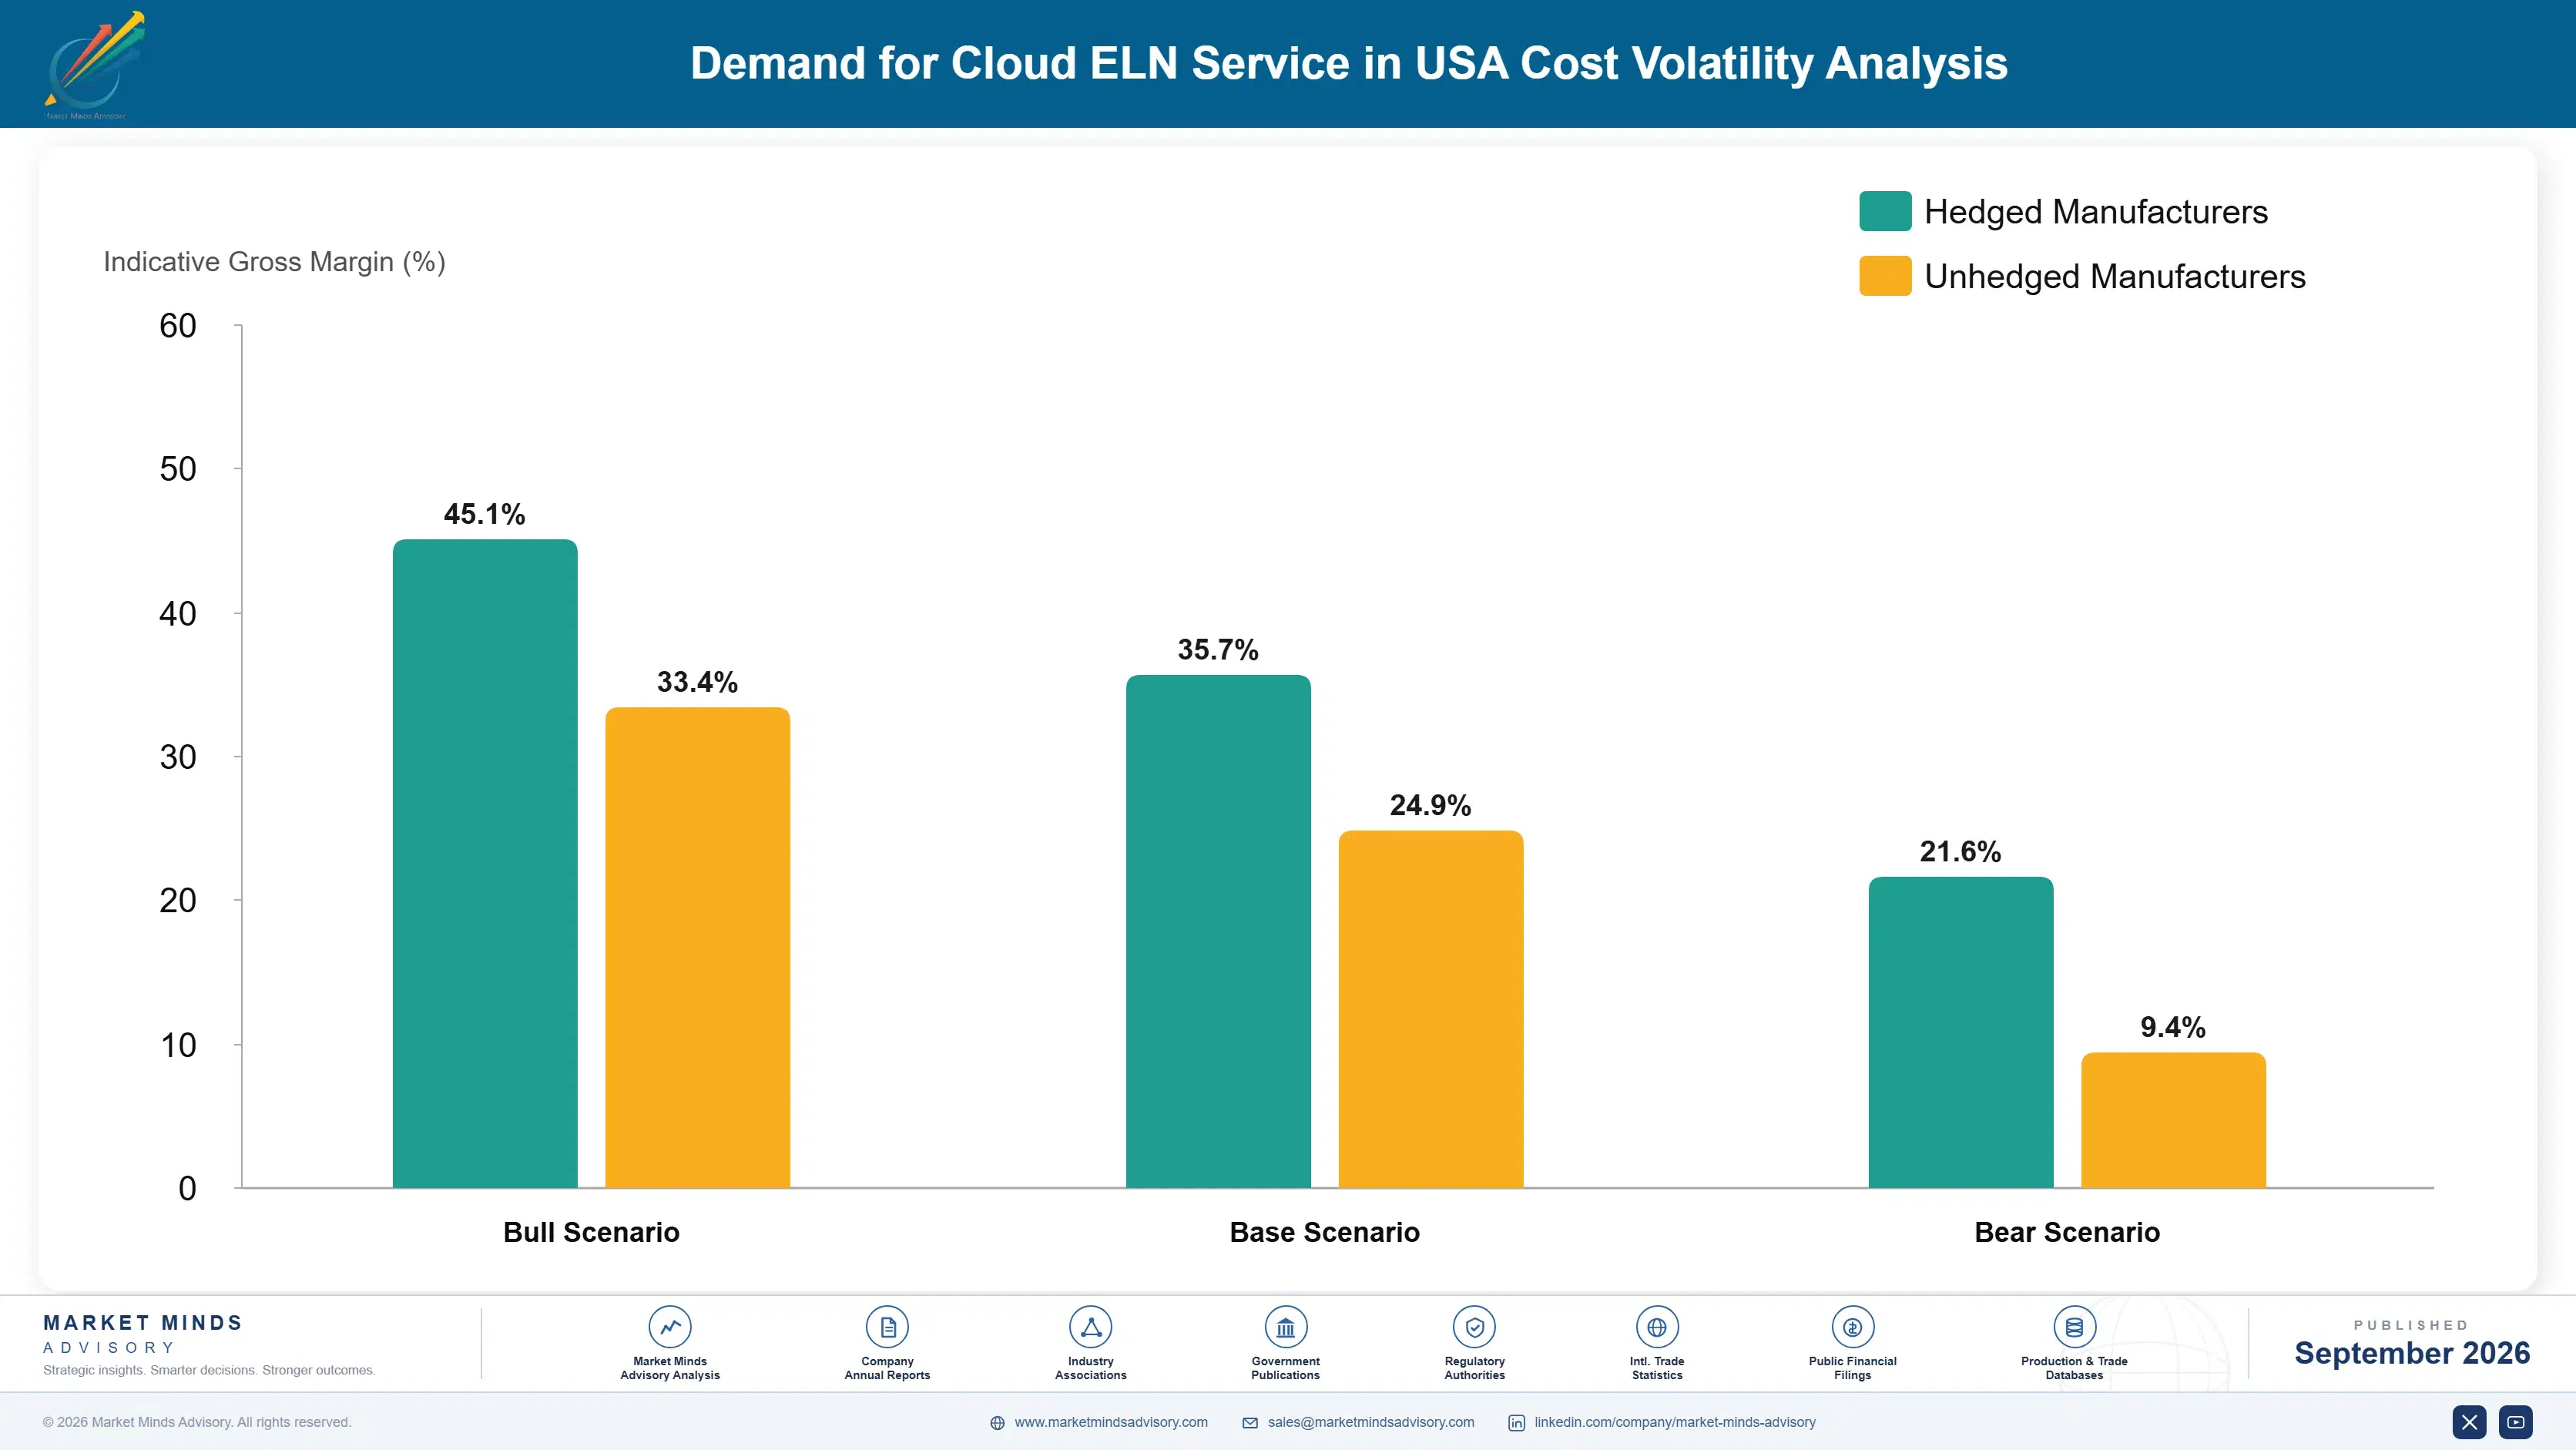
What Delivering a Notebook Costs

Cost structure splits between software delivery and the configuration nobody prices properly. Hosting, validated environments and platform engineering behave like ordinary subscription software cost. Template configuration, instrument integration and scientific onboarding consume roughly 48% of first year revenue on an enterprise account, because a laboratory's workflows differ from every other laboratory's and generic templates fit nobody well enough to be used.
Scientific implementation labour has been the sharpest pressure. People who understand both laboratory practice and software configuration are scarce, and demand rose through 2024 and 2025 as deployments widened beyond early pharmaceutical adopters into contract research and academic settings. Thermo Fisher Scientific and Bruker both referenced services delivery and personnel cost conditions in recent annual reporting. Vendors absorbed most of it, since configuration is frequently bundled into subscription pricing quoted before the work is scoped.

Exposure varies by customer mix rather than by scale. Enterprise-weighted vendors carry heavy configuration cost against multi-year contracts that eventually recover it. Self-service vendors carry almost none and instead face churn among buyers who leave freely. Those attempting both carry enterprise delivery cost while competing on self-service pricing, which is the least comfortable position available and describes more vendors than would admit it.
united-states-cloud-eln-service-market-cost-volatility-analysis-1788453012243

Build template libraries instead of configuring per customer

Configuration consumes roughly 48% of first year enterprise revenue and repeats similar work across laboratories in the same discipline, because vendors treat each deployment as bespoke. Discipline template libraries convert repeated services work into a product asset that compounds across every subsequent customer. The library investment is substantial and it is the difference between a software business and a consultancy.

Price configuration separately from subscription

Bundling configuration into subscription pricing means quoting before the work is scoped, and laboratory workflows vary enough that the estimate is wrong more often than not. Separating configuration into priced scope, assessed after a short discovery, protects the software economics the business depends upon. Buyers accept it once somebody explains why generic templates will not fit their workflows.

Keep self-service onboarding genuinely self-service

Small laboratories acquire at roughly 8% of enterprise sales cost only if they can evaluate, purchase and deploy without human involvement, and any support requirement inserted into that path destroys the economics entirely. Vendors adding onboarding calls to improve activation raise acquisition cost above what the segment supports. Product simplicity is the mechanism, and it conflicts with enterprise configurability.

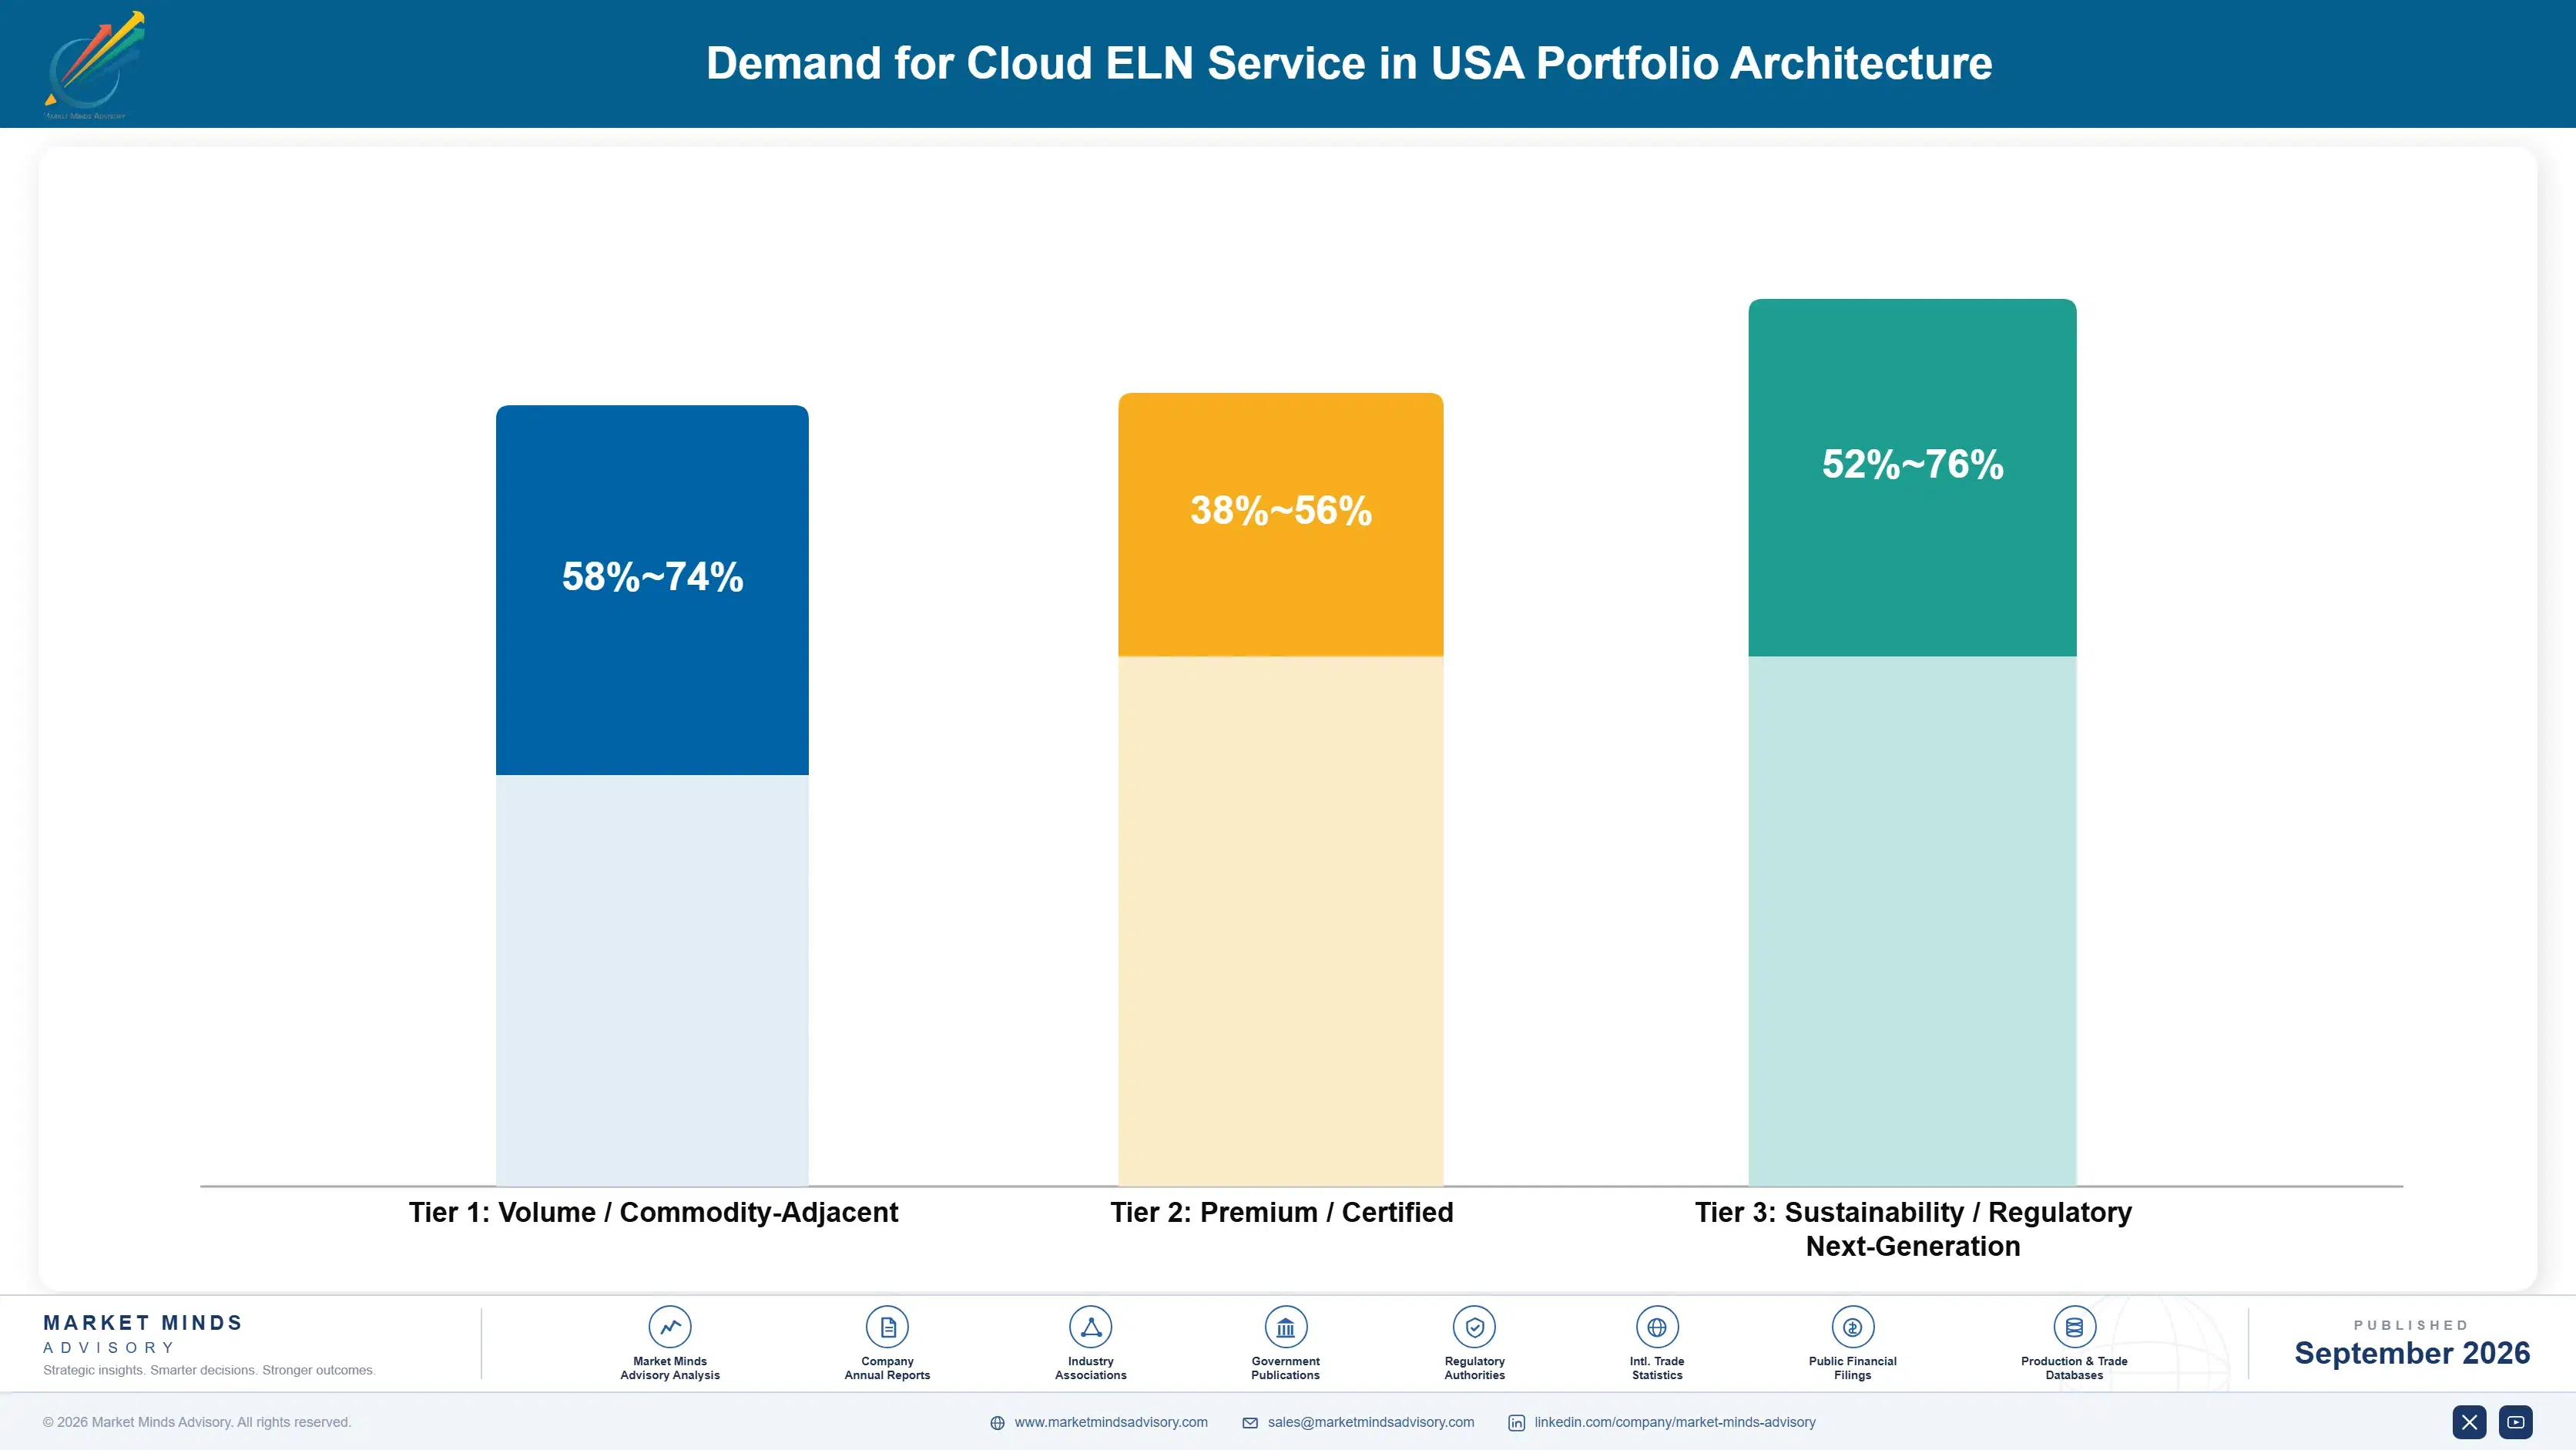
Portfolio Architecture for Margin Defence

Margin architecture separates on how much configuration a customer requires. Self-service subscriptions to small laboratories carry almost no delivery cost and earn software margins immediately, on contract values that are individually modest. Enterprise pharmaceutical deployments carry configuration consuming roughly 48% of first year revenue and earn well only across multi-year terms. Regulated quality laboratory work earns most, since validation requirements narrow the qualified vendor list considerably.
The tension runs between the two motions and it defeats most vendors who attempt both. Self-service requires product simplicity and no human touch in the purchase path. Enterprise requires configurability, validation documentation and implementation capability. Building both inside one organisation means maintaining a simple product and a configurable one, and vendors who compromise toward the middle deliver a product too complex to self-serve and too rigid for enterprise use.

High-value revenue concentrates in regulated laboratory deployments and in contract research platforms. Regulated work is defended by validation documentation that competitors must reproduce entirely. Contract research is defended by sponsor-specific access and audit capability that a general notebook handles poorly. Small laboratory subscriptions are the growth engine, churning freely and costing almost nothing to serve.

Volume / Commodity-Adjacent

Self-service subscriptions to academic and small biotechnology laboratories at seat pricing without implementation. The range reflects churn levels and support automation. Delivery cost is minimal and retention rather than acquisition is the commercial problem here.
Gross Margin: 58-74%

Premium / Certified

Enterprise pharmaceutical and chemical deployments with template configuration and instrument integration. Margin depends heavily on whether template libraries exist or each deployment is configured bespoke. Multi-year terms recover the delivery cost that first year revenue does not.
Gross Margin: 38-56%

Sustainability / Regulatory / Next-Generation

Regulated quality laboratory deployments and contract research platforms with sponsor audit capability. The widest range in the portfolio, reflecting validation documentation depth and access control complexity. Highest margin and the shortest qualified vendor list.
Gross Margin: 52-76%
united-states-cloud-eln-service-market-portfolio-architecture-1788453012769

High-value Sub-segments and Strategic Watch-out

Contract Research Platforms

High value with strong growth at 16.4%, where sponsors specify platform capability in agreements and laboratories cannot win work without qualifying. The range reflects sponsor access and audit complexity. Business development rather than laboratory operations drives the purchase, which moves it considerably faster than internal efficiency arguments ever did.
Gross Margin: 54-76%

Regulated Quality Deployments

High value with steady growth, defended by validation documentation competitors must reproduce entirely before they can even bid. The range reflects regulatory scope and inspection history. It is the slowest growing high-margin segment and the most durable position available anywhere in this market. Nobody displaces it easily.
Gross Margin: 50-72%

Self-Service Laboratory Subscriptions

The growth engine at 20.7%, costing almost nothing to serve and churning freely because no obligation ties these buyers anywhere. The range reflects support automation and activation rates. Retention rather than acquisition is the commercial problem, which most vendors have inverted entirely in how they resource it.
Gross Margin: 57-73%

Bespoke Enterprise Configuration

The strategic watch-out, where configuration consumes roughly 48% of first year revenue and repeats similar work across laboratories in the same discipline. Vendors treating each deployment as bespoke are running a consultancy that ships software. Template libraries convert that same repeated work into an asset instead.
Gross Margin: 0-24%

What Makes Notebooks Stick

Recurrence works through accumulated record rather than through satisfaction. A laboratory with three years of experiments inside a platform cannot leave without either migrating the record or maintaining access to the old system, and the record is legal evidence that must remain retrievable. That builds retention nothing else in laboratory software matches. Small laboratories with months rather than years of history leave freely, which is precisely why the fastest growing segment churns.
Adoption depth varies with instrument connection and template maturity. A laboratory where instruments feed results directly and templates match actual protocols uses the system daily and cannot practically revert. One where scientists retype results and fight generic templates keeps paper alongside and could stop tomorrow without consequence. That distinction, rather than contract terms, explains almost all the retention difference between vendors.

The buyer and the user have never been the same person and the gap is widening. Purchase sits with legal, quality and research operations evaluating record defensibility and inspection readiness. Daily use sits with scientists evaluating whether recording is faster than a pen. Vendors selling to the buyer and ignoring the user achieve deployment and lose renewal, which describes many accounts sold over the past decade.
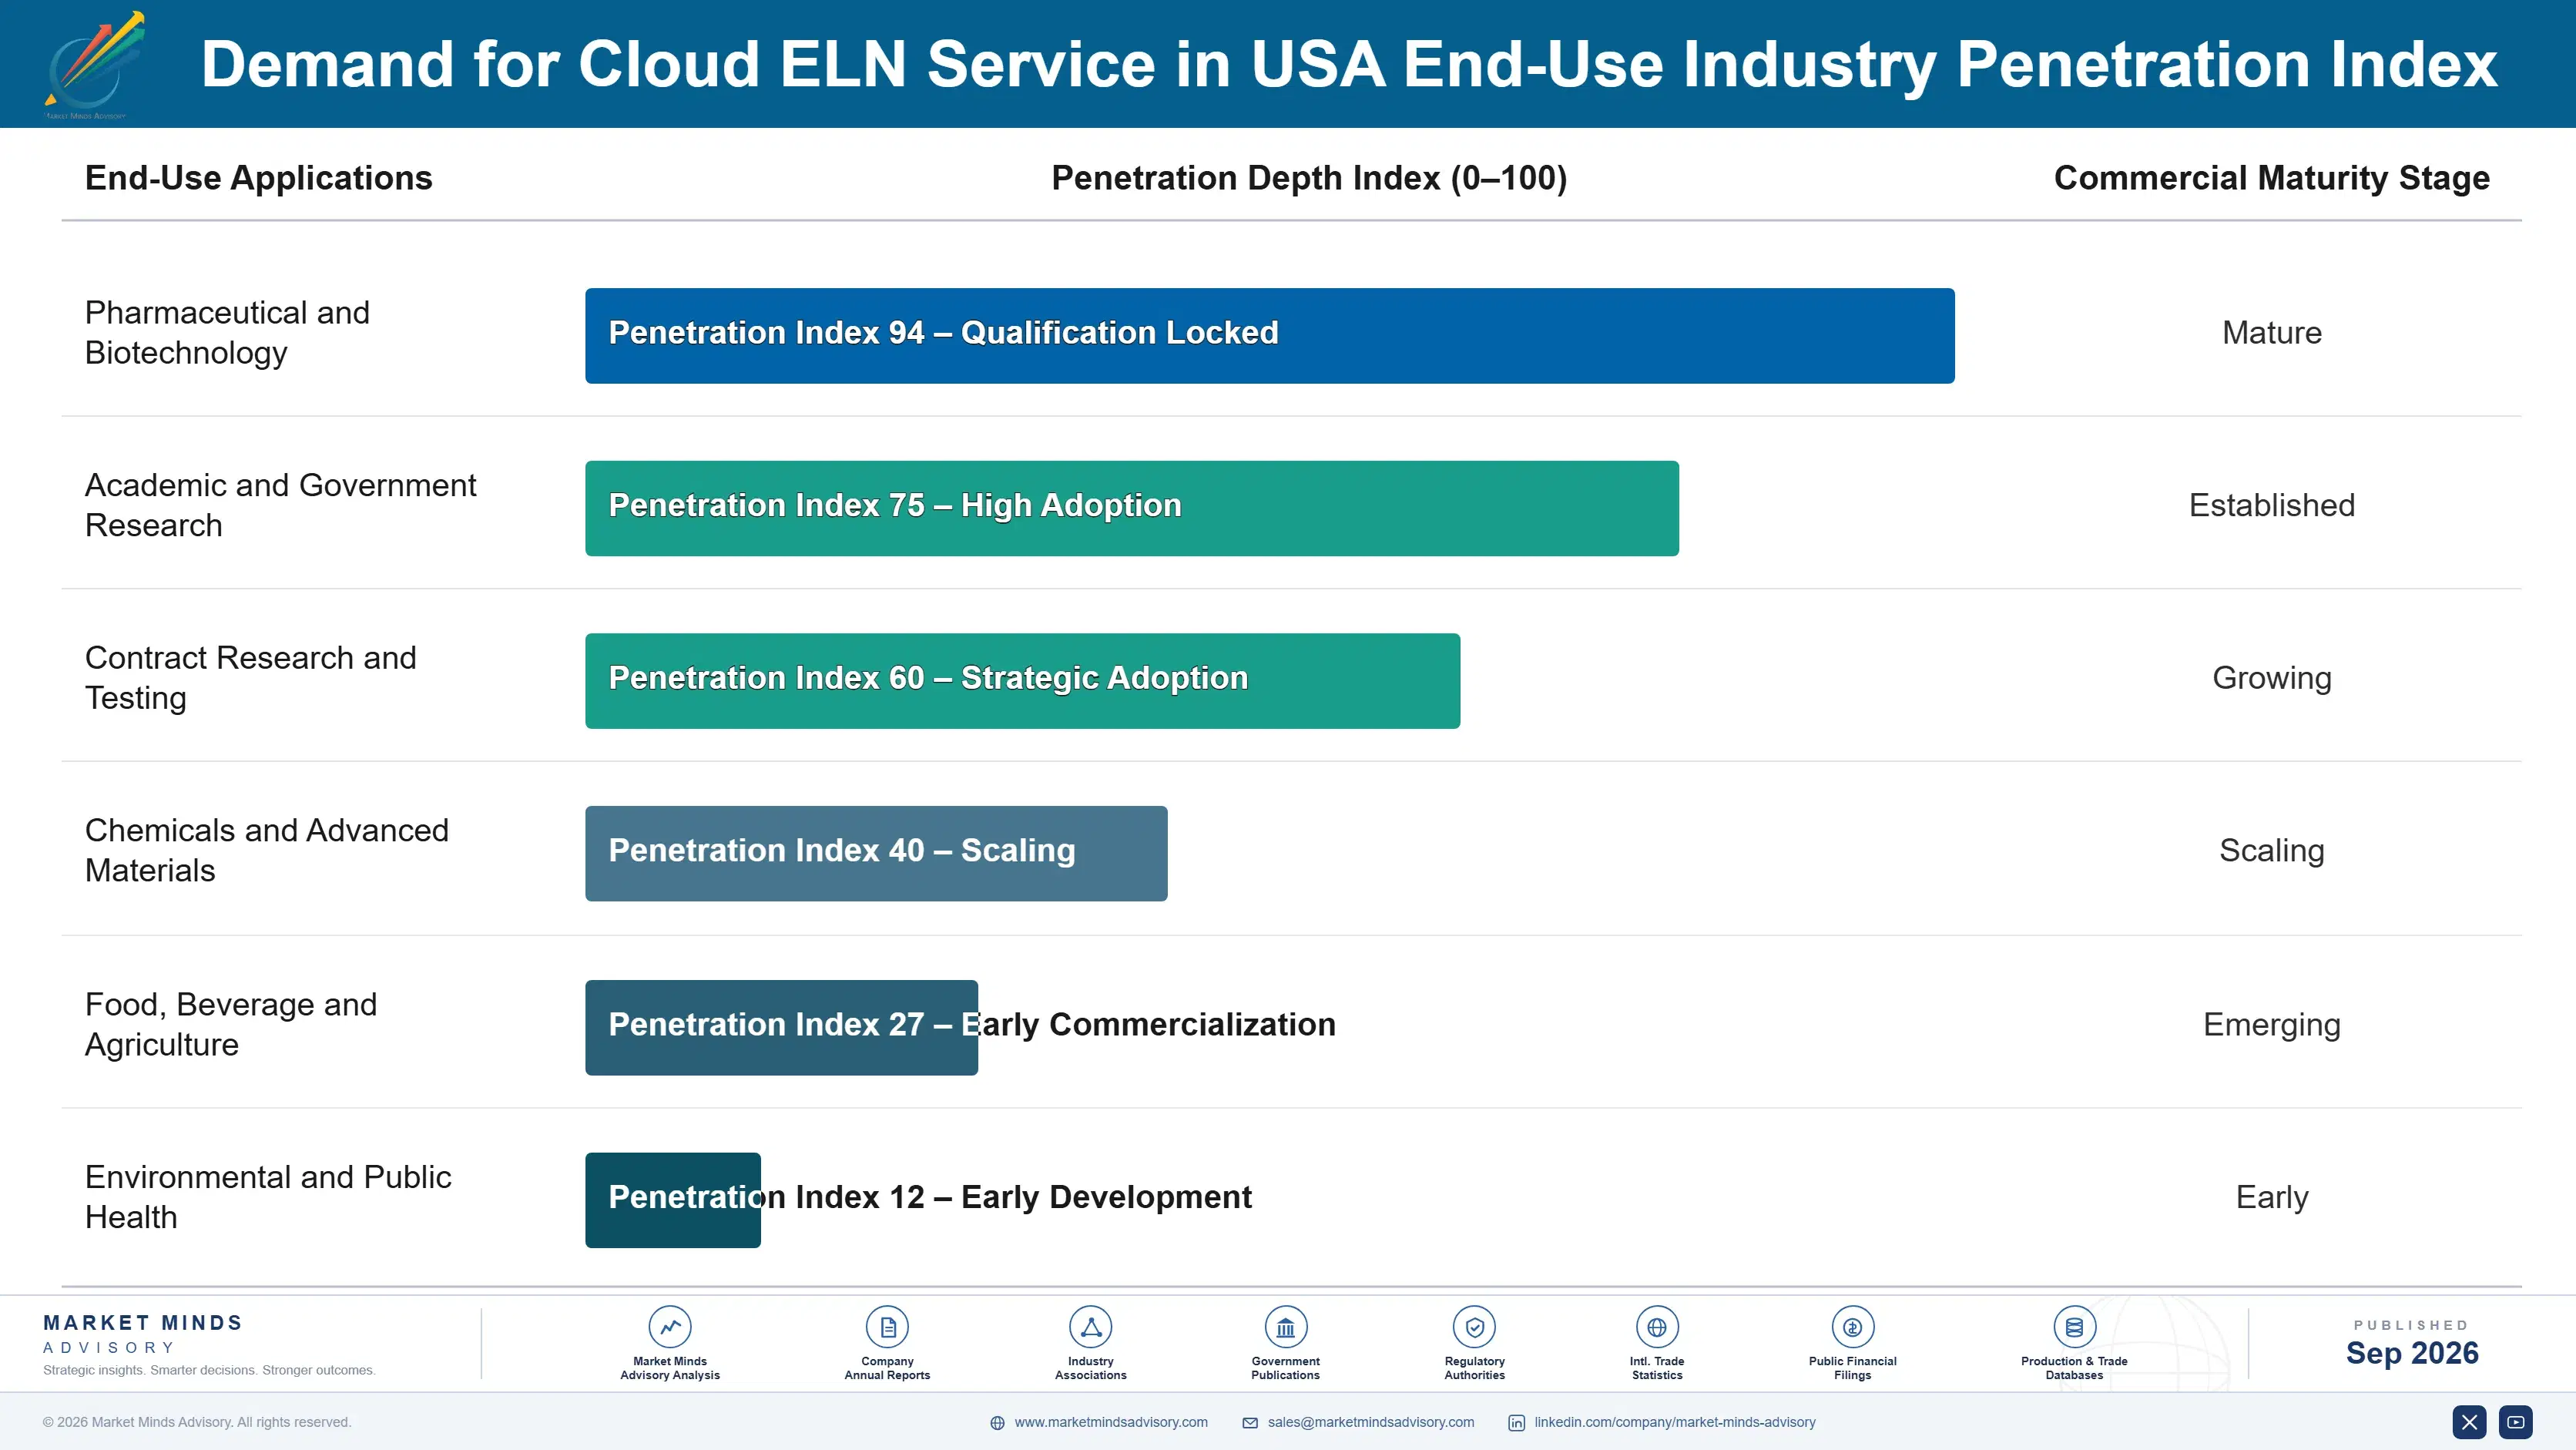
united-states-cloud-eln-service-market-end-use-penetration-index-1788453013258

Deployment Is Not Adoption

These are among the four positions where our research anticipates prominent divergence between winners and laggards over the coming forecast period. Each is grounded in the demand model, the regulatory perimeter, and the announced capacity pipeline.
01 / TEMPLATE LIBRARY INVESTMENT

Ship templates, not a configurable empty platform

Configuration takes around 9 months before recording becomes faster than paper and a pen, and that work falls on scientists who never asked for the system, which is exactly where dissatisfaction accumulates and renewals are quietly lost as a result. Prebuilt discipline templates cut that trough by roughly 60% and move a laboratory into genuine daily use inside a single quarter instead. Vendors selling configurable platforms without templates are selling a project rather than a product, and their customers generally discover this afterwards.
02 / INSTRUMENT CONNECTIVITY PRIORITY

Fund integration ahead of anything that demonstrates better

Only about 27% of laboratory instruments feed results without manual transcription, and every result typed by hand is a standing reason to keep the paper notebook that 44% of laboratories still maintain alongside the system. Connectivity work raises daily usage well above the 38% typical figure, which is precisely the metric renewals will be judged against once buyers begin measuring properly rather than assuming. It is unglamorous engineering competing internally against features that demonstrate far better in a sales meeting than integration ever will.
03 / SELF-SERVICE MOTION PURITY

Keep the small laboratory path entirely free of humans

Academic and small biotechnology laboratories grow at 20.7% and acquire at roughly 8% of enterprise sales cost per customer, but only where they can evaluate, purchase and deploy without any human involvement at all in the purchase path. Any single support step inserted deliberately to improve activation raises acquisition cost above what the segment economics can possibly carry. Product simplicity is the mechanism here, and it conflicts directly with the configurability that enterprise pharmaceutical accounts continue to demand of them.
04 / LEGAL RECORD FRAMING

Sell defensible evidence rather than laboratory productivity

American buyers are in fact purchasing patent evidence and inspection readiness, and that particular decision sits squarely with legal and quality functions whose budgets survive scrutiny that productivity software reliably fails to withstand at all. Vendors presenting collaboration and search features are instead addressing research management, who like the idea considerably and who rarely hold the budget for it themselves. Proposals framed around record defensibility close at roughly 2 times the rate that productivity framing achieves in otherwise comparable accounts.

Engagement Snapshot From the Field

A live engagement with an industry participant carrying material or product regulatory and market exposure ahead of a defining policy shift, showing how our research translates into a defensible multi-year portfolio strategy.
MARKET MINDS ADVISORY · CLIENT ENGAGEMENT SUMMARY
Demand for Cloud ELN Service in USA Producer Strategic Portfolio Review and Transition Roadmap 2026·Investment Scenario on Demand for Cloud ELN Service in USA Exposure Evaluation 2025-26
CLIENT PROFILE
A pharmaceutical research organisation with approximately 1,900 deployed notebook seats across chemistry, biology and analytical laboratories (client-reported, unverified by MMA). The platform had been deployed four years earlier at substantial implementation cost, and renewal was approaching at roughly USD 2.8 million annually with no measurement at all of what people actually used. Nobody had thought to ask.
STRATEGIC CHALLENGE
Research leadership believed adoption was complete because deployment was complete, while laboratory managers were separately funding paper notebook supplies that should have ceased years earlier. Nobody had reconciled those two facts. The vendor was proposing an expanded agreement covering additional modules at approximately USD 900,000 more annually (client-reported, unverified by MMA).
MMA APPROACH
MMA measured daily recording activity per seat rather than reviewing platform capability, which the client had assessed thoroughly at purchase. We analysed system logs across twelve months, audited paper notebook purchasing, interviewed 27 scientists and laboratory managers, and traced which instrument types still required manual transcription by the scientists themselves.
KEY FINDINGS
  1. Daily active recording ran at about 31% of deployed seats, and three laboratories had effectively stopped using the platform entirely months earlier.
  2. Paper notebook purchasing had continued at roughly 70% of pre-deployment volume, which nobody had noticed or questioned across four years of operation.
  3. Only around 22% of instruments fed results directly, and the analytical laboratories with lowest connectivity showed the lowest recorded usage of all across the estate.
  4. Templates had been configured once at deployment and never revised, despite protocols changing substantially across four years of continuing research work at the organisation.
CLIENT PROFILE
A pharmaceutical research organisation with approximately 1,900 deployed notebook seats across chemistry, biology and analytical laboratories (client-reported, unverified by MMA). The platform had been deployed four years earlier at substantial implementation cost, and renewal was approaching at roughly USD 2.8 million annually with no measurement at all of what people actually used. Nobody had thought to ask.
STRATEGIC CHALLENGE
Research leadership believed adoption was complete because deployment was complete, while laboratory managers were separately funding paper notebook supplies that should have ceased years earlier. Nobody had reconciled those two facts. The vendor was proposing an expanded agreement covering additional modules at approximately USD 900,000 more annually (client-reported, unverified by MMA).
MMA APPROACH
MMA measured daily recording activity per seat rather than reviewing platform capability, which the client had assessed thoroughly at purchase. We analysed system logs across twelve months, audited paper notebook purchasing, interviewed 27 scientists and laboratory managers, and traced which instrument types still required manual transcription by the scientists themselves.
KEY FINDINGS
  1. Daily active recording ran at about 31% of deployed seats, and three laboratories had effectively stopped using the platform entirely months earlier.
  2. Paper notebook purchasing had continued at roughly 70% of pre-deployment volume, which nobody had noticed or questioned across four years of operation.
  3. Only around 22% of instruments fed results directly, and the analytical laboratories with lowest connectivity showed the lowest recorded usage of all across the estate.
  4. Templates had been configured once at deployment and never revised, despite protocols changing substantially across four years of continuing research work at the organisation.
RECOMMENDED STRATEGY
Phase 1: Reduce seat count to measured active use and redirect the saving into instrument integration, which is what actually determines usage. Phase 2: Defer the additional module purchase entirely, since existing modules were used by a minority of the seats already paid for. Phase 3: Establish template ownership within each laboratory, since unmaintained templates were the single most cited reason scientists gave for reverting to paper.
OUTCOME
Seat count fell to 1,240 and annual cost to roughly USD 1.9 million, with about USD 400,000 redirected into instrument integration (client-reported, unverified by MMA). Daily active recording rose to around 58% within a year, and paper notebook purchasing fell by more than half for the first time since deployment.

Frequently Asked Questions

Foundational context covering the market sizes, CAGR, scope, country, region and competition that inform every finding below. This section is provided to cover basics and most often pre-purchase conversations, answered from the MMA Primary Research Dataset.

What is the current size of the Demand for Cloud ELN Service in USA?

The market was worth USD 1.4 billion in 2025 and reaches USD 1.59 billion in 2026 on a global sizing frame. The United States is the analytical centre of this report.

How large will the Demand for Cloud ELN Service in USA be by 2036?

MMA forecasts USD 5.79 billion by 2036, an expansion of 3.64 times over the forecast period. That represents USD 4.20 billion of incremental annual revenue against 2026.

What is the CAGR for the Demand for Cloud ELN Service in USA 2026 to 2036?

The base case is 13.8% compound annual growth, with a bull case at 15.0% and a bear case at 12.6%. Whether usage measurement spreads separates the scenarios most clearly.

Which segment is growing fastest?

Academic and small biotech labs grow at 20.7%, half again the market rate of 13.8%. Cloud pricing near USD 1,450 per seat reached organisations enterprise licensing never could.

Who are the major companies in the Demand for Cloud ELN Service in USA?

Benchling, Dotmatics, LabWare, Revvity Signals and Sapio Sciences lead on measured subscription and service revenue. Together they hold roughly 41% across enterprise and self-service motions.

Which country is growing fastest?

India grows fastest at 17.4%, on contract research expansion serving international sponsors who specify auditable record platforms directly within their own research contracts and agreements.

Report Segmentation Architecture

The full report scope spans multiple orthogonal segmentation dimensions, with cross-tabulated demand data provided for each dimension pair. Coverage extends further to regional breakdowns, trend trajectories, and the competitive detail needed to support segment-level decision-making.

By Primary Market Dimension

  • Academic and Small Biotech Labs
  • Contract Research Organisation Platforms
  • Pharmaceutical Discovery Research
  • Chemicals and Materials Laboratories
  • Regulated Quality Control Laboratories
  • Food, Agriculture and Environmental Labs

By End-Use Industry

  • Pharmaceutical and Biotechnology
  • Academic and Government Research
  • Contract Research and Testing
  • Chemicals and Advanced Materials
  • Food, Beverage and Agriculture
  • Environmental and Public Health

By Commercial Dimension

  • Enterprise Subscription Agreements
  • Self-Service Seat Purchases
  • Sponsor Mandated Deployments
  • Institutional Procurement Contracts
  • Configuration and Integration Services
  • Academic Site Licences

By Region

  • North America
  • Western Europe
  • East Asia
  • South Asia and Pacific
  • Latin America
  • Middle East and Africa
  • Eastern Europe

Scope, Methodology, and Coverage

Every figure in this report is reproducible from documented input assumptions. The scope below maps the historical period, the forecast horizon, the segmentation dimensions, and the countries covered, alongside the underlying primary and qualitative methodology.
Historical Period
2020 to 2025
Forecast Period
2026 to 2036
Base Year
2025 (USD billions; MMA Primary Research Dataset, September 2026)
Market Definition
This market covers cloud-delivered electronic laboratory notebook services together with directly attached configuration, template and instrument integration work, spanning academic and small biotech labs, contract research organisation platforms, pharmaceutical discovery research, chemicals and materials laboratories, regulated quality control laboratories, and food, agriculture and environmental labs. Revenue is measured as subscription, configuration and attributable integration value at supplier level, with the United States treated as the analytical centre within a global sizing frame required by the seven-region reporting structure. Laboratory information management systems sold separately, scientific data management and analysis platforms, instrument control and acquisition software, on-premises notebook licences, and laboratory instruments themselves are excluded from scope.
Quantitative Units
USD billions, subscription, configuration and attributable integration revenue at supplier level
Segmentation Dimensions
Laboratory type, end-use industry, commercial model, region
Regions Covered
North America, Western Europe, East Asia, South Asia and Pacific, Latin America, Middle East and Africa, Eastern Europe
Countries Covered
United States, Canada, Mexico, Brazil, Argentina, Chile, United Kingdom, Germany, Switzerland, France, Netherlands, Denmark, Sweden, Belgium, Ireland, Italy, Spain, Poland, Czechia, Hungary, Japan, China, South Korea, Singapore, Taiwan, India, Australia, New Zealand, United Arab Emirates, Saudi Arabia, Israel, South Africa
Key Companies Profiled
Benchling, Dotmatics, LabWare, Revvity Signals, Sapio Sciences, Thermo Fisher Scientific, LabArchives, SciNote, Labguru, eLabNext, Scilligence, Bruker, STARLIMS, LabVantage, IDBS, CDD Vault, Colabra, Rspace, Uncountable, Genemod
Quantitative Methodology
Primary survey, n=3,800 respondents, Q4 2025, six countries; demand-side model with trade association cross-validation
Qualitative Methodology
47 expert interviews, Q4 2025; applied to validate demand model assumptions, identify emerging dynamics, and assess competitive positioning
Report Format
PDF and XLSX data workbook (Word format preview document)
Publisher
Market Minds Advisory
Report Code
MMA-2026-HLT-091
Published
September 2026
Contact
sales@marketmindsadvisory.com | www.marketmindsadvisory.com

Purchase the full Demand for Cloud ELN Service in USA Report (2026 to 2036).

The full MMA report separates deployment from adoption, and quantifies what usage measurement will do to renewal conversations vendors have not yet had. It sizes the market to 2036 across six laboratory types, seven regions and 32 countries, with segment growth rates and regional demand mechanisms detailed. Competitive analysis covers 20 vendors assessed on measured subscription and service revenue, with moat and risk assessment for the two leaders. The report quantifies configuration cost structure, self-service acquisition economics and margin architecture across three portfolio tiers. It closes with four verdicts and an anonymised pharmaceutical research engagement.
Six laboratory types sized through 2036
Seven regions with demand mechanism analysis
Twenty vendors on consistent revenue basis
Usage, configuration and instrument integration benchmarks
Margin architecture across three portfolio tiers
Anonymised notebook renewal and usage review engagement

Built For The People Who Decide

From boardroom strategy to bench-side execution, this report is read cover-to-cover by leaders shaping the next decade of their industry, turning demand scenarios, market dynamics and valuation benchmarks into decisions.
CXOs/ Presidents/ VPs/ Managers
M&A and Corporate Development
Strategy Teams and R&D Heads
Procurement and Product Directors
Regulatory and Compliance Leaders
Investor Relations and Equity Analysts