Market Minds Advisory
Demand for Caffeinated Beverage in USA

Demand for Caffeinated Beverage in USA: Demand for Caffeinated Beverage in USA. Zero-Sugar Formats, Aluminium Costs, and Channel Reach Shape Category Value.

Caffeinated drinks take cooler space from soda in the United States, but aluminium costs, youth marketing scrutiny, and zero-sugar competition decide which brands turn a habit into margin as energy, coffee, and sparkling caffeine converge.

Lead Analyst

Published

September 2026

Make Smarter Decisions with Customized Research Insights

Request a free sample report and evaluate market opportunities, growth trends, and competitive dynamics relevant to your business needs.

2025 MARKET VALUE$44.0BMarket Size 2025
2036 FORECAST VALUE$90.7BBase Case , 2026 to 2036
CAGR 2026 TO 20366.8 %Bull 8.1% / Bear 5.5%
INCREMENTAL OPPORTUNITY$43.7BNet 10- year value creation
EXPANSION MULTIPLE1.93x2036 value over 2026 base
Strategic Levers
M&A Pipeline
Regional Outlook
Country Rankings
Competitive Intelligence
Segmental Deep-dive
Call-Us : 91 93563 13602

Executive Snapshot and Market Trajectory.

Caffeine is the one ingredient Americans still add to a drink without needing an explanation. What has changed is the wrapper: sugar-free cans, cold coffee, and sparkling caffeine now sit beside the classic energy drink, and buyers now move between them easily by mood, price, and shelf.
Sugar-free fitness energy drinks grow fastest, since younger buyers want zero-sugar cans with clean-label claims and gym credibility rather than a hard-edged energy image. North America holds nearly all the value, because this is a United States demand file and other regions buy only exported brands and travel purchases. Convenience stores and club chains set reach. Formulation sets loyalty. Price per can sets trial. Aluminium sets margin.
Competition is concentrated, with one specialist energy leader, an Austrian brand owner, two global beverage groups, and a fast-growing fitness brand competing alongside a long tail of regional labels on flavour rotation, cooler space, and price per can. Aluminium tariffs, caffeine and coffee bean costs, and state proposals on sales to minors shape margins, while retailers demand more promotions and shelf resets. Big groups own distribution. Specialists own flavours. Retailers own cooler doors.
Market Definition
Demand for caffeinated beverages in the USA covers ready-to-drink non-alcoholic beverages sold to United States consumers with added or natural caffeine as a defining functional ingredient, including energy drinks, ready-to-drink coffee, caffeinated sparkling drinks, and caffeinated tea. The scope excludes regular cola and soft drinks sold mainly on flavour, coffee and tea sold as hot beverages or grounds, and supplements.
Base Year Value
$44.0B in 2025 (MMA Primary Research Dataset, September 2026)
Forecast Period
2026 to 2036, eleven discrete annual values
CAGR
6.8% base case. Bull 8.1%. Bear 5.5%.
Fastest Growth Segment
Sugar-Free Fitness Energy Drinks: 9.6% CAGR
Fastest Growth Country
United States: 6.7% CAGR
Fastest Growth Region
South Asia and Pacific: 8.8% CAGR
Largest Region
North America: 88% of 2025 global value
Market Leaders
Monster Beverage, Red Bull, PepsiCo, Coca-Cola, Celsius Holdings. Source: MMA Analysis, company annual reports.
Primary Survey
n=3,800 procurement and R&D decision-makers, Q4 2025, six countries
Methodology
Demand-side build-up, cross-validated against public data, 47 expert interviews

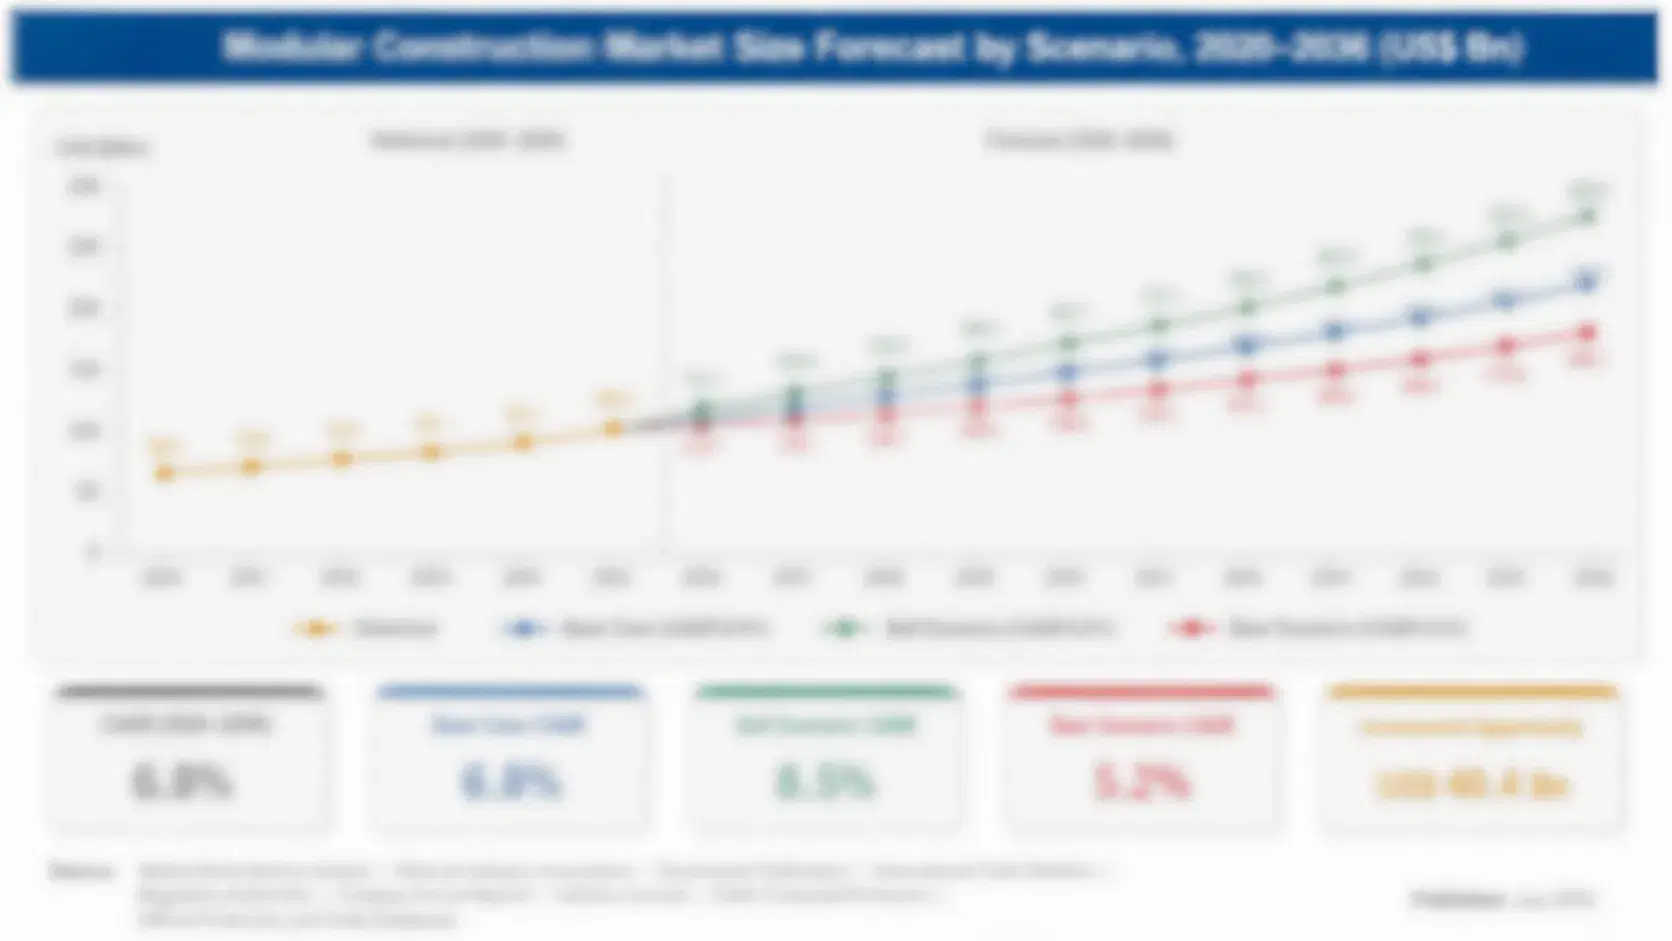
Demand for Caffeinated Beverage in USA Market Forecast Scenarios

united-states-caffeinated-beverage-market-size-forecast-scenario-1789805592025
From 2020 to 2025, caffeinated beverages in the United States grew as energy drinks took cooler space from soda, ready-to-drink coffee scaled beyond convenience stores, and zero-sugar brands attracted younger buyers. Aluminium and freight costs spiked in 2021 and 2022, and brands raised prices in small steps. Growth ran a little below the forecast pace as promotions rose, and price rises supplied part of the value gain.
The base case rests on three commercial mechanisms. First, zero-sugar and fitness-positioned cans keep pulling buyers from soda and traditional energy drinks. Second, ready-to-drink coffee and sparkling caffeine widen occasions from mornings and gyms to afternoons and social settings. Third, club, grocery, and online channels lift volume beyond convenience stores. Each mechanism compounds slowly, and none needs a breakout year. Brands plan flavour rotation, can supply, and channel programmes around all three.
The bull case needs stable aluminium costs and steady growth among buyers under 30, which would lift premium volumes and let brands raise prices. The bear case is new state limits on sales to minors combined with a caffeine health scare, which would squeeze volumes, delay launches, and push buyers back to soda and water. Buyers reward consistency over novelty.

Zero-Sugar Formulation, Can Costs, and Cooler Space Decide Caffeine Winners

Caffeinated beverages span several production models. Brands blend water, sweeteners or zero-calorie alternatives, caffeine from synthetic, coffee, tea, or guarana sources, vitamins, and flavours, then fill aluminium cans through owned plants or contract packers. Coffee drinks add brewed extract and dairy or plant milk, while sparkling caffeine adds carbonation and fruit flavour, and each format follows Food and Drug Administration labelling and caffeine guidance.
MARKET CONCENTRATION68% CR5Leading five groups hold a large combined share
AVERAGE CAN PRICE$2.9Typical shelf price for a sixteen ounce single can
CONVENIENCE CHANNEL SHARE34%Portion of volume sold through convenience and gas stations
CAN PACKAGING COST SHARE26%Portion of goods cost taken by aluminium cans and cartons
TYPICAL CAFFEINE DOSE160 mgCommon caffeine content in a single standard energy drink can
PRODUCT LAUNCH CYCLE14 monthsTypical time from concept to national retail launch
Formulation, can cost, and cooler space decide value. Buyers judge caffeinated drinks by flavour, sugar content, caffeine dose, and price per can, so a brand needs constant flavour rotation and a supply chain that survives aluminium swings. Large groups own distribution and cooler placement, while specialist brands win on flavour and community. Brands with contracted can supply, reliable flavour pipelines, and retailer support win because shelf space is scarce and
Buyers judge caffeinated drinks on flavour, sugar content, caffeine dose, price per can, and where they can buy. Convenience store and gas station shoppers want a familiar can they can grab fast, while club and grocery shoppers buy multipacks and compare price. Price sensitivity is moderate, since buyers compare with coffee and soda, which pushes brands toward multipacks, limited flavours, and loyalty offers.
"Caffeinated drinks are sold as function and bought as habit, and the brands that forget the habit lose to whoever holds the cooler door. Zero sugar has become table stakes, so flavour rotation and can supply are where the next margin gap opens. Nobody wins on caffeine alone."
Senior Analyst, Beverages and Functional Foods Practice · MMA Caffeinated Ready-to-Drink Beverages in the United States Practice · September 2026

Market Trends

Zero-Sugar Fitness Energy Drinks Take Share From Traditional Cans

Brands now sell zero-sugar energy drinks with vitamins, amino acids, and natural caffeine in clean-label cans, positioned for gym users, young professionals, and women who avoid the hard edge of traditional energy drinks. These cans price 10% to 25% above traditional energy drinks and sell strongly through club, grocery, and online channels. Flavour rotation, social media communities, and celebrity partnerships drive trial, and repeat rates are high when taste holds. The trend pulls volume from soda and sugar-based energy drinks and rewards brands with fast flavour pipelines and strong distribution partners. Cooler space decides renewal.
Market Impact: convenience stores carry 34% of volume
Ready-to-Drink Coffee and Sparkling Caffeine Widen Consumption Occasions

Ready-to-drink cold brew, canned lattes, and sparkling caffeine drinks move caffeine beyond mornings and gym sessions into afternoons, commutes, and social occasions. Coffee brands use dairy-free milks, protein, and oat bases, while sparkling caffeine brands use natural caffeine from green tea and yerba mate to signal a gentler lift. Single cans price within $1 of café drinks, and multipacks in club and grocery stores lower cost per serving. The trend widens the buyer base beyond energy drink users and pulls volume from café visits and soda. Supply reliability decides brand rankings. Margins follow sourcing discipline.
Market Impact: buyers aged 18-34 drive 45%

Market Opportunities and Growth Drivers

Convenience, Club, and Grocery Distribution Expand Cooler Reach

The United States has about 150,000 convenience stores, and club chains and grocery retailers have added dedicated caffeinated drink sections and larger multipack displays. Convenience stores account for about 34% of volume, and club and grocery channels are growing faster as buyers seek value. Retailers rotate ranges and reward brands that offer reliable supply and steady sell-through, and national groups control the routes to cooler doors. Small brands rely on regional distributors and online channels to reach buyers who do not shop convenience stores, and direct-to-consumer subscriptions add repeat volume. Retail buyers review ranges every season.
Market Impact: tariffs add 10-20% to can cost

Younger Buyers and Women Adopt Functional Caffeine for Daily Routine

Buyers between 18 and 34, and women in particular, adopt caffeinated drinks for work, study, exercise, and social occasions, and many replace soda or café drinks with a cold can. Zero-sugar formulas, natural caffeine, and fitness branding lower the barrier to entry for buyers who avoided traditional energy drinks. Social media communities and flavour launches sustain interest, and repeat purchase is frequent. Brands that publish caffeine content, use clear labelling, and offer smaller cans win trust with cautious buyers, and buyer base growth continues even as soda volume declines. Trial data protects future sales.
Market Impact: 11 states weigh youth sales limits

Market Restraints and Challenges

Aluminium and Coffee Costs Squeeze Margins Across Brands

Aluminium cans and packaging take about 26% of cost of goods, and tariffs and premium swings can add 10% to 20% to can cost within a year. Coffee beans and extracts add a further 12%, and arabica prices have hit record highs. The root cause is concentrated aluminium supply, tariff policy, and weather shocks in coffee origins. Brands passed on part of the increase through pack-price rises, but retailers resist further increases. Mitigation includes multi-year can contracts, lighter cans, co-packing capacity, and blended coffee sourcing, though these steps trim margins. Cost control separates leaders from followers.
Market Impact: zero-sugar cans price 10-25% higher

State Scrutiny of Youth Energy Drink Sales Raises Compliance Risk

Several states have proposed limits on energy drink sales to minors, and the Food and Drug Administration guides adults toward no more than 400 milligrams of caffeine a day, so brands with high-caffeine cans face labelling and marketing scrutiny. The root cause is health concern over caffeine and sugar in adolescents and litigation over adverse events. A single state law can force channel and packaging changes within a legislative session. Brands respond with caffeine caps, clear labels, and youth marketing limits, though these steps slow launches and raise legal costs. Clear labelling builds buyer trust.
Market Impact: cold coffee grows 7%+ yearly
3 additional market trends, 2 additional growth drivers, and 4 additional restraints and challenges are covered in the full report. Contact sales@marketmindsadvisory.com to access the complete intelligence.

Segment CAGR and Growth Architecture

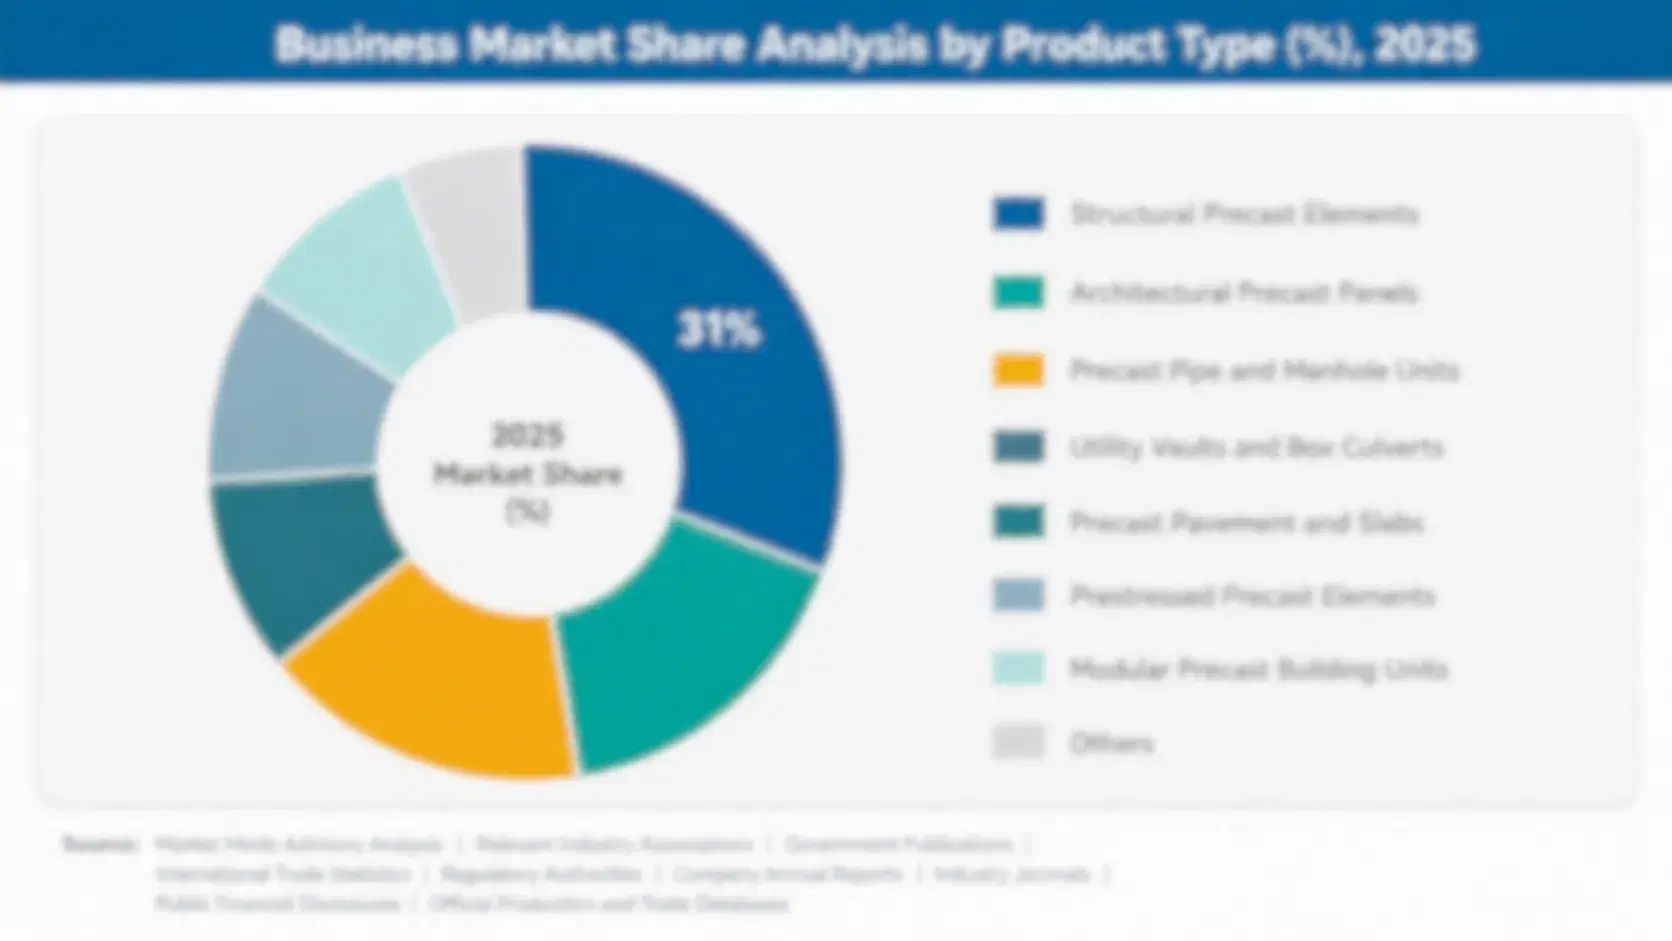
Caffeinated beverages in the United States are segmented by product positioning, which shows where formulation, volume growth, and pricing power sit. Five segments cover traditional energy drinks, sugar-free fitness energy drinks, ready-to-drink coffee and cold brew, caffeinated sparkling waters and sodas, and caffeinated tea. Two segments grow fastest on zero-sugar demand. Small brands feel every can price swing.
united-states-caffeinated-beverage-market-market-share-analysis-1789805592339

Sugar-Free Fitness Energy Drinks

Sugar-Free Fitness Energy Drinks is the fastest-growing segment at 9.6% a year, about 1.41 times the overall market rate. Brands use zero-sugar formulas, vitamins, amino acids, and natural caffeine to attract gym users, young professionals, and women who avoid traditional energy cans. Cans price 10% to 25% above traditional energy drinks and sell through club, grocery, convenience, and online channels. Flavour rotation and cooler space are the main constraints, since retailers reset ranges often and imitators copy formats. Large groups with distribution win, while fitness brands with strong communities and fast flavour pipelines hold price better than followers that rely on promotions. Distribution reach compounds over time. Buyers reward consistency over novelty.
CAGR 9.6%

Caffeinated Sparkling Waters and Sodas

Caffeinated Sparkling Waters and Sodas grow at 8.4% a year, because buyers replace regular soda with a lighter can that carries natural caffeine from green tea or yerba mate and fruit flavour with zero sugar. Brands price cans 5% to 15% above regular soda and sell through grocery, convenience, and online channels. Retailer scrutiny and sameness are the main constraints, since dozens of brands launch similar flavours and margins compress as volume rises. Producers respond with distinctive taste, clean labels, and national distribution partners. Brands with strong flavour pipelines and repeat buyers hold price better than start-ups that rely on novelty and promotions. Cooler space decides renewal. Supply reliability decides brand rankings.
CAGR 8.4%
Full segment breakdown across 5 segments available in the complete report.

Regional Architecture and Country Demand Map

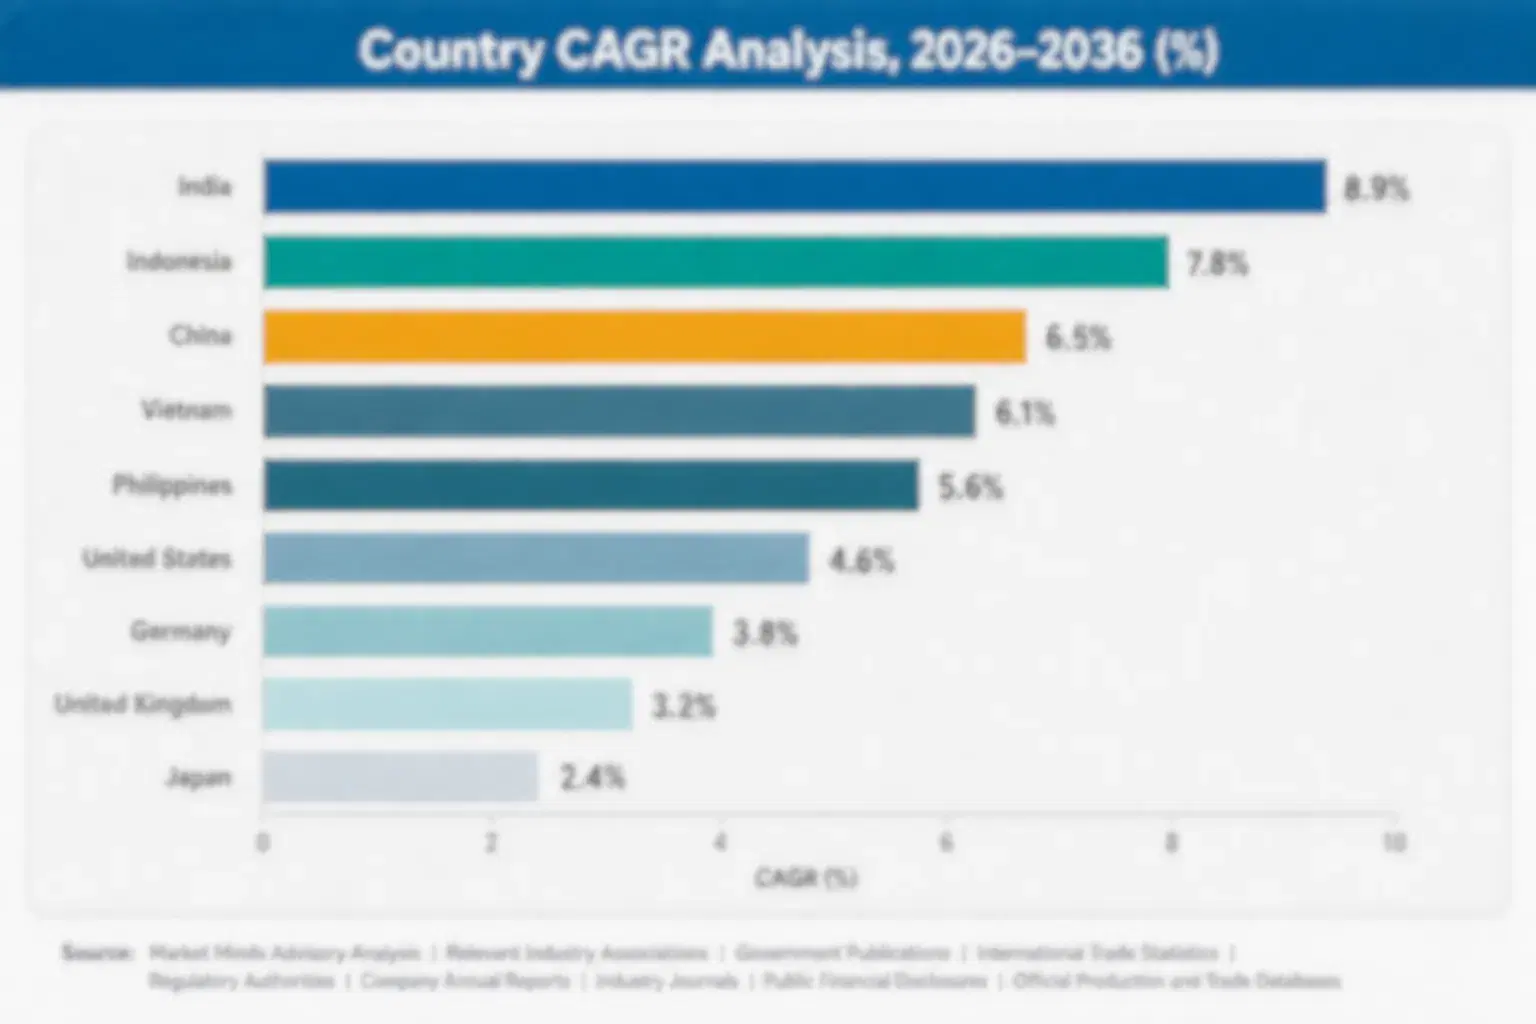
Caffeinated beverage demand in the United States concentrates almost entirely in North America. South Asia and Pacific and Western Europe hold small export shares, and all other regions carry minor volume linked to American brand exports and travel purchases. Margins follow sourcing discipline. Retail buyers review ranges every season.

North America

North America holds 88% share, far above its usual band, because this file measures demand for caffeinated beverages in the United States, and American consumers account for nearly all category value. Convenience stores, gas stations, club chains, grocery retailers, and online platforms carry the range, while Canada and Mexico add small cross-border volume. Monster Beverage, Red Bull, PepsiCo, Coca-Cola, and Celsius Holdings lead. Growth tracks the global rate as zero-sugar and coffee formats offset slower growth in traditional energy drinks. Aluminium tariffs, state scrutiny, and heavy promotion restrain margins. Trial data protects future sales. Cost control separates leaders from followers. Clear labelling builds buyer trust. Small brands feel every can price swing.
Share: 88% | CAGR: 6.7% (2026 to 2036)

South Asia and Pacific

South Asia and Pacific holds 3% share, far below its usual band, because this file measures United States demand, and regional value reflects only exports of American brands and purchases by American travellers and military personnel in Japan, South Korea, Australia, and the Philippines. Growth exceeds the global rate as American brands expand export listings and duty-free channels. Export logistics, tariffs, and local competition from Asian energy drink brands restrain margins, and small volumes leave a handful of distributors in control of which flavours reach shelf. Distribution reach compounds over time. Buyers reward consistency over novelty. Cooler space decides renewal. Supply reliability decides brand rankings. Margins follow sourcing discipline. Retail buyers review ranges every season.
Share: 3% | CAGR: 8.8% (2026 to 2036)
Regional intelligence for 5 additional markets available in the complete report: Western Europe, East Asia, Latin America, Middle East and Africa, Eastern Europe. Contact sales@marketmindsadvisory.com.
united-states-caffeinated-beverage-market-country-cagr-analysis-1789805592616

Four Margin Routes for Caffeinated Drink Brands

Margin in caffeinated beverages comes from zero-sugar premiums, can cost control, channel breadth, and regulatory readiness rather than volume alone. The routes below apply to national groups, specialist energy brands, and fast-growing fitness labels, and each can start inside one planning cycle, with clear measures in gross margin points, cooler doors won, and sell-through by channel.

Building Zero-Sugar Fitness Lines With Fast Flavour Rotation

Zero-sugar fitness cans price 10% to 25% above traditional energy drinks, and brands that launch four flavours a year with clean-label claims report gross margin gains of 5 to 8 points on those lines. Producers that build gym, club, and social media communities avoid the promotions that hit traditional cans. Younger buyers and women add volume. Pilot launches in two regions and one club chain typically confirm demand within one quarter, before national listings and multipack releases follow. Small brands feel every can price swing. Distribution reach compounds over time. Buyers reward consistency over novelty.
Market Impact: zero-sugar lines lift gross margin by 5-8 points

Securing Multi-Year Can Contracts and Lighter Packaging

Aluminium cans and packaging take about 26% of cost of goods, and tariffs and premium swings can add 10% to 20% to can cost within a year, so brands that sign multi-year contracts with two suppliers and adopt lighter cans cut cost volatility by roughly half. Suppliers accept longer terms for volume commitments. Retailers accept price rises slowly, so contracts matter more than list price increases. Brands that skip planning absorb 12% more cost in volatile years and lose margin to rivals. Cooler space decides renewal. Supply reliability decides brand rankings. Margins follow sourcing discipline.
Market Impact: can contracts and lighter cans cut cost volatility 50%

Expanding Into Club, Grocery, and Online Channels Beyond Convenience

Convenience stores carry 34% of volume, and club, grocery, and online channels are growing faster as buyers seek value and multipacks, so brands that add multipacks and dedicated club programmes lift volume by 15% to 25% within a year. Retail buyers reward reliable supply and steady sell-through, and subscription programmes add repeat purchase. Small brands can start with two regional distributors and one online platform. Contracts should fix listing periods, promotion funding, and return terms, and brands should review sell-through weekly. Retail buyers review ranges every season. Trial data protects future sales.
Market Impact: club and online channels add 15-25% volume within one year

Building Youth Marketing Safeguards and Transparent Caffeine Labelling

Several states weigh limits on sales to minors, and a single law can force packaging and channel changes within one session, so brands that cap caffeine per serving, label clearly, and avoid youth-targeted marketing cut regulatory risk. Compliance adds 2% to 4% to fixed cost but protects retailer listings worth 30% of volume. Small brands can share legal support through trade associations. Brands should review state proposals each quarter and prepare packaging changes months ahead of effective dates. Cost control separates leaders from followers. Clear labelling builds buyer trust. Small brands feel every can price swing.
Market Impact: compliance protects retailer listings worth 30% of volume

Who Controls the Margin Pool

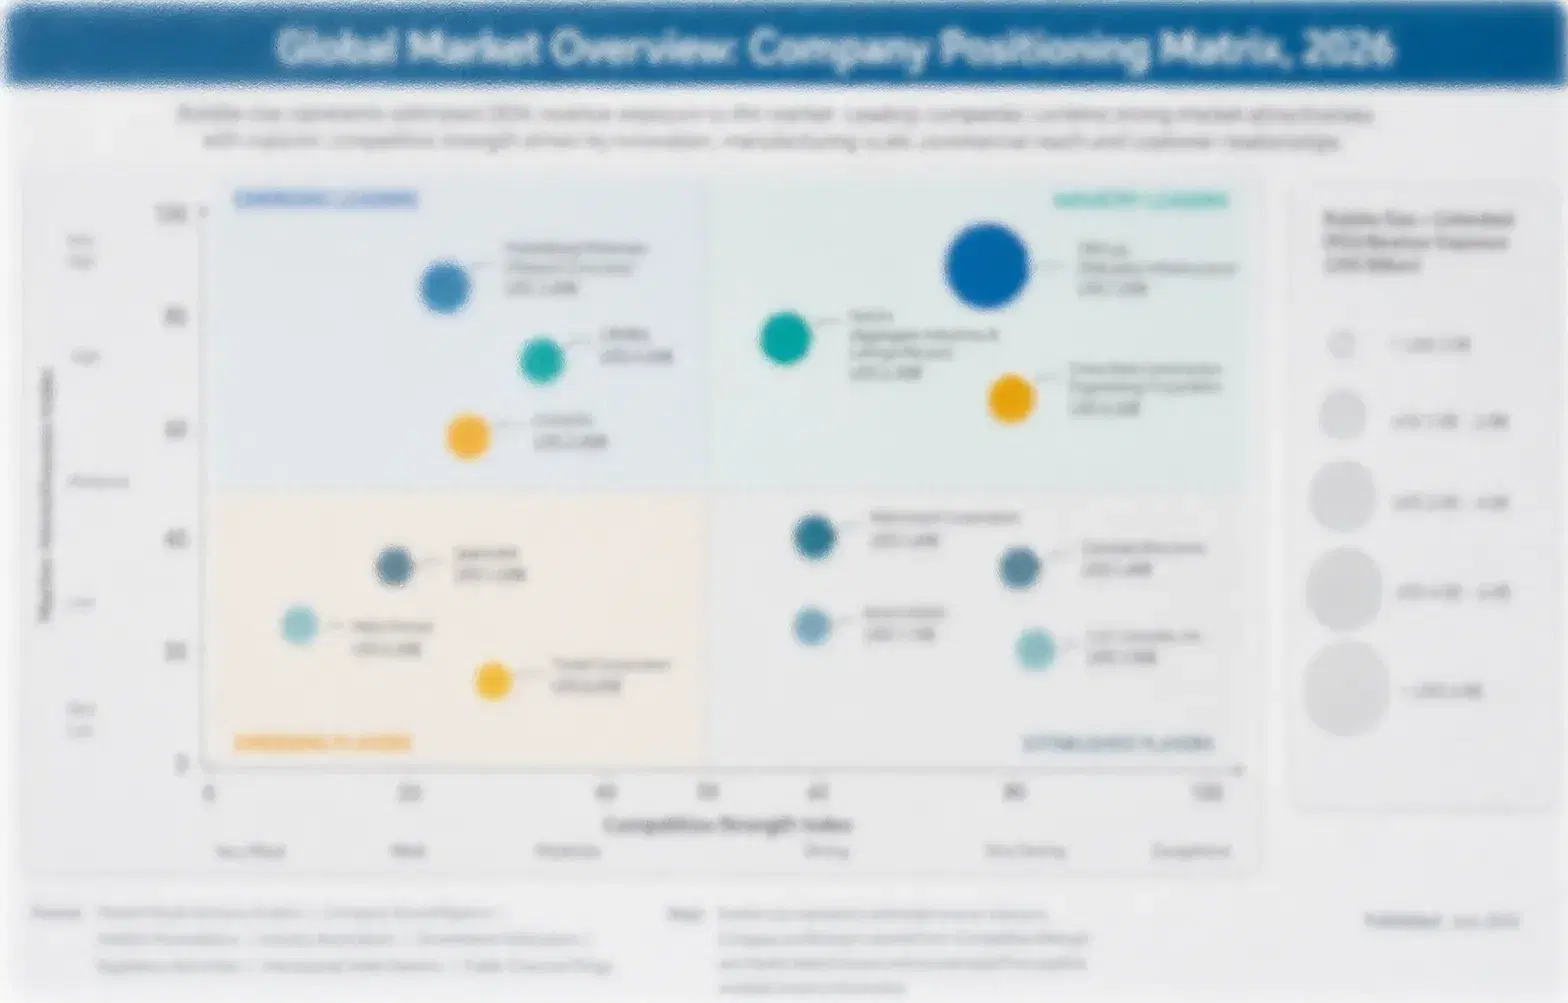
The caffeinated beverage category is concentrated, with a CR5 of 68%, and a long tail of regional labels, fitness brands, and private label suppliers sit outside the leading five. This assessment measures participants on estimated caffeinated beverage sales value in the United States, held constant across all players. Monster Beverage leads through energy drink scale and distribution, while Red Bull, PepsiCo, Coca-Cola, and Celsius Holdings follow.
Competition runs on four dimensions today: flavour rotation and formulation, cooler placement, can cost and supply, and channel reach. Large groups win on distribution, packaging scale, and retailer relationships, while specialist brands win on flavour and community. Imitators copy popular flavours and zero-sugar formats quickly, so premiums outside distinctive taste erode within a season, and price competition appears in convenience store and club promotions. Distribution reach compounds over time.

Emerging pressure comes from ready-to-drink coffee, sparkling caffeine, and functional soda brands that compete for the same afternoon and gym occasions. Rankings shift where a brand secures distribution through a beverage giant, wins a club exclusive, or launches a standout zero-sugar flavour. Regional and fitness brands can move up quickly, since flavour and community matter more than national
united-states-caffeinated-beverage-market-company-positioning-matrix-1789805592921

Competitive Moat and Risk Dimensions

MONSTER BEVERAGE

Moat: Energy Scale and Distribution Alliances

Monster Beverage sells energy drinks across more than 150 countries and uses a distribution alliance with a global soft drink group to reach convenience stores, grocery, and club channels. Its flavour pipeline, marketing scale, and co-packing network lower cost per can, and its long relationships with retail buyers give it cooler placement that smaller brands struggle to secure.
MONSTER BEVERAGE

Risk: Category Concentration and Cost Exposure

Monster depends heavily on energy drinks, so state scrutiny, health concerns, and zero-sugar competition hit results directly. Aluminium tariffs and sugar or sweetener costs squeeze margins, and fitness-positioned brands with strong communities attract younger buyers, while its reliance on distribution partners limits control over retail execution. Buyers reward consistency over novelty.
RED BULL

Moat: Global Brand and Premium Pricing

Red Bull sells one core product with strong global brand recognition, sponsorship of sport and events, and premium pricing across convenience stores, grocery, and hospitality. Its single-formula focus gives it manufacturing simplicity, and its marketing keeps it among the most recognised energy brands, which supports pricing power against cheaper rivals.
RED BULL

Risk: Narrow Range and Sugar-Free Gap

Red Bull depends on a narrow range where zero-sugar and fitness-positioned rivals launch flavours quickly and attract younger buyers. Its premium pricing exposes it to trade-down when consumers seek value, and aluminium tariffs and freight costs squeeze margins, while limited flavour rotation leaves room for competitors to take cooler space.

Players Tracked

Prominent Players

Monster Beverage
Red Bull
PepsiCo
Coca-Cola
Celsius Holdings

Other Key Players

Keurig Dr Pepper
Nestlé
Starbucks
Suntory Beverage and Food
Ito En
Arizona Beverages
Nutrabolt
Guayaki
Zevia
Chameleon Cold-Brew
Califia Farms
La Colombe
Talking Rain Beverage
Yerbaé Brands
Vitamin Well

Recent Developments

JANUARY 2026

Monster Beverage Launches Zero-Sugar Fitness Energy Line in Club Channels

Monster Beverage launched a zero-sugar fitness-positioned energy line in club channels, aiming to reach younger buyers and women who avoid traditional cans. It is a product launch, and it tests whether an established energy leader can win share in the fastest-growing segment. Sales volumes were not disclosed.
Signal: Confirms that leading energy brands now compete directly in zero-sugar fitness cans where growth and margins are highest.
FEBRUARY 2026

PepsiCo Expands Canning Capacity for Energy and Sparkling Caffeine Brands

PepsiCo announced organic expansion of canning capacity in the United States for energy and sparkling caffeine brands, to reduce reliance on co-packers. It is a capacity expansion, not an acquisition, and it tests whether large groups can improve can cost and supply reliability. Investment figures were not disclosed.
Signal: Indicates large beverage groups are investing in owned can capacity to protect supply and margin as caffeinated volume grows.
MARCH 2026

Celsius Holdings Signs Expanded Distribution Agreement for Grocery and Club Channels

Celsius Holdings signed an expanded distribution agreement to widen coverage in grocery and club channels beyond convenience stores. It is a distribution agreement, not an acquisition or merger, and it tests whether fitness-positioned brands can keep growth as they scale. Contract terms were not disclosed. Cooler space decides renewal.
Signal: Shows fitness-positioned brands rely on large distribution partners to widen cooler reach beyond specialty and convenience stores.

What Drives Caffeinated Drink Production Costs

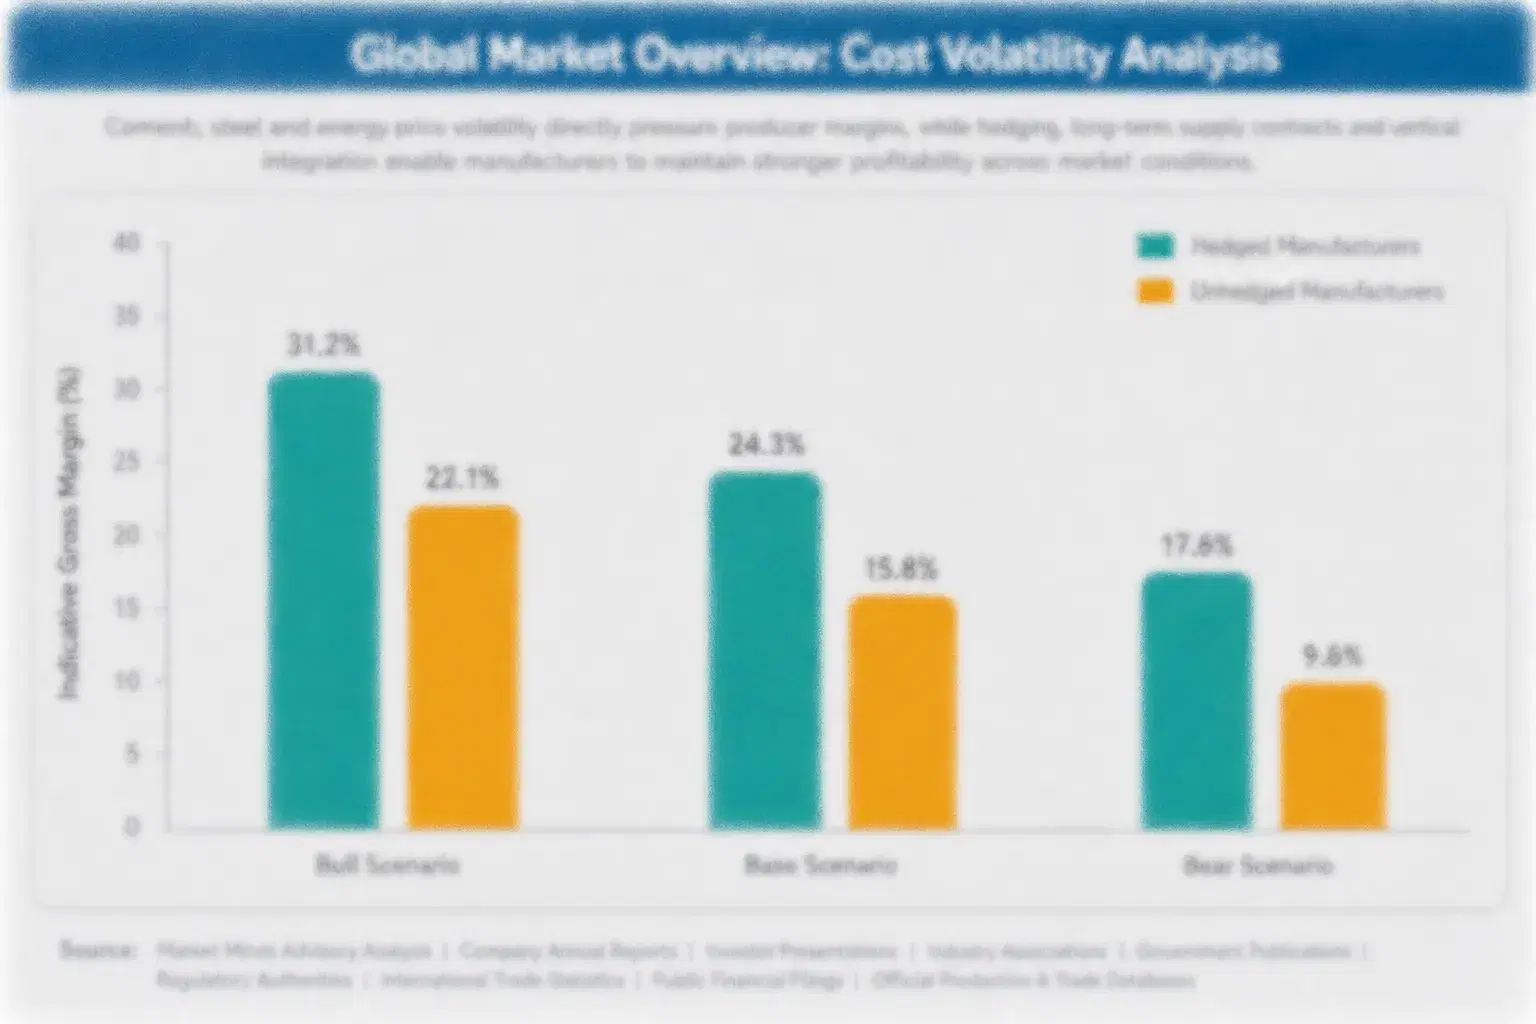
Aluminium cans and cartons account for roughly 26% of cost of goods, freight and logistics about 16%, coffee and tea extracts about 12%, caffeine and functional ingredients about 10%, sweeteners about 10%, labour and energy about 10%, and flavours plus co-packing and quality assurance about 16%. Aluminium comes from Canada, the United States, and imports, caffeine largely from Chinese synthesis, and coffee from Brazil, Colombia.
The clearest recent shock came from aluminium and coffee. Ball Corporation reported in its annual documents that aluminium premiums and tariffs raised can costs in 2025, while the United States Department of Agriculture Foreign Agricultural Service reported record arabica prices after weather losses in Brazil. Brands raised pack prices by 4% to 8%, cut promotions, and shifted volume to multipacks, which squeezed gross margin by several points as freight cost stayed high.

The competitive disadvantage falls on small brands, which buy cans and caffeine in small lots at spot prices and cannot spread costs across large portfolios. National groups own canning plants, sign long can contracts, and spread costs across many drink lines. Exposure also varies by channel, since convenience suppliers face promotion costs while club suppliers face price pressure and freight cost.
united-states-caffeinated-beverage-market-cost-volatility-analysis-1789805593240

Signing Multi-Year Can and Ingredient Supply Contracts

Brands sign multi-year can contracts with two suppliers and forward contracts for coffee extract and caffeine, consolidate orders across products, and dual-source packaging. Forward contracts cut cost swings by roughly half, though they need volume commitments and working capital that only larger brands usually provide. Terms often run two years, delivery reliability matters, and buyers should approve early.

Adopting Lighter Cans and Recycled Aluminium

Brands adopt lighter aluminium cans and recycled content to cut metal use and cost, and work with can makers on smaller diameters. Lighter cans reduce metal cost by 5% to 10% and improve freight efficiency. The main risk is line compatibility, so brands run trials with co-packers, while larger groups adopt first and small brands share supplier programmes.

Using Co-Packers to Avoid Capital Costs

Small brands use co-packers and contract fillers rather than building plants, avoiding capital costs of $1 million or more. Contract services add cost per can but lower risk and handle seasonal peaks around summer. The main challenge is scheduling, since slots fill early, so brands book capacity months ahead and agree penalties for late delivery and quality failures.

Portfolio Architecture for Margin Defence

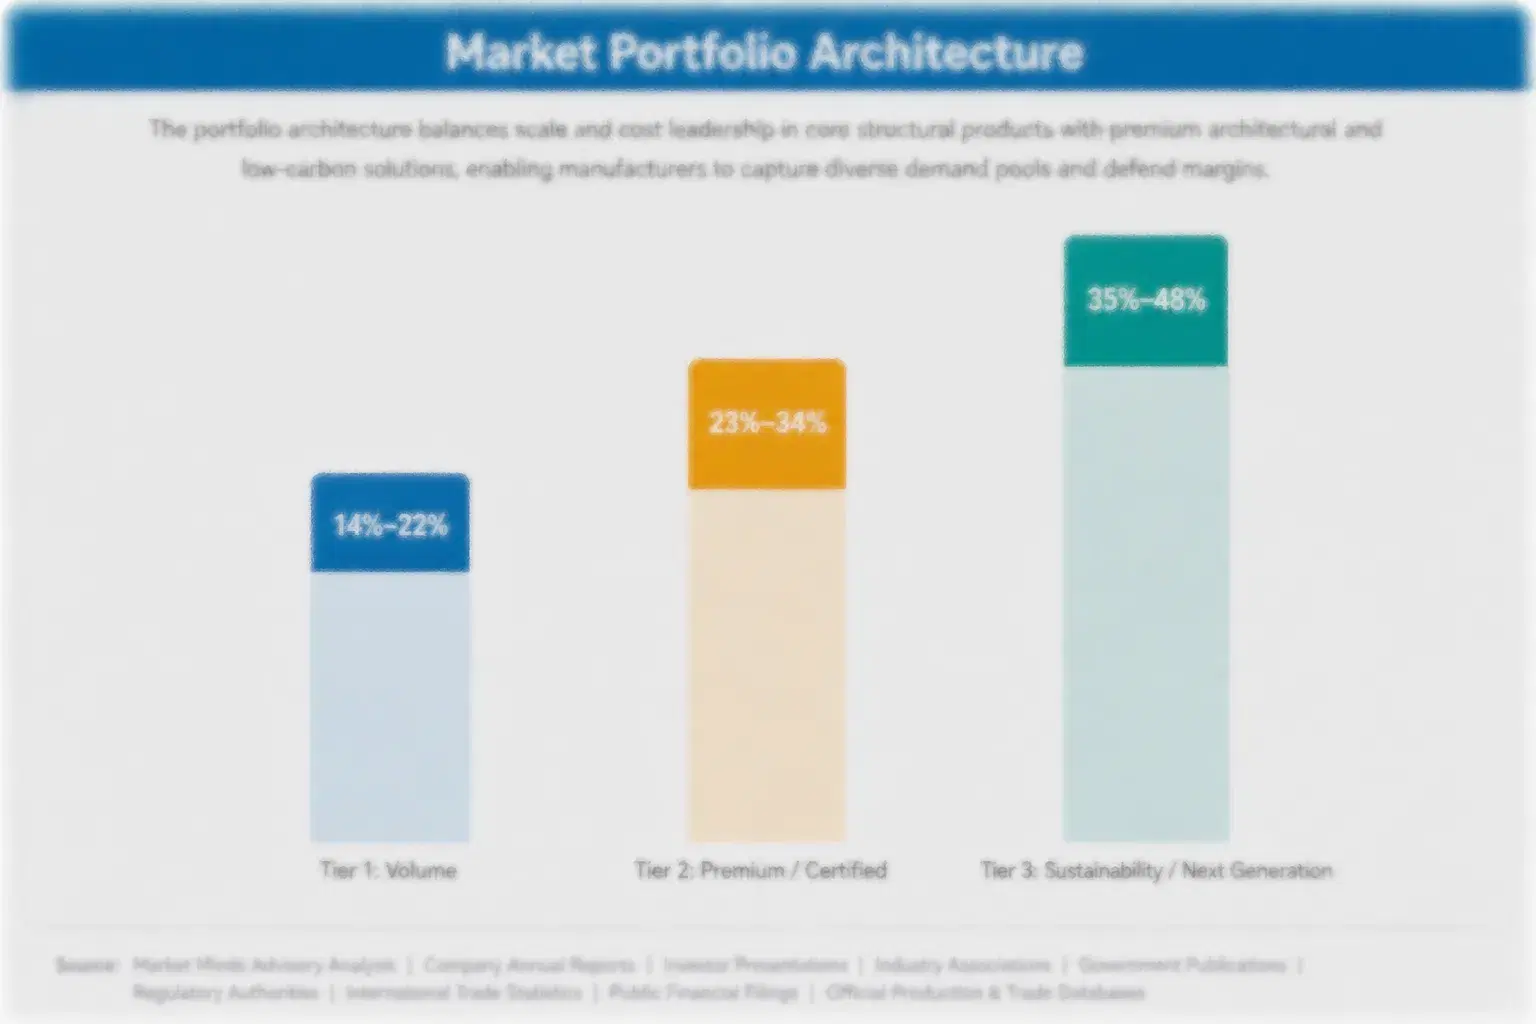
Margins run from thin returns on private label and value energy cans sold in multipacks to retailers and clubs to strong returns on zero-sugar fitness cans, cold brew, and sparkling caffeine sold through convenience stores, grocery, and online channels. Three tiers separate volume products, certified premium lines, and next-generation formats, and each tier draws on different buyer groups, formulations, and channel terms.
The tension between volume and premium is sharp. Volume lines protect can capacity and retailer relationships but face constant price pressure from private label and promotions, while premium lines earn higher margins on smaller volumes and depend on flavour pipelines, communities, and cooler placement. Brands that run only volume struggle to fund innovation, while brands that run only premium lack the scale to hold distribution and absorb aluminium shocks. Supply reliability decides brand rankings.

High-value pools concentrate in zero-sugar fitness cans and premium cold brew sold through club, grocery, and online channels. They gather where buyers pay for flavour, clean labels, and occasion fit rather than volume. Gym operators, corporate offices, and subscription programmes add further value, since these buyers ask for reliable supply and consistent flavour, and they reorder without shopping on price.

Volume / Commodity-Adjacent Tier

Traditional sugar-based energy cans and private label drinks sold in multipacks to convenience stores, clubs, and grocery retailers, with thin margins, aluminium and sweetener cost exposure, and constant price competition, where buyers switch on price and promotion.
Gross Margin: 26%-38%

Premium / Certified Tier

Zero-sugar fitness energy and premium cold brew cans with clean-label claims, natural caffeine, and distinctive flavours, sold through convenience stores, grocery, and club channels that require reliable supply, clear labelling, and stable pricing across seasons.
Gross Margin: 42%-56%

Sustainability / Regulatory / Next-Generation Tier

Natural caffeine sparkling drinks, functional coffee blends, and lighter recycled-aluminium cans built on clean labels and clear sourcing, sold through premium retail, online platforms, and gyms to buyers who pay premiums for lighter formats and stronger sustainability signals.
Gross Margin: 44%-58%
united-states-caffeinated-beverage-market-portfolio-architecture-1789805593566

High-value Sub-segments and Strategic Watch-out

Sugar-Free Fitness Energy Drinks

Sugar-free fitness energy drinks combine the fastest growth with strong pricing, since younger buyers and women want zero-sugar cans with clean-label claims and pay 10% to 25% premiums. Flavour pipelines and community strength limit competition, and brands with club and grocery reach win cooler space. Volume compounds as gyms
Gross Margin: 42%-56%

Caffeinated Sparkling Waters and Sodas

Caffeinated sparkling waters and sodas deliver solid growth and healthy pricing, since buyers replace regular soda with a lighter can and pay 5% to 15% premiums for natural caffeine and zero sugar. Flavour distinctiveness forms the entry barrier, and brands with grocery and online reach win shelf space.
Gross Margin: 36%-50%

RTD Coffee and Cold Brew

Ready-to-drink coffee and cold brew form the volume core, sold through convenience stores, grocery, and club channels at moderate margins. Growth is steady, at about 6.9% a year, as buyers replace café trips with a cold can. Coffee cost, retailer negotiation, and brand loyalty decide profit.
Gross Margin: 30%-44%

Traditional Energy Drinks

Traditional energy drinks are the strategic watch-out, since sugar concerns, state scrutiny, and zero-sugar competition keep growth near 5.4% a year and margins under pressure. Brands should test zero-sugar reformulations and smaller cans before scaling, because retailer delisting and youth marketing scrutiny can erode margin quickly.
Gross Margin: 28%-42%

Why Americans Keep Reaching for Caffeine

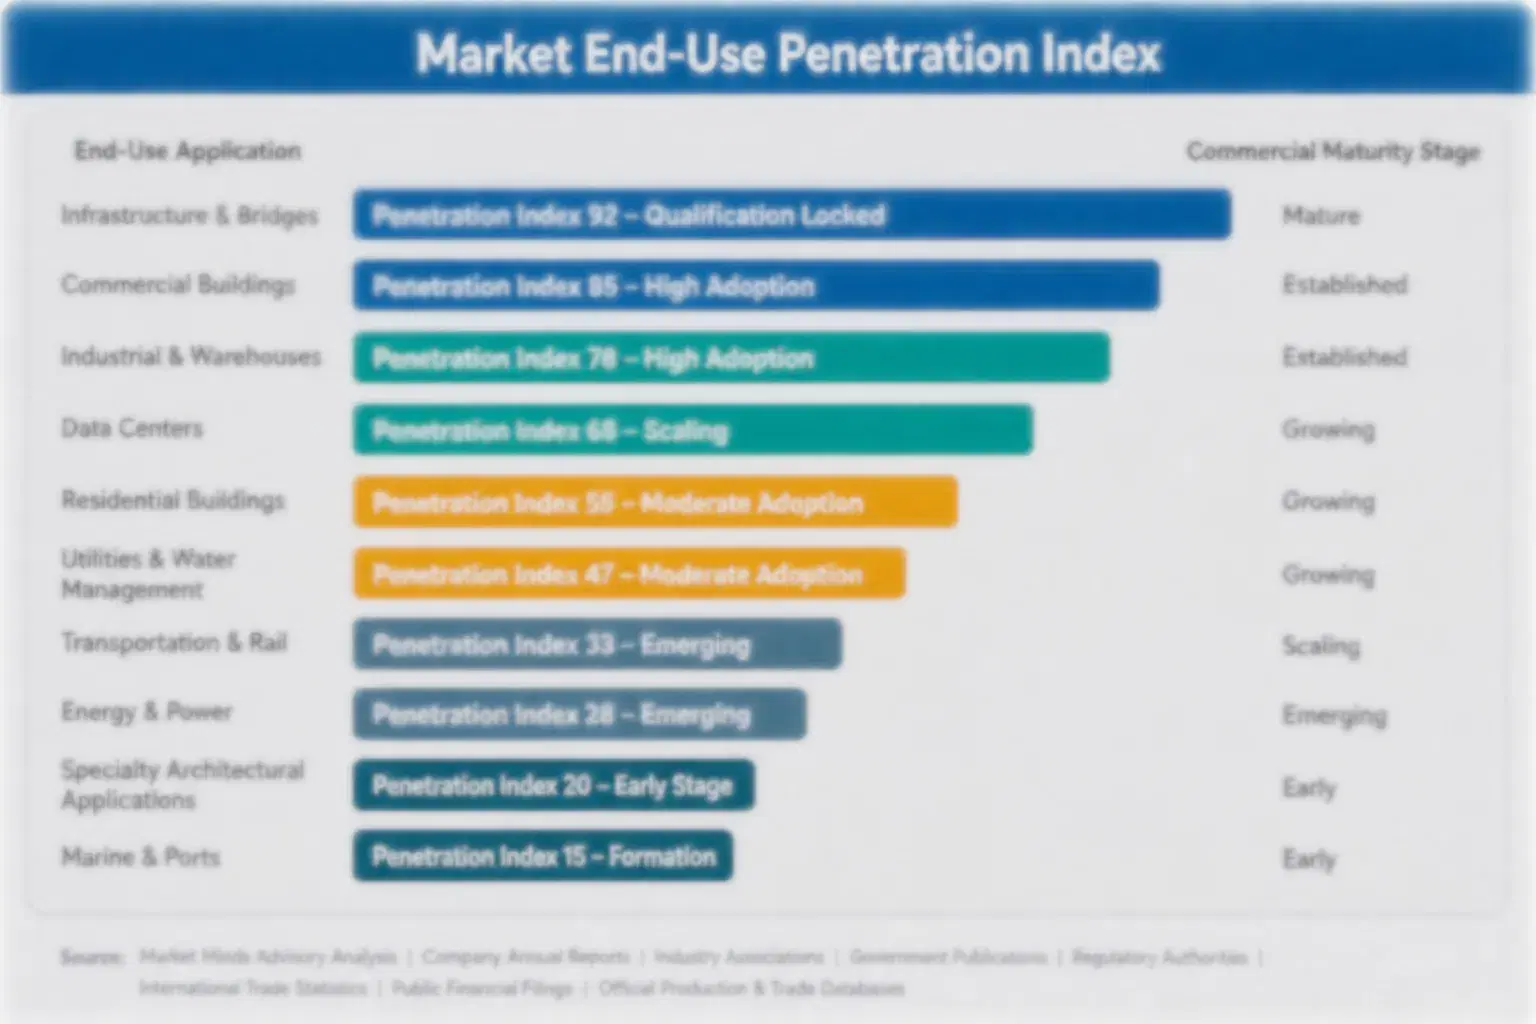
Caffeinated drink demand behaves like an annuity of daily routines. Buyers pick the same can from the same cooler on commutes, workdays, and gym visits because it is familiar, and a satisfied buyer often trades to a multipack or a premium flavour. Retailers use last month's sell-through to fix ranges, and distributors use route data to plan restocks, so successful brands earn steadier volume than launches driven by novelty alone.
Adoption stickiness differs by end-use vertical. Convenience and gas station buyers are the deepest, since habit and cooler placement drive daily repeat purchase, and they change only when supply or price fails. Gym, club, and subscription buyers are almost as loyal once trust is built. Grocery buyers are shallower and switch on price, while office and event buyers follow promotions and procurement cycles.

Buyer profiles are shifting between generations. Older buyers choose caffeinated drinks for work and routine and trust established brands, while younger buyers care about zero sugar, natural caffeine, and social proof shared online. Wellness-focused professionals add a third group that wants transparent sourcing and clean labels. Brands that publish caffeine content and use social media for flavour ideas win younger buyers and
united-states-caffeinated-beverage-market-end-use-penetration-index-1789805593827

MMA Verdict on Caffeinated Drink Strategy

These are among the four positions where our research anticipates prominent divergence between winners and laggards over the coming forecast period. Each is grounded in the demand model, the regulatory perimeter, and the announced capacity pipeline.
01 / FITNESS ENERGY STRATEGY

Build Zero-Sugar Fitness Lines Before Traditional Energy Cans Lose Ground

Sugar-free fitness energy drinks grow at 9.6% a year, about 1.41 times the overall market rate, and brands with zero-sugar formulas and clean-label claims earn gross margins of 42% to 55% against 30% to 40% for traditional sugar-based cans. Winners will invest in flavour rotation, gym and club channel programmes, and social media communities that turn a first can into a weekly habit. Brands that defend sugar-based formulas will lose younger buyers, and rivals with zero-sugar innovation will take the best cooler doors.
02 / ALUMINIUM COST DISCIPLINE

Contract Can Supply and Lighten Packaging Before Tariffs Erode Margin

Aluminium cans and packaging take about 26% of cost of goods, and tariff and premium swings can add 10% to 20% to can cost within a year. Brands should sign multi-year can contracts with at least two suppliers, use lighter cans and shared filling capacity, and pass through cost in small pack-price steps rather than sudden increases. Those that buy on the spot market will absorb volatility, and rivals with contracted supply and co-packing capacity will hold price and shelf space through every supply shock.
03 / YOUTH REGULATION READINESS

Prepare for State Limits on Youth Sales Before Retailers Delist High-Caffeine Cans

State proposals to restrict energy drink sales to minors and FDA guidance of 400 milligrams of caffeine a day can force label, marketing, and channel changes within one legislative session. Brands should cap caffeine per serving, label clearly, avoid youth-targeted marketing, and engage regulators through trade association channels before rules harden. Those that ignore the trend will face retailer delisting and litigation, and rivals with cautious, transparent positioning will keep access to school-adjacent and convenience channels as scrutiny rises in several large states.
04 / MULTI-CHANNEL CAFFEINE RANGES

Extend Into Cold Coffee and Sparkling Caffeine Across Club, Grocery, and Online

Ready-to-drink coffee and sparkling caffeine grow at 6.9% and 8.4% a year as buyers replace café trips and soda with a cold can, yet many brands still sell a single roast profile through a single channel. Brands should build cold brew and sparkling ranges, secure club and grocery distribution beside convenience stores, and price single cans within $1 of café drinks. Those that stay in one channel will cap volume, and rivals with multi-channel ranges will capture buyers who move between coffee, tea, and energy through the day.

Engagement Snapshot From the Field

A live engagement with an industry participant carrying material or product regulatory and market exposure ahead of a defining policy shift, showing how our research translates into a defensible multi-year portfolio strategy.
MARKET MINDS ADVISORY · CLIENT ENGAGEMENT SUMMARY
Demand for Caffeinated Beverage in USA Producer Strategic Portfolio Review and Transition Roadmap 2026·Investment Scenario on Demand for Caffeinated Beverage in USA Exposure Evaluation 2025-26
CLIENT PROFILE
The client is a mid-sized United States beverage company with annual sales near $380 million (client-reported, unverified by MMA), a portfolio of sugar-based energy drinks and iced tea sold through convenience stores, gas stations, and regional grocery chains. It had no zero-sugar fitness line, limited club and online presence, and heavy exposure to aluminium costs and retailer promotions.
STRATEGIC CHALLENGE
Energy drink sales were flat, aluminium tariffs had raised can cost by 14%, and zero-sugar rivals were winning cooler doors at convenience stores. Management needed to decide whether to launch a zero-sugar line, expand into club and online, or secure new can supply, with limited capital and only one co-packer able to run sparkling formats.
MMA APPROACH
MMA analysed sales and channel data across 30 products, interviewed 12 retail buyers, eight distributors, and six can suppliers, and ran a buyer survey on flavour, sugar, and price across three age groups. It modelled margin by product and channel, tested aluminium scenarios, and ranked options by payback period and execution risk.
KEY FINDINGS
  1. A zero-sugar fitness line with natural caffeine could reach 15% of sales in two years at margins near 46% (client-reported, unverified by MMA). Margins follow sourcing discipline.
  2. Club and online channels could add 10% to sales through multipacks and subscriptions, without major additional capital. Retail buyers review ranges every season. Trial data protects future sales.
  3. Multi-year can contracts covering 70% of volume and lighter cans could cut cost volatility by about half. Cost control separates leaders from followers. Clear labelling builds buyer trust.
  4. A sparkling natural caffeine line could add 5% of sales among buyers under 30 at prices 12% above classic cans. Small brands feel every can price swing.
CLIENT PROFILE
The client is a mid-sized United States beverage company with annual sales near $380 million (client-reported, unverified by MMA), a portfolio of sugar-based energy drinks and iced tea sold through convenience stores, gas stations, and regional grocery chains. It had no zero-sugar fitness line, limited club and online presence, and heavy exposure to aluminium costs and retailer promotions.
STRATEGIC CHALLENGE
Energy drink sales were flat, aluminium tariffs had raised can cost by 14%, and zero-sugar rivals were winning cooler doors at convenience stores. Management needed to decide whether to launch a zero-sugar line, expand into club and online, or secure new can supply, with limited capital and only one co-packer able to run sparkling formats.
MMA APPROACH
MMA analysed sales and channel data across 30 products, interviewed 12 retail buyers, eight distributors, and six can suppliers, and ran a buyer survey on flavour, sugar, and price across three age groups. It modelled margin by product and channel, tested aluminium scenarios, and ranked options by payback period and execution risk.
KEY FINDINGS
  1. A zero-sugar fitness line with natural caffeine could reach 15% of sales in two years at margins near 46% (client-reported, unverified by MMA). Margins follow sourcing discipline.
  2. Club and online channels could add 10% to sales through multipacks and subscriptions, without major additional capital. Retail buyers review ranges every season. Trial data protects future sales.
  3. Multi-year can contracts covering 70% of volume and lighter cans could cut cost volatility by about half. Cost control separates leaders from followers. Clear labelling builds buyer trust.
  4. A sparkling natural caffeine line could add 5% of sales among buyers under 30 at prices 12% above classic cans. Small brands feel every can price swing.
RECOMMENDED STRATEGY
Phase 1: Phase 1 (Months 1-6): Sign multi-year can contracts, develop three zero-sugar flavours, and secure a second co-packer for sparkling lines. Distribution reach compounds over time. Phase 2: Phase 2 (Months 7-18): Launch the zero-sugar fitness line in convenience stores and clubs, with flavour rotation and multipack formats. Buyers reward consistency over novelty. Phase 3: Phase 3 (Months 19-30): Expand to online subscriptions, launch the sparkling line, and review margin and sell-through quarterly. Cooler space decides renewal.
OUTCOME
Within 30 months, zero-sugar and sparkling lines reached 19% of sales, cost volatility fell by 45%, and gross margin on the range rose to 43% (client-reported, unverified by MMA). The client won cooler doors in three club chains, added 400 grocery stores, and buyers named its fitness line a preferred zero-sugar option.

Frequently Asked Questions

Foundational context covering the market sizes, CAGR, scope, country, region and competition that inform every finding below. This section is provided to cover basics and most often pre-purchase conversations, answered from the MMA Primary Research Dataset.

What is the current size of the Demand for Caffeinated Beverage in USA?

United States demand for caffeinated beverages was valued at $44.0 billion in 2025. Growth is supported by zero-sugar formats, ready-to-drink coffee, and wider club and grocery distribution despite aluminium cost pressure.

How large will the Demand for Caffeinated Beverage in USA be by 2036?

The market is projected to reach $90.7 billion by 2036, up from $47.0 billion in 2026. The increase of $43.7 billion reflects zero-sugar fitness cans, sparkling caffeine, and wider channel reach.

What is the CAGR for the Demand for Caffeinated Beverage in USA 2026 to 2036?

The market is forecast to grow at a 6.8% CAGR from 2026 to 2036. The bull case reaches 8.1% and the bear case 5.5%, depending on aluminium costs and state rules.

Which segment is growing fastest?

Sugar-Free Fitness Energy Drinks is the fastest-growing segment at 9.6% CAGR, roughly 1.41 times the overall market rate. Caffeinated Sparkling Waters and Sodas follows as the second-fastest segment at 8.4% CAGR each year.

Who are the major companies in the Demand for Caffeinated Beverage in USA?

Major companies include Monster Beverage, Red Bull, PepsiCo, Coca-Cola, and Celsius Holdings. Keurig Dr Pepper, Nestlé, Starbucks, Arizona Beverages, and Suntory Beverage and Food also hold meaningful positions.

Which country is growing fastest?

The United States is the fastest-growing consumption market at a 6.7% CAGR, driven by zero-sugar cans and wider channel reach. Mexico and Canada follow as smaller cross-border markets for American brands.

Report Segmentation Architecture

The full report scope spans multiple orthogonal segmentation dimensions, with cross-tabulated demand data provided for each dimension pair. Coverage extends further to regional breakdowns, trend trajectories, and the competitive detail needed to support segment-level decision-making.

By Primary Market Dimension

  • Traditional Energy Drinks
  • Sugar-Free Fitness Energy Drinks
  • RTD Coffee and Cold Brew
  • Caffeinated Sparkling Waters and Sodas
  • RTD Caffeinated Tea

By End-Use Industry

  • Daily Commuter and Workday Use
  • Gym and Sports Use
  • Study and Office Use
  • Social and Leisure Use
  • Travel and Convenience Use

By Commercial Dimension

  • Convenience and Gas Stores
  • Grocery and Mass Retail
  • Club and Warehouse Stores
  • Online and Subscription
  • Foodservice and Vending

By Region

  • North America
  • South Asia and Pacific
  • Western Europe
  • East Asia
  • Latin America
  • Middle East and Africa
  • Eastern Europe

Scope, Methodology, and Coverage

Every figure in this report is reproducible from documented input assumptions. The scope below maps the historical period, the forecast horizon, the segmentation dimensions, and the countries covered, alongside the underlying primary and qualitative methodology.
Historical Period
2020 to 2025
Forecast Period
2026 to 2036
Base Year
2025 (USD billions; MMA Primary Research Dataset, September 2026)
Market Definition
Demand for caffeinated beverages in the USA covers ready-to-drink non-alcoholic beverages sold to United States consumers with added or natural caffeine as a defining functional ingredient, including energy drinks, ready-to-drink coffee, caffeinated sparkling drinks, and caffeinated tea. The scope excludes regular cola and soft drinks sold mainly on flavour, coffee and tea sold as hot beverages or grounds, and supplements.
Quantitative Units
USD billions (retail sales value); million cases for volume references
Segmentation Dimensions
By Product Positioning; By End-Use Occasion; By Commercial Dimension; By Region
Regions Covered
North America, South Asia and Pacific, Western Europe, East Asia, Latin America, Middle East and Africa, Eastern Europe
Countries Covered
United States, Canada, Mexico, United Kingdom, Germany, France, Japan, South Korea, Australia, Philippines, Brazil, Colombia, United Arab Emirates, Poland, and additional markets relevant to this sector
Key Companies Profiled
Monster Beverage, Red Bull, PepsiCo, Coca-Cola, Celsius Holdings, Keurig Dr Pepper, Nestlé, Starbucks, Suntory Beverage and Food, Ito En, Arizona Beverages, Nutrabolt, Guayaki, Zevia, Chameleon Cold-Brew, Califia Farms, La Colombe, Talking Rain Beverage, Yerbaé Brands, Vitamin Well
Quantitative Methodology
Primary survey, n=3,800 respondents, Q4 2025, six countries; demand-side model with trade association cross-validation
Qualitative Methodology
47 expert interviews, Q4 2025; applied to validate demand model assumptions, identify emerging dynamics, and assess competitive positioning
Report Format
PDF and XLSX data workbook (Word format preview document)
Publisher
Market Minds Advisory
Report Code
MMA-2026-AGR-428
Published
September 2026
Contact
sales@marketmindsadvisory.com | www.marketmindsadvisory.com

Purchase the full Demand for Caffeinated Beverage in USA Report (2026 to 2036).

The full report delivers a detailed assessment of United States demand for caffeinated beverages through 2036, covering segment, regional, and channel forecasts, competitive benchmarking of leading brands, and input cost analysis. It combines MMA primary research, including a six-country survey of 3,800 respondents and 47 expert interviews, with public trade and company data. Analysts also model aluminium scenarios, caffeine rule changes, and zero-sugar adoption. Clients receive segment margin ranges, channel maps, and a case study on portfolio strategy. Retailer and distributor contact frameworks are also included for negotiation planning.
Ten-year segment and channel demand forecasts
Aluminium, coffee, and caffeine price tracking
Competitive benchmarking of top twenty caffeinated brands
State regulation and caffeine rule tracker with updates
Regional demand mechanism comparative analysis included
Quarterly primary survey data update access

Built For The People Who Decide

From boardroom strategy to bench-side execution, this report is read cover-to-cover by leaders shaping the next decade of their industry, turning demand scenarios, market dynamics and valuation benchmarks into decisions.
CXOs/ Presidents/ VPs/ Managers
M&A and Corporate Development
Strategy Teams and R&D Heads
Procurement and Product Directors
Regulatory and Compliance Leaders
Investor Relations and Equity Analysts