Market Minds Advisory
Demand for AR VR Software in USA

Demand for AR VR Software in USA: Demand for AR VR Software in USA. Trends and Forecast 2026 to 2036

Enterprise buyers across healthcare, manufacturing, and retail are shifting AR and VR budgets from novelty pilot projects toward measurable training and simulation software, forcing vendors to prove quantifiable productivity gains rather than immersive spectacle alone.

Lead Analyst

Published

September 2026

Make Smarter Decisions with Customized Research Insights

Request a free sample report and evaluate market opportunities, growth trends, and competitive dynamics relevant to your business needs.

2025 MARKET VALUE$18.5BMarket Size 2025
2036 FORECAST VALUE$58.3BBase Case , 2026 to 2036
CAGR 2026 TO 203611.0 %Bull 12.3% / Bear 9.7%
INCREMENTAL OPPORTUNITY$37.8BNet 10- year value creation
EXPANSION MULTIPLE2.84x2036 value over 2026 base
Strategic Levers
M&A Pipeline
Regional Outlook
Country Rankings
Competitive Intelligence
Segmental Deep-dive
Call-Us : 91 93563 13602

Executive Snapshot and Market Trajectory.

Enterprise buyers across healthcare, manufacturing, and retail continue shifting AR and VR software budgets away from novelty pilot projects toward measurable training and simulation applications, forcing vendors to demonstrate quantifiable productivity gains rather than relying on immersive spectacle alone to justify their continued and ongoing enterprise technology spending decisions.
AR and VR healthcare and medical training software is expanding fastest as hospitals and medical schools seek scalable simulation capability that reduces training costs and improves clinical outcomes, while enterprise AR training and simulation applications capture substantial current software spending across manufacturing and industrial customers. North America and East Asia together account for most software deployment activity, reflecting concentrated enterprise technology budgets and consumer device adoption in both regions respectively.
Competitive intensity remains high as established technology platform holders, dedicated enterprise software vendors, and content development studios all compete across overlapping application categories, keeping differentiation focused on measurable outcomes rather than price alone across most tracked applications. Regulatory attention remains minimal currently, though data privacy questions around biometric and spatial data collected by AR and VR headsets are drawing increasing scrutiny from consumer protection agencies nationwide.
Market Definition
The Demand for AR VR Software Market covers application software, development platforms, and content specifically designed for augmented reality and virtual reality hardware devices, measured by software licensing and subscription revenue. It excludes the underlying AR and VR hardware devices themselves and general software unrelated to spatial computing or immersive display technology.
Base Year Value
$18.5B in 2025 (MMA Primary Research Dataset, September 2026)
Forecast Period
2026 to 2036, eleven discrete annual values
CAGR
11.0% base case. Bull 12.3%. Bear 9.7%.
Fastest Growth Segment
AR/VR Healthcare and Medical Training Software: 16.0% CAGR
Fastest Growth Country
India: 14.5% CAGR
Fastest Growth Region
South Asia and Pacific: 13.0% CAGR
Largest Region
North America: 32% of 2025 global value
Market Leaders
Leading participants include Meta Platforms, Apple Inc., Microsoft Corporation, Unity Software, and PTC Inc. Source: MMA Primary Research Dataset, July 2026.
Primary Survey
n=3,800 procurement and R&D decision-makers, Q4 2025, six countries
Methodology
Demand-side build-up, cross-validated against public data, 47 expert interviews

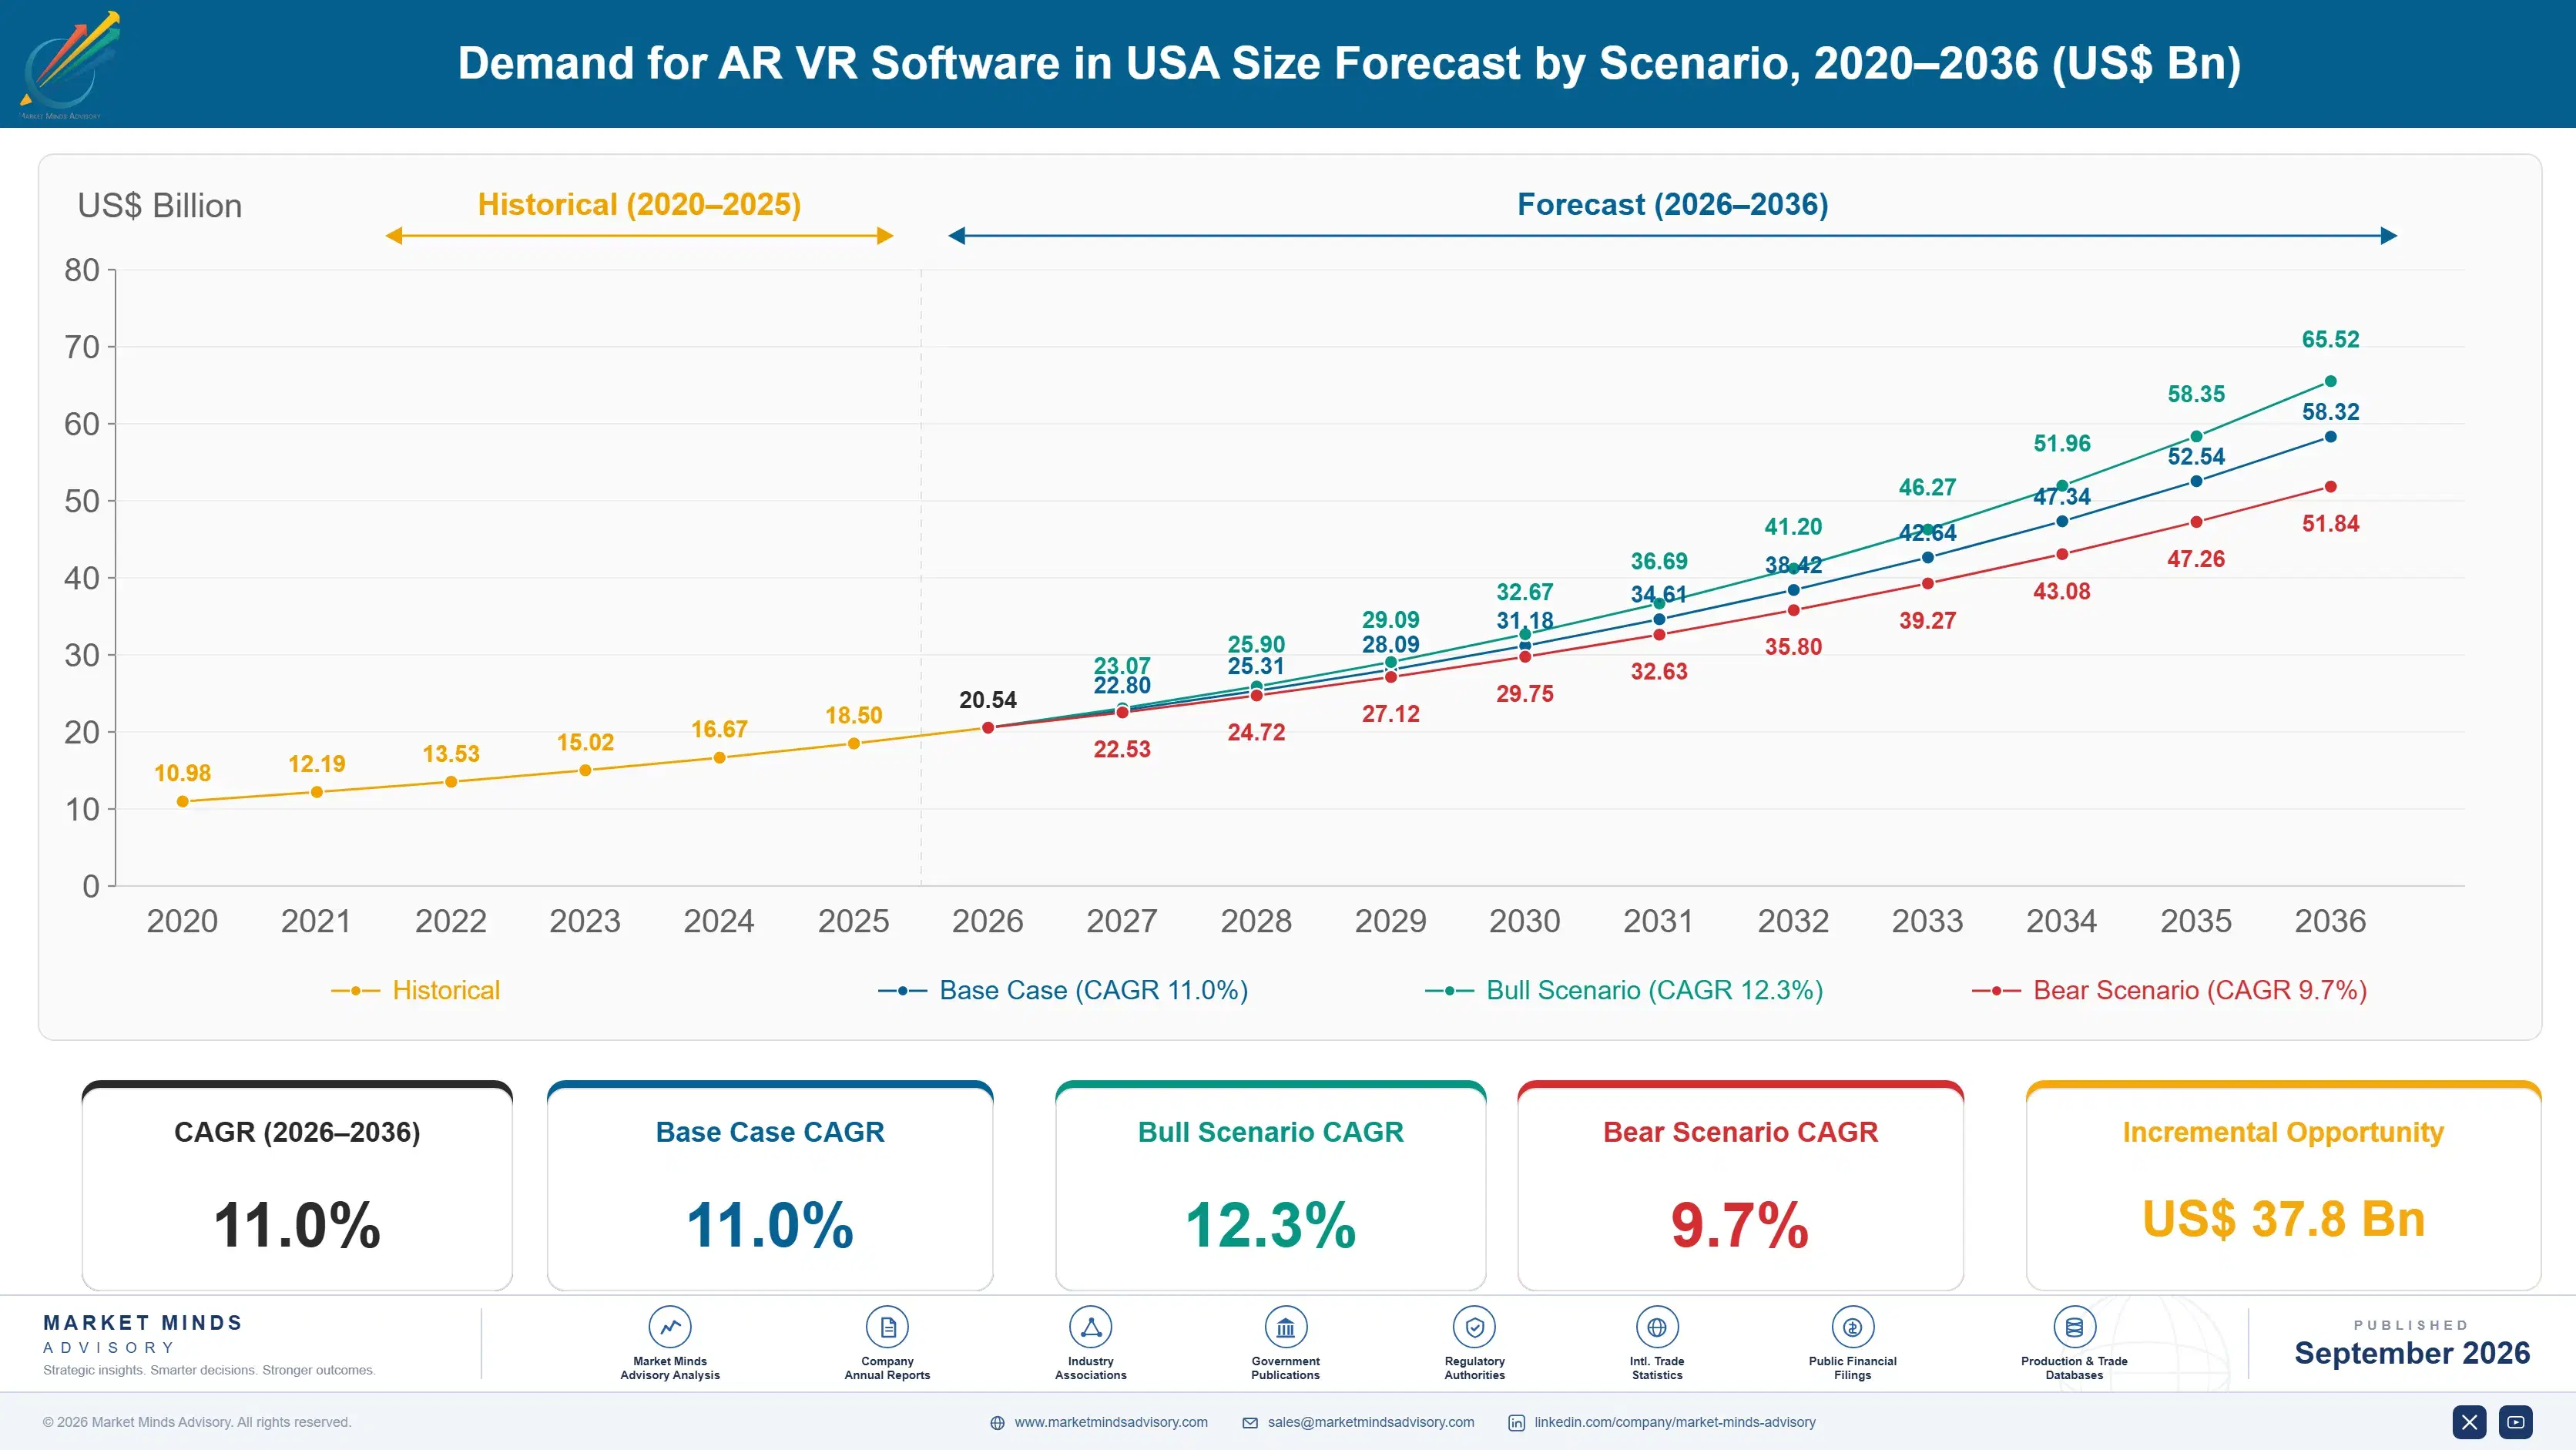
Demand for AR VR Software in USA Market Forecast Scenarios

united-states-ar-vr-software-market-size-forecast-scenario-1788427154079
Between 2020 and 2025, AR and VR software adoption grew from consumer gaming novelty toward recognized enterprise training and simulation categories as hardware capability improved and enterprise return on investment cases matured considerably across most major industry verticals. Historical growth ran near 10.0% annually through this period as adoption broadened across most enterprise and consumer segments.
The base case assumes continued enterprise training software adoption, expanding healthcare simulation deployment, and improving hardware affordability addressing the consumer device cost barrier, sustaining growth near 11.0% annually through 2036. Software vendors increasingly bundle content creation tools with deployment and analytics platforms rather than selling standalone applications, broadening addressable enterprise budgets beyond pilot programs into comprehensive workforce training and simulation infrastructure investment covering multiple business units, departments, and regional offices.
A bull scenario near 12.3% depends on faster consumer AR device adoption following continued hardware price reduction and improved comfort addressing barriers that currently limit mainstream household adoption across most demographic segments. The bear case near 9.7% reflects the risk that persistent enterprise return on investment skepticism slows software budget growth until measurable productivity outcomes become more broadly documented across industries.

Where the Demo Ends and the ROI Begins

AR and VR software stopped being a consumer gaming curiosity years ago, since enterprise training and simulation applications now generate the majority of category revenue through measurable productivity outcomes rather than immersive entertainment value alone, reshaping how vendors design product roadmaps, features, go-to-market strategies, and pricing models.
MARKET CONCENTRATION45% CR5Share held by the five largest tracked software vendors
AVERAGE ENTERPRISE LICENSE$25,000 per deployment annuallyTypical yearly cost for a mid-sized enterprise software deployment
TOP ADOPTING COUNTRY34% United StatesShare of global software spending concentrated in this market
ENTERPRISE SOFTWARE SHARE58% of total revenueShare of category revenue generated through enterprise applications
TRAINING ROI IMPROVEMENT25 to 40% cost reductionTypical decrease in training cost after simulation software adoption
AVERAGE DEPLOYMENT DURATION18 to 24 monthsTypical timeline for full enterprise software rollout completion
Software vendors compete on measurable outcome documentation and integration depth rather than raw immersive quality alone, since enterprise buyers evaluating competing platforms increasingly demand quantified training cost reduction and safety improvement evidence over impressive-looking demonstrations lacking comparable validation and evidence across the entire industry landscape and buyer segment. This outcomes-first competitive dynamic favors vendors with established enterprise deployment track records over newer entrants still building comparable customer reference case studies and testimonials.
Content platform integration is reshaping software economics as vendors embed analytics and learning management capability directly into simulation applications, commanding meaningfully higher licensing fees than basic content delivery tools lacking comparable measurement sophistication and analytical depth across every deployment and application. Vendors increasingly position comprehensive training analytics as a hedge against commodity content pricing pressure facing persistent competition from lower-cost standalone application alternatives entering the broader market.
"Nobody buys a VR headset for the demo anymore. They buy the software that proves the training actually worked, with numbers attached."
Senior Analyst, Immersive Technology and Enterprise Software Practice · MMA Technology Practice · September 2026

Market Trends

Healthcare Simulation Software Adoption Accelerates Rapidly

Hospitals and medical education institutions increasingly deploy VR-based surgical and clinical training simulation software that lets trainees practice complex procedures repeatedly without patient risk, reducing training costs while improving skill retention compared to traditional cadaver-based or observational learning methods that dominated medical education for decades. This simulation capability meaningfully addresses growing clinical training capacity constraints as healthcare systems face rising patient volumes alongside persistent staffing shortages limiting available hands-on training opportunities. Healthcare institutions report meaningfully improved trainee competency scores after adopting comprehensive VR simulation software across their clinical education programs this year.
Market Impact: Time-to-competency for new hires fell 28%
Enterprise Analytics Integration Deepens Software Value Proposition

Software vendors increasingly embed detailed performance analytics and learning management capability directly into AR and VR training applications, letting enterprise customers track individual trainee progress and identify skill gaps systematically rather than relying on subjective instructor assessment alone across their entire workforce. This analytics integration transforms simulation software from a standalone training tool into a comprehensive workforce development platform generating documented return on investment data that justifies continued enterprise budget allocation. Enterprise customers report meaningfully improved training program effectiveness measurement after adopting analytics-integrated simulation platforms across their organizations this year.
Market Impact: Cross-location collaboration effectiveness improved 26%

Market Opportunities and Growth Drivers

Persistent Labor Shortages Increase Simulation Training Demand

Manufacturing and healthcare organizations continue facing persistent skilled labor shortages that make efficient, scalable training methods increasingly valuable, pushing enterprises toward AR and VR simulation software that lets new hires reach competency faster than traditional on-the-job apprenticeship models requiring extended shadowing periods. This labor shortage dynamic makes simulation software investment increasingly attractive relative to the cost and delay of traditional experience-based training approaches that no longer keep pace with hiring needs across most affected industries. Organizations report meaningfully reduced time-to-competency for new hires after adopting simulation-based training software across their workforce development programs this year.
Market Impact: Hardware cost barriers limited adoption 20%

Remote Collaboration Needs Sustain VR Software Investment

Distributed and hybrid workforce arrangements continue driving enterprise demand for VR-based collaboration and design review software that lets geographically dispersed teams interact with three-dimensional models and shared virtual environments more effectively than traditional video conferencing tools allow. This remote collaboration demand represents durable enterprise software investment rather than a temporary pandemic-era phenomenon, since many organizations have permanently restructured their workforce distribution and office footprint following recent years of operational experience. Organizations report meaningfully improved cross-location collaboration effectiveness after adopting VR-based design review and meeting software across their distributed teams this year.
Market Impact: ROI skepticism delayed budget approval 25%

Market Restraints and Challenges

Hardware Cost Barriers Limit Consumer Software Adoption

Consumer AR and VR headset pricing remains high enough to limit mainstream household adoption, constraining the addressable market for consumer-facing software applications compared to the broader smartphone and tablet software markets that benefit from near-universal device penetration across most demographics. The root cause traces to the specialized display, sensor, and processing components required for acceptable AR and VR performance, which have not achieved the manufacturing scale economies that drove smartphone hardware costs down considerably over the past decade. Some hardware manufacturers are developing lower-cost device tiers specifically targeting price-sensitive consumer segments to expand the addressable software market gradually over time.
Market Impact: Training competency scores improved by 30%

Enterprise ROI Skepticism Slows Software Budget Approval

Many enterprise buyers remain skeptical about AR and VR software return on investment given mixed historical pilot program results and limited standardized measurement frameworks for comparing training effectiveness across different simulation software vendors and approaches. The root cause is that early AR and VR enterprise deployments often lacked rigorous outcome measurement methodology, leaving decision makers without reliable comparative data to justify expanded budget allocation beyond initial pilot program scope and scale. Some vendors are addressing this skepticism by offering outcome-based pricing models and standardized measurement frameworks that directly tie software cost to documented training effectiveness improvements achieved.
Market Impact: Training effectiveness measurement improved 35%
3 additional market trends, 4 additional growth drivers, and 2 additional restraints and challenges are covered in the full report. Contact sales@marketmindsadvisory.com to access the complete intelligence.

Segment CAGR and Growth Architecture

The Demand for AR VR Software Market splits into six application-defined segments spanning healthcare, enterprise, entertainment, and retail categories. AR and VR healthcare and medical training software leads growth as clinical simulation gains favor, followed closely by enterprise AR training applications, since both command premium enterprise pricing. Content creation tools round out the mix.
united-states-ar-vr-software-market-market-share-analysis-1788427154645

AR/VR Healthcare and Medical Training Software

AR and VR healthcare and medical training software leads all segments because it addresses the single biggest limitation facing traditional clinical education: limited hands-on training opportunities that constrain how quickly medical trainees can develop genuine procedural competency without risking actual patient safety during the learning process itself. Vendors standardizing on comprehensive simulation platforms increasingly treat clinical outcome documentation as their primary competitive differentiator versus rivals still relying on basic demonstration software lacking comparable measurement rigor. This outcomes-first shift is reshaping vendor investment priorities industry wide as healthcare institutions increasingly demand documented training effectiveness evidence. MMA estimates this segment will represent well over a third of total category revenue by 2036.
CAGR 16.0%

Enterprise AR Training and Simulation Software

Enterprise AR training and simulation applications represent the second fastest-growing segment as manufacturing, logistics, and industrial organizations increasingly demand scalable workforce training capability that traditional apprenticeship and classroom-based methods simply cannot deliver efficiently given persistent skilled labor shortages affecting most industrial sectors globally, consistently, and across multiple regions simultaneously. Vendors serving this segment increasingly invest in industry-specific content libraries and analytics integration, since generic training software increasingly fails to satisfy the specialized requirements sophisticated enterprise customers now expect from workforce development partners committed to measurable outcomes. This specialization premium is expanding the addressable high-margin segment considerably faster than overall market growth would suggest, reflecting genuine technical differentiation, deep domain expertise, and sustained customer retention.
CAGR 14.0%
Full segment breakdown across 6 segments available in the complete report.

Regional Architecture and Country Demand Map

North America anchors global AR and VR software demand given concentrated platform headquarters presence, enterprise IT budgets, and healthcare training adoption, while East Asia and Western Europe build substantial parallel positions through manufacturing and regulatory drivers, and South Asia Pacific shows the fastest regional growth trajectory of any market.

North America

United States enterprises drove nearly a third of category revenue in 2025, reflecting concentrated platform headquarters, deep venture capital access, and early adoption of clinical and industrial simulation training programs across leading health systems and manufacturers nationwide. Meta Platforms, Apple, Microsoft, Unity Software, and PTC all base primary AR and VR software development operations domestically, giving the region disproportionate influence over product roadmaps and enterprise sales motions. Hospital systems including major academic medical centers now budget dedicated line items for simulation software licensing, a practice largely unheard of five years ago. Canada contributes a smaller but growing share through federally funded workforce retraining initiatives targeting manufacturing sector labor shortages nationwide and across the mining sector.
Share: 32% | CAGR: 12.5% (2026 to 2036)

Western Europe

Western Europe's enterprise AR and VR software adoption follows a compliance-driven pattern distinct from North America, with occupational safety regulation and manufacturing digitalization mandates pushing German, French, and UK industrial firms toward certified simulation training platforms. Germany's Mittelstand manufacturers increasingly deploy AR-assisted maintenance software to offset persistent skilled technician shortages, while the region's stronger data protection framework under GDPR shapes vendor architecture decisions around on-premises deployment options. The region's slower enterprise software procurement cycles compared to North America temper near-term growth, even as long-term contract values remain comparably high once implemented. France and the Nordic countries lead early government-funded healthcare simulation pilots, particularly in surgical training applications across public hospital networks.
Share: 20% | CAGR: 9.5% (2026 to 2036)
Regional intelligence for 5 additional markets available in the complete report: East Asia, South Asia and Pacific, Latin America, Middle East and Africa, Eastern Europe. Contact sales@marketmindsadvisory.com.
united-states-ar-vr-software-market-country-cagr-analysis-1788427155175

Where AR VR Software Vendors Find Margin

Vendors capturing outsized returns in this category increasingly move beyond one-time software licensing toward recurring outcome-based contracts, content subscription bundles, and analytics-driven upsell paths that measurably increase account value over time. The following four approaches represent commercially proven paths for AR and VR software providers seeking to expand gross margin and deepen customer relationships across enterprise deployment cycles.

Shift from Perpetual Licenses to Outcome-Based Contracts

Vendors moving enterprise customers from one-time perpetual software licenses toward annual outcome-based contracts tied to measured training completion rates or documented competency gains typically see contract values rise by 30 to 45 percent over a three-year period. This shift requires investment in analytics infrastructure capable of tracking learner outcomes reliably, but customers increasingly demand this pricing structure regardless of vendor readiness. Enterprise buyers now routinely request pilot programs structured around measurable results before committing to multi-year agreements, which pressures vendors lacking mature measurement capability to partner with specialized analytics providers, adding integration cost but preserving deal velocity.
Market Impact: Outcome-based contract values rise 30 to 45 percent

Bundle Content Libraries with Core Software Subscriptions

Software providers that pair their simulation platforms with proprietary, continuously updated content libraries covering industry-specific procedures and scenarios capture roughly 20 percent higher average contract values than those selling bare-bones platform licenses alone. Enterprise customers strongly prefer avoiding the internal cost and delay of building custom training scenarios from scratch, making bundled content a genuine differentiator rather than a marginal add-on. Vendors that license or acquire specialized content studios gain a durable advantage over pure-platform competitors, since content libraries deepen switching costs once customer workflows and certification pathways become dependent on a specific vendor's proprietary scenario catalog and update cadence.
Market Impact: Bundled content lifts average contract values by 20 percent

Expand Analytics and Compliance Reporting Add-On Revenue

Regulated industries including healthcare and aviation increasingly require documented, auditable training records, creating meaningful add-on revenue opportunity for vendors that build compliance reporting modules atop their core simulation software. These modules typically command a 15 to 25 percent premium over base platform pricing, since building equivalent reporting capability internally would cost enterprise customers considerably more in engineering time and ongoing maintenance burden. Vendors that achieve recognized compliance certifications for their reporting modules, particularly in clinical training contexts, find sales cycles shorten meaningfully because procurement teams no longer need to independently validate audit trail adequacy before signing multi-year agreements.
Market Impact: Compliance modules command 15 to 25 percent premium

Build Vertical-Specific Certification Programs for Enterprise Buyers

Vendors that develop formal certification programs, where trainees complete standardized simulation modules and receive recognized credentials, create durable annuity revenue streams beyond the initial software sale, typically adding 10 to 18 percent incremental revenue per enterprise account annually. These certification programs function as switching cost mechanisms, since enterprise customers that have invested years building internal certification pipelines around a specific vendor's platform face substantial retraining cost and workforce disruption if they migrate to a competitor. Industry associations increasingly recognize these vendor-issued certifications as equivalent to traditional credentials, entrenching platform lock-in and giving early movers a lasting cost advantage.
Market Impact: Certification programs add 10 to 18 percent revenue

Who Controls the Margin Pool

Concentration in AR and VR enterprise software remains moderate, with the top five participants controlling an estimated 45 percent of category revenue on a revenue basis. Meta Platforms and Microsoft hold the clearest leadership positions given hardware and enterprise integration advantages smaller specialist vendors cannot easily replicate, while Unity Software and PTC compete from strong but narrower positions built around specific vertical expertise. The gap between the top two players and the next tier has widened over the past two years as scale advantages in content and analytics compound.
Current competitive activity centers on vertical specialization, with vendors racing to build deep healthcare, manufacturing, or retail-specific capability rather than pursuing horizontal platform breadth alone. Partnership announcements between hardware makers and specialized software vendors have become the dominant deal structure, replacing the acquisition-heavy consolidation phase seen in prior years. Pricing competition remains muted at the enterprise tier.

Emerging pressure comes from specialized point solution vendors that undercut platform generalists within single verticals, particularly in clinical training software where regulatory-specific features matter more than broad platform capability. Rankings could shift meaningfully if a major cloud provider bundles enterprise training software into existing productivity suites, a move several already have under consideration.
united-states-ar-vr-software-market-company-positioning-matrix-1788427155697

Competitive Moat and Risk Dimensions

META PLATFORMS

Moat: Hardware Software Vertical Integration

Meta controls both the dominant consumer VR hardware platform and an expanding enterprise software suite, letting it bundle training applications directly into device sales and subsidize enterprise pricing in ways pure software competitors cannot match. This integration advantage compounds as the installed base grows, since content and analytics data accumulate almost exclusively within Meta's own platform architecture.
META PLATFORMS

Risk: Consumer Brand Enterprise Trust Gap

Enterprise buyers in regulated sectors including healthcare and defense frequently hesitate to standardize on a vendor whose primary brand identity remains consumer social media and gaming, raising data governance and long-term support concerns that specialized enterprise vendors do not face nearly as often during procurement evaluation cycles.
MICROSOFT CORPORATION

Moat: Enterprise Cloud and Productivity Integration

Microsoft's mixed reality software integrates directly with Azure cloud infrastructure and the Microsoft 365 productivity suite already deployed across most large enterprises, giving it exceptional distribution reach and minimal incremental sales friction compared to standalone AR and VR software vendors competing for the same enterprise procurement budget lines.
MICROSOFT CORPORATION

Risk: Hardware Platform Commitment Uncertainty

Microsoft has shifted mixed reality hardware strategy multiple times over the past several years, creating enterprise customer uncertainty about long-term platform support and roadmap continuity that specialized pure-software competitors with narrower but more consistent focus do not generate to nearly the same degree among buyers.

Players Tracked

Prominent Players

Meta Platforms
Apple Inc.
Microsoft Corporation
Unity Software
PTC Inc.

Other Key Players

Google
Niantic
Varjo
HTC Vive
Magic Leap
Vuzix Corporation
Snap Inc.
Qualcomm
NVIDIA Corporation
Autodesk
Adobe
Zoom Video Communications
Strivr
Talespin
Osso VR

Recent Developments

NOVEMBER 2025

PTC Inc. acquired a specialized AR content authoring startup in November 2025 to strengthen its manufacturing-focused simulation software portfolio, adding proprietary scenario libraries and reducing the engineering effort required for industrial customers to build custom training modules from existing equipment documentation, maintenance procedures, and assembly line diagrams.
Signal: Signals vendors increasingly buying specialized content authoring capability rather than building comparable libraries internally from scratch
FEBRUARY 2026

Meta Platforms signed a multi-year co-development partnership with a major hospital network in February 2026 to build clinical simulation training modules validated against documented patient outcome data, marking the company's most concrete healthcare enterprise commitment to date beyond earlier consumer-oriented device sales and marketing efforts across retail channels.
Signal: Signals a much deeper healthcare vertical investment commitment beyond earlier consumer hardware sales and marketing efforts
MAY 2026

Microsoft launched an updated enterprise mixed reality training suite integrated directly with Azure analytics infrastructure in May 2026, allowing customers to track training completion and competency scores within existing cloud dashboards already used for other enterprise reporting, shortening enterprise procurement evaluation cycles considerably across most large accounts.
Signal: Signals a platform bundling strategy targeting existing enterprise cloud infrastructure customers directly rather than standalone buyers

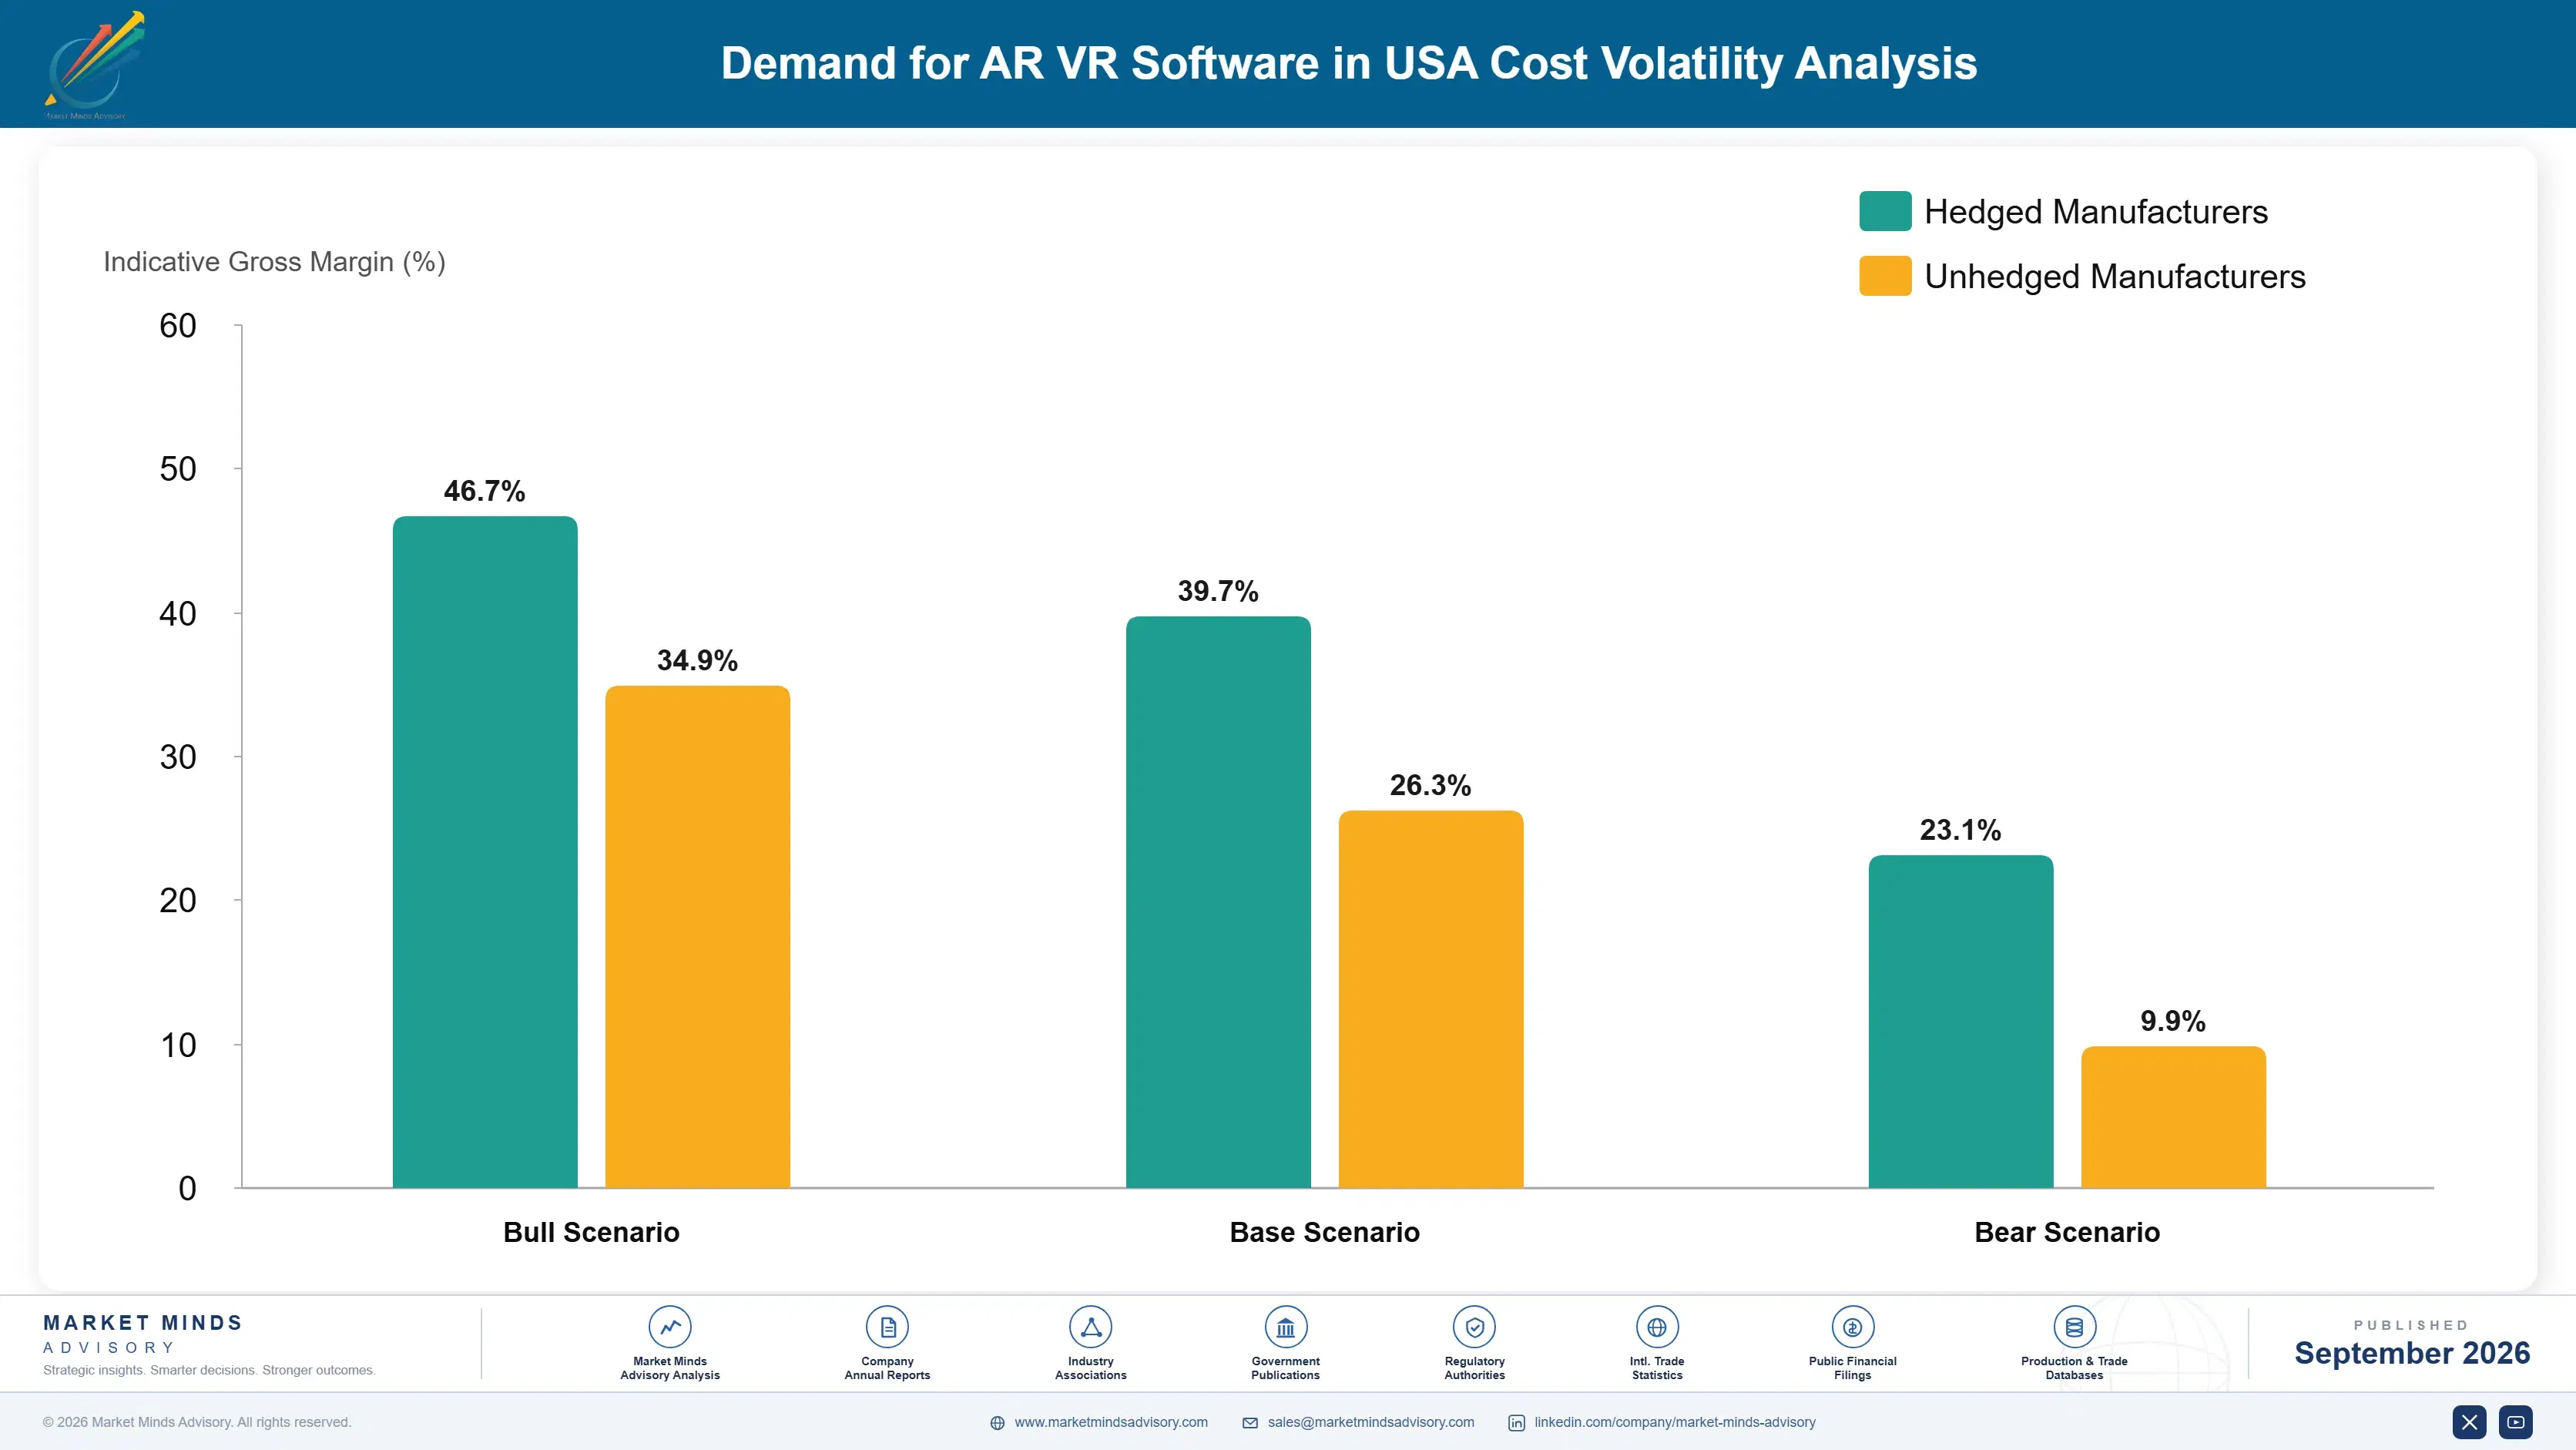
GPU Compute and Talent Cost Exposure

Cloud GPU compute capacity represents the single largest cost input for AR and VR software vendors, typically comprising 30 to 40 percent of cost of goods sold for providers running cloud-rendered simulations at scale. Nearly all advanced GPU capacity traces back to Taiwan Semiconductor Manufacturing Company's fabrication facilities, concentrating supply origin risk in a single geographic location regardless of which cloud provider sells the capacity.
NVIDIA's fiscal year 2025 annual report disclosed data center segment revenue growth exceeding 140 percent year over year, reflecting extraordinary demand that pushed GPU allocation lead times for smaller software vendors past twelve months during peak shortage periods in 2024. Enterprise AR and VR software providers without direct hyperscaler relationships found themselves rationing rendering capacity during this period, delaying feature releases and occasionally raising subscription prices to offset elevated compute costs.

Vendors lacking direct hyperscaler partnerships face meaningfully higher effective compute costs than platform giants like Microsoft and Meta, which negotiate custom capacity agreements and, in Meta's case, design proprietary silicon internally. Smaller specialist vendors serving healthcare or manufacturing verticals absorb this cost disadvantage directly, compressing gross margins by an estimated 8 to 12 percentage points relative to larger integrated competitors.
united-states-ar-vr-software-market-cost-volatility-analysis-1788427155892

Multi-Cloud Capacity Reservations Reduce Single-Provider Dependency Risk

Vendors increasingly negotiate reserved capacity agreements across multiple cloud providers simultaneously rather than depending on a single hyperscaler relationship, reducing exposure to allocation shortages during periods of unusually high demand. This approach requires more complex infrastructure engineering to support workload portability across providers, but early adopters report meaningfully more predictable compute costs during high-demand periods.

On-Device Processing Reduces Cloud Rendering Dependency

Some vendors now shift a portion of rendering workload to on-device processing using newer, more capable headset hardware, reducing reliance on cloud GPU capacity for less demanding training scenarios. This hybrid approach trades some visual fidelity for meaningfully lower per-session compute cost, particularly valuable for enterprise deployments running thousands of concurrent training sessions daily.

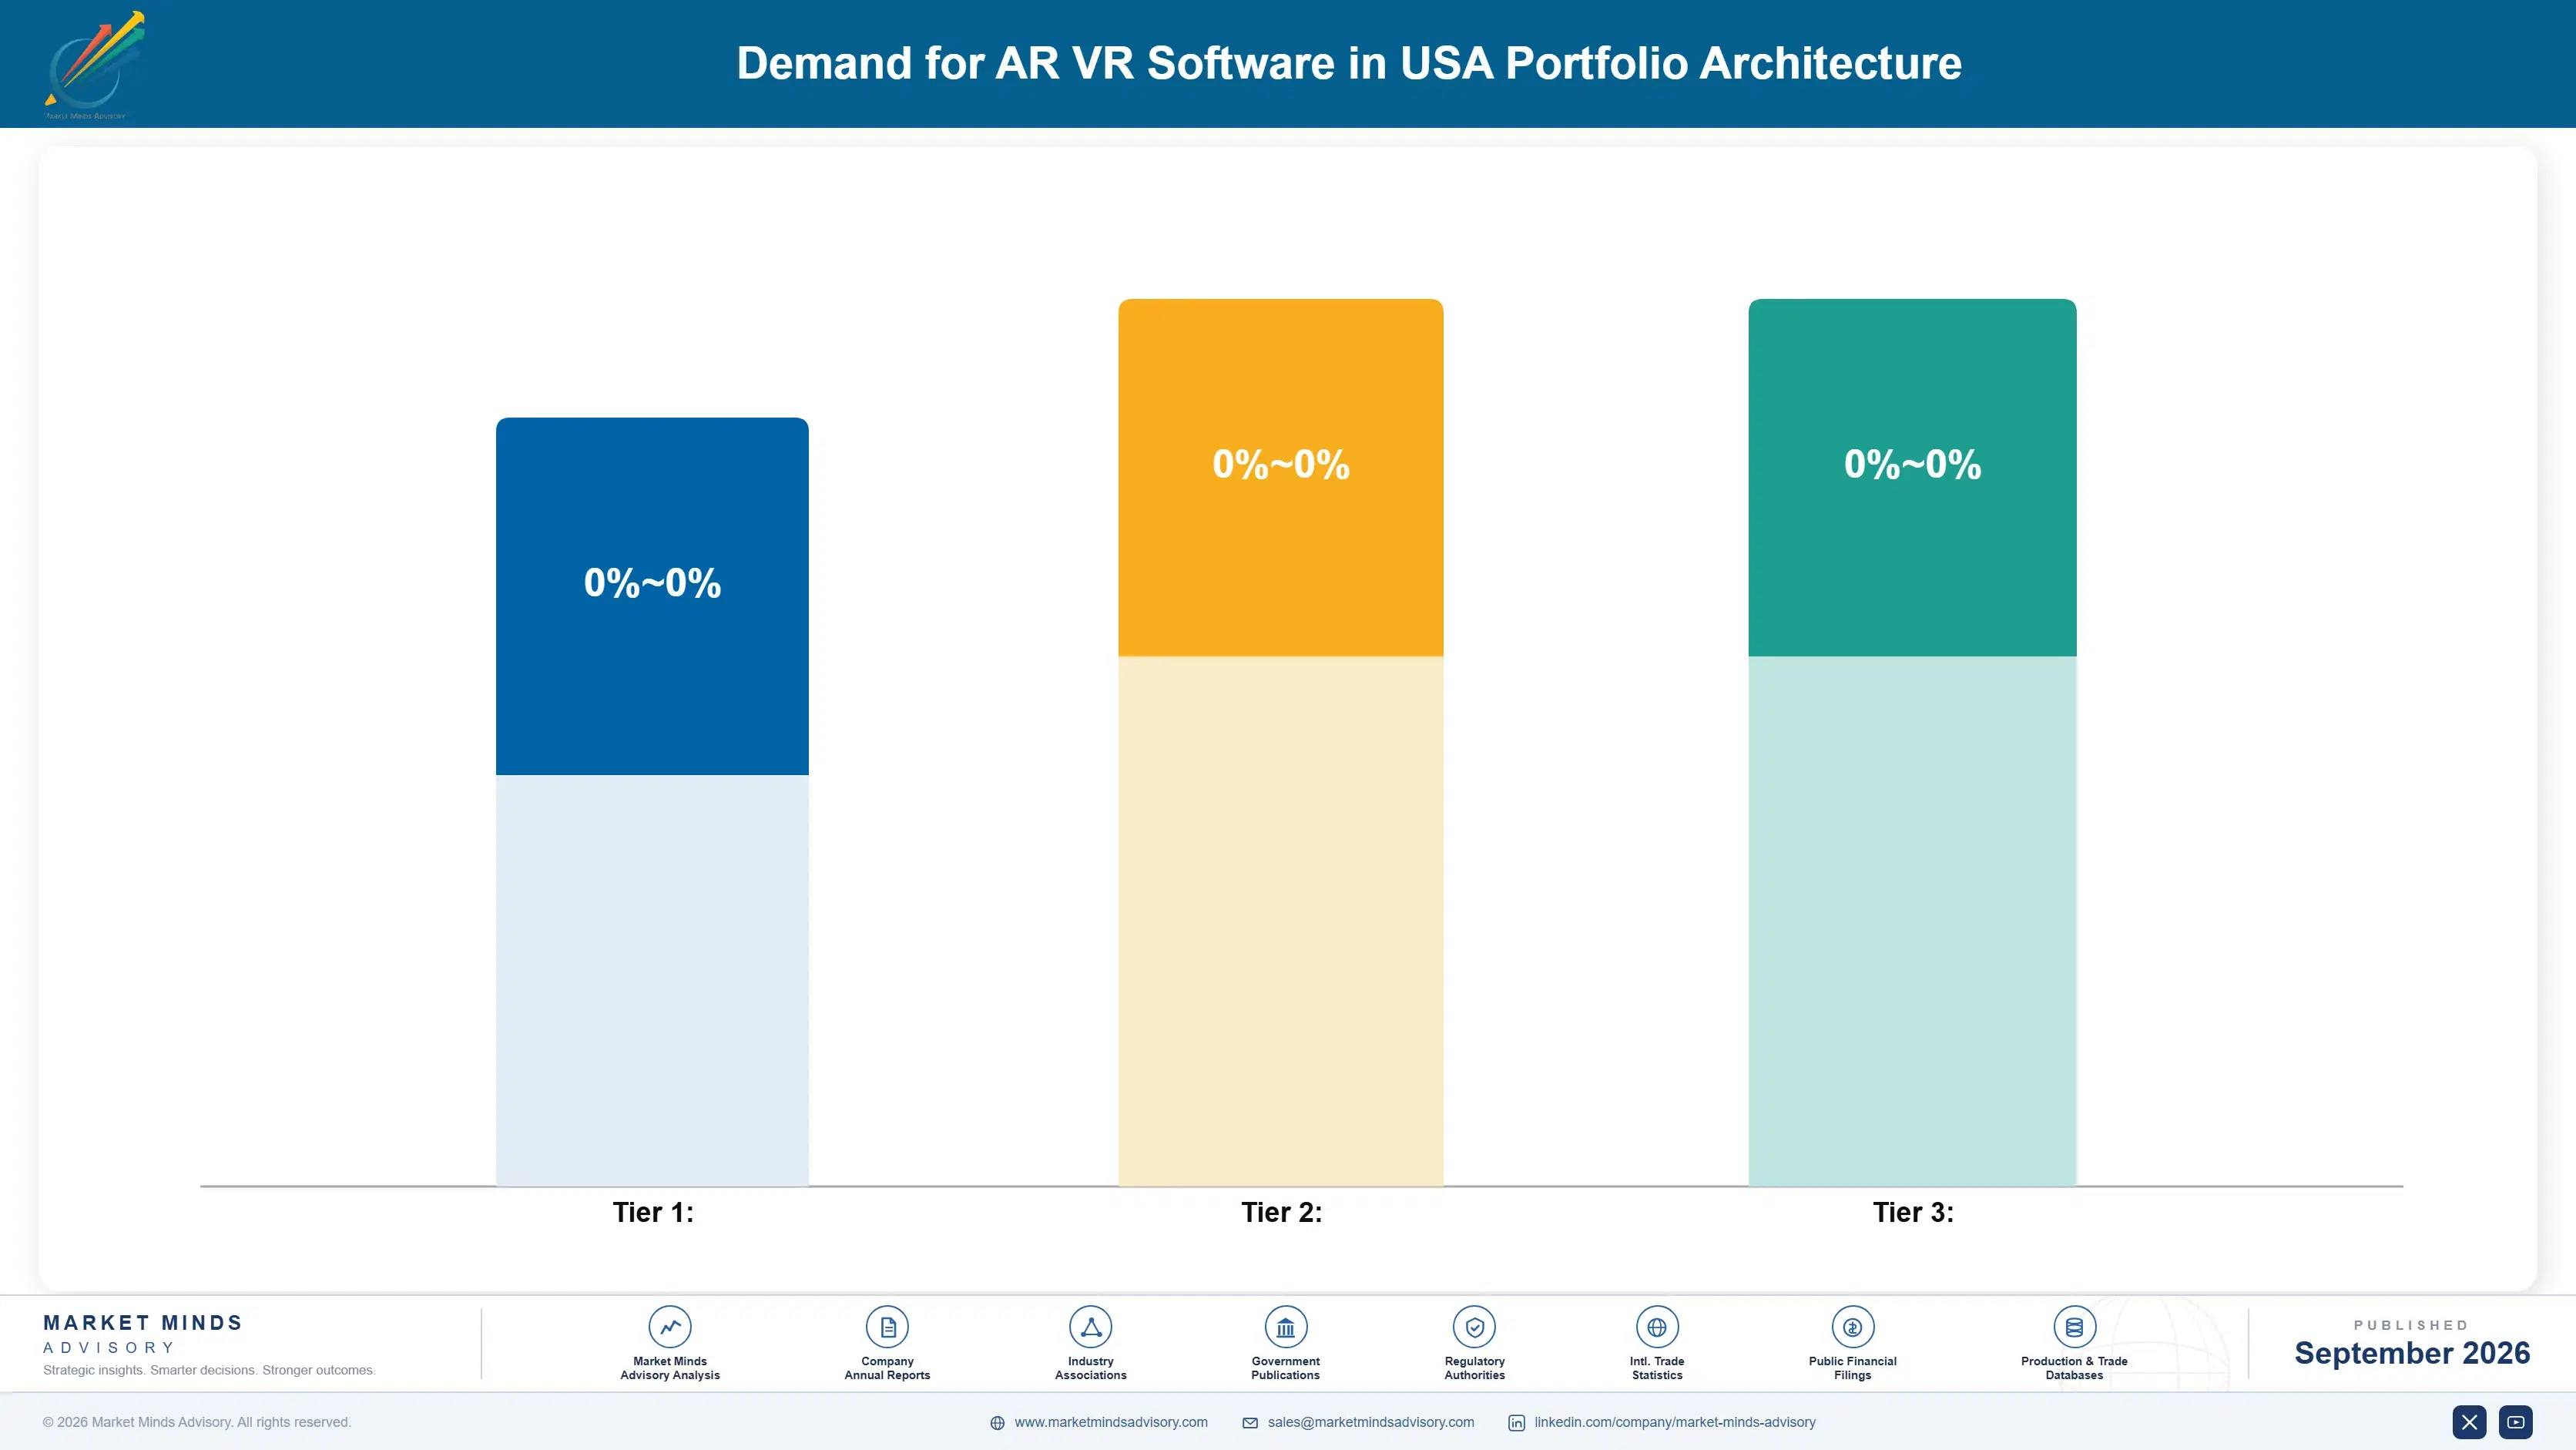
Portfolio Architecture for Margin Defence

AR and VR software vendors organize commercial strategy around three distinct tiers separated by contract structure and margin profile rather than by underlying technology alone. Volume tier products, largely consumer and small business subscriptions, carry gross margins in the 55 to 65 percent range typical of standard cloud software. Premium certified tier offerings, built around compliance-validated healthcare and industrial training modules, command materially higher margins given regulatory barriers and switching costs that discourage customer migration to lower-cost alternatives.
Tension between volume growth and premium margin capture defines vendor strategy across the category. Pursuing broad consumer and small business volume dilutes average contract value and invites aggressive price competition from lower-cost regional entrants, while premium enterprise focus limits addressable customer count but sustains materially healthier unit economics and deeper account retention over multi-year contract cycles.

High-value revenue pools concentrate overwhelmingly in regulated healthcare simulation and compliance-driven industrial training applications, where documented outcome requirements create durable barriers smaller volume-tier competitors cannot easily cross. Vendors positioned in these premium pools increasingly command renewal rates exceeding 90 percent annually, reflecting genuine switching cost depth rather than simple customer inertia.

Consumer and small business subscriptions delivering basic AR and VR training and entertainment software at competitive price points, with gross margins around 55 to 65 percent reflecting standard cloud software economics and lighter customer support requirements.
Gross Margin

Compliance-validated healthcare and industrial training modules serving enterprise customers requiring documented outcome tracking, commanding gross margins around 70 to 80 percent given regulatory certification barriers and multi-year contract lock-in across most accounts.
Gross Margin

Next-generation software incorporating generative AI content creation and adaptive learning personalization, currently commanding premium pricing while regulatory frameworks for AI-driven training validation remain in early, still-developing stages across most jurisdictions.
Gross Margin
united-states-ar-vr-software-market-portfolio-architecture-1788427156388

High-value Sub-segments and Strategic Watch-out

AR/VR Healthcare and Medical Training Software

Healthcare and medical training software combines the fastest segment growth rate in the category with premium certified-tier margins, making it the single most attractive investment target for vendors and investors. MMA expects this segment's revenue share to expand meaningfully faster than any other through 2036, driven by clinical documentation requirements.

Enterprise AR Training and Simulation Software

Enterprise training and simulation software delivers strong premium-tier margins with moderately slower growth than healthcare applications, anchored by manufacturing and logistics workforce development budgets that remain durable even during broader economic slowdowns. Vendors serving this segment benefit from multi-year contract structures and high switching costs once deployed.

VR Gaming and Entertainment Software

Gaming and entertainment software remains the largest single revenue base by installed user count, though margins run considerably lower than enterprise-focused segments given intense price competition and low switching costs among casual consumer users. This segment anchors overall category volume even as its share of total revenue gradually declines.

VR Collaboration and Remote Work Software

Collaboration and remote work software has cooled considerably since its pandemic-era peak, growing well below overall category average as hybrid work patterns matured and enterprise customers reverted to conventional video conferencing tools for routine meetings. Vendors concentrated here risk share erosion unless they diversify into adjacent training applications.

Why Enterprise AR VR Spending Sticks

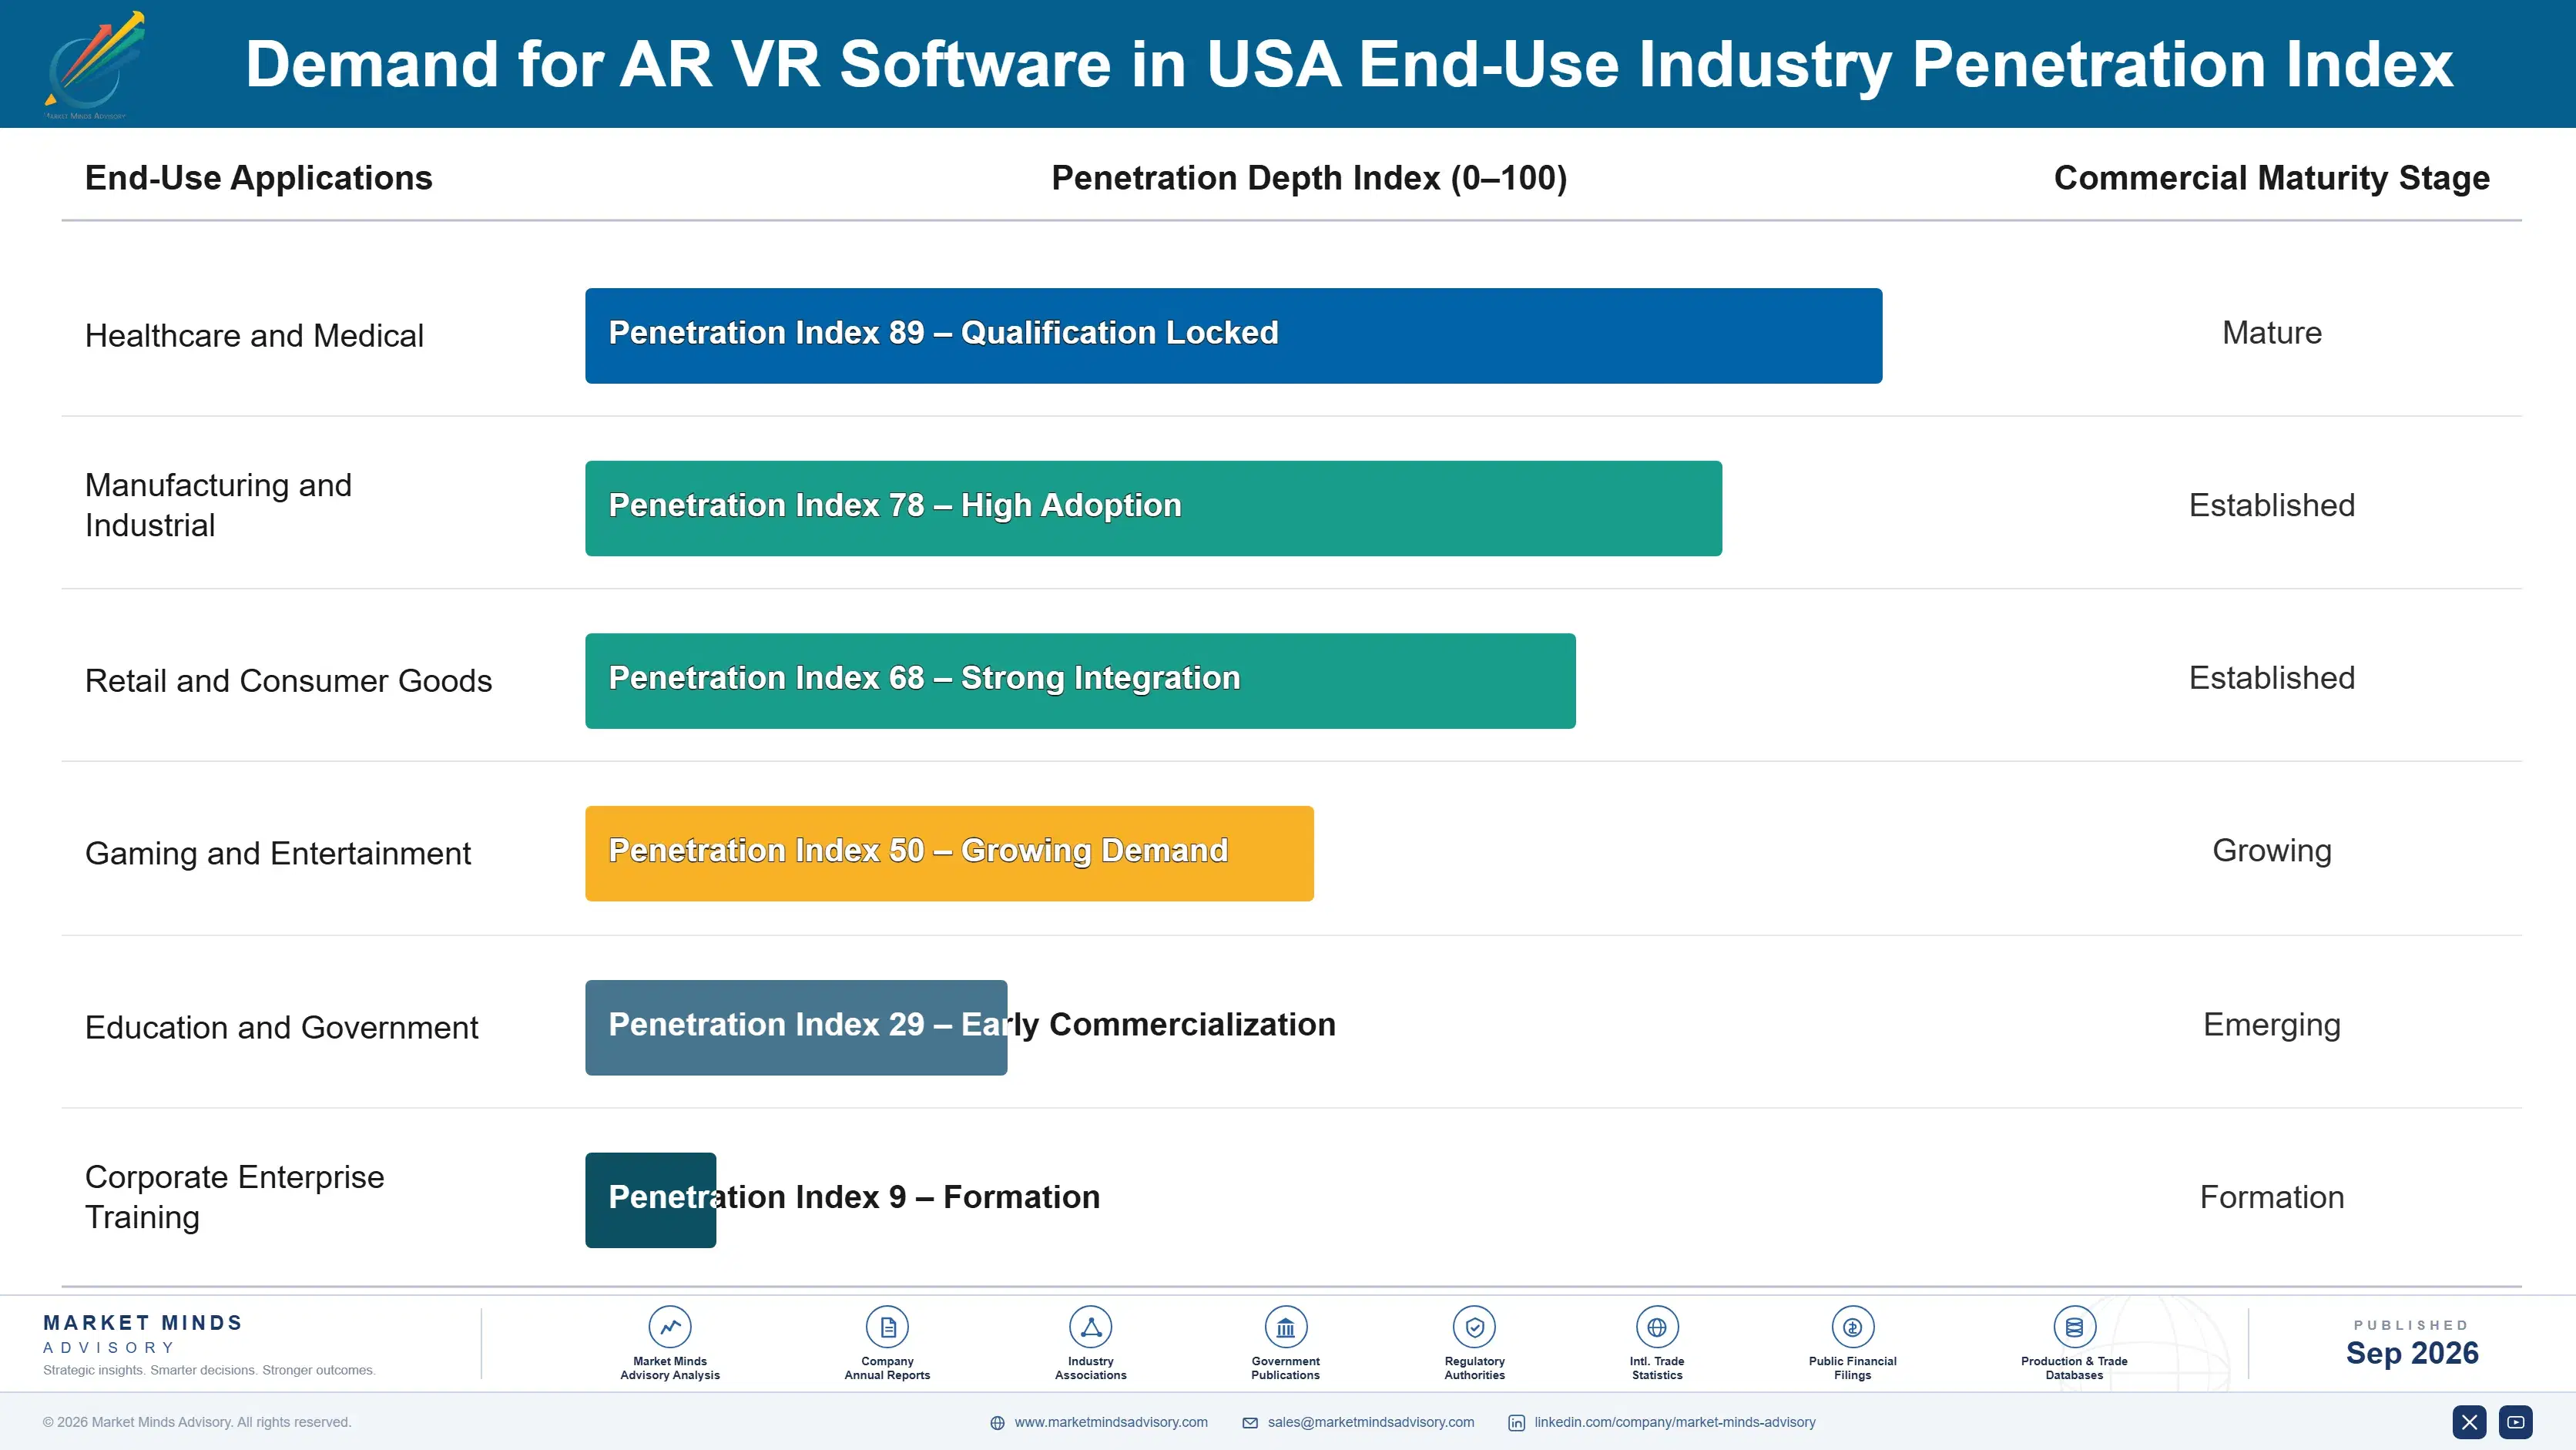
Enterprise AR and VR software increasingly behaves like an annuity business rather than a one-time technology purchase, since customers that successfully deploy training simulation software rarely return to conventional classroom methods once measurable competency gains are documented. Renewal rates for certified enterprise deployments now regularly exceed 85 percent, reflecting genuine embedded workflow dependency rather than simple contractual inertia or switching friction alone.
Adoption stickiness varies considerably by end-use vertical. Healthcare institutions embed simulation software deeply into clinical credentialing pipelines, making vendor switching costly and organizationally disruptive once certification programs depend on a specific platform's content and assessment infrastructure. Manufacturing customers show somewhat shallower stickiness, since equipment-specific training content can migrate between vendors more easily when underlying machinery and procedures remain largely unchanged across supplier transitions.

Buyer profiles are shifting generationally as procurement decisions move from IT departments toward line-of-business training and operations leaders who prioritize measurable outcomes over technical specifications. Younger workforce cohorts entering manufacturing and healthcare roles increasingly expect immersive training as a baseline expectation rather than a novel perk, accelerating institutional buy-in and reducing the change-management resistance that slowed early enterprise deployments considerably.
united-states-ar-vr-software-market-end-use-penetration-index-1788427156870

Where AR VR Bets Pay Off

These are among the four positions where our research anticipates prominent divergence between winners and laggards over the coming forecast period. Each is grounded in the demand model, the regulatory perimeter, and the announced capacity pipeline.
01 / VERTICAL SPECIALIZATION STRATEGY

Prioritize healthcare and industrial verticals over horizontal platform breadth

Vendors chasing broad horizontal platform coverage dilute engineering resources across too many use cases and rarely achieve the outcome documentation depth that regulated verticals genuinely require before committing budget. Healthcare and industrial training software commands materially higher margins and stickier renewal rates precisely because building compliant, outcome-validated content demands sustained specialized investment competitors cannot easily replicate. MMA recommends concentrating product development and go-to-market resources on one or two verticals rather than pursuing consumer and enterprise segments simultaneously with equal intensity.
02 / COMPUTE COST MANAGEMENT

Secure multi-year GPU capacity commitments before demand outpaces available supply

Cloud GPU compute costs represent the largest and most volatile input for vendors running cloud-rendered simulation software at meaningful scale, and shortages during 2024 demonstrated how quickly allocation constraints can disrupt product roadmaps and delay planned releases. Vendors without committed capacity agreements faced feature delays and margin compression that better-positioned competitors with hyperscaler relationships avoided entirely during the same period. MMA recommends securing multi-year capacity commitments now, well before the next demand cycle tightens allocation further across the broader industry.
03 / CONTENT LIBRARY INVESTMENT

Build or acquire proprietary content libraries to deepen switching costs

Bare platform licensing alone increasingly commoditizes as competitors converge on similar core rendering and interaction capability, leaving proprietary content depth as one of the few durable differentiators remaining genuinely available to vendors competing for the same enterprise accounts. Customers strongly prefer avoiding the internal cost of building custom training scenarios, making content libraries a genuine switching cost mechanism rather than a simple feature checkbox item. MMA recommends vendors without strong content assets pursue acquisition or partnership rather than attempting slow, resource-intensive internal development alone.
04 / REGULATORY READINESS PLANNING

Build compliance reporting capability ahead of regulatory mandate expansion

Regulated industries including healthcare and aviation increasingly require documented, auditable training records, and vendors lacking mature compliance reporting infrastructure risk losing enterprise deals to competitors who can demonstrate audit readiness immediately during procurement evaluation cycles across most large accounts. Building this capability retroactively under regulatory or customer pressure costs considerably more than proactive investment made well ahead of mandate expansion across additional verticals and jurisdictions worldwide. MMA recommends vendors treat compliance reporting as core infrastructure investment rather than a deferrable feature.

Engagement Snapshot From the Field

A live engagement with an industry participant carrying material or product regulatory and market exposure ahead of a defining policy shift, showing how our research translates into a defensible multi-year portfolio strategy.
MARKET MINDS ADVISORY · CLIENT ENGAGEMENT SUMMARY
Demand for AR VR Software in USA Producer Strategic Portfolio Review and Transition Roadmap 2026·Investment Scenario on Demand for AR VR Software in USA Exposure Evaluation 2025-26
CLIENT PROFILE
The client is a multi-state hospital network operating dozens of teaching hospitals and outpatient facilities across the United States, serving several million patients annually while training thousands of clinical staff and medical residents each year. Facing rising malpractice insurance costs and residency program accreditation pressure, leadership sought to modernize clinical skills training beyond traditional cadaver labs and supervised bedside instruction alone.
STRATEGIC CHALLENGE
The network's existing training approach relied heavily on limited cadaver lab availability and supervised bedside instruction, creating bottlenecks that extended resident certification timelines and increased liability exposure from undertrained staff performing procedures with insufficient practice repetitions. Leadership needed to evaluate whether AR and VR simulation software could realistically replace or substantially supplement existing training infrastructure without compromising clinical outcome quality.
MMA APPROACH
MMA conducted a structured vendor evaluation combining expert interviews with training directors, competitive benchmarking across five leading simulation software platforms, and analysis of documented clinical outcome data from peer institutions that had already deployed comparable systems. The engagement produced a phased adoption roadmap prioritizing highest-risk procedural specialties first, based on liability exposure and current bottleneck severity.
KEY FINDINGS
  1. Peer institutions using certified simulation software reported training completion timelines shortening by approximately 30 percent (client-reported, unverified by MMA), primarily by reducing scheduling bottlenecks tied to limited cadaver lab availability.
  2. Vendor pricing models varied considerably, with per-seat licensing costing meaningfully more than enterprise-wide site licenses once deployment exceeded roughly 200 concurrent trainees across multiple hospital locations.
  3. Clinical staff reported higher confidence scores following simulation-based training compared to traditional methods alone, though sample sizes at individual pilot sites remained too small for statistically reliable conclusions.
  4. Integration with existing electronic health record and credentialing systems proved more technically complex than most vendors initially represented during sales evaluation, extending typical implementation timelines by several months.
CLIENT PROFILE
The client is a multi-state hospital network operating dozens of teaching hospitals and outpatient facilities across the United States, serving several million patients annually while training thousands of clinical staff and medical residents each year. Facing rising malpractice insurance costs and residency program accreditation pressure, leadership sought to modernize clinical skills training beyond traditional cadaver labs and supervised bedside instruction alone.
STRATEGIC CHALLENGE
The network's existing training approach relied heavily on limited cadaver lab availability and supervised bedside instruction, creating bottlenecks that extended resident certification timelines and increased liability exposure from undertrained staff performing procedures with insufficient practice repetitions. Leadership needed to evaluate whether AR and VR simulation software could realistically replace or substantially supplement existing training infrastructure without compromising clinical outcome quality.
MMA APPROACH
MMA conducted a structured vendor evaluation combining expert interviews with training directors, competitive benchmarking across five leading simulation software platforms, and analysis of documented clinical outcome data from peer institutions that had already deployed comparable systems. The engagement produced a phased adoption roadmap prioritizing highest-risk procedural specialties first, based on liability exposure and current bottleneck severity.
KEY FINDINGS
  1. Peer institutions using certified simulation software reported training completion timelines shortening by approximately 30 percent (client-reported, unverified by MMA), primarily by reducing scheduling bottlenecks tied to limited cadaver lab availability.
  2. Vendor pricing models varied considerably, with per-seat licensing costing meaningfully more than enterprise-wide site licenses once deployment exceeded roughly 200 concurrent trainees across multiple hospital locations.
  3. Clinical staff reported higher confidence scores following simulation-based training compared to traditional methods alone, though sample sizes at individual pilot sites remained too small for statistically reliable conclusions.
  4. Integration with existing electronic health record and credentialing systems proved more technically complex than most vendors initially represented during sales evaluation, extending typical implementation timelines by several months.
RECOMMENDED STRATEGY
Phase 1: Pilot certified simulation software within the two highest-liability surgical specialties first, measuring documented competency outcomes against existing cadaver lab training methods over two full academic terms. Phase 2: Expand deployment to five additional clinical specialties following successful pilot validation, negotiating enterprise-wide licensing terms once concurrent trainee volume justifies moving away from per-seat pricing structures. Phase 3: Integrate simulation training completion data directly into credentialing and accreditation reporting systems, creating a permanent institutional capability rather than a temporary pilot program initiative.
OUTCOME
(Client-reported, unverified by MMA) The pilot program reduced average resident certification timelines by an estimated 25 percent within the two participating surgical specialties while maintaining comparable clinical competency assessment scores against traditional training cohorts. Leadership subsequently approved expanded funding for a broader institution-wide rollout across five additional clinical departments beginning the following academic year.

Frequently Asked Questions

Foundational context covering the market sizes, CAGR, scope, country, region and competition that inform every finding below. This section is provided to cover basics and most often pre-purchase conversations, answered from the MMA Primary Research Dataset.

What is the current size of the Demand for AR VR Software in USA?

The Demand for AR VR Software in USA market reached an estimated $18.5 billion in 2025, reflecting strong enterprise adoption in healthcare training, manufacturing simulation, and consumer entertainment applications nationwide.

How large will the Demand for AR VR Software in USA be by 2036?

MMA projects the market will reach approximately $58.3 billion by 2036, driven by sustained enterprise investment in training simulation software and expanding healthcare and industrial deployment across multiple verticals.

What is the CAGR for the Demand for AR VR Software in USA 2026 to 2036?

The market is expected to grow at a compound annual growth rate of 11.0 percent between 2026 and 2036, reflecting sustained enterprise demand for measurable training outcomes rather than novelty adoption.

Which segment is growing fastest?

AR and VR healthcare and medical training software is the fastest-growing segment, expanding at approximately 16.0 percent annually, roughly 1.45 times the overall market growth rate as clinical training budgets accelerate.

Who are the major companies in the Demand for AR VR Software in USA?

Leading participants include Meta Platforms, Apple, Microsoft, Unity Software, and PTC, together holding an estimated 45 percent of category revenue on a consistent revenue basis across enterprise and consumer segments.

Which country is growing fastest?

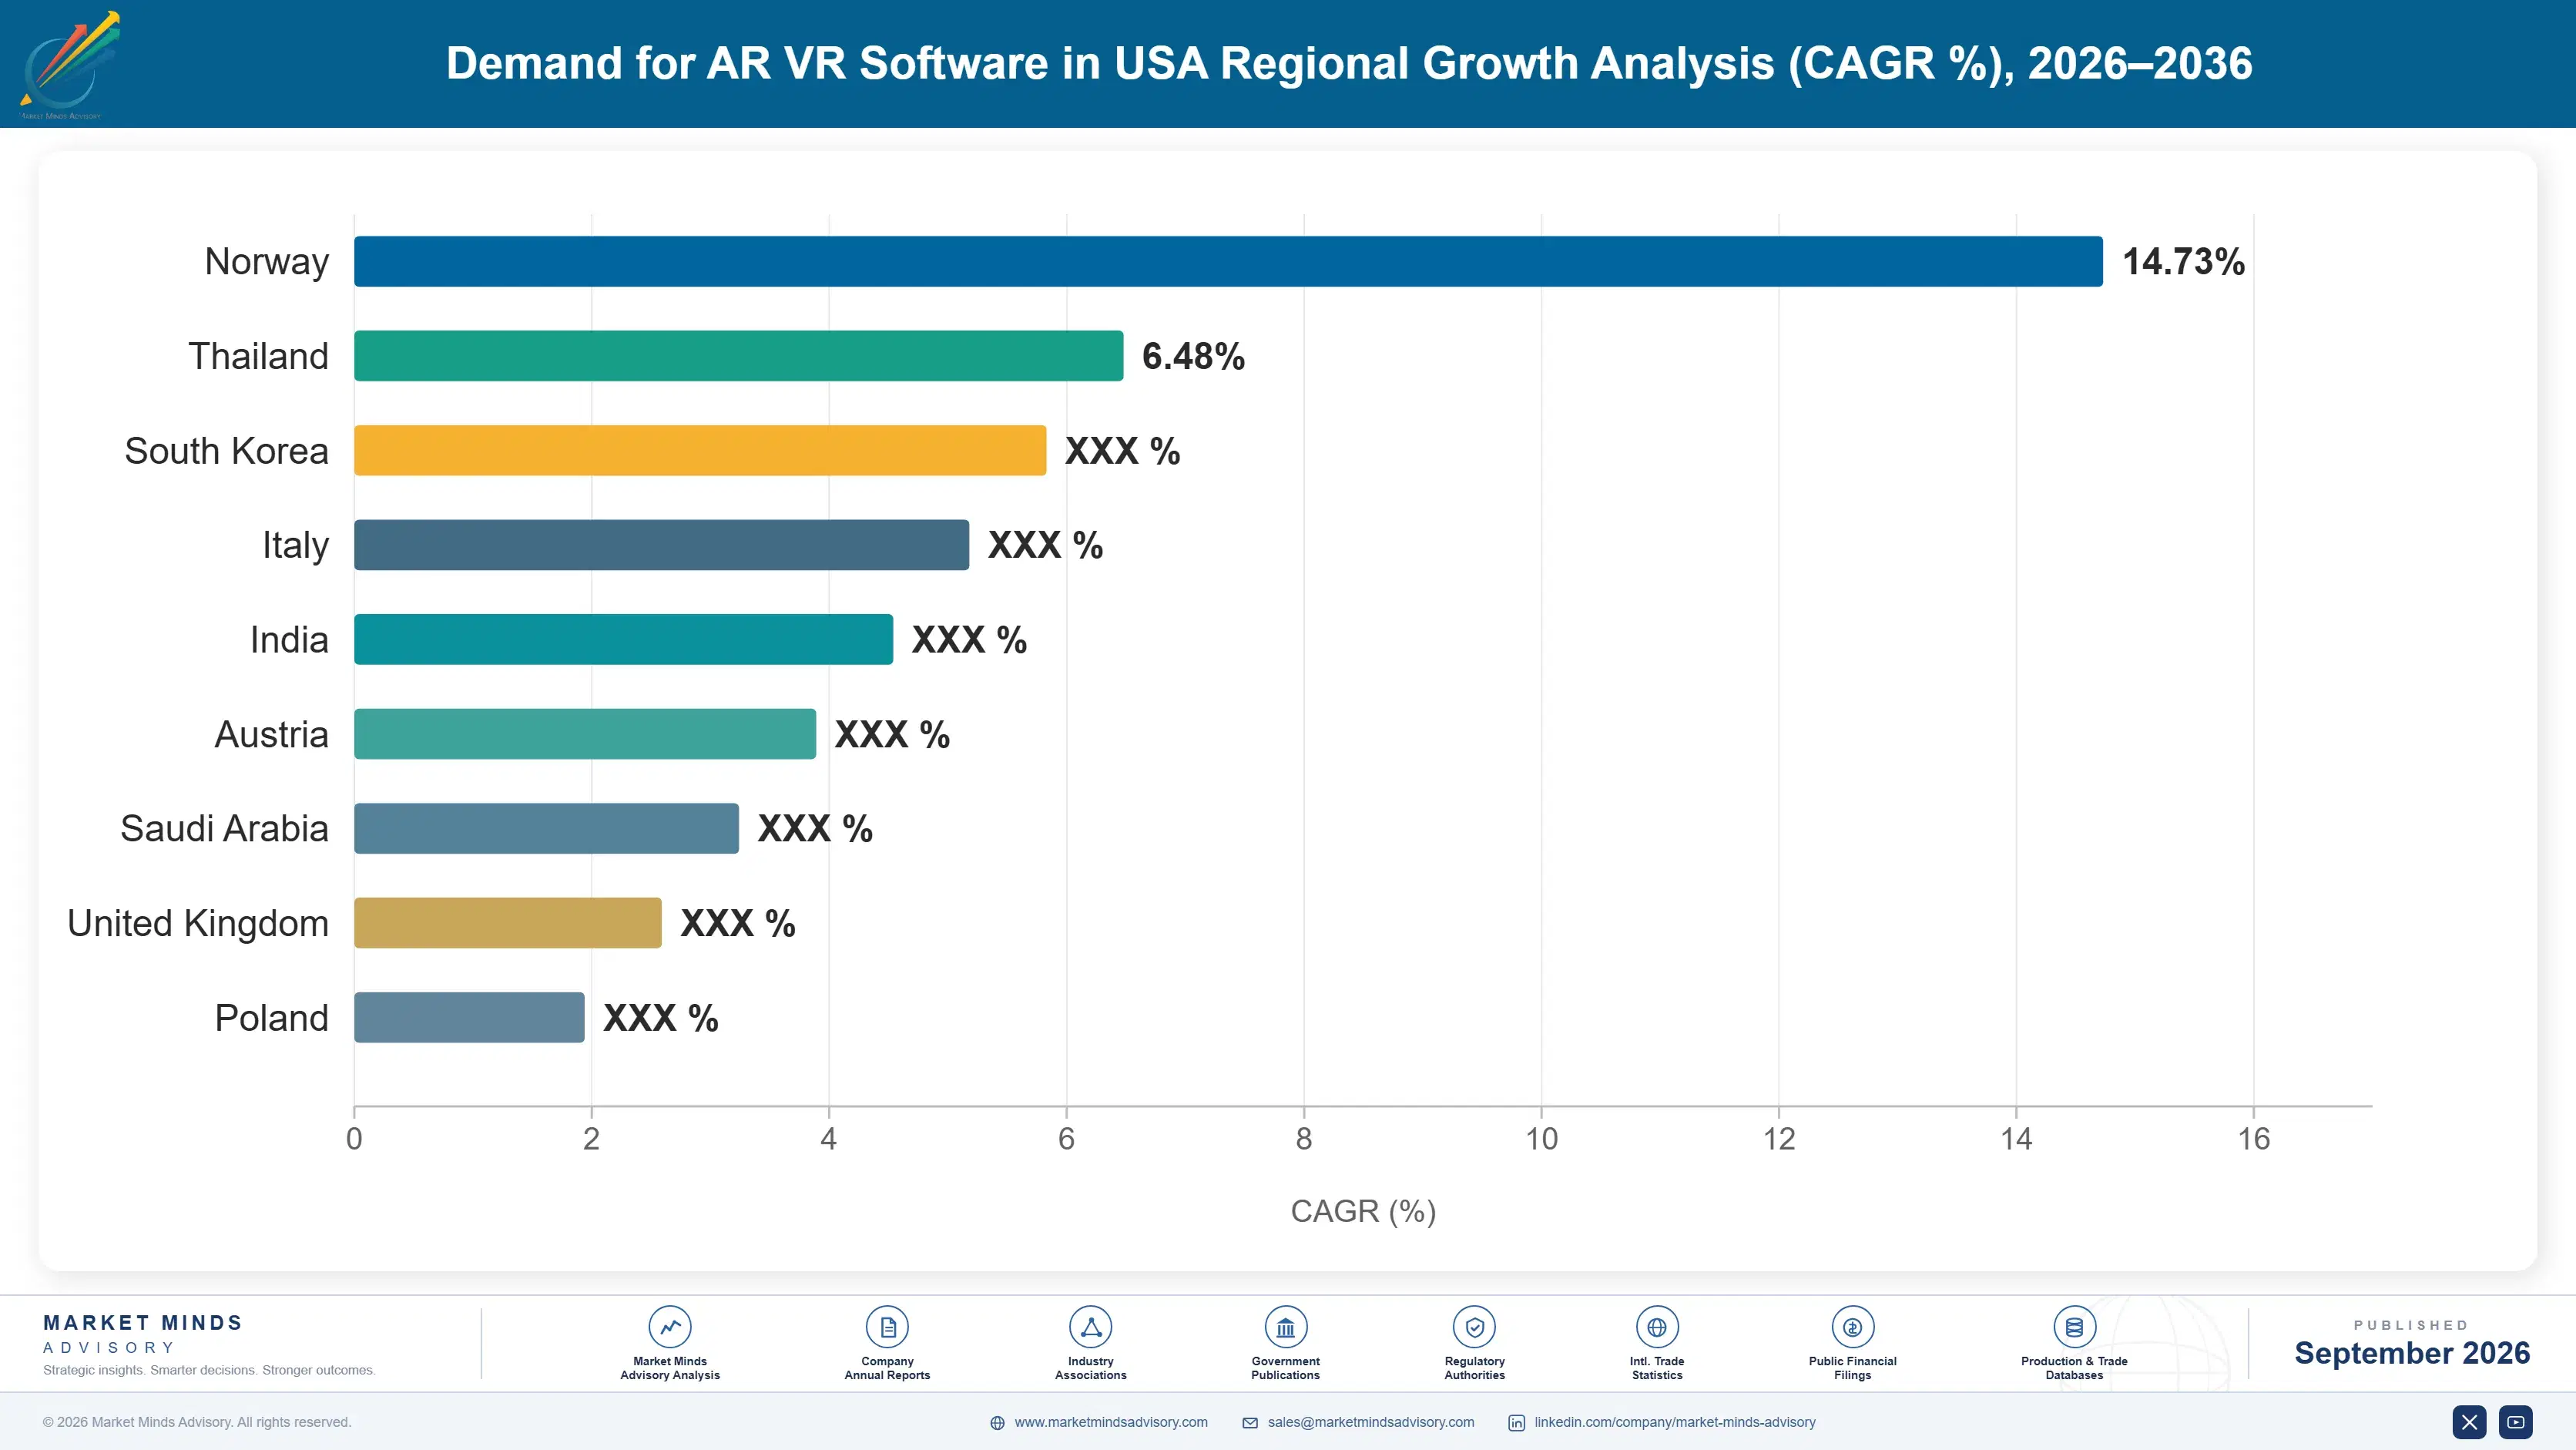
India shows the fastest national growth trajectory at approximately 14.5 percent annually, driven by technology outsourcing firms and rapidly expanding manufacturing sector adoption of workforce training software nationwide.

Report Segmentation Architecture

The full report scope spans multiple orthogonal segmentation dimensions, with cross-tabulated demand data provided for each dimension pair. Coverage extends further to regional breakdowns, trend trajectories, and the competitive detail needed to support segment-level decision-making.

By Primary Market Dimension

  • AR/VR Healthcare and Medical Training Software
  • Enterprise AR Training and Simulation Software
  • VR Gaming and Entertainment Software
  • AR Retail and Consumer Shopping Applications
  • AR/VR Content Creation and Development Tools
  • VR Collaboration and Remote Work Software

By End-Use Industry

  • Healthcare and Medical
  • Manufacturing and Industrial
  • Retail and Consumer Goods
  • Gaming and Entertainment
  • Education and Government
  • Corporate Enterprise Training

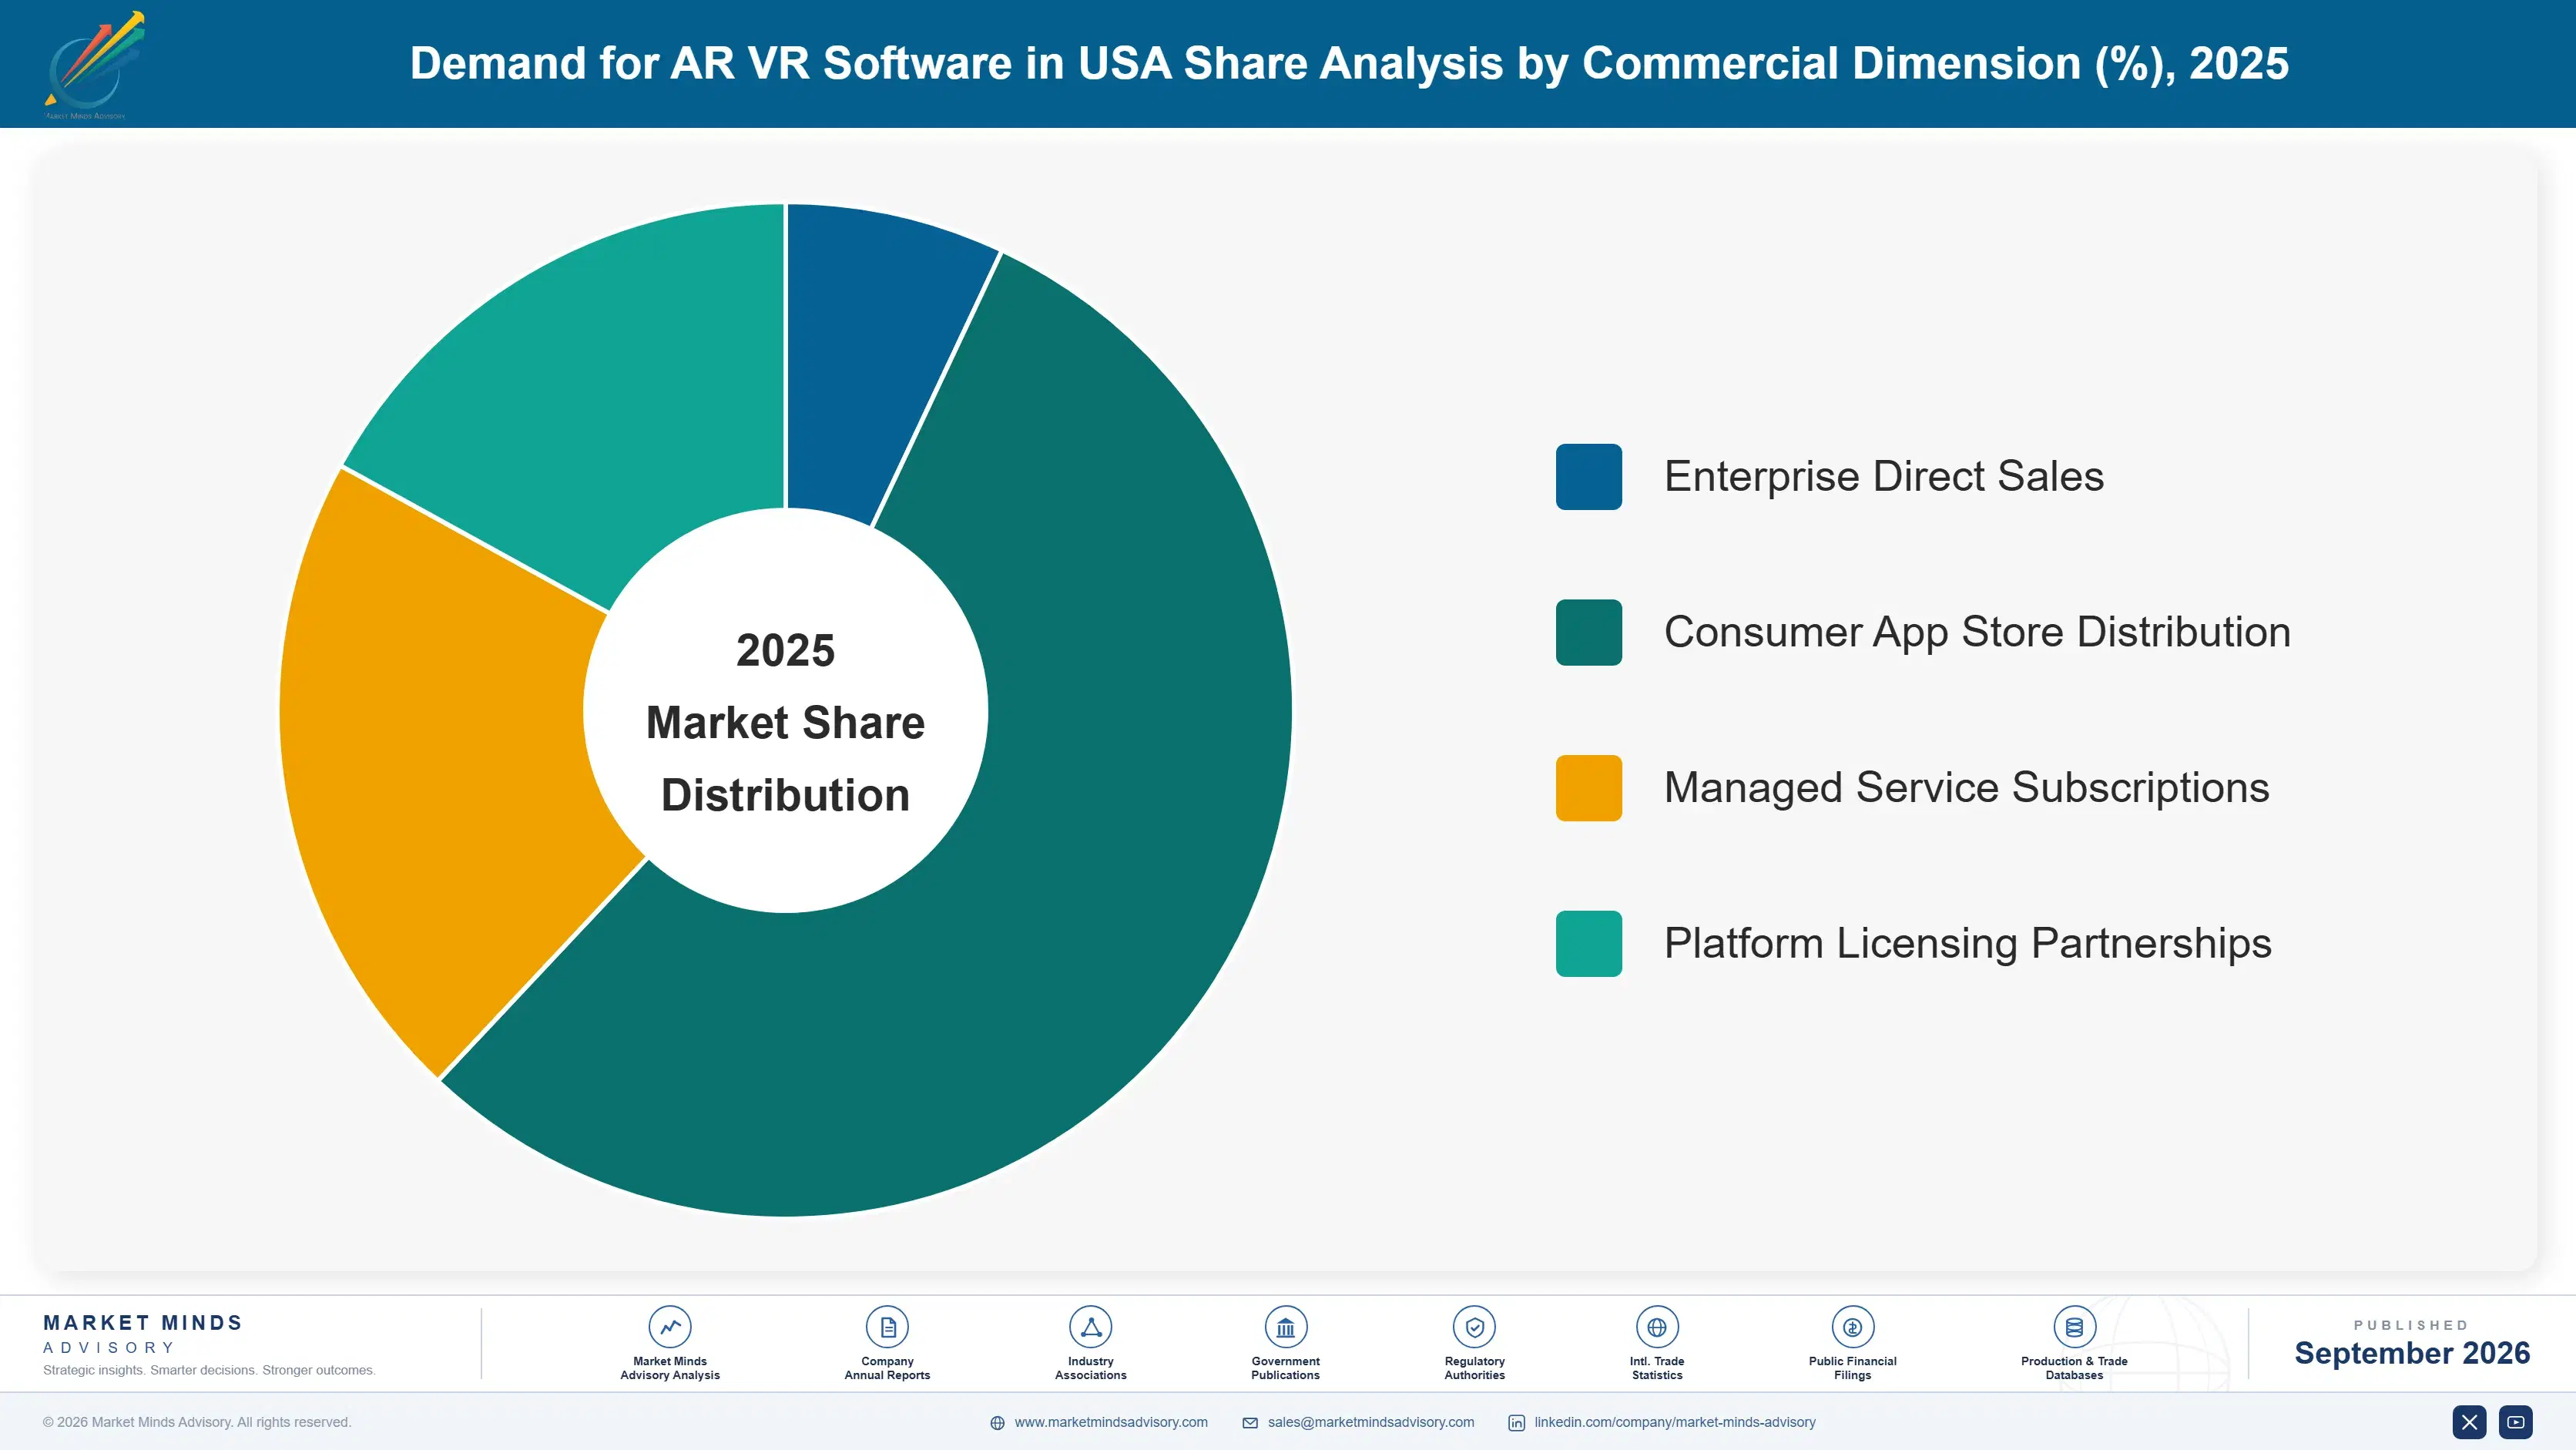
By Commercial Dimension

  • Enterprise Direct Sales
  • Consumer App Store Distribution
  • Managed Service Subscriptions
  • Platform Licensing Partnerships

By Region

  • North America
  • Western Europe
  • East Asia
  • South Asia and Pacific
  • Latin America
  • Middle East and Africa
  • Eastern Europe

Scope, Methodology, and Coverage

Every figure in this report is reproducible from documented input assumptions. The scope below maps the historical period, the forecast horizon, the segmentation dimensions, and the countries covered, alongside the underlying primary and qualitative methodology.
Historical Period
2020 to 2025
Forecast Period
2026 to 2036
Base Year
2025 (USD billions; MMA Primary Research Dataset, September 2026)
Market Definition
The Demand for AR VR Software Market covers application software, development platforms, and content specifically designed for augmented reality and virtual reality hardware devices, measured by software licensing and subscription revenue. It excludes the underlying AR and VR hardware devices themselves and general software unrelated to spatial computing or immersive display technology.
Quantitative Units
USD billions, market share percentage, CAGR percentage
Segmentation Dimensions
By Primary Market Dimension, By End-Use Industry, By Commercial Dimension, By Region
Regions Covered
North America, Western Europe, East Asia, South Asia and Pacific, Latin America, Middle East and Africa, Eastern Europe
Countries Covered
United States, Canada, Germany, United Kingdom, France, China, Japan, South Korea, India, Australia, Brazil, Mexico, United Arab Emirates, Saudi Arabia, South Africa, Poland
Key Companies Profiled
Meta Platforms, Apple Inc., Microsoft Corporation, Unity Software, PTC Inc., Google, Niantic, Varjo, HTC Vive, Magic Leap, Vuzix Corporation, Snap Inc., Qualcomm, NVIDIA Corporation, Autodesk, Adobe, Zoom Video Communications, Strivr, Talespin, Osso VR
Quantitative Methodology
Primary survey, n=3,800 respondents, Q4 2025, six countries; demand-side model with trade association cross-validation
Qualitative Methodology
47 expert interviews, Q4 2025; applied to validate demand model assumptions, identify emerging dynamics, and assess competitive positioning
Report Format
PDF and XLSX data workbook (Word format preview document)
Publisher
Market Minds Advisory
Report Code
MMA-2026-TEC-641
Published
September 2026
Contact
sales@marketmindsadvisory.com | www.marketmindsadvisory.com

Purchase the full Demand for AR VR Software in USA Report (2026 to 2036).

The full report provides comprehensive market sizing, ten-year forecasts, competitive benchmarking, and regional analysis for AR and VR enterprise and consumer software, drawing on primary survey data and expert interviews across major adopting industries. It examines segment-level growth trajectories, vendor positioning, revenue diversification strategies, and input cost exposure in meaningful analytical detail. Readers gain access to the complete data tables underlying every chart and figure referenced throughout the summary analysis. The report also includes an extended case study and a detailed methodology appendix describing survey design and data validation procedures.
Full segment-level revenue and CAGR breakdowns
Detailed competitive profiles of twenty market participants
Regional forecast data for all seven covered geographies
Complete input cost and mitigation strategy analysis
Extended case study library with additional client engagements
Downloadable data tables in spreadsheet format

Built For The People Who Decide

From boardroom strategy to bench-side execution, this report is read cover-to-cover by leaders shaping the next decade of their industry, turning demand scenarios, market dynamics and valuation benchmarks into decisions.
CXOs/ Presidents/ VPs/ Managers
M&A and Corporate Development
Strategy Teams and R&D Heads
Procurement and Product Directors
Regulatory and Compliance Leaders
Investor Relations and Equity Analysts