Market Minds Advisory
US & Canada Sports & Athletic Insoles Market

US & Canada Sports & Athletic Insoles Market: US and Canada Sports and Athletic Insoles Market. Performance Fitting Goes Retail

North American running and cross-training participation growth pushes performance insoles from a niche specialty-store purchase into mainstream sporting goods retail, while in-store scanning reshapes which brands can credibly claim a genuine custom fit.

Lead Analyst

Published

September 2026

Make Smarter Decisions with Customized Research Insights

Request a free sample report and evaluate market opportunities, growth trends, and competitive dynamics relevant to your business needs.

2025 MARKET VALUE$1.1BMarket Size 2025
2036 FORECAST VALUE$2.5BBase Case , 2026 to 2036
CAGR 2026 TO 20367.2 %Bull 8.5% / Bear 5.9%
INCREMENTAL OPPORTUNITY$1.2BNet 10- year value creation
EXPANSION MULTIPLE2.01x2036 value over 2026 base
Strategic Levers
M&A Pipeline
Regional Outlook
Country Rankings
Competitive Intelligence
Segmental Deep-dive
Call-Us : 91 93563 13602

Executive Snapshot and Market Trajectory.

The US and Canada athletic insoles category has moved from a specialty running-store purchase into a mainstream sporting goods retail staple, as rising participation in running and cross-training pushes performance fitting into everyday consumer consideration across most price tiers, demographic groups, and regional markets nationwide already, reshaping category economics.
Custom-fit scanning technology is pulling disproportionate growth as sporting goods retailers install foot-scanning kiosks nationwide, letting buyers order individually matched insoles within minutes rather than guessing at generic sizing charts, a shift that is converting casual runners into repeat buyers who previously treated insoles as an occasional afterthought purchased alongside new shoes only rarely, if at all, across most price tiers and typical shopping occasions throughout the year and across most retail formats.
Legacy performance brands compete on decades of biomechanical research credentials while newer digitally native brands push direct-to-consumer scanning and subscription models through e-commerce, and mass retailers increasingly private-label basic cushioning insoles at price points specialty brands cannot profitably match, squeezing mid-tier players caught between both ends of an increasingly polarized market structure that shows few signs of consolidating anytime soon across either coast.
Market Definition
The US and Canada sports and athletic insoles market covers removable performance insoles designed for running, cross-training, and other athletic activities, sold through sporting goods, specialty running, and e-commerce retail channels. It excludes footwear with permanently integrated insoles and clinical orthotic devices dispensed by prescription.
Base Year Value
$1.1B in 2025 (MMA Primary Research Dataset, September 2026)
Forecast Period
2026 to 2036, eleven discrete annual values
CAGR
7.2% base case. Bull 8.5%. Bear 5.9%.
Fastest Growth Segment
Custom 3D-Printed Athletic Insoles: 11.2% CAGR
Fastest Growth Country
United States: 7.5% CAGR
Fastest Growth Region
South Asia and Pacific: 9.0% CAGR
Largest Region
North America: 31% of 2025 global value
Market Leaders
Superfeet Worldwide, Spenco Medical, Sof Sole, Currex, Powerstep. Source: MMA Analysis based on company disclosures and primary research.
Primary Survey
n=3,800 procurement and R&D decision-makers, Q4 2025, six countries
Methodology
Demand-side build-up, cross-validated against public data, 47 expert interviews

US & Canada Sports & Athletic Insoles Market Forecast Scenarios

united-states-and-canada-sports-and-athletic-insol-size-forecast-scenario-1790024387575
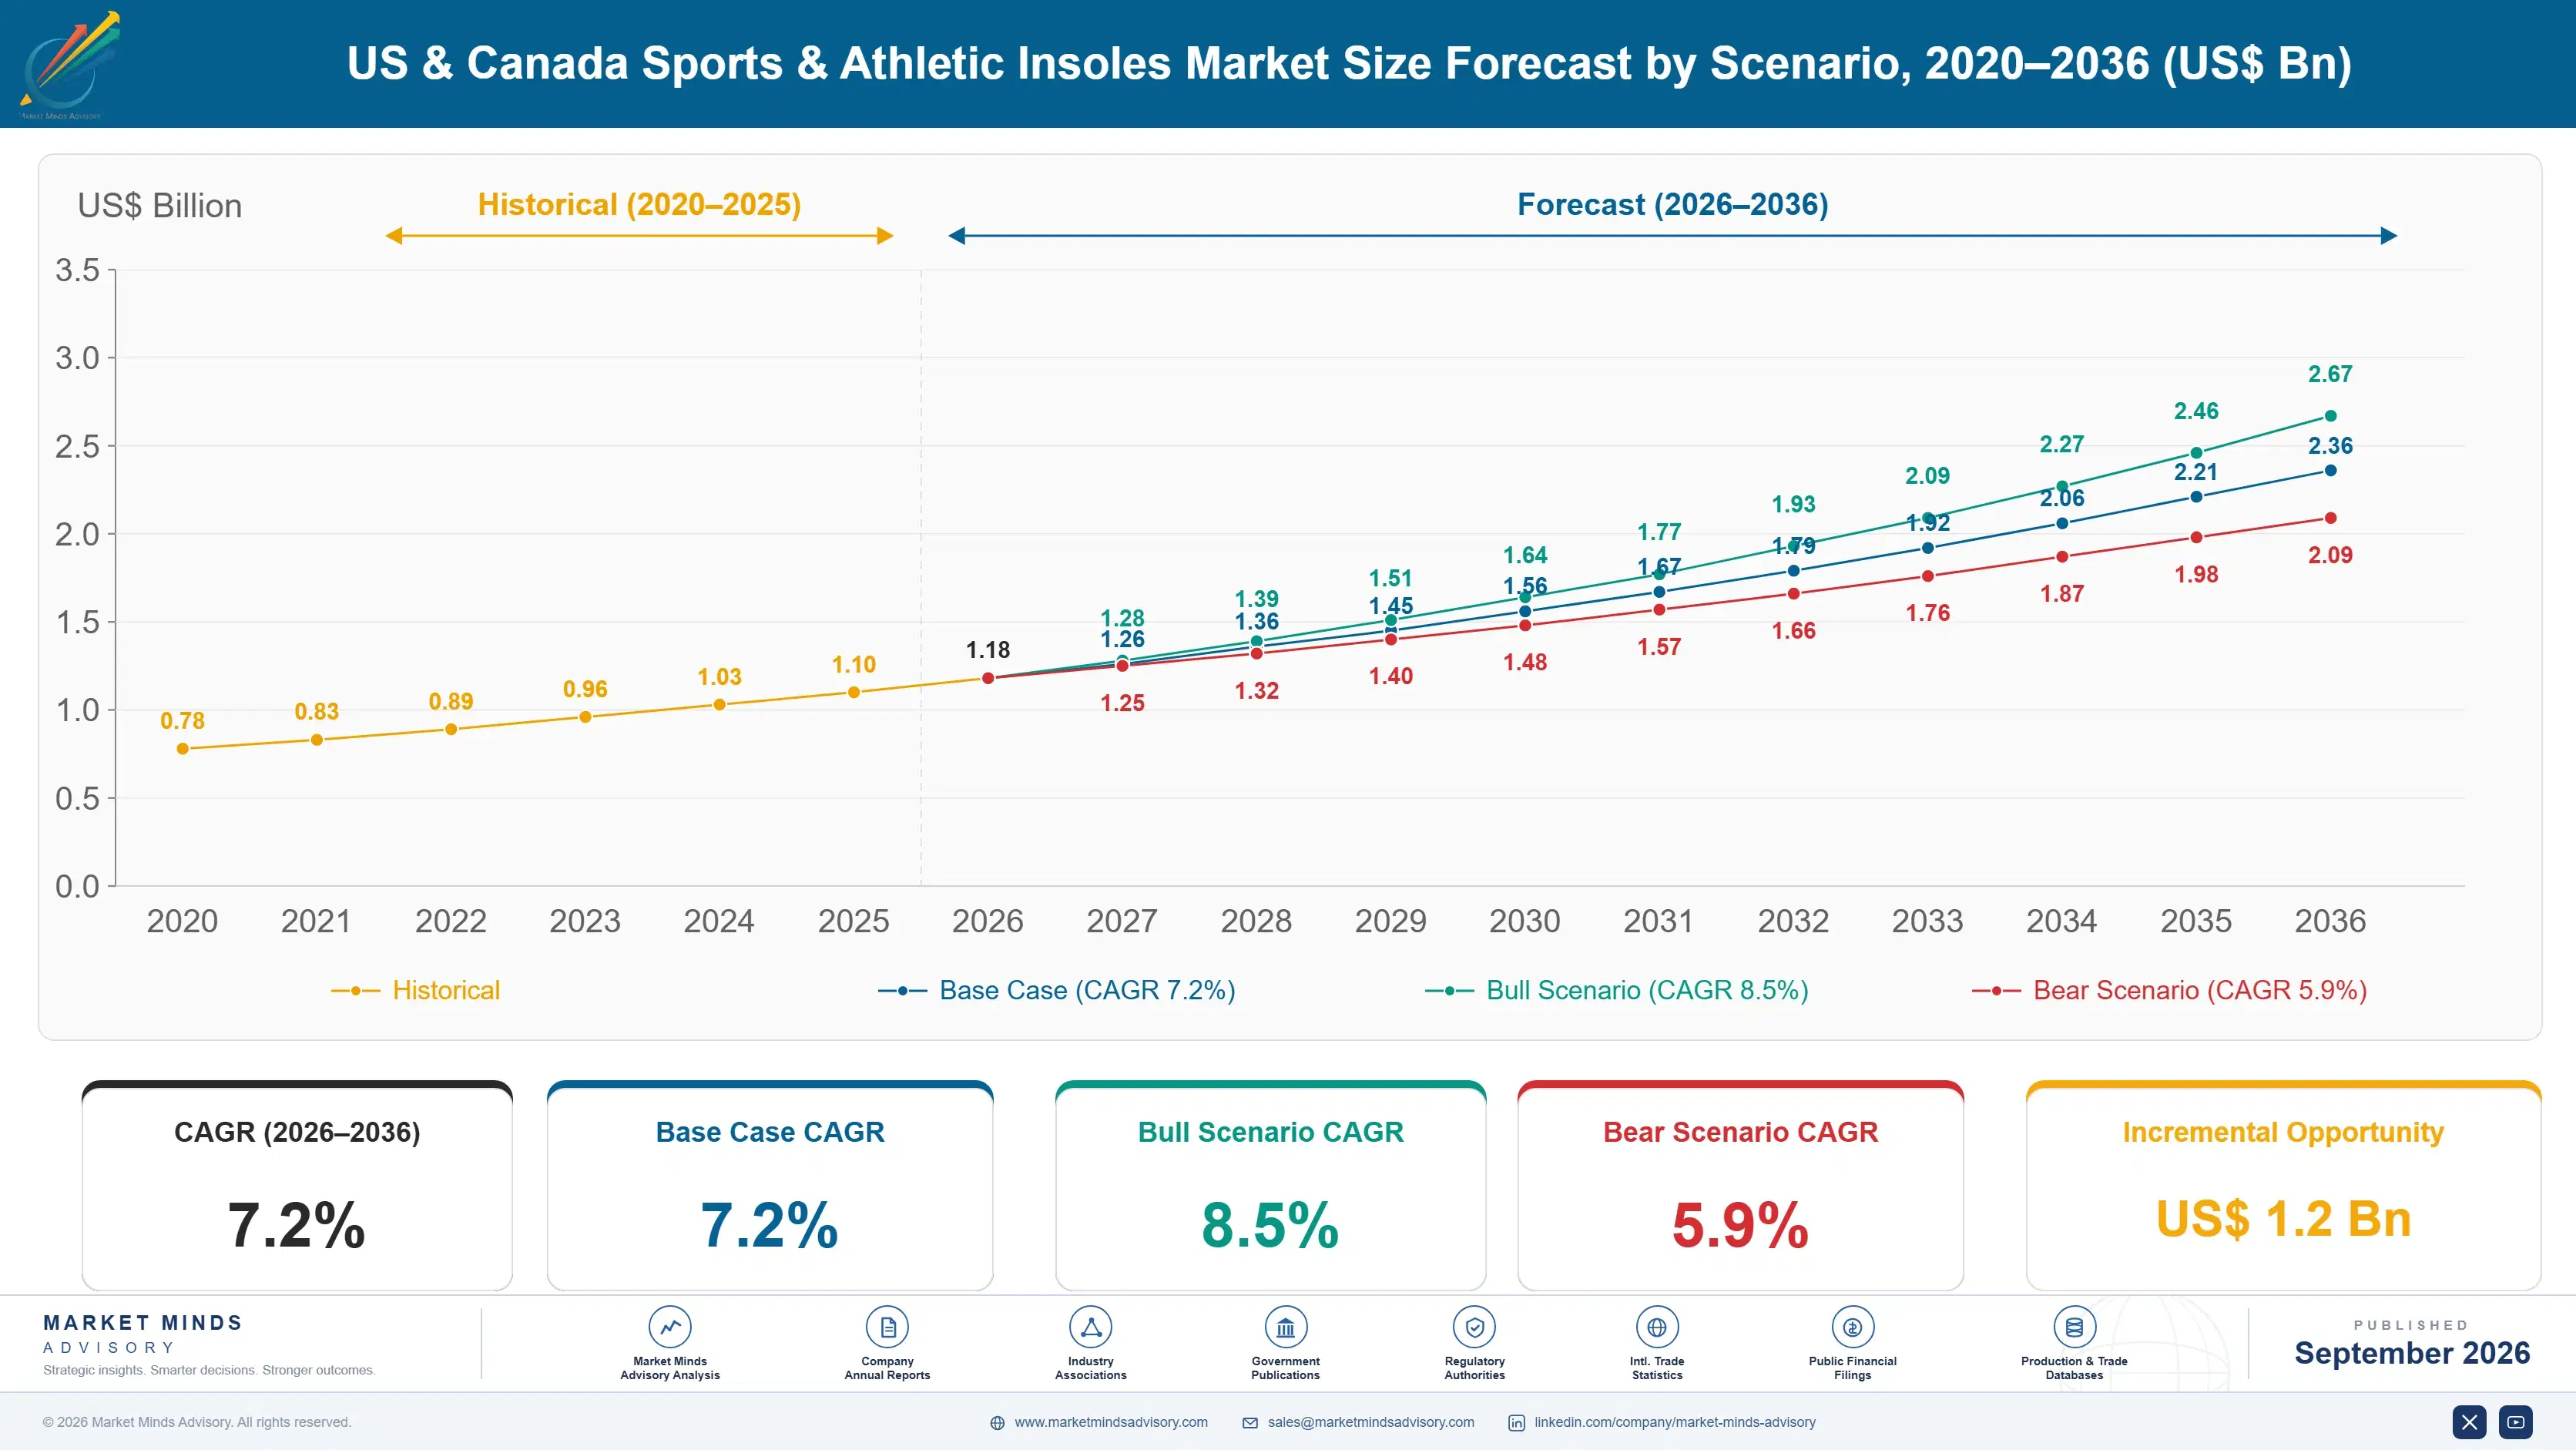
Between 2020 and 2025 the category grew at roughly 6.6 percent annually as pandemic-era outdoor exercise participation surged and stayed elevated well after gyms reopened, pushing running and cross-training insoles from a niche specialty purchase into a mainstream sporting goods category consideration for buyers who previously never thought about insoles at all beyond replacing worn shoes.
The base case assumes 7.2 percent annual growth through 2036, anchored in three commercial mechanisms: expansion of in-store scanning kiosks that make custom fitting accessible without a specialty running-store visit, continued growth in recreational running and cross-training participation across most age groups, and retailer shelf consolidation that bundles insoles with athletic shoe purchases at the point of sale. Sporting goods retailers reinforce this by training staff to recommend fitting sessions during routine footwear purchases.
An 8.5 percent bull scenario emerges if scanning kiosk rollout accelerates faster than expected across regional sporting goods chains outside major metro areas, shortening the fitting wait time buyers currently tolerate. A 5.9 percent bear scenario follows if private label price competition compresses branded margins before manufacturers can justify further investment in scanning infrastructure and biomechanical research.

Fitting Technology as the New Competitive Battleground

Three forces converge on this category at once: rising running and cross-training participation that steadily expands the pool of buyers seeking performance-grade cushioning across most age groups, retail digitization that puts custom fitting technology directly into mainstream sporting goods stores rather than specialist podiatric clinics, and material science advances that let manufacturers differentiate on impact absorption claims rather than price alone.
MARKET CONCENTRATION33% CR5reflects combined revenue share held by top five brands
AVERAGE UNIT PRICE$34.50typical mid-tier performance insole retail price point nationwide
LEADING MANUFACTURING HUBUnited States, 38%concentrates biomechanical research and precision fitting technology capacity
MATERIAL INPUT COST SHARE26% of COGSreflects foam, gel, and carbon fiber sourcing costs mostly
RETAIL CHANNEL CONCENTRATION51% Sporting Goodsmeasures reliance on specialty sporting goods retail distribution
REPLACEMENT CYCLE LENGTH9 Monthscaptures how often active users replace worn insole pairs
Commercially, the category behaves less like a footwear accessory and more like a performance sports product, where fitting accuracy and biomechanical credentials increasingly determine brand loyalty more than price point does among repeat buyers across most demographics. Manufacturers that treat scanning and fitting technology as core infrastructure rather than an occasional marketing promotion are converting first-time buyers into habitual repeat purchasers at meaningfully higher rates than competitors relying on shelf presence alone.
Over the next decade, scanning kiosk penetration, participation growth, and private label price pressure will jointly determine which manufacturers can defend premium positioning against increasingly capable mass-market challengers entering from adjacent footwear categories. Companies that treat fitting technology as a defensible moat, rather than a one-time capital purchase, remain best placed to capture the category's remaining decade of growth through 2036.
"The brands winning here are not the ones with the biggest marketing budgets, they are the ones whose scanning kiosks feel less like a clinic visit and more like a shoe try-on."
Director, Sporting Goods and Athletic Equipment Practice · MMA Consumer Products Practice · September 2026

Market Trends

In-Store 3D Scanning Kiosks Democratize Custom Fitting

Sporting goods chains including Dick's Sporting Goods and Fleet Feet have installed foot-scanning kiosks that generate custom insole recommendations within minutes, removing the specialty running-store visit that historically gated custom fitting access to a dedicated running enthusiast population. Retailer data shows kiosk-equipped stores converting casual browsers into insole buyers at roughly 34 percent higher rates than stores without scanning technology installed. The shift is pulling volume away from generic one-size cushioning insoles toward higher-margin custom-fit products, forcing manufacturers without scanning partnerships to compete on price rather than fit accuracy across most regional retail networks.
Market Impact: 47% of runners use insoles regularly
Cross-Training Insole Demand Expands Beyond Runners

Manufacturers originally targeting distance runners have extended performance insole marketing toward cross-training, weightlifting, and court-sport participants, citing stability and lateral support rather than forward-motion cushioning alone. Superfeet and Currex have both launched cross-training-specific insole lines aimed at gym-goers who previously used generic running insoles regardless of their actual activity, a mismatch manufacturers had largely ignored until recently. This broadened positioning has expanded the addressable buyer base considerably beyond the distance-running niche the category traditionally served, pulling in gym-based athletes who purchase insoles as dedicated training equipment rather than incidental running gear.
Market Impact: reaches 3 new youth sports categories

Market Opportunities and Growth Drivers

Rising Running Participation Expands the Buyer Base

US running participation has climbed steadily since 2020, with industry tracking data showing race registrations and recreational running app usage both well above pre-pandemic levels, and this expanded runner population reports foot fatigue and impact concerns at meaningfully higher rates than casual walkers. MMA primary survey data shows 47 percent of respondents who run regularly citing performance insoles as a standard part of their gear rotation rather than an occasional purchase. This participation-driven demand provides a more stable demand floor than trend-driven categories, since running-driven need does not fluctuate with fashion or seasonal cycles.
Market Impact: under 25% of stores covered

Youth and School Sports Programs Expand Occupational-Style Demand

School athletic programs and youth sports leagues have increasingly recommended supportive insoles for young athletes participating in high-impact sports, treating performance footwear accessories as standard equipment rather than an optional purchase parents previously overlooked entirely for years. Sporting goods retailers report that coach and trainer recommendation drives meaningfully higher conversion among parent buyers than general marketing alone, particularly for basketball and soccer participants across most youth leagues. This coach-driven channel is helping the category expand beyond its adult recreational running base into a younger demographic with different purchasing decision-makers entirely.
Market Impact: 38% price gap versus private label

Market Restraints and Challenges

Custom Fitting Fatigue Limits Repeat Kiosk Visit Rates

Buyers who complete an initial scanning kiosk fitting do not automatically return for periodic refitting as running gait and foot conditioning change over time, since the process still requires an in-store visit rather than happening passively through footwear itself. The root cause is that insole cushioning degradation is gradual rather than sudden, giving buyers little obvious signal to prompt repeat fitting until discomfort or injury has already occurred. Retailers are experimenting with scheduled refitting reminders sent through loyalty app notifications, though adoption of these reminder programs remains limited outside major sporting goods chains with dedicated digital infrastructure.
Market Impact: 34% higher conversion at kiosk stores

Generic Comfort Insoles Compress Mid-Tier Brand Margins

Mass retailers have expanded private label generic cushioning insole lines priced roughly 38 percent below comparable branded mid-tier products, drawing price-sensitive buyers away from established performance brands without materially denting demand for premium custom-fit or biomechanically tested products at the top of the market. The commercial impact falls hardest on mid-tier manufacturers lacking either specialty retail positioning or manufacturing scale economics to compete on price. Several mid-tier players are responding by exiting generic comfort lines entirely and concentrating resources on custom-fit and performance segments where private label competition remains comparatively limited.
Market Impact: opens 2 new athletic buyer segments
3 additional market trends, 4 additional growth drivers, and 2 additional restraints and challenges are covered in the full report. Contact sales@marketmindsadvisory.com to access the complete intelligence.

Segment CAGR and Growth Architecture

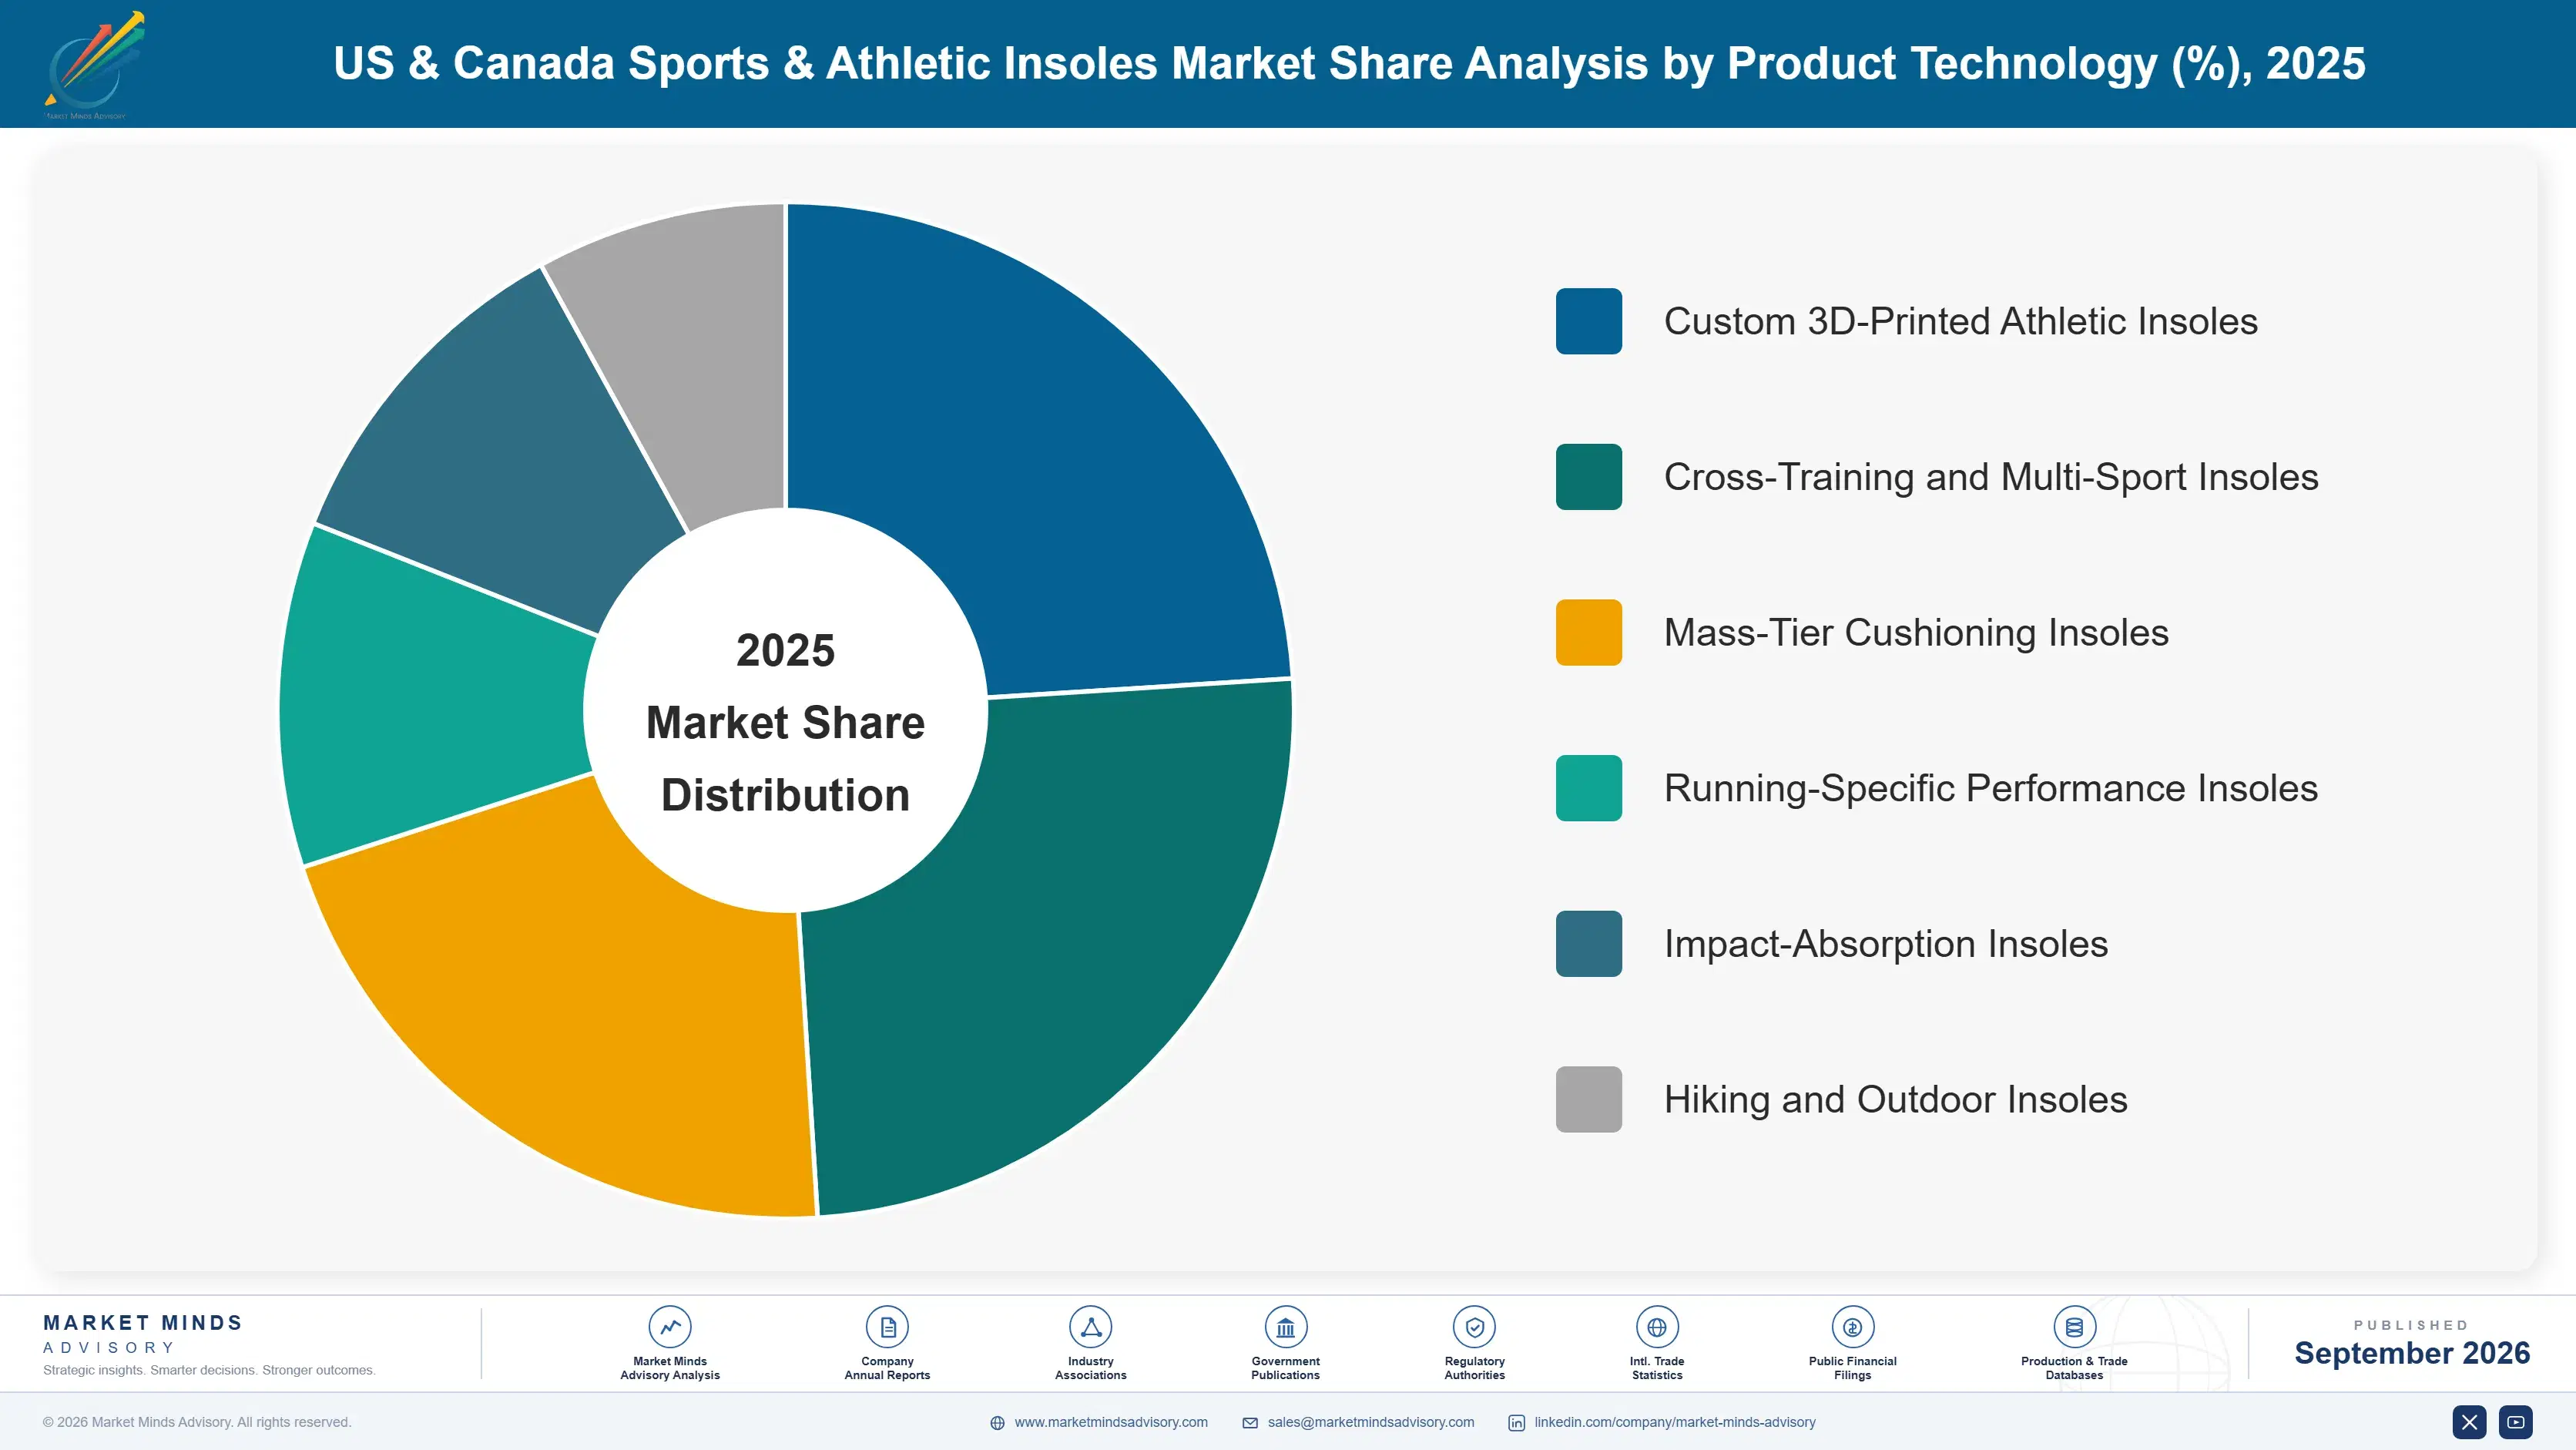
The market segments by product technology and activity focus rather than by brand or channel, since fitting method and cushioning construction, not retail format, determine which products credibly serve a given athletic activity and impact profile at a given price point. Six distinct technology categories together capture the full addressable scope of this market nationwide.
united-states-and-canada-sports-and-athletic-insol-market-share-analysis-1790024388159

Custom 3D-Printed Athletic Insoles

Custom 3D-printed athletic insoles are growing fastest as in-store scanning kiosks make individually molded fitting accessible without a specialty running-store visit, converting buyers who previously tolerated generic cushioning insoles into custom-fit purchasers within a single store visit. Sporting goods retailers and specialty running stores are both expanding kiosk networks specifically to capture this segment's higher price point and stronger repeat-purchase behavior compared to generic alternatives available nearby. Domestic manufacturers with proprietary scanning software hold a meaningful head start over international competitors still building comparable fitting infrastructure, since scanning partnerships with major retail chains typically involve multi-year exclusivity arrangements that lock out late entrants for extended periods across most regional retail networks.
CAGR 11.2%

Cross-Training and Multi-Sport Insoles

Cross-training and multi-sport insoles rank second-fastest as manufacturers extend performance marketing beyond distance runners toward gym-goers, weightlifters, and court-sport participants seeking lateral stability rather than forward-motion cushioning alone at every price point. Superfeet and Currex both derive steadily growing revenue from their cross-training-specific product lines sold through gym-adjacent retail partnerships rather than traditional running-store distribution, a channel shift that broadens the buyer base considerably beyond distance runners and casual joggers alike. This segment benefits from youth and school sports program recommendations that generic running insoles rarely capture, since coaches specifically seek multi-directional stability credentials when recommending protective equipment for high-impact team sports across most youth and school leagues nationwide today.
CAGR 9.4%
Full segment breakdown across 6 segments available in the complete report.

Regional Architecture and Country Demand Map

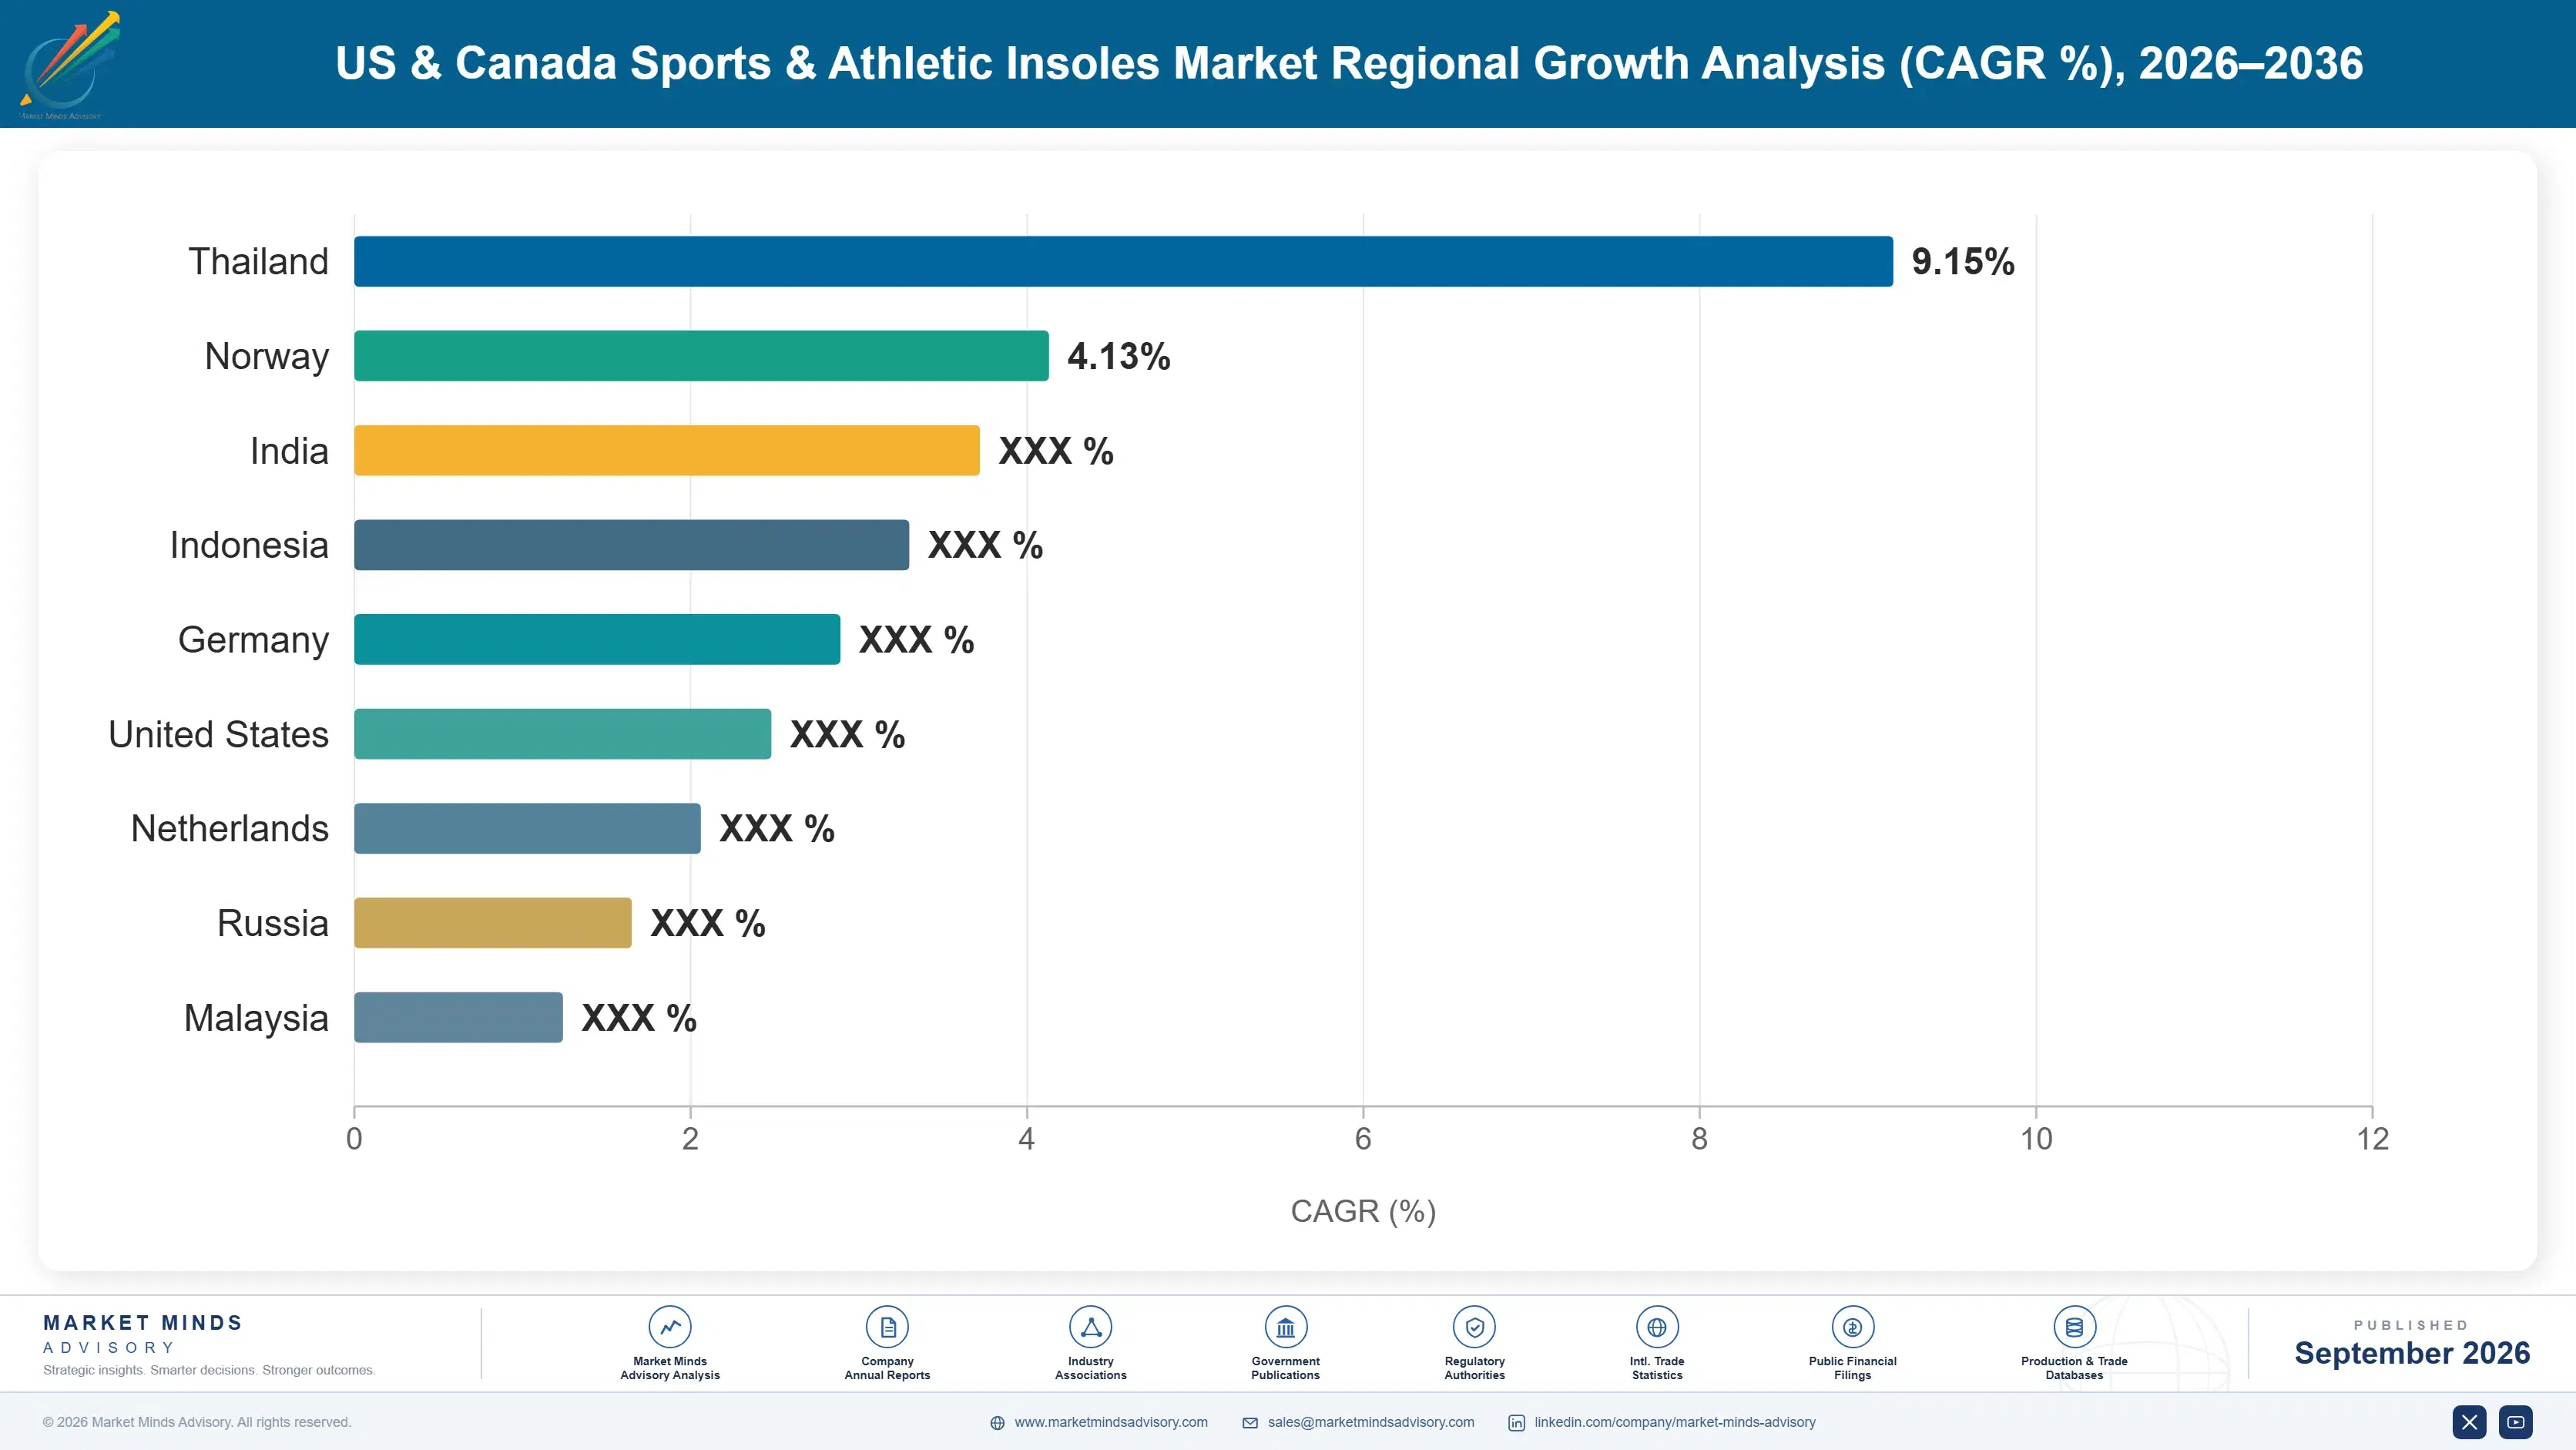
North America leads by a wide margin given this report's core United States and Canada focus, with East Asia following through manufacturing scale and rising domestic sports participation, while South Asia and Pacific posts the fastest regional growth from a much smaller starting base overall.

North America

North America holds by far the largest regional share because this report's scope is defined around the United States and Canada, where running and cross-training participation, dense sporting goods retail infrastructure, and domestic biomechanical research capacity all concentrate. Superfeet, Spenco Medical, and Sof Sole all manufacture and headquarter domestically, giving American and Canadian buyers earlier access to new fitting technology than most international markets. Canadian demand tracks closely behind the United States, following similar sporting goods retail distribution and scanning kiosk adoption patterns among comparable climate-driven outdoor participation rates. The United States alone accounts for the substantial majority of this regional total given its considerably larger population and denser sporting goods retail footprint.
Share: 31% | CAGR: 7.5% (2026 to 2036)

East Asia

East Asia's growth stems primarily from Japan and South Korea, where domestic footwear manufacturers have built comparable scanning and fitting technology capacity that increasingly rivals American innovation in this category. Chinese manufacturers supply a substantial share of foam and gel cushioning components to North American brands, reflecting the region's considerable manufacturing scale advantage even where domestic athletic insole consumption still trails United States and Canadian adoption levels overall by a meaningful margin. South Korean and Japanese sporting goods retailers have both begun bundling performance insoles with running shoe purchases at the point of sale, a merchandising approach North American retailers are only beginning to adopt at comparable scale and speed.
Share: 22% | CAGR: 8.0% (2026 to 2036)
Regional intelligence for 5 additional markets available in the complete report: Western Europe, South Asia and Pacific, Latin America, Middle East and Africa, Eastern Europe. Contact sales@marketmindsadvisory.com.
united-states-and-canada-sports-and-athletic-insol-country-cagr-analysis-1790024388687

Where Athletic Insole Brands Can Capture Margin

Four commercial angles determine which manufacturers convert category growth into durable margin rather than simply riding participation growth: proprietary scanning infrastructure investment, cross-training and multi-sport expansion beyond distance running, youth sports channel partnerships built through coaches, and subscription-based replenishment programs that build repeat purchase habits across most retail channels and price segments over time.

Investing in Proprietary In-Store Scanning Infrastructure

Manufacturers that fund proprietary scanning kiosk networks, rather than relying on third-party fitting technology, capture meaningful pricing power, with custom-fit insoles sold through owned kiosk networks retailing at roughly 52 percent above generic cushioning equivalents in the same retail channel and price segment. The investment case rests on defensibility: multi-year exclusivity agreements with major sporting goods chains create switching costs competitors cannot easily replicate once installed. Manufacturers that delay this investment risk losing retail shelf space entirely as chains consolidate around fewer scanning technology partners over the coming several years.
Market Impact: Supports roughly a 52% price premium overall today

Expanding Into Cross-Training and Multi-Sport Lines

Manufacturers extending performance insole marketing beyond distance runners toward cross-training, weightlifting, and court-sport participants capture a meaningfully larger addressable buyer base, with MMA survey data showing cross-training insole revenue growing roughly 30 percent faster than comparable traditional running-only-focused product lines overall today. Manufacturers investing here typically build lateral-stability-focused product lines distinct from forward-motion running cushioning, since gym-based athletes generally prioritize meaningfully different biomechanical support characteristics than typical long-distance runners tend to require. This lever compounds as gym-adjacent retail partnerships provide distribution channels that running-store-only brands simply lack access to entirely.
Market Impact: Grows roughly 30% faster than running-only lines overall

Building Youth Sports Channel Partnerships Nationwide

Manufacturers increasingly partner with school athletic programs and youth sports leagues to reach parent buyers through coach and trainer recommendation rather than direct-to-consumer marketing alone, with partnership-driven sales growing an estimated 40 percent faster than general retail sales across the broader youth segment overall. This approach lets manufacturers monetize trust relationships already embedded in youth sports communities rather than building brand awareness entirely from scratch among skeptical parent buyers. The tradeoff is real: building these institutional relationships requires considerably more field-level coordination and dedicated staffing than digital marketing alone typically requires.
Market Impact: Grows youth channel sales by roughly 40% overall

Scaling Subscription-Based Replacement Insole Programs Nationally

Subscription and auto-replenishment programs reduce customer acquisition cost over the lifetime of a buyer relationship, with manufacturers operating direct subscription channels reporting repeat purchase rates roughly 33 percentage points higher than buyers acquired through one-time retail purchases alone. These programs also generate first-party usage data that informs faster product iteration than waiting on retailer sell-through reporting cycles from one season to the next. Manufacturers without direct digital channels remain dependent on retailer shelf placement and promotional calendars, limiting their ability to build the kind of habitual replenishment relationship subscriptions create.
Market Impact: Lifts repeat purchase rate by 33 points overall

Who Controls the Margin Pool

Combined estimated retail revenue from branded athletic insole lines gives the top five companies roughly 33 percent share, a moderate concentration leaving considerable room for regional and private label challengers. The gap between Superfeet, the clear category leader, and mid-tier challengers remains wide, driven mainly by scanning infrastructure and biomechanical research credentials rather than dominance in any single distribution channel.
Current competitive activity centers on three dimensions: scanning kiosk deployment across sporting goods and specialty running retail, cross-training and multi-sport line expansion beyond distance running, and youth sports channel partnerships built through coach and trainer recommendation. International footwear brands increasingly license domestic scanning technology rather than developing comparable infrastructure independently, reshaping how competitive advantage transfers across company origin and regional retail footprint.

Emerging pressure comes from digitally native brands that sell custom-fit insoles directly online using mail-in foot scanning kits rather than in-store kiosks, undercutting the capital investment traditional retailers require. Rankings are likely to shift over the next several years as private label comfort insoles capture price-sensitive volume and force mid-tier branded players to either specialize in a defensible fitting technology niche or exit the category entirely.
united-states-and-canada-sports-and-athletic-insol-company-positioning-matrix-1790024389214

Competitive Moat and Risk Dimensions

SUPERFEET WORLDWIDE

Moat: Occupational and Retail Distribution Depth

Superfeet has built deep relationships across both specialty running retail and occupational bulk-supply channels, giving it distribution breadth most single-channel competitors cannot match. Its scanning kiosk network, deployed across major sporting goods chains nationwide, gives it fitting data and brand visibility competitors without comparable retail scale cannot easily replicate.
SUPERFEET WORLDWIDE

Risk: Slower Cross-Training Line Expansion

Superfeet's product development has historically concentrated on running and occupational cushioning rather than the cross-training and multi-sport lines now driving the category's fastest incremental growth. Competitors building dedicated cross-training product lines may capture volume growth Superfeet's current portfolio focus is not positioned to serve as effectively.
CURREX

Moat: Proprietary Biomechanical Fitting System

Currex holds a genuine technical differentiation in its proprietary biomechanical fitting system, which segments buyers by foot type and pronation pattern rather than shoe size alone, a precision approach larger generalist competitors have not fully replicated. This lets Currex command premium pricing among buyers who research fitting methodology carefully before purchase.
CURREX

Risk: Limited Manufacturing and Retail Scale

Currex lacks the manufacturing scale and broad retail distribution relationships of larger competitors like Superfeet, limiting how quickly it can convert its fitting technology advantage into comparable market share. Larger, better-capitalized competitors could license or replicate similar biomechanical fitting approaches and out-distribute Currex before it converts its lead into lasting share.

Players Tracked

Prominent Players

Superfeet Worldwide
Spenco Medical
Sof Sole
Currex
Powerstep

Other Key Players

Dr. Scholl's
New Balance
Sorbothane Inc.
Implus Footcare
Vionic Group
Aetrex Worldwide
Yaktrax
Footbalance System
Protalus
Enertor
Tread Labs
Wiivv Wearables
Pedag
Spira Footwear
OS1st

Recent Developments

MAY 2025

Superfeet Expands In-Store Scanning Kiosk Network Nationwide

Superfeet expanded its foot-scanning kiosk network across additional sporting goods retail partners nationwide, adding custom-fit insole recommendation capability to stores that previously offered only generic cushioning products, aiming to capture a considerably larger share of the fastest-growing custom-fit segment across most major metropolitan retail markets nationwide.
Signal: Confirms leading manufacturers are treating scanning infrastructure as a core retail distribution strategy going forward nationwide.
SEPTEMBER 2025

Currex Launches Cross-Training-Specific Insole Line

Currex launched a dedicated cross-training insole line built on its proprietary biomechanical fitting system, extending its running-focused product portfolio into weightlifting and court-sport applications for the first time, targeting gym-based athletes who previously purchased generic running insoles regardless of their actual training activity or needs.
Signal: Indicates specialist manufacturers are extending fitting technology well beyond their original running-focused product category entirely today.
JANUARY 2026

Spenco Medical Signs Youth Sports League Partnership

Spenco Medical signed a multi-year partnership with a national youth sports league to supply supportive insoles as recommended standard equipment for young athletes, extending its distribution beyond traditional sporting goods retail into coach and trainer recommendation channels that reach parent buyers directly, quickly, and effectively.
Signal: Signals manufacturers are increasingly treating youth sports partnerships as a meaningful distribution channel distinct from retail.

What Drives Material Cost Volatility Here

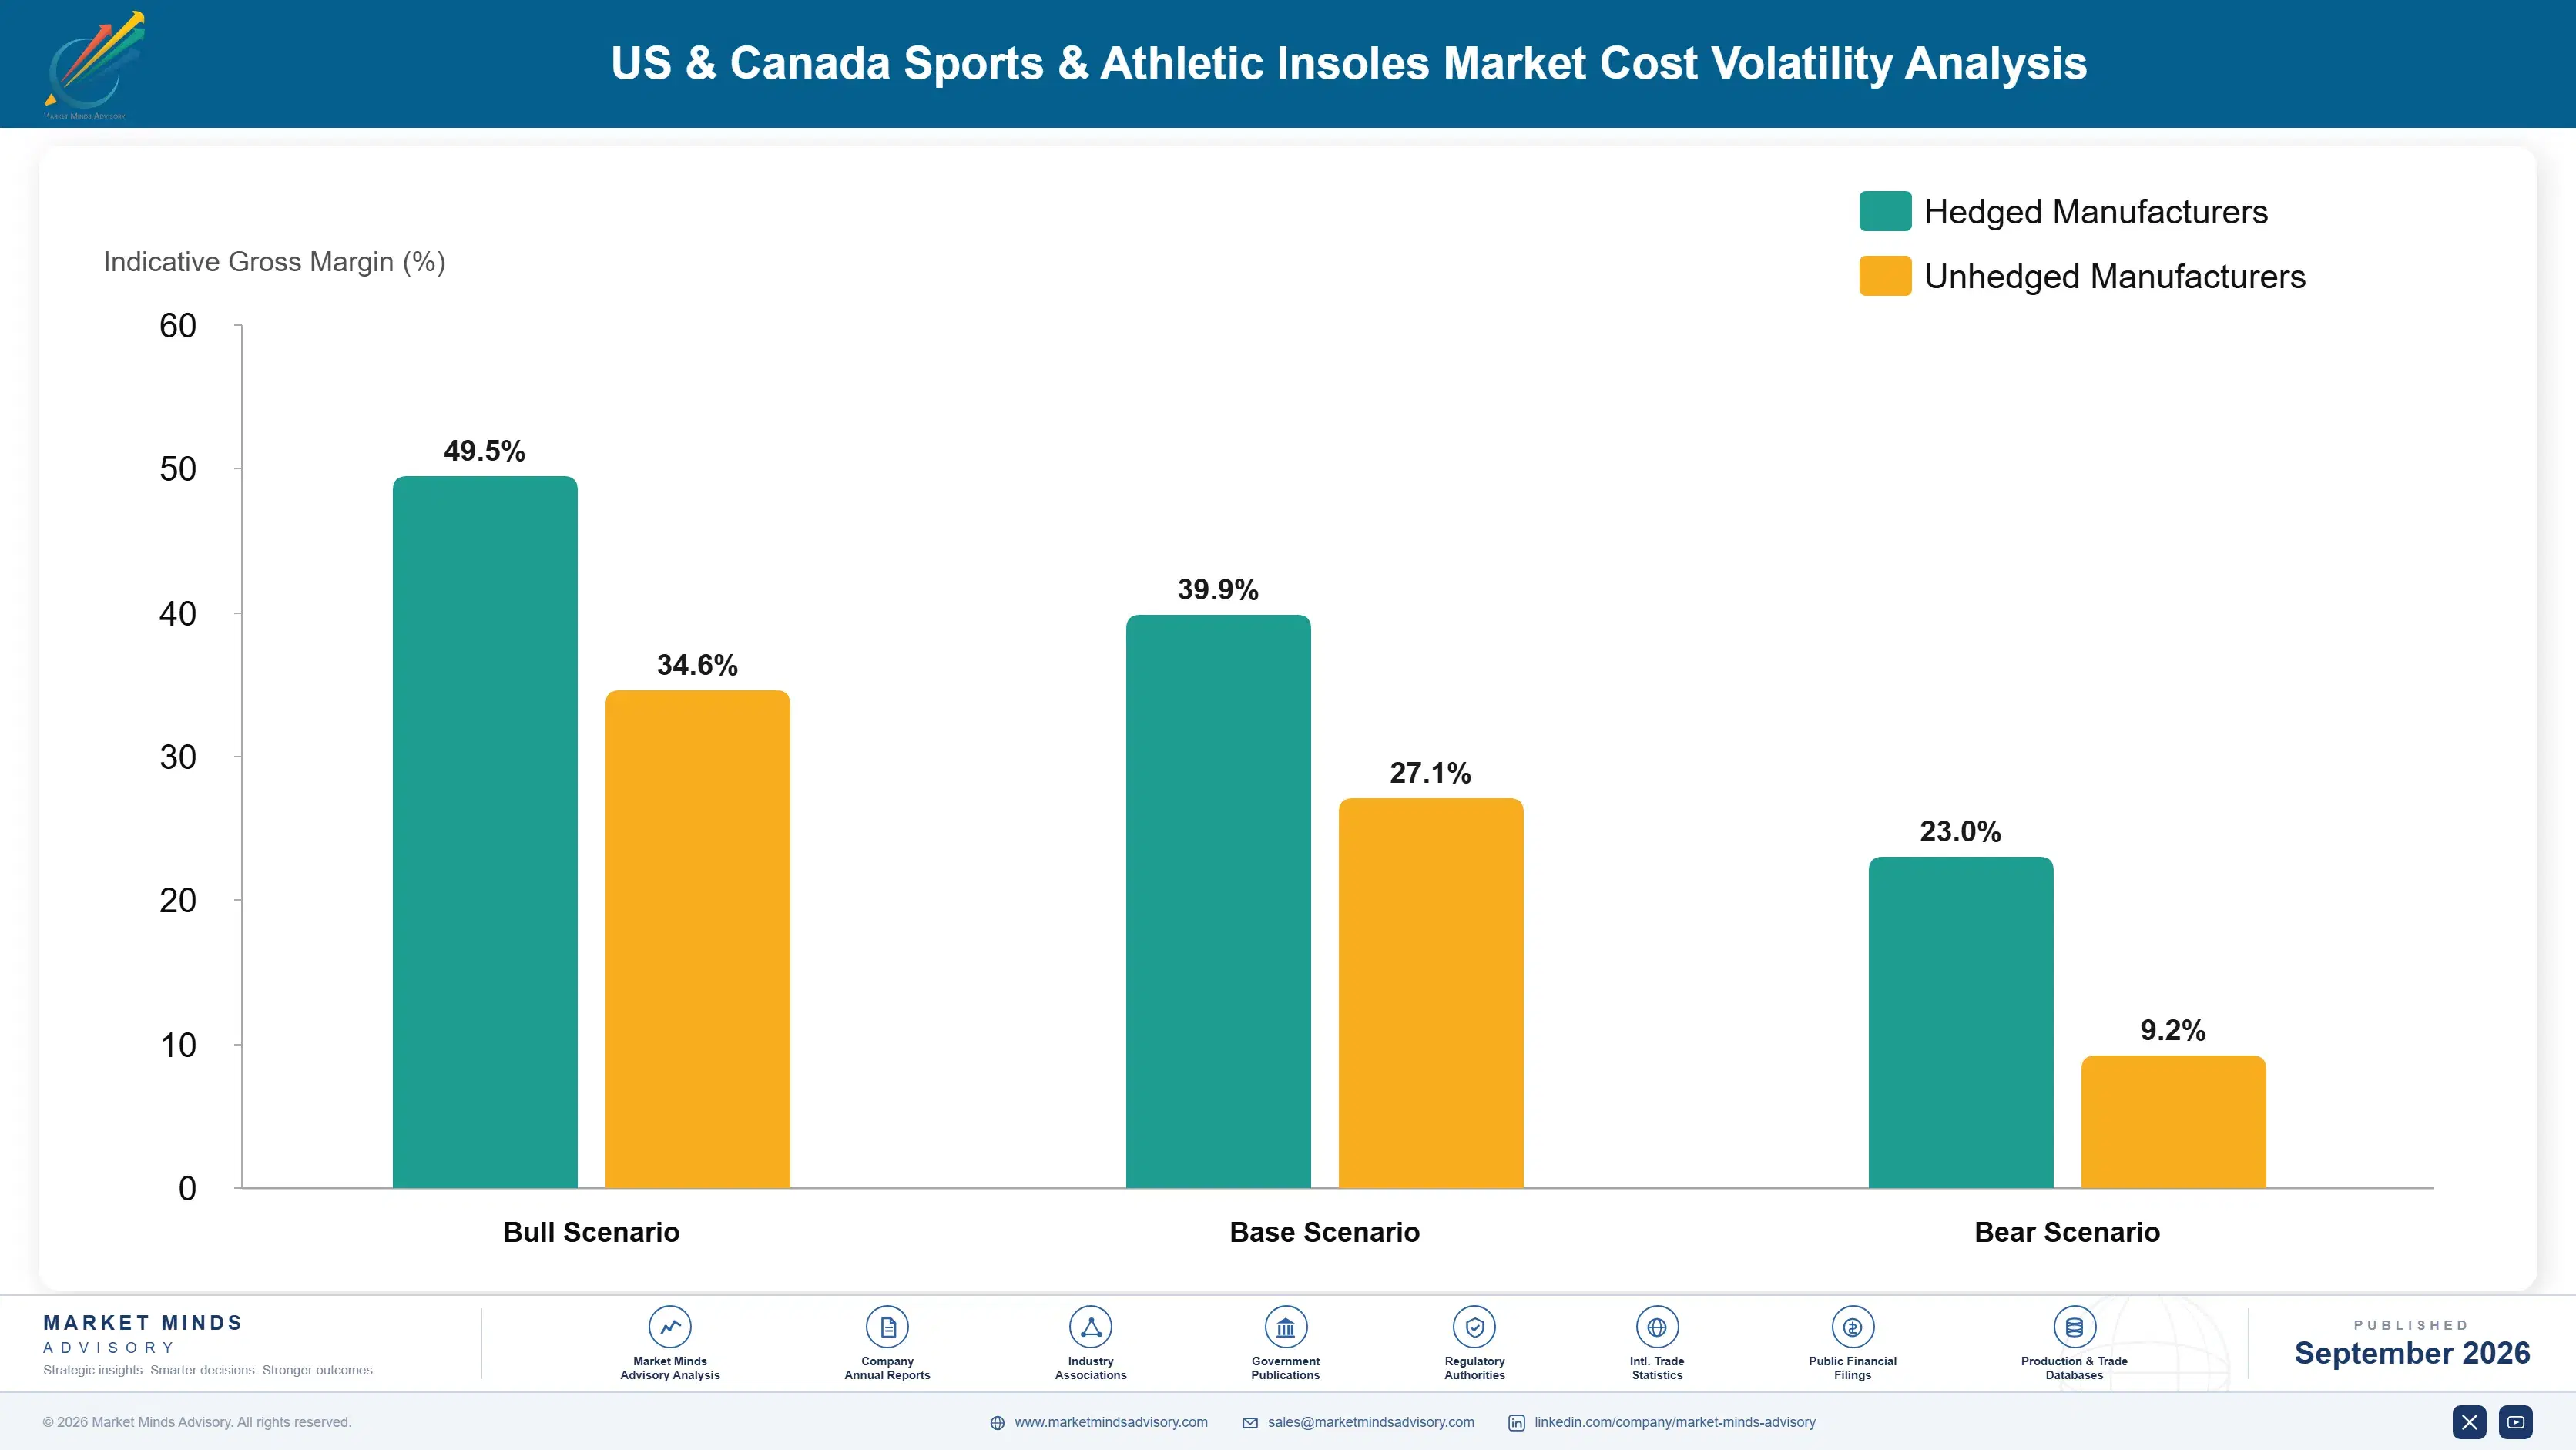
Polyurethane foam, EVA cushioning material, and carbon fiber reinforcement together account for roughly 26 percent of cost of goods sold in a typical performance athletic insole, with the remainder split between fabric covering, packaging, and scanning technology amortization. Foam and EVA precursors derive largely from petrochemical feedstocks, sourced through regional chemical distributors rather than direct petrochemical producer contracts for most mid-tier manufacturers.
Petrochemical feedstock prices spiked sharply following supply disruptions tied to the Russia-Ukraine conflict beginning in 2022, pushing polyurethane foam costs higher across manufacturers reliant on imported precursor chemicals, according to EIA petrochemical feedstock data. Larger manufacturers with diversified regional sourcing agreements absorbed the increase with comparatively limited margin impact, while smaller domestic producers without long-term supply contracts passed a larger share of the increase directly through to retail pricing.

This exposure disadvantages independent and mid-tier manufacturers most severely, since they typically lack the purchasing volume needed to negotiate multi-year fixed-price foam supply contracts that larger conglomerates secure routinely across multiple regions. Geographic exposure also varies: manufacturers with domestic petrochemical supply chains benefit from more stable input pricing, while manufacturers in import-dependent regions face comparatively greater cost pass-through pressure during feedstock disruptions.
united-states-and-canada-sports-and-athletic-insol-cost-volatility-analysis-1790024389413

Diversifying Foam Precursor Sourcing Across Regions

Manufacturers are increasingly qualifying foam and EVA precursor suppliers across multiple regions rather than depending on a single country of origin, reducing exposure to any single trade disruption or feedstock shortage event. Qualification testing for new cushioning material grades typically takes six to twelve months before large-scale production use begins across most product lines.

Locking Multi-Year Fixed-Price Foam Supply Contracts

Larger manufacturers are negotiating multi-year fixed-price agreements directly with petrochemical distributors, trading some short-term pricing flexibility for insulation against sudden feedstock-driven cost spikes across regions and product lines. Mid-tier manufacturers increasingly pool purchasing volume through shared contract manufacturing relationships to access similar pricing terms previously available only to the largest domestic conglomerates operating at national scale.

Portfolio Architecture for Margin Defence

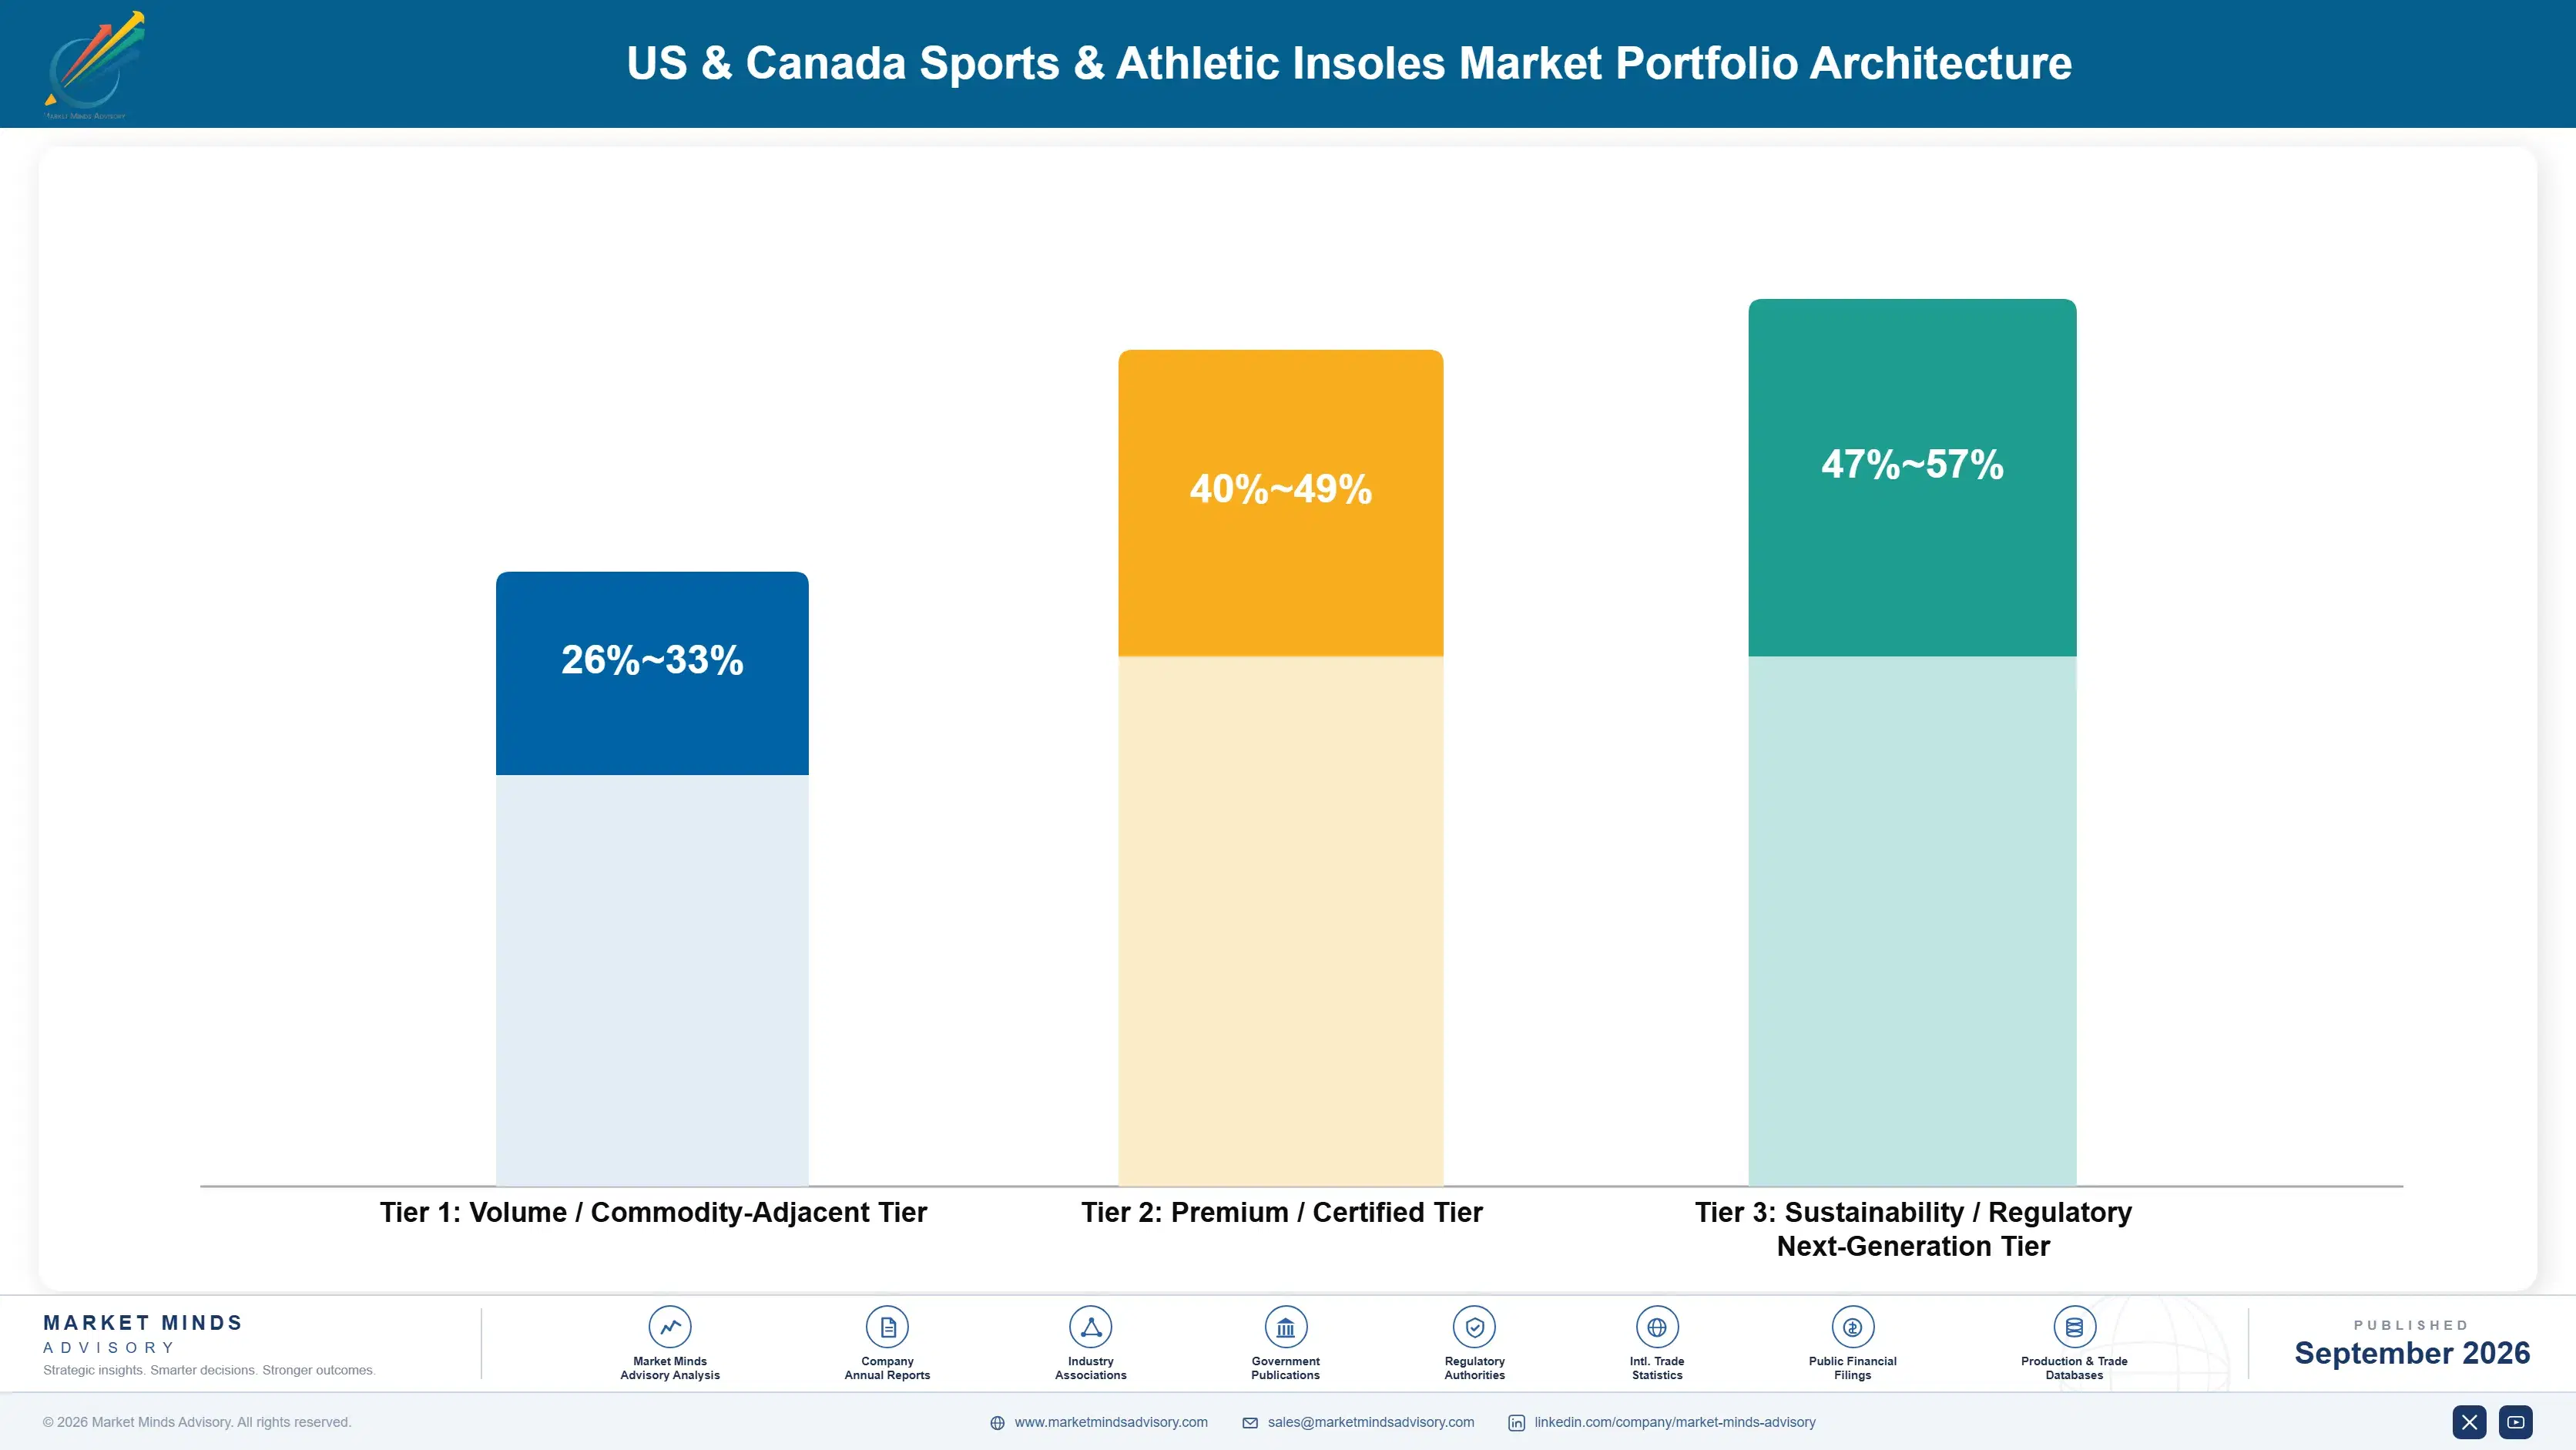
The market splits into three tiers with sharply different margin economics: volume commodity-adjacent insoles sold as basic cushioning accessories, premium certified formulations backed by biomechanical testing and athlete endorsement, and next-generation products built around proprietary scanning-fitted custom fabrication positioned as genuine performance equipment rather than footwear accessories, sold across every major retail channel nationwide and increasingly through direct online storefronts.
Volume tension is real: mass retailers keep expanding private label comfort insoles that undercut branded mid-tier pricing, forcing established manufacturers to either defend premium positioning through sustained fitting technology investment or compete directly on price with progressively thinner margins over time. Manufacturers caught between these two strategies without a clear commitment tend to lose share fastest to more decisive, better-capitalized competitors with clearer strategic focus.

High-value margin pools concentrate overwhelmingly in the premium and next-generation tiers, where biomechanical credibility and custom-fit scanning technology justify meaningfully higher price points across most geographic markets and buyer demographics. Volume-tier products generate the bulk of unit sales but comparatively thin per-unit margin, making tier mix a more important profitability lever than absolute volume growth alone for most manufacturers operating across mature and emerging markets alike.

Volume / Commodity-Adjacent Tier

Basic foam and gel comfort insoles sold through mass retail and drugstore channels at accessible price points, marketed on general comfort rather than clinical or fitting credentials, serving the broadest buyer base nationwide.
Gross Margin: 26%-33%

Premium / Certified Tier

Biomechanically tested and athlete-endorsed formulations sold through specialty sporting goods and running retail channels, commanding meaningfully higher price points through testing credibility and accumulated brand trust built over years of endorsement.
Gross Margin: 40%-49%

Sustainability / Regulatory / Next-Generation Tier

Custom scanning-fitted insoles built on proprietary fitting technology and material science, commanding the category's strongest pricing power among buyers seeking a genuine alternative to generic comfort products across all activity levels.
Gross Margin: 47%-57%
united-states-and-canada-sports-and-athletic-insol-portfolio-architecture-1790024389917

High-value Sub-segments and Strategic Watch-out

Custom 3D-Printed Athletic Insoles

The fastest-growing, highest-margin pocket in the category, combining premium pricing power with the strongest volume growth as scanning kiosks make custom fitting accessible without a specialty running-store visit, converting casual buyers into custom-fit purchasers at meaningfully higher rates than generic cushioning alternatives previously achieved across most regional retail networks.
Gross Margin: 47%-55%

Cross-Training and Multi-Sport Insoles

A high-value segment growing at a steadier pace than scanning-fitted products, anchored in gym-based training and lateral stability demand that builds durable buyer loyalty over years rather than through a single retail promotion or seasonal marketing campaign targeting new, first-time buyers each season across most demographics.
Gross Margin: 38%-46%

Mass-Tier Cushioning Insoles

The volume core of the category, generating the largest unit sales base through mass retail and drugstore channels at accessible price points nationwide, though margin per unit remains comparatively thin against the premium and next-generation tiers described earlier in this portfolio assessment overall across most retail formats.
Gross Margin: 24%-31%

Private Label Generic Insoles

A strategic watch-out segment expanding rapidly on price alone, threatening to erode branded mid-tier volume without offering the fitting differentiation that protects premium and next-generation products from similar private label price competition and direct substitution across most retail channels tracked closely by manufacturers and retailers alike.
Gross Margin: 16%-23%

Recurring Fit, Recurring Revenue

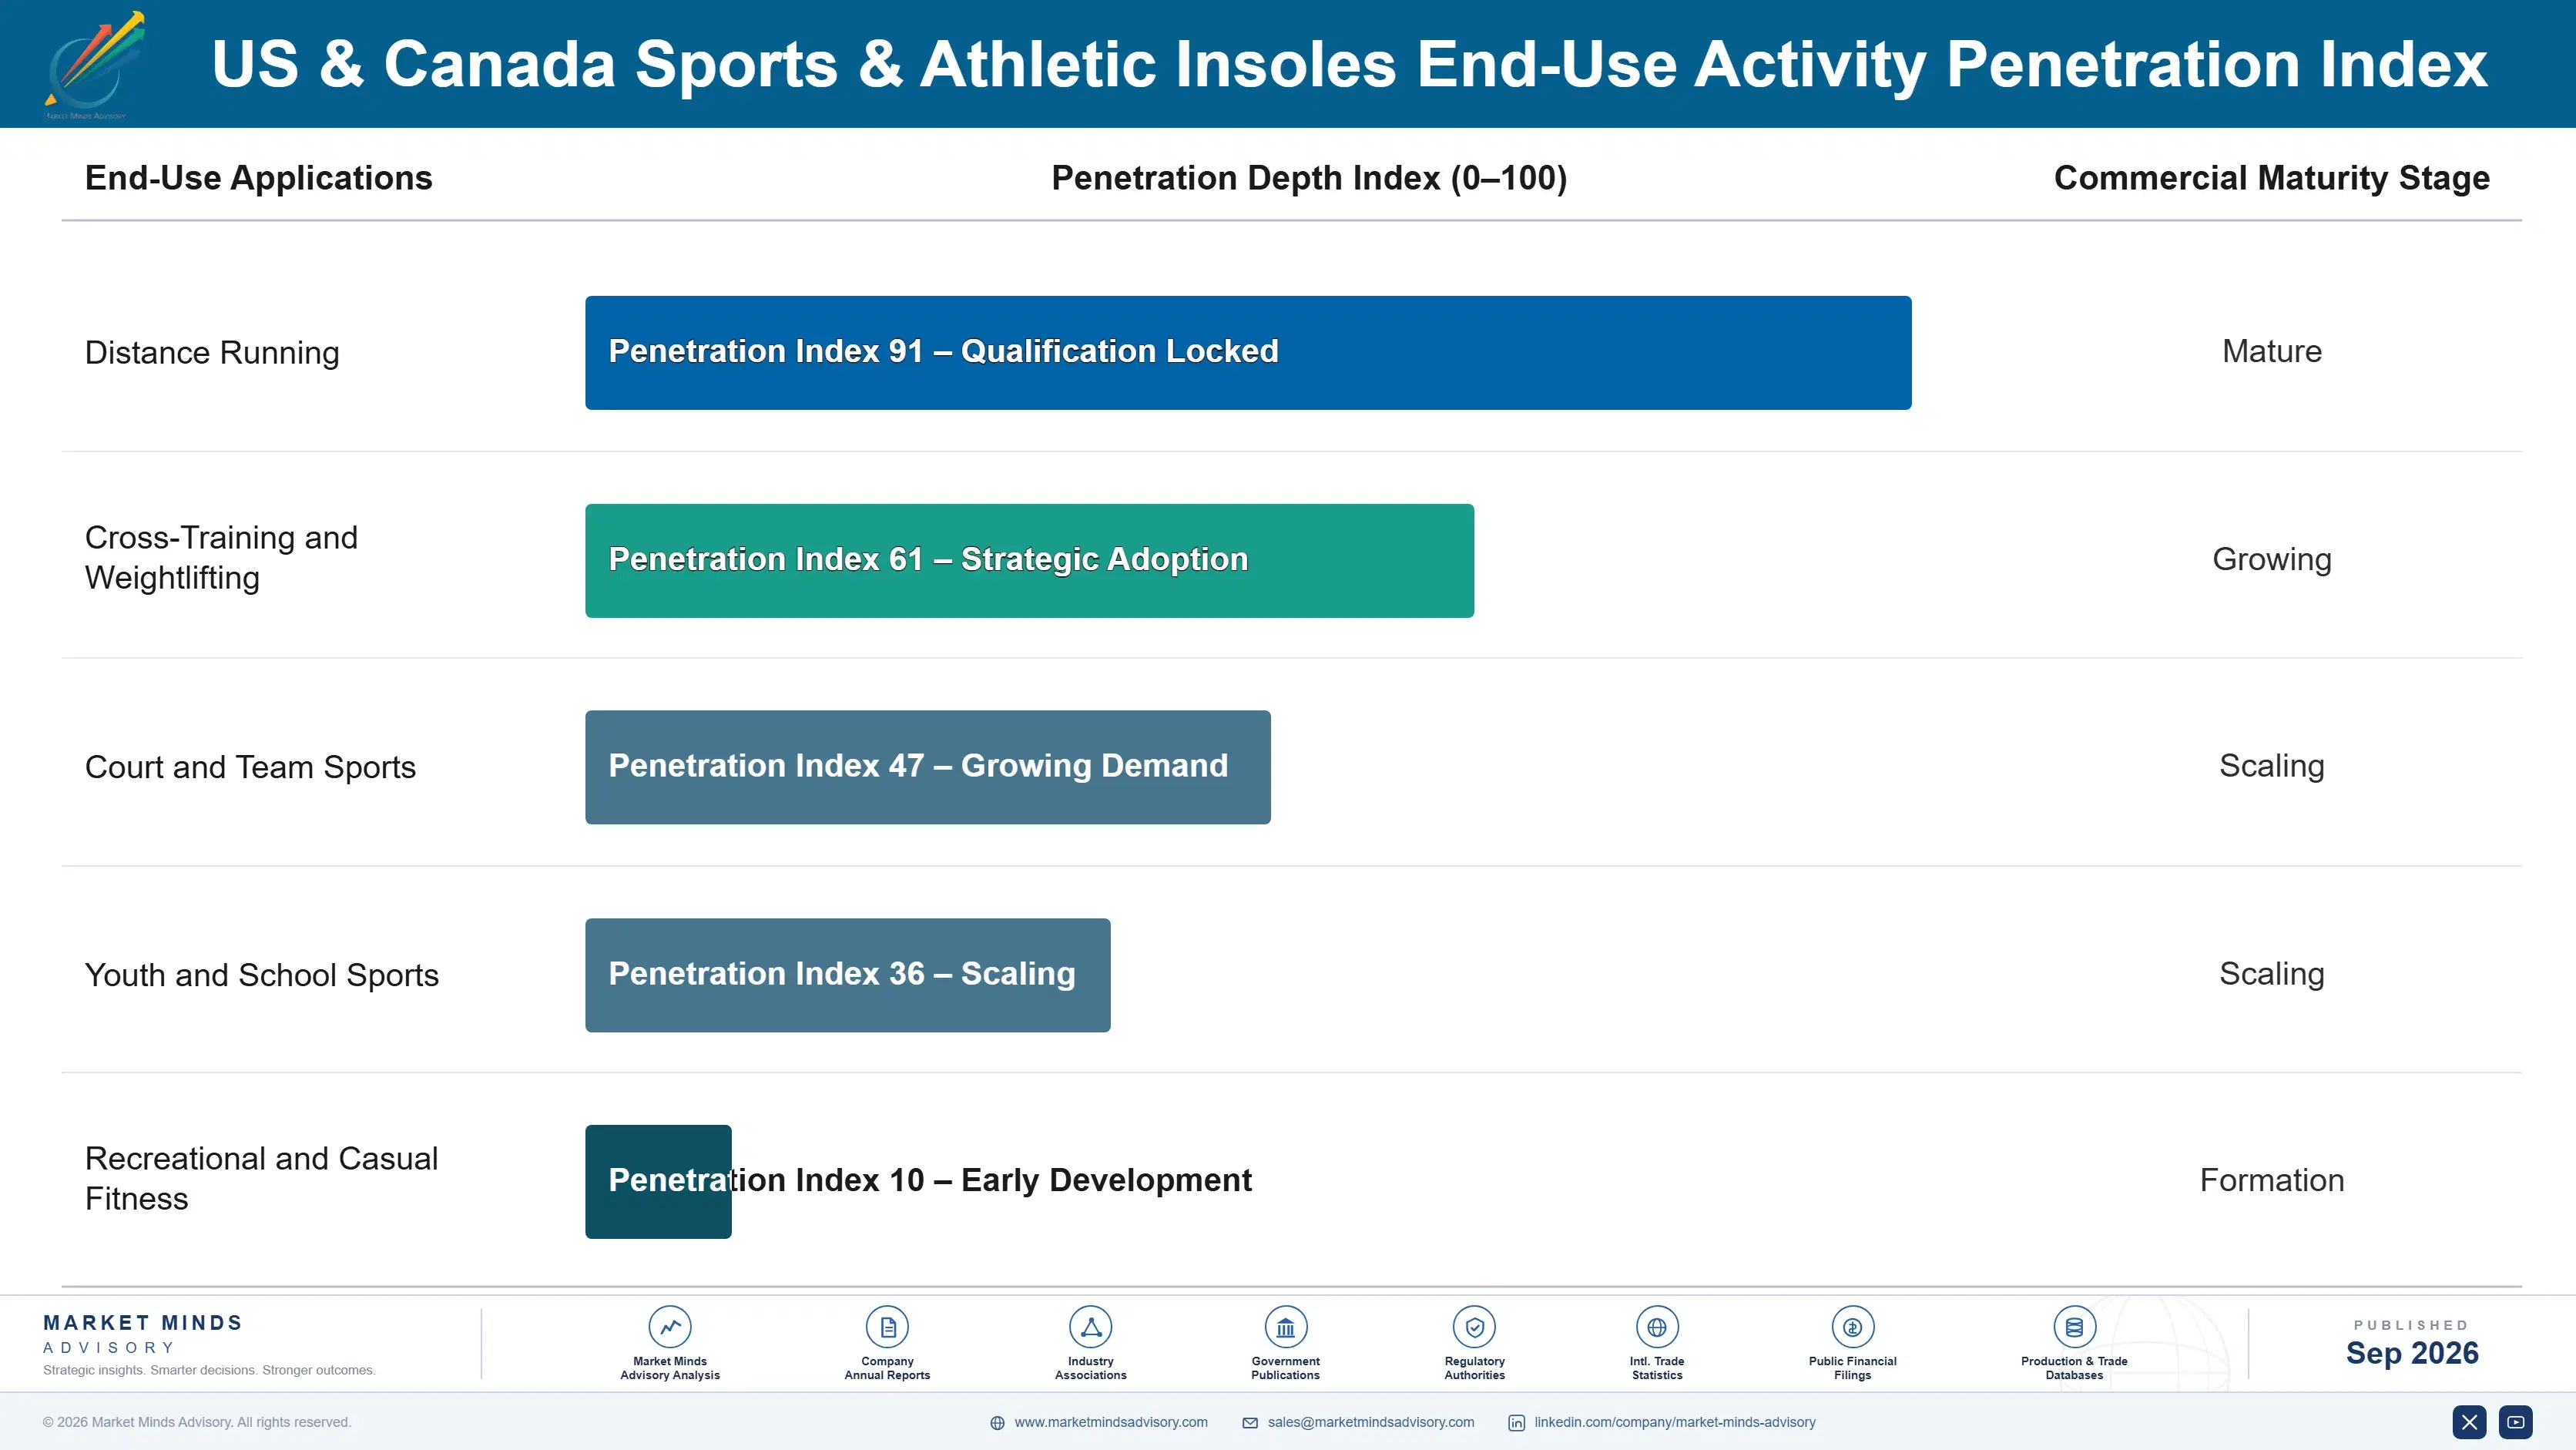
The category behaves increasingly like an annuity business rather than a one-time athletic accessory purchase, since cushioning material degrades gradually and predictably over a nine-month replacement cycle tied to activity intensity across most sports. Manufacturers capturing scanning data at first purchase can schedule refitting reminders that convert a single sale into a recurring relationship rather than a one-off transaction, building revenue visibility competitors relying on walk-in traffic alone cannot match.
Adoption depth varies considerably by end-use vertical: distance runners replace insoles on a predictable schedule tied to weekly mileage and race training cycles, while casual gym-goers replace far less consistently and often only after discomfort has already returned in earnest. Youth and school sports verticals show growing habitual adoption, since coach-driven recommendation creates sustained rather than occasional purchasing behavior across most participating families.

Younger buyers increasingly research fitting technology and material composition before purchase, treating insoles as performance equipment rather than a footwear afterthought their parents' generation largely ignored entirely. This generational shift favors manufacturers with transparent scanning data and digital fitting tools over legacy brands relying on shelf presence and brand heritage alone to drive sales.
united-states-and-canada-sports-and-athletic-insol-end-use-penetration-index-1790024390416

Where This Market Is Headed

These are among the four positions where our research anticipates prominent divergence between winners and laggards over the coming forecast period. Each is grounded in the demand model, the regulatory perimeter, and the announced capacity pipeline.
01 / FITTING INFRASTRUCTURE INVESTMENT

Scanning kiosk networks are becoming the category's real moat

Manufacturers that own proprietary scanning infrastructure, rather than renting third-party fitting technology, are locking in multi-year retail exclusivity agreements that competitors cannot easily dislodge once installed across a chain's entire store network nationwide. This advantage compounds as accumulated fitting data steadily improves recommendation accuracy over time, widening the gap between infrastructure owners and manufacturers still relying on generic sizing charts alone. Late entrants face a genuinely difficult catch-up problem, since exclusivity agreements typically run several years before renewal negotiations even begin.
02 / CROSS-TRAINING LINE EXPANSION

Multi-sport insoles open a durable addressable market beyond runners

Manufacturers extending performance marketing beyond distance runners toward gym-goers and court-sport participants are capturing a meaningfully larger buyer base that running-focused competitors are only beginning to address seriously across most product lines. Brands building dedicated cross-training product lines now will capture disproportionate share as gym-based training participation continues its steady multi-year growth trajectory across most age groups and income levels nationwide. Brands remaining exclusively running-focused risk ceding this expanding addressable market entirely to more diversified, forward-looking competitors already investing here.
03 / PRIVATE LABEL PRICE PRESSURE

Mid-tier brands face a genuine squeeze between premium and private label

Mass retailers keep expanding private label comfort insoles priced well below branded mid-tier equivalents, and mid-tier manufacturers without a clear fitting technology edge will struggle to justify their price premium going forward into the next several years. The practical response is specialization: manufacturers must commit fully to either premium fitting technology or accept the private label price ceiling permanently as their operating reality. Straddling both positions without commitment is the fastest way to lose share to more decisive competitors on either side of the market.
04 / YOUTH CHANNEL DEVELOPMENT

Coach-driven recommendation is becoming a durable growth channel

Manufacturers building dedicated youth sports partnerships now are establishing coach and trainer relationships that competitors cannot easily replicate once trust and referral patterns are firmly established within a league or school district network. This channel remains underdeveloped relative to its addressable size, since most manufacturers still treat youth sports as a marketing afterthought rather than a genuine distribution priority worth dedicated investment. Manufacturers waiting to build these relationships risk starting years behind more proactive, community-embedded competitors already firmly in place.

Engagement Snapshot From the Field

A live engagement with an industry participant carrying material or product regulatory and market exposure ahead of a defining policy shift, showing how our research translates into a defensible multi-year portfolio strategy.
MARKET MINDS ADVISORY · CLIENT ENGAGEMENT SUMMARY
US & Canada Sports & Athletic Insoles Producer Strategic Portfolio Review and Transition Roadmap 2026·Investment Scenario on US & Canada Sports & Athletic Insoles Exposure Evaluation 2025-26
CLIENT PROFILE
The client is a mid-tier North American athletic insole manufacturer with roughly 65 million dollars in annual revenue (client-reported, unverified by MMA), selling primarily through specialty running retail without proprietary scanning technology or cross-training product lines. The company had watched larger competitors deploy in-store fitting kiosks and expand into gym-adjacent retail while its own product line remained positioned purely on biomechanical heritage and price, eroding its historically stable margin structure.
STRATEGIC CHALLENGE
Management needed to decide whether to invest in proprietary scanning infrastructure, license a competitor's fitting technology, or extend its existing running-focused product line into cross-training applications using its current distribution relationships. Board members were split between defending the company's established running-store relationships and pursuing a genuinely new distribution strategy that carried meaningfully higher execution risk.
MMA APPROACH
MMA conducted primary interviews with sporting goods buyers and gym operators across three regions to assess appetite for a new entrant scanning technology and cross-training product lines, benchmarked licensing terms against existing scanning technology providers, and modeled margin outcomes under three distinct investment scenarios. The engagement combined this qualitative retailer research with MMA's proprietary segment growth and margin data from this report.
KEY FINDINGS
  1. Sporting goods buyers expressed strong interest in a second scanning technology provider, since single-vendor dependence concerned several regional chain executives directly and repeatedly.
  2. Licensing an existing scanning platform would reach market roughly fourteen months faster than building proprietary technology internally from scratch, saving considerable development cost.
  3. Gym-adjacent retail partnerships represented an underexploited growth path requiring far less upfront capital than consumer scanning infrastructure deployment across most retail stores.
  4. Private label price competition was concentrated in the volume tier, leaving the client's mid-tier positioning more exposed than management had originally assumed.
CLIENT PROFILE
The client is a mid-tier North American athletic insole manufacturer with roughly 65 million dollars in annual revenue (client-reported, unverified by MMA), selling primarily through specialty running retail without proprietary scanning technology or cross-training product lines. The company had watched larger competitors deploy in-store fitting kiosks and expand into gym-adjacent retail while its own product line remained positioned purely on biomechanical heritage and price, eroding its historically stable margin structure.
STRATEGIC CHALLENGE
Management needed to decide whether to invest in proprietary scanning infrastructure, license a competitor's fitting technology, or extend its existing running-focused product line into cross-training applications using its current distribution relationships. Board members were split between defending the company's established running-store relationships and pursuing a genuinely new distribution strategy that carried meaningfully higher execution risk.
MMA APPROACH
MMA conducted primary interviews with sporting goods buyers and gym operators across three regions to assess appetite for a new entrant scanning technology and cross-training product lines, benchmarked licensing terms against existing scanning technology providers, and modeled margin outcomes under three distinct investment scenarios. The engagement combined this qualitative retailer research with MMA's proprietary segment growth and margin data from this report.
KEY FINDINGS
  1. Sporting goods buyers expressed strong interest in a second scanning technology provider, since single-vendor dependence concerned several regional chain executives directly and repeatedly.
  2. Licensing an existing scanning platform would reach market roughly fourteen months faster than building proprietary technology internally from scratch, saving considerable development cost.
  3. Gym-adjacent retail partnerships represented an underexploited growth path requiring far less upfront capital than consumer scanning infrastructure deployment across most retail stores.
  4. Private label price competition was concentrated in the volume tier, leaving the client's mid-tier positioning more exposed than management had originally assumed.
RECOMMENDED STRATEGY
Phase 1: Phase 1 (Months 1 to 4): License an established scanning platform rather than building proprietary technology, prioritizing speed to market. Phase 2: Phase 2 (Months 5 to 10): Launch a dedicated cross-training insole line through gym-adjacent retail partnerships to diversify recurring revenue. Phase 3: Phase 3 (Months 11 to 18): Expand licensed scanning kiosks to additional sporting goods partners while phasing out unprofitable volume-tier lines.
OUTCOME
The client signed a licensing agreement with an established scanning technology provider within five months and launched a cross-training insole line through gym-adjacent partnerships shortly after. Management reported a 13 percent increase in mid-tier product revenue within the first year (client-reported, unverified by MMA), attributing the gain primarily to the cross-training line rather than the kiosk rollout.

Frequently Asked Questions

Foundational context covering the market sizes, CAGR, scope, country, region and competition that inform every finding below. This section is provided to cover basics and most often pre-purchase conversations, answered from the MMA Primary Research Dataset.

What is the current size of the US & Canada Sports & Athletic Insoles Market?

The US and Canada sports and athletic insoles market reached an estimated 1.15 billion dollars in 2025. This figure covers removable performance insoles sold through sporting goods, specialty running, and e-commerce retail channels.

How large will the US & Canada Sports & Athletic Insoles Market be by 2036?

The market is projected to reach approximately 2.47 billion dollars by 2036. This represents almost double the market's 2026 value over the ten-year forecast period.

What is the CAGR for the US & Canada Sports & Athletic Insoles Market 2026 to 2036?

The market is expected to grow at a compound annual growth rate of 7.2 percent between 2026 and 2036. Bull and bear scenarios range from 8.5 percent to 5.9 percent depending on scanning kiosk rollout speed.

Which segment is growing fastest?

Custom 3D-printed athletic insoles are growing fastest at an 11.2 percent CAGR, roughly 1.56 times the overall market rate. Growth is driven by in-store scanning kiosks that make custom fitting accessible without a specialty running-store visit.

Who are the major companies in the US & Canada Sports & Athletic Insoles Market?

Leading companies include Superfeet Worldwide, Spenco Medical, Sof Sole, Currex, and Powerstep. Together these five companies hold an estimated 33 percent of combined category market share.

Which country is growing fastest?

The United States posts the largest absolute growth given its dominant regional share, expanding at a 7.5 percent CAGR. East Asia and South Asia and Pacific post faster percentage growth from considerably smaller starting bases.

Report Segmentation Architecture

The full report scope spans multiple orthogonal segmentation dimensions, with cross-tabulated demand data provided for each dimension pair. Coverage extends further to regional breakdowns, trend trajectories, and the competitive detail needed to support segment-level decision-making.

By Product Technology

  • Custom 3D-Printed Athletic Insoles
  • Cross-Training and Multi-Sport Insoles
  • Mass-Tier Cushioning Insoles
  • Running-Specific Performance Insoles
  • Impact-Absorption Insoles
  • Hiking and Outdoor Insoles

By End-Use Activity

  • Distance Running
  • Cross-Training and Weightlifting
  • Court and Team Sports
  • Youth and School Sports
  • Recreational and Casual Fitness

By Commercial Dimension

  • Sporting Goods Retail
  • Specialty Running Retail
  • Direct-to-Consumer and E-Commerce
  • Youth Sports League Partnerships

By Region

  • North America
  • Western Europe
  • East Asia
  • South Asia and Pacific
  • Latin America
  • Middle East and Africa
  • Eastern Europe

Scope, Methodology, and Coverage

Every figure in this report is reproducible from documented input assumptions. The scope below maps the historical period, the forecast horizon, the segmentation dimensions, and the countries covered, alongside the underlying primary and qualitative methodology.
Historical Period
2020 to 2025
Forecast Period
2026 to 2036
Base Year
2025 (USD billions; MMA Primary Research Dataset, September 2026)
Market Definition
The US and Canada sports and athletic insoles market comprises removable performance insoles designed for running, cross-training, and other athletic activities, sold through sporting goods, specialty running, and e-commerce retail channels. It excludes footwear with permanently integrated insoles and clinical orthotic devices dispensed by prescription.
Quantitative Units
USD billions (current prices); unit shipment volume in millions of pairs where applicable
Segmentation Dimensions
By Product Technology; By End-Use Activity; By Commercial Dimension; By Region
Regions Covered
North America, Western Europe, East Asia, South Asia and Pacific, Latin America, Middle East and Africa, Eastern Europe
Countries Covered
USA, China, Germany, France, UK, Japan, South Korea, India, Australia, Canada, Brazil, Mexico, Indonesia, Vietnam, Thailand, Malaysia, UAE, Saudi Arabia, South Africa, Nigeria, Turkey, Poland, Netherlands, Italy, Spain, Sweden, Switzerland, Argentina, Colombia, Singapore, and additional markets relevant to this sector
Key Companies Profiled
Superfeet Worldwide, Spenco Medical, Sof Sole, Currex, Powerstep, Dr. Scholl's, New Balance, Sorbothane Inc., Implus Footcare, Vionic Group, Aetrex Worldwide, Yaktrax, Footbalance System, Protalus, Enertor, Tread Labs, Wiivv Wearables, Pedag, Spira Footwear, OS1st
Quantitative Methodology
Primary survey, n=3,800 respondents, Q4 2025, six countries; demand-side model with trade association cross-validation
Qualitative Methodology
47 expert interviews, Q4 2025; applied to validate demand model assumptions, identify emerging dynamics, and assess competitive positioning
Report Format
PDF and XLSX data workbook (Word format preview document)
Publisher
Market Minds Advisory
Report Code
MMA-2026-CON-155
Published
September 2026
Contact
sales@marketmindsadvisory.com | www.marketmindsadvisory.com

Purchase the full US & Canada Sports & Athletic Insoles Market Report (2026 to 2036).

This report delivers a complete assessment of the US and Canada sports and athletic insoles market, sizing the category from 2025 through 2036 across product technology, end-use activity, and commercial distribution dimensions. It profiles twenty companies spanning legacy performance brands and digitally native scanning-first startups, benchmarking competitive positioning, fitting technology investment, and material cost exposure. Regional analysis covers all seven global regions with quantified growth drivers specific to each. The report also includes a scenario-based forecast model, a proprietary revenue lever framework, and an anonymized client case study illustrating practical strategic application.
A complete ten-year market sizing and forecast model
A detailed six-segment product technology breakdown analysis
All seven global regions individually quantified and profiled
Twenty-company competitive benchmarking and positioning analysis included
Scenario-based bull and bear forecast projections through 2036
An anonymized client engagement case study included

Built For The People Who Decide

From boardroom strategy to bench-side execution, this report is read cover-to-cover by leaders shaping the next decade of their industry, turning demand scenarios, market dynamics and valuation benchmarks into decisions.
CXOs/ Presidents/ VPs/ Managers
M&A and Corporate Development
Strategy Teams and R&D Heads
Procurement and Product Directors
Regulatory and Compliance Leaders
Investor Relations and Equity Analysts