Market Minds Advisory
Demand for 2D Bar Code Marketing in USA

Demand for 2D Bar Code Marketing in USA: Demand for 2D Bar Code Marketing in USA. Scan-Driven Engagement Infrastructure for the Contactless Commerce Era

US retailers racing to replace static print advertising with scannable, trackable customer touchpoints are colliding with attribution and platform fragmentation problems packaging vendors were never built to solve at scale.

Lead Analyst

Published

September 2026

Make Smarter Decisions with Customized Research Insights

Request a free sample report and evaluate market opportunities, growth trends, and competitive dynamics relevant to your business needs.

2025 MARKET VALUE$4.2BMarket Size 2025
2036 FORECAST VALUE$11.4BBase Case , 2026 to 2036
CAGR 2026 TO 20369.5 %Bull 10.7% / Bear 8.3%
INCREMENTAL OPPORTUNITY$6.8BNet 10- year value creation
EXPANSION MULTIPLE2.48x2036 value over 2026 base
Strategic Levers
M&A Pipeline
Regional Outlook
Country Rankings
Competitive Intelligence
Segmental Deep-dive
Call-Us : 91 93563 13602

Executive Snapshot and Market Trajectory.

US brands have moved 2D barcode marketing from a pandemic-era contactless menu novelty into a permanent channel for measuring exactly which physical touchpoint drove each customer interaction, replacing guesswork with verified scan-level data across every campaign, channel, and retail format nationwide today.
Campaign platform vendors are racing to build attribution systems that connect a single scan on a product package, billboard, or in-store display directly to downstream purchase and loyalty program behavior across sales channels, retail formats, and marketing budgets nationwide and abroad. Demand concentrates among consumer packaged goods and retail brands running multi-channel campaigns, where marketing budget justification increasingly requires proving which physical placement generated verified engagement rather than estimated impressions.
Established print and packaging vendors compete against dedicated campaign analytics platforms built specifically for dynamic QR code generation and real-time engagement tracking rather than static code printing alone or basic redirect services used previously across the wider industry. Regulatory pressure from data privacy requirements is reshaping product specifications faster than marketing teams can evaluate competing vendor claims about attribution accuracy and consumer data handling compliance across state jurisdictions, industry standards, and emerging federal proposals.
Market Definition
This report covers dynamic and static 2D barcode generation platforms, campaign analytics software, and scan attribution services used by US brands for marketing, packaging, and in-store engagement. It excludes payment-processing QR codes, industrial inventory barcodes, and general mobile app deep-linking services unrelated to marketing campaigns.
Base Year Value
$4.2B in 2025 (MMA Primary Research Dataset, September 2026)
Forecast Period
2026 to 2036, eleven discrete annual values
CAGR
9.5% base case. Bull 10.7%. Bear 8.3%.
Fastest Growth Segment
Dynamic QR Campaign Analytics and Attribution Platforms: 15.5% CAGR
Fastest Growth Country
India: 13.5% CAGR
Fastest Growth Region
South Asia and Pacific: 11.5% CAGR
Largest Region
North America: 30% of 2025 global value
Market Leaders
Led by Flowcode Inc, Beaconstac Inc, QR Tiger, Uniqode Inc, and Scanova Inc. Source: MMA Primary Research Dataset, July 2026.
Primary Survey
n=3,800 procurement and R&D decision-makers, Q4 2025, six countries
Methodology
Demand-side build-up, cross-validated against public data, 47 expert interviews

Demand for 2D Bar Code Market Forecast Scenarios

united-states-2d-bar-code-marketing-market-size-forecast-scenario-1788452046510
The 2020 to 2025 period saw 2D barcode marketing adoption move from emergency pandemic contactless menus into a permanent multi-channel campaign tool as brands recognized the attribution advantage over static print. Adoption broadened from restaurants into consumer packaged goods and retail advertising, producing a historical CAGR of roughly 8.7 percent as dynamic code platforms expanded their addressable buyer base each year.
The base case assumes continued expansion of retail media network integration, rising consumer comfort with routine scanning behavior, and growing brand demand for verified attribution data justifying marketing spend across increasingly fragmented advertising channels, platforms, and formats. Campaign platforms increasingly bundle analytics dashboards directly into packaging design software, retailers expand scan-triggered promotional offers at shelf level, and brands standardize procurement around platforms offering cross-channel attribution rather than single-use static codes.
A bull scenario assumes major retailers mandate dynamic QR code integration across supplier packaging as a condition of shelf placement, dramatically accelerating platform adoption across consumer packaged goods brands. The bear case centers on consumer scanning fatigue and privacy concerns slowing engagement rates, reducing the attribution data quality that justifies premium platform pricing over basic static code alternatives.

Where Scan Data Meets Marketing Budget

Scan attribution now determines which physical marketing placements survive the next budget cycle, a shift that has changed which department inside a brand actually drives the platform purchase decision entirely. Performance marketing teams increasingly hold budget authority once controlled entirely by brand and creative departments, since verified scan data now directly affects how packaging and in-store placement spend gets allocated each quarter.
MARKET CONCENTRATIONCR5 41%top five platforms hold a moderately fragmented combined revenue share
AVERAGE SELLING PRICE$280/campaign/monthtypical dynamic code subscription cost per active campaign monthly
TOP PRODUCING COUNTRYUSA 34%share of global platform revenue generated from domestic campaigns
SCAN CONVERSION RATE23%share of scans that complete a tracked downstream marketing action
SOFTWARE ATTACH RATE61%campaigns bundled with dedicated attribution and analytics dashboard tools
CAMPAIGN RENEWAL LENGTH14 monthstypical subscription duration before a brand switches or renews platform
Hardware and print margins have compressed as code generation itself became commoditized, pushing vendors toward analytics dashboards and campaign attribution software as the primary profit center instead of one-time code creation fees entirely. The vendors building the most accurate cross-channel attribution models are winning multi-year enterprise contracts specifically because brands trust their platforms enough to justify shelf-space negotiations based directly on the resulting data.
Scan conversion rates sitting above 20 percent signal a channel that has moved well past novelty status into a genuinely reliable engagement mechanism brands can forecast against with real confidence. This has pushed several retailers toward requiring dynamic code integration as a supplier packaging standard, a shift that favors platform vendors with proven scale over smaller point-solution competitors lacking retail relationships nationwide.
"A QR code used to be a dare: will anyone actually scan this thing. Now it's a line item on the media plan with its own conversion target, and brands treat a bad scan rate like a failed ad campaign."
Director, Retail Marketing Technology and Attribution Practice · MMA Technology Practice · September 2026

Market Trends

Retail Media Networks Integrate Dynamic Code Attribution

Major US retailers including Walmart Connect and Kroger Precision Marketing now offer brands the ability to link in-store dynamic QR code scans into their retail media attribution dashboards alongside digital ad performance data. This has turned physical packaging and shelf placements into a measurable extension of digital advertising budgets, since brands can now compare scan-driven engagement against online impression and click-through data within a single unified view. At least five major US retail media networks have launched comparable integration programs since 2023, and nearly all major grocery and big-box retailers are expected to offer similar capability within a few years.
Market Impact: First-party data drives 28 percent adoption
Packaging-as-Media Model Redirects Marketing Budget Allocation

Consumer packaged goods brands are increasingly treating product packaging itself as a paid media placement requiring measurable return, rather than a purely functional or branding element with no performance tracking attached. This has turned packaging design decisions into a cross-functional exercise involving marketing, brand, and package engineering teams jointly, since dynamic code placement and design now directly affects measurable campaign performance metrics. Vendors have responded by building packaging design integration tools, and demand for these collaborative workflow features is expanding rapidly as more brands formalize packaging as a tracked marketing channel with its own budget line.
Market Impact: Younger consumers scan 40 percent more

Market Opportunities and Growth Drivers

Cookie Deprecation Pushes Brands Toward First-Party Scan Data

Browser cookie deprecation and rising privacy regulation have pushed brands to seek first-party data collection methods, and dynamic QR code scans provide a direct, consent-based data capture point that does not rely on third-party tracking infrastructure. This has repositioned 2D barcode marketing from a niche engagement tool into a strategic first-party data collection channel, since scan events generate consented customer data brands fully own rather than licensing from advertising platforms. Several major consumer packaged goods brands have publicly cited first-party data strategy as their primary reason for expanding dynamic code deployment across marketing and broader data strategy teams.
Market Impact: Generic campaigns see 15 percent drop

Generational Comfort With Scanning Behavior Normalizes Engagement

Younger consumers who grew up with smartphone cameras as a primary interface show meaningfully higher scan engagement rates than older demographics, normalizing scanning as a routine behavior rather than a novel or unusual action requiring instruction. This generational shift has removed a major historical barrier to 2D barcode marketing adoption, since brands no longer need to educate consumers on how or why to scan a code before benefiting from the channel. Brands targeting younger demographics increasingly build scan-first campaign strategies around this comfort level, reporting meaningfully higher conversion rates among campaigns targeting consumers under thirty-five years old.
Market Impact: Disputes affect 22 percent of renewals

Market Restraints and Challenges

Scan Fatigue Reduces Engagement Rates Over Time

Consumers exposed to dynamic codes across nearly every product package and advertisement have begun exhibiting scan fatigue, with engagement rates declining measurably in campaigns lacking a genuinely compelling reason for consumers to scan. The root cause is that early 2D barcode marketing campaigns often provided minimal value beyond a generic landing page, training consumers to associate codes with low-value content not worth the interruption of pulling out a phone. Vendors are increasingly emphasizing exclusive content, gamification, and immediate tangible rewards tied to scans, and brands offering genuine value are seeing engagement rates recover well above the declining category average.
Market Impact: Retail media integration reaches 5 networks

Attribution Accuracy Disputes Undermine Vendor Trust

Marketing teams increasingly question whether scan-to-purchase attribution claims accurately reflect causation rather than correlation, since consumers who scan codes may already have been inclined to purchase regardless of the marketing touchpoint entirely. The root cause is that most attribution methodologies lack rigorous incrementality testing comparable to established digital advertising measurement standards, leaving brands uncertain whether reported returns reflect genuine incremental sales lift. Leading vendors are investing in controlled incrementality testing methodologies borrowed from digital advertising measurement, and brands increasingly demand this rigor before renewing platform contracts at premium pricing tiers.
Market Impact: Packaging media budgets grew 34 percent
3 additional market trends, 4 additional growth drivers, and 2 additional restraints and challenges are covered in the full report. Contact sales@marketmindsadvisory.com to access the complete intelligence.

Segment CAGR and Growth Architecture

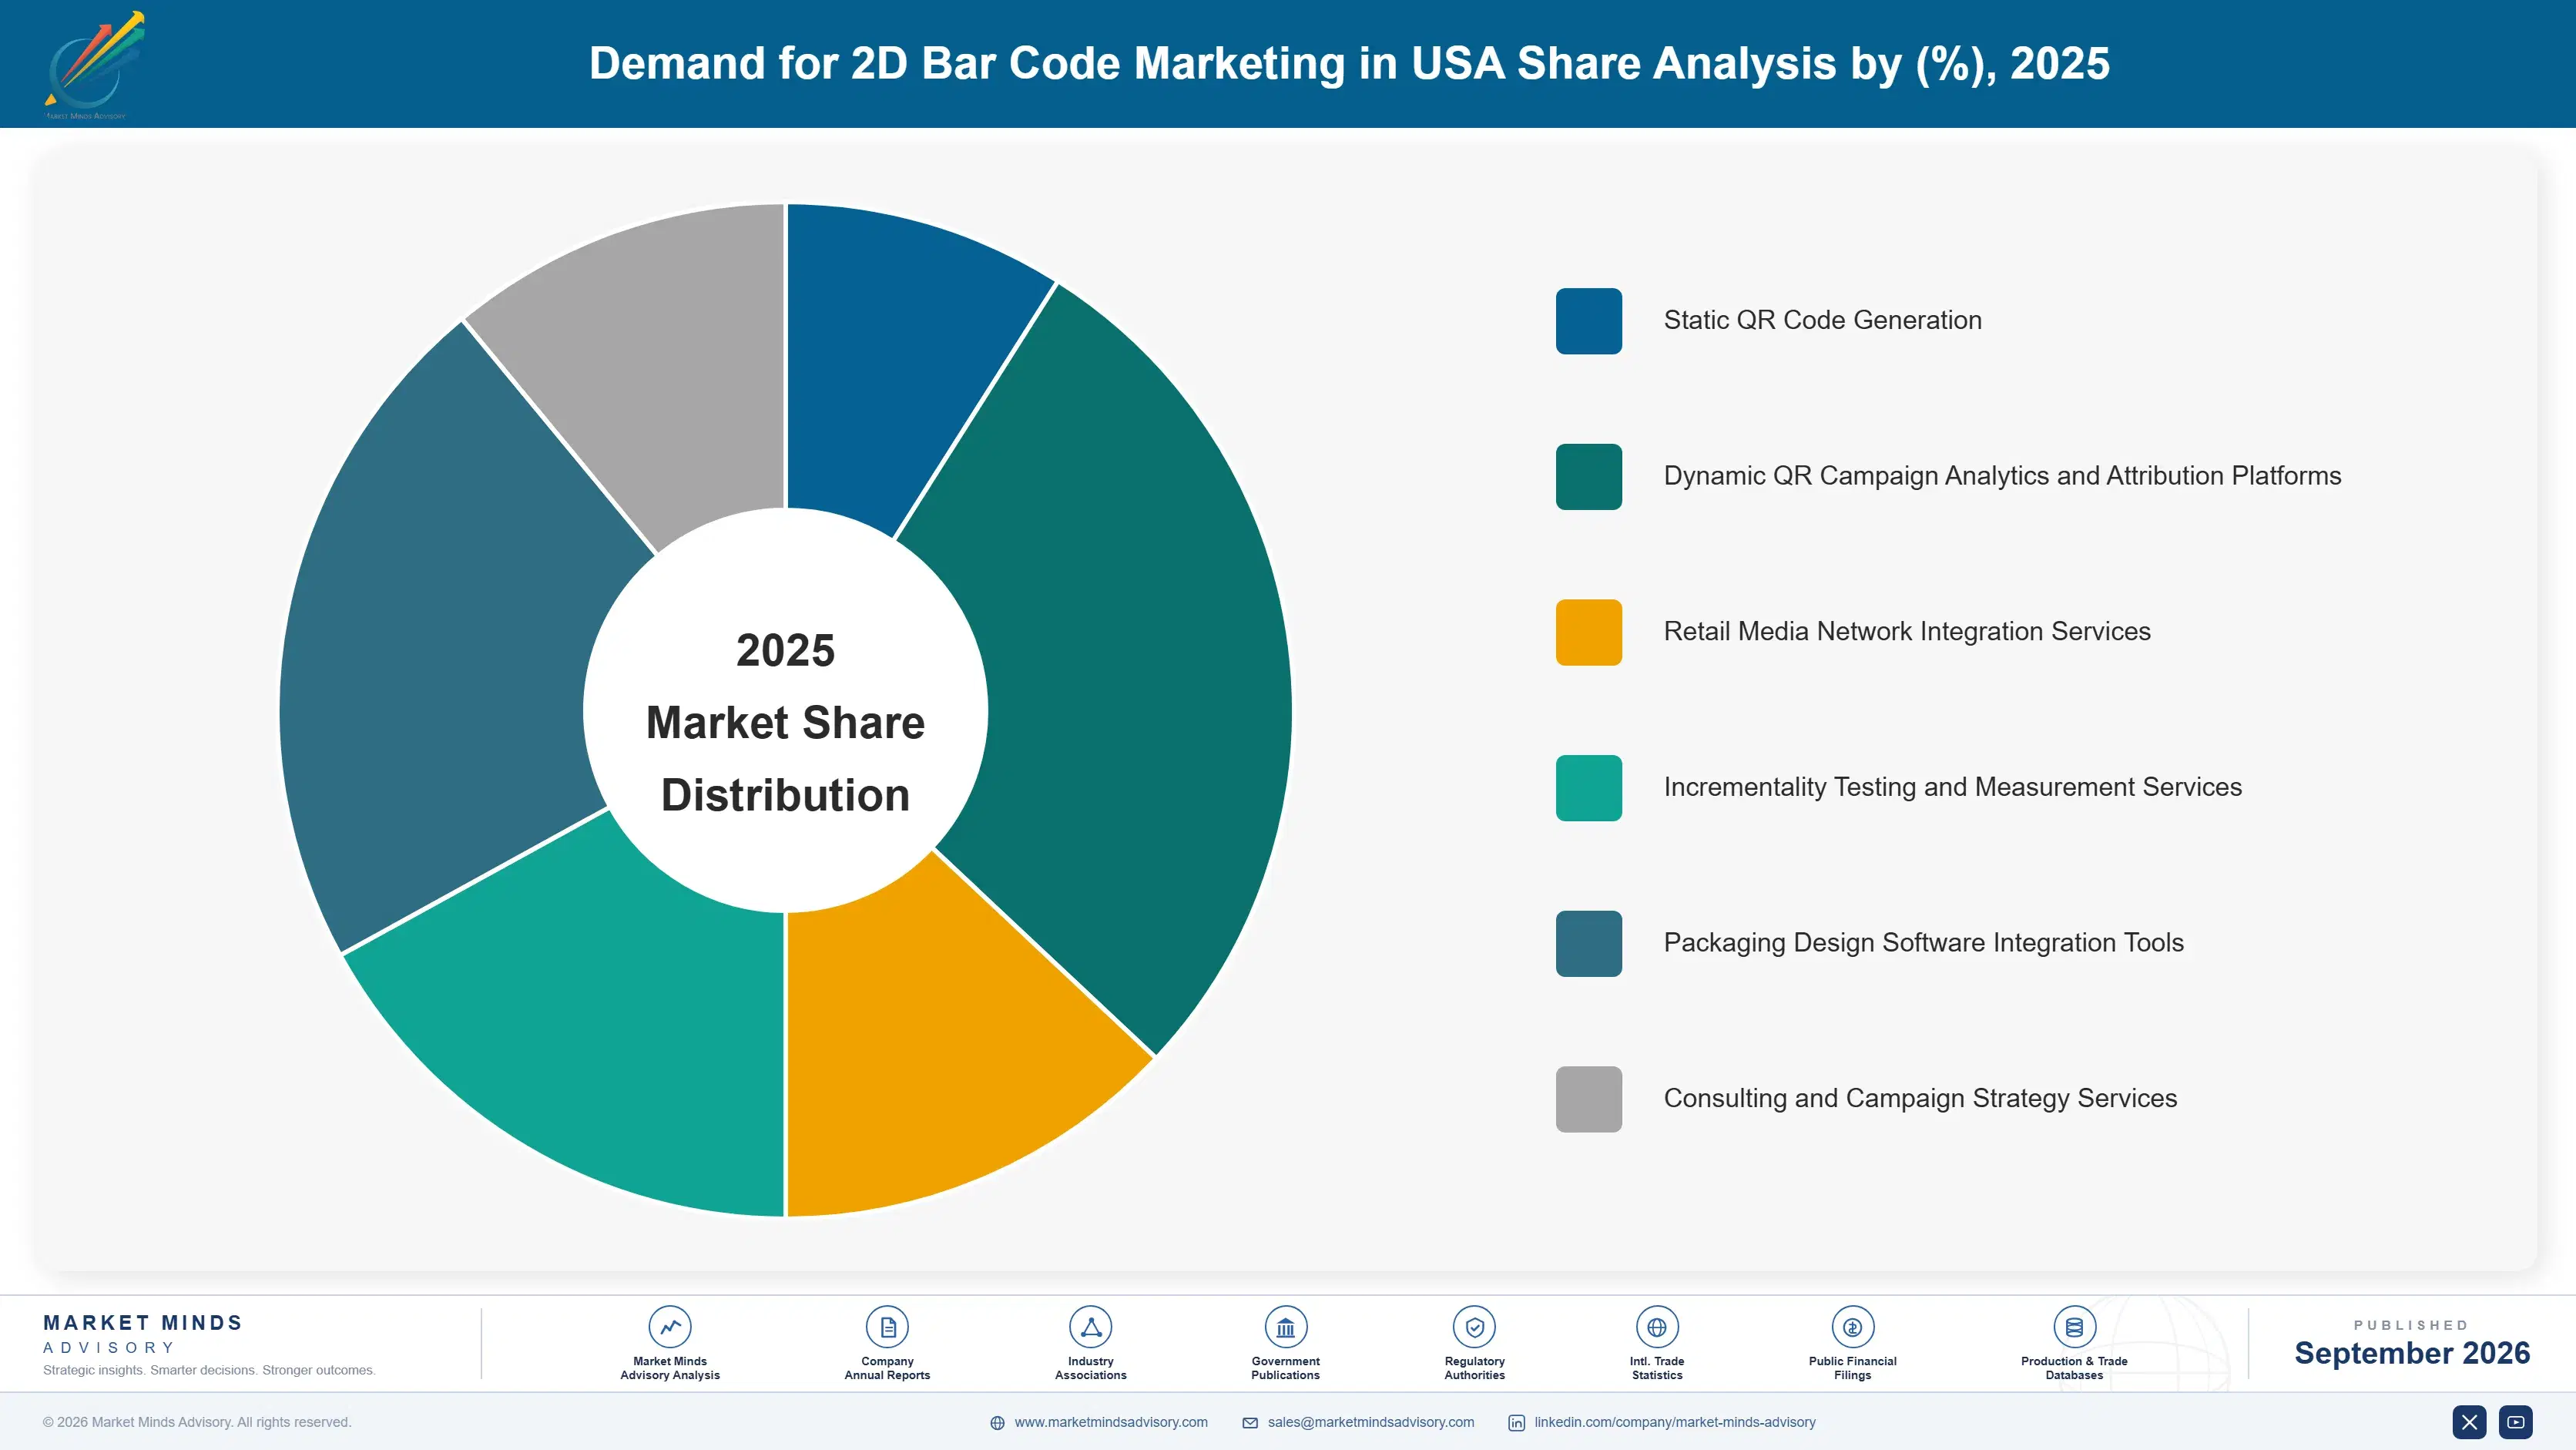
Six segments span the 2D barcode marketing value chain from static and dynamic code generation through campaign analytics software, retail media integration services, and packaging design consulting. Dynamic QR campaign analytics platforms are pulling ahead of static code segments as attribution-driven software revenue becomes the dominant margin driver shaping vendor strategy across the industry.
united-states-2d-bar-code-marketing-market-market-share-analysis-1788452047041

Dynamic QR Campaign Analytics and Attribution Platforms

Dynamic QR campaign analytics and attribution platforms have become the fastest-growing segment in this market, expanding at roughly 15.5 percent annually as brands demand verified scan-to-purchase attribution rather than simple code generation alone across all their marketing campaigns, channels, and product formats nationwide. Vendors with the most accurate cross-channel attribution models win multi-year enterprise contracts specifically because brands gate marketing budget allocation on the platform's reported incremental sales lift rather than raw scan volume counts alone. Static code providers are racing to acquire or build this analytics capability internally, since brands increasingly refuse contracts with vendors lacking a credible attribution roadmap and demonstrated measurement rigor comparable to digital advertising standards.
CAGR 15.5%

Retail Media Network Integration Services

Retail media network integration services are growing at roughly 12.5 percent annually as more retailers expand programs linking in-store scan data directly into unified brand advertising performance dashboards across channels, touchpoints, and product formats nationwide and internationally today and going forward. This segment sits between general campaign analytics and pure retail media, handling the technical integration work of connecting packaging-level scan events to retailer-specific advertising platforms that brands increasingly demand as standard practice across categories and formats. Specialized integration vendors and retail media network operators both compete here, and the segment benefits directly from retail media expansion since every integrated retailer represents a recurring service contract renewed annually alongside the broader account.
CAGR 12.5%
Full segment breakdown across 7 segments available in the complete report.

Regional Architecture and Country Demand Map

North America leads global demand given the USA's retail media network scale and advanced attribution infrastructure, while East Asia's mobile-first consumer scanning behavior and Western Europe's privacy-conscious first-party data strategies follow closely behind at meaningful scale across most major developed economies and metro markets nationwide.

North America

North America's demand rests on the USA's advanced retail media network infrastructure, with Walmart Connect, Kroger Precision Marketing, and Amazon Ads all offering integrated scan attribution tied directly to advertising performance dashboards nationwide. US brands face intensifying pressure to justify marketing spend with verified attribution data as cookie deprecation eliminates traditional digital tracking methods, making first-party scan data a strategic priority across consumer packaged goods categories and retail formats. Canada's market mirrors US adoption patterns closely given shared retail media network operators and similar regulatory environments across both countries and their major metro areas. This report's featured country, the USA, anchors the region's demand and technical leadership across nearly every platform category and vendor segment.
Share: 30% | CAGR: 10.0% (2026 to 2036)

Western Europe

Western Europe's demand rests on stringent data privacy regulation under GDPR, which has paradoxically accelerated 2D barcode marketing adoption as brands seek consent-based first-party data collection methods compliant with regional privacy law and standards. Germany and France lead adoption given their large consumer packaged goods sectors and sophisticated retail environments, while UK brands increasingly integrate dynamic codes into post-Brexit domestic marketing strategies and campaigns. Privacy-by-design platform features have become a competitive requirement here in ways not seen in less regulated markets, favoring vendors with strong compliance credentials and documentation. Regional growth trails North America but is accelerating as privacy regulation tightens further across the European Union and its member states.
Share: 19% | CAGR: 8.0% (2026 to 2036)
Regional intelligence for 5 additional markets available in the complete report: East Asia, South Asia and Pacific, Latin America, Middle East and Africa, Eastern Europe. Contact sales@marketmindsadvisory.com.
united-states-2d-bar-code-marketing-market-country-cagr-analysis-1788452047555

Paths to Margin Beyond Code Generation

Vendors face a clear choice between competing on basic code generation price alone or building recurring revenue through attribution software, retail media integration, and incrementality testing that compound over multi-year brand relationships. The vendors capturing retail media network integration and verified incrementality reporting are pulling well ahead on total account value far beyond basic code creation.

Attribution Software Subscriptions Compounding Account Value

Vendors that bundle attribution analytics software with code generation capture recurring subscription revenue that compounds annually rather than a single upfront code creation fee. Brands that adopt full attribution suites generate roughly 32 percent more total account revenue over a multi-year campaign relationship than basic code-only arrangements, since subscription fees continue well past initial deployment and renewal rates run high among engaged marketing teams. This dynamic rewards vendors investing in attribution accuracy rather than treating analytics as an afterthought, since renewal decisions increasingly hinge on data quality rather than code design alone.
Market Impact: Attribution bundling adds 32 percent more account revenue

Retail Media Integration Creating New Revenue Streams

Vendors that build direct integration with retail media network dashboards position themselves to capture a share of the advertising budget brands allocate for measured retail placements, rather than leaving that revenue on the table. Integration-capable vendors report contract values roughly 26 percent higher than competitors lacking retail media connectivity, since brands increasingly select vendors who can guarantee unified reporting rather than handling integration themselves through a separate contractor. This favors vendors with dedicated retail media relations teams over pure code generation providers, who typically lack the technical and commercial expertise this integration work demands across dozens of retailer platforms.
Market Impact: Retail media integration adds 26 percent contract value

Incrementality Testing Rigor Commanding Premium Contract Pricing

Vendors offering rigorous incrementality testing methodologies borrowed from digital advertising measurement capture premium-tier contracts from brands seeking to defend marketing budgets against increasing scrutiny over attribution accuracy claims made industry-wide. Incrementality-capable vendors command roughly 24 percent pricing premiums on relevant analytics contracts, since brands increasingly treat causation-verified reporting as release-blocking rather than a discretionary secondary validation step in their broader marketing process. This lever rewards vendors who invest early in controlled testing methodology, since brands managing large marketing budgets prioritize validation partners with proven measurement rigor in this specific analytical domain.
Market Impact: Incrementality testing commands a 24 percent price premium

Packaging Design Integration Expanding Cross-Functional Contracts

Vendors offering packaging design software integration capture cross-functional contracts spanning marketing and package engineering budgets that pure marketing-focused competitors cannot access given their narrower departmental relationships and quite limited internal reach. Design-integrated vendors close roughly 29 percent more enterprise contracts than competitors requiring separate packaging and marketing tools, since brands managing complex multi-department workflows prefer unified platforms over fragmented point solutions entirely. This favors larger vendors with capital to fund packaging software partnerships over smaller regional competitors who cannot extend that integration to their brand customers without significant engineering investment.
Market Impact: Design integration closes 29 percent more enterprise contracts

Who Controls the Margin Pool

CR5 of 41 percent reflects a fragmented competitive field where five leading platforms hold less than half of global revenue, leaving room for challengers across most brand sizes. Flowcode leads ahead of Beaconstac and the remaining top-five field, whose combined share trails the leader by a wide margin in most enterprise categories. Revenue is the evaluation basis used consistently throughout this section, since scan volume alone understates premium attribution advantage.
Current competitive activity centers on retail media network integrations, as code generation vendors race to add attribution depth rather than build it internally over years. Several mid-tier competitors have announced incrementality testing partnerships this year, recognizing measurement rigor is quickly becoming a baseline expectation. Packaging design software integration has also become a battleground, as vendors seek cross-functional contracts spanning marketing budgets.

Emerging pressure comes from ad-tech platforms without legacy code generation heritage, who can iterate attribution models faster than incumbents burdened by print and packaging relationships. These challengers lack the retail media relationship depth incumbents built over years, but partnerships with existing packaging vendors are closing that gap. Rankings could shift if a well-funded entrant partners with a major consumer packaged goods brand at scale.
united-states-2d-bar-code-marketing-market-company-positioning-matrix-1788452048080

Competitive Moat and Risk Dimensions

FLOWCODE INC

Moat: Retail Media Network Depth

Flowcode has built direct integrations with major retail media networks including Walmart Connect, giving brands unified reporting that competitors lacking these specific retailer relationships cannot easily replicate. This distribution advantage lets Flowcode win enterprise contracts specifically because brands value the reduced integration burden of a single unified attribution dashboard across multiple retail partners.
FLOWCODE INC

Risk: Premium Pricing Above Peers

Flowcode's platform pricing sits above many point-solution competitors, creating vulnerability among smaller brands who increasingly find adequate basic functionality in lower-priced alternatives lacking Flowcode's full retail media integration depth. Budget-constrained marketing teams could accelerate defection toward cheaper alternatives during industry-wide budget tightening cycles and downturns.
BEACONSTAC INC

Moat: Enterprise Compliance Feature Set

Beaconstac's platform emphasizes data privacy compliance and enterprise security features that appeal specifically to large, risk-averse brands navigating complex multi-state and international privacy regulation across their marketing operations. This compliance-first positioning wins contracts among enterprise legal and procurement teams who prioritize regulatory defensibility over marginal attribution feature differences between competing platforms.
BEACONSTAC INC

Risk: Slower Feature Innovation Pace

Beaconstac's compliance-first development priorities mean newer attribution and analytics features sometimes lag behind competitors focused primarily on measurement innovation rather than regulatory defensibility across their platforms. This has occasionally cost specification wins on programs prioritizing advanced incrementality testing capability over compliance depth and documentation rigor.

Players Tracked

Prominent Players

Flowcode Inc
Beaconstac Inc
QR Tiger Inc
Uniqode Inc
Scanova Inc

Other Key Players

Bitly Inc
QR Code Generator Pro
Scanbuy Inc
Zappar Ltd
Rebrandly Inc
Cardinal Path LLC
GS1 US Inc
Kroger Precision Marketing
Walmart Connect
Criteo SA
QRStuff Pty Ltd
Databar Inc
NeoReader GmbH
Delivra Inc
Vibenomics Inc

Recent Developments

MAY 2026

Flowcode Acquires Incrementality Testing Analytics Startup

Flowcode completed the acquisition of an incrementality testing analytics startup specializing in causation-verified marketing attribution, adding measurement rigor the company previously lacked entirely in-house. The deal closes a gap between Flowcode's platform scale and its comparatively basic attribution methodology, positioning it against measurement-focused specialists directly.
Signal: Platform incumbents are increasingly buying incrementality testing capability rather than spending years slowly building it internally.
MARCH 2026

Beaconstac Signs Supply Agreement With National Retailer

Beaconstac signed a multi-year supply agreement with a national grocery retailer to provide dynamic QR code infrastructure across its private label packaging line, replacing a competitor's aging static system. The agreement was a supply deal rather than an acquisition or joint venture, reflecting the retailer's preference for one vendor.
Signal: Retailers are increasingly consolidating vendor relationships rather than splitting purchases across multiple code generation suppliers each year.
JANUARY 2026

Uniqode Launches Dedicated Retail Media Integration Suite

Uniqode launched a dedicated retail media network integration suite connecting its platform directly to major US retailer advertising dashboards, an organic product expansion rather than an acquisition. The launch responds directly to brands seeking unified attribution reporting without hiring a separate integration specialist to manage relationships.
Signal: Vendors are increasingly building retail media integration internally rather than relying on third-party specialist integration partners.

Cloud Hosting and Data Processing Cost Exposure

Cloud hosting and real-time scan data processing infrastructure represent roughly 38 percent of platform operating cost of goods sold, sourced predominantly from major hyperscale cloud providers rather than in-house data centers. Third-party data enrichment and identity resolution services add another 22 percent, sourced through specialized data providers rather than any single dominant supplier, exposing vendors to licensing cost volatility.
The 2022 cloud computing price increases across major hyperscale providers, documented in company annual reports and industry cost benchmarking studies, raised platform hosting costs by roughly 12 to 18 percent within a single fiscal year. Several vendors reported margin compression that forced pricing adjustments passed through to brand customers, causing some smaller brands to delay platform upgrades while renegotiating contract terms. The episode pushed most major vendors to diversify cloud infrastructure providers and negotiate longer-term committed-use contracts.

Smaller regional platform vendors lacking negotiated cloud infrastructure agreements face the steepest exposure, since they typically pay standard published rates rather than negotiated committed-use discounts available to larger competitors. Large incumbents like Flowcode and Beaconstac negotiate direct committed-use agreements with major cloud providers, insulating them from the worst pricing volatility that smaller competitors absorb directly, a durable cost advantage during any future price increase.
united-states-2d-bar-code-marketing-market-cost-volatility-analysis-1788452048274

Diversify Cloud Infrastructure Providers Across Regions

Leading vendors now distribute workloads across at least two independent cloud infrastructure providers rather than relying on a single hyperscale source, reducing exposure to any single provider's pricing changes or facility-level disruptions entirely. This dual-sourcing approach adds modest integration cost upfront but has prevented cost spikes during several subsequent regional pricing disruptions since 2022.

Negotiate Multi-Year Committed-Use Cloud Contracts

Larger vendors increasingly negotiate multi-year committed-use agreements directly with hyperscale cloud providers rather than paying standard published rates, locking in both capacity and price predictability years ahead of any actual future business need. Smaller competitors are forming shared infrastructure consortiums to access similar negotiated terms collectively, since none can match incumbent usage volume alone.

Portfolio Architecture for Margin Defence

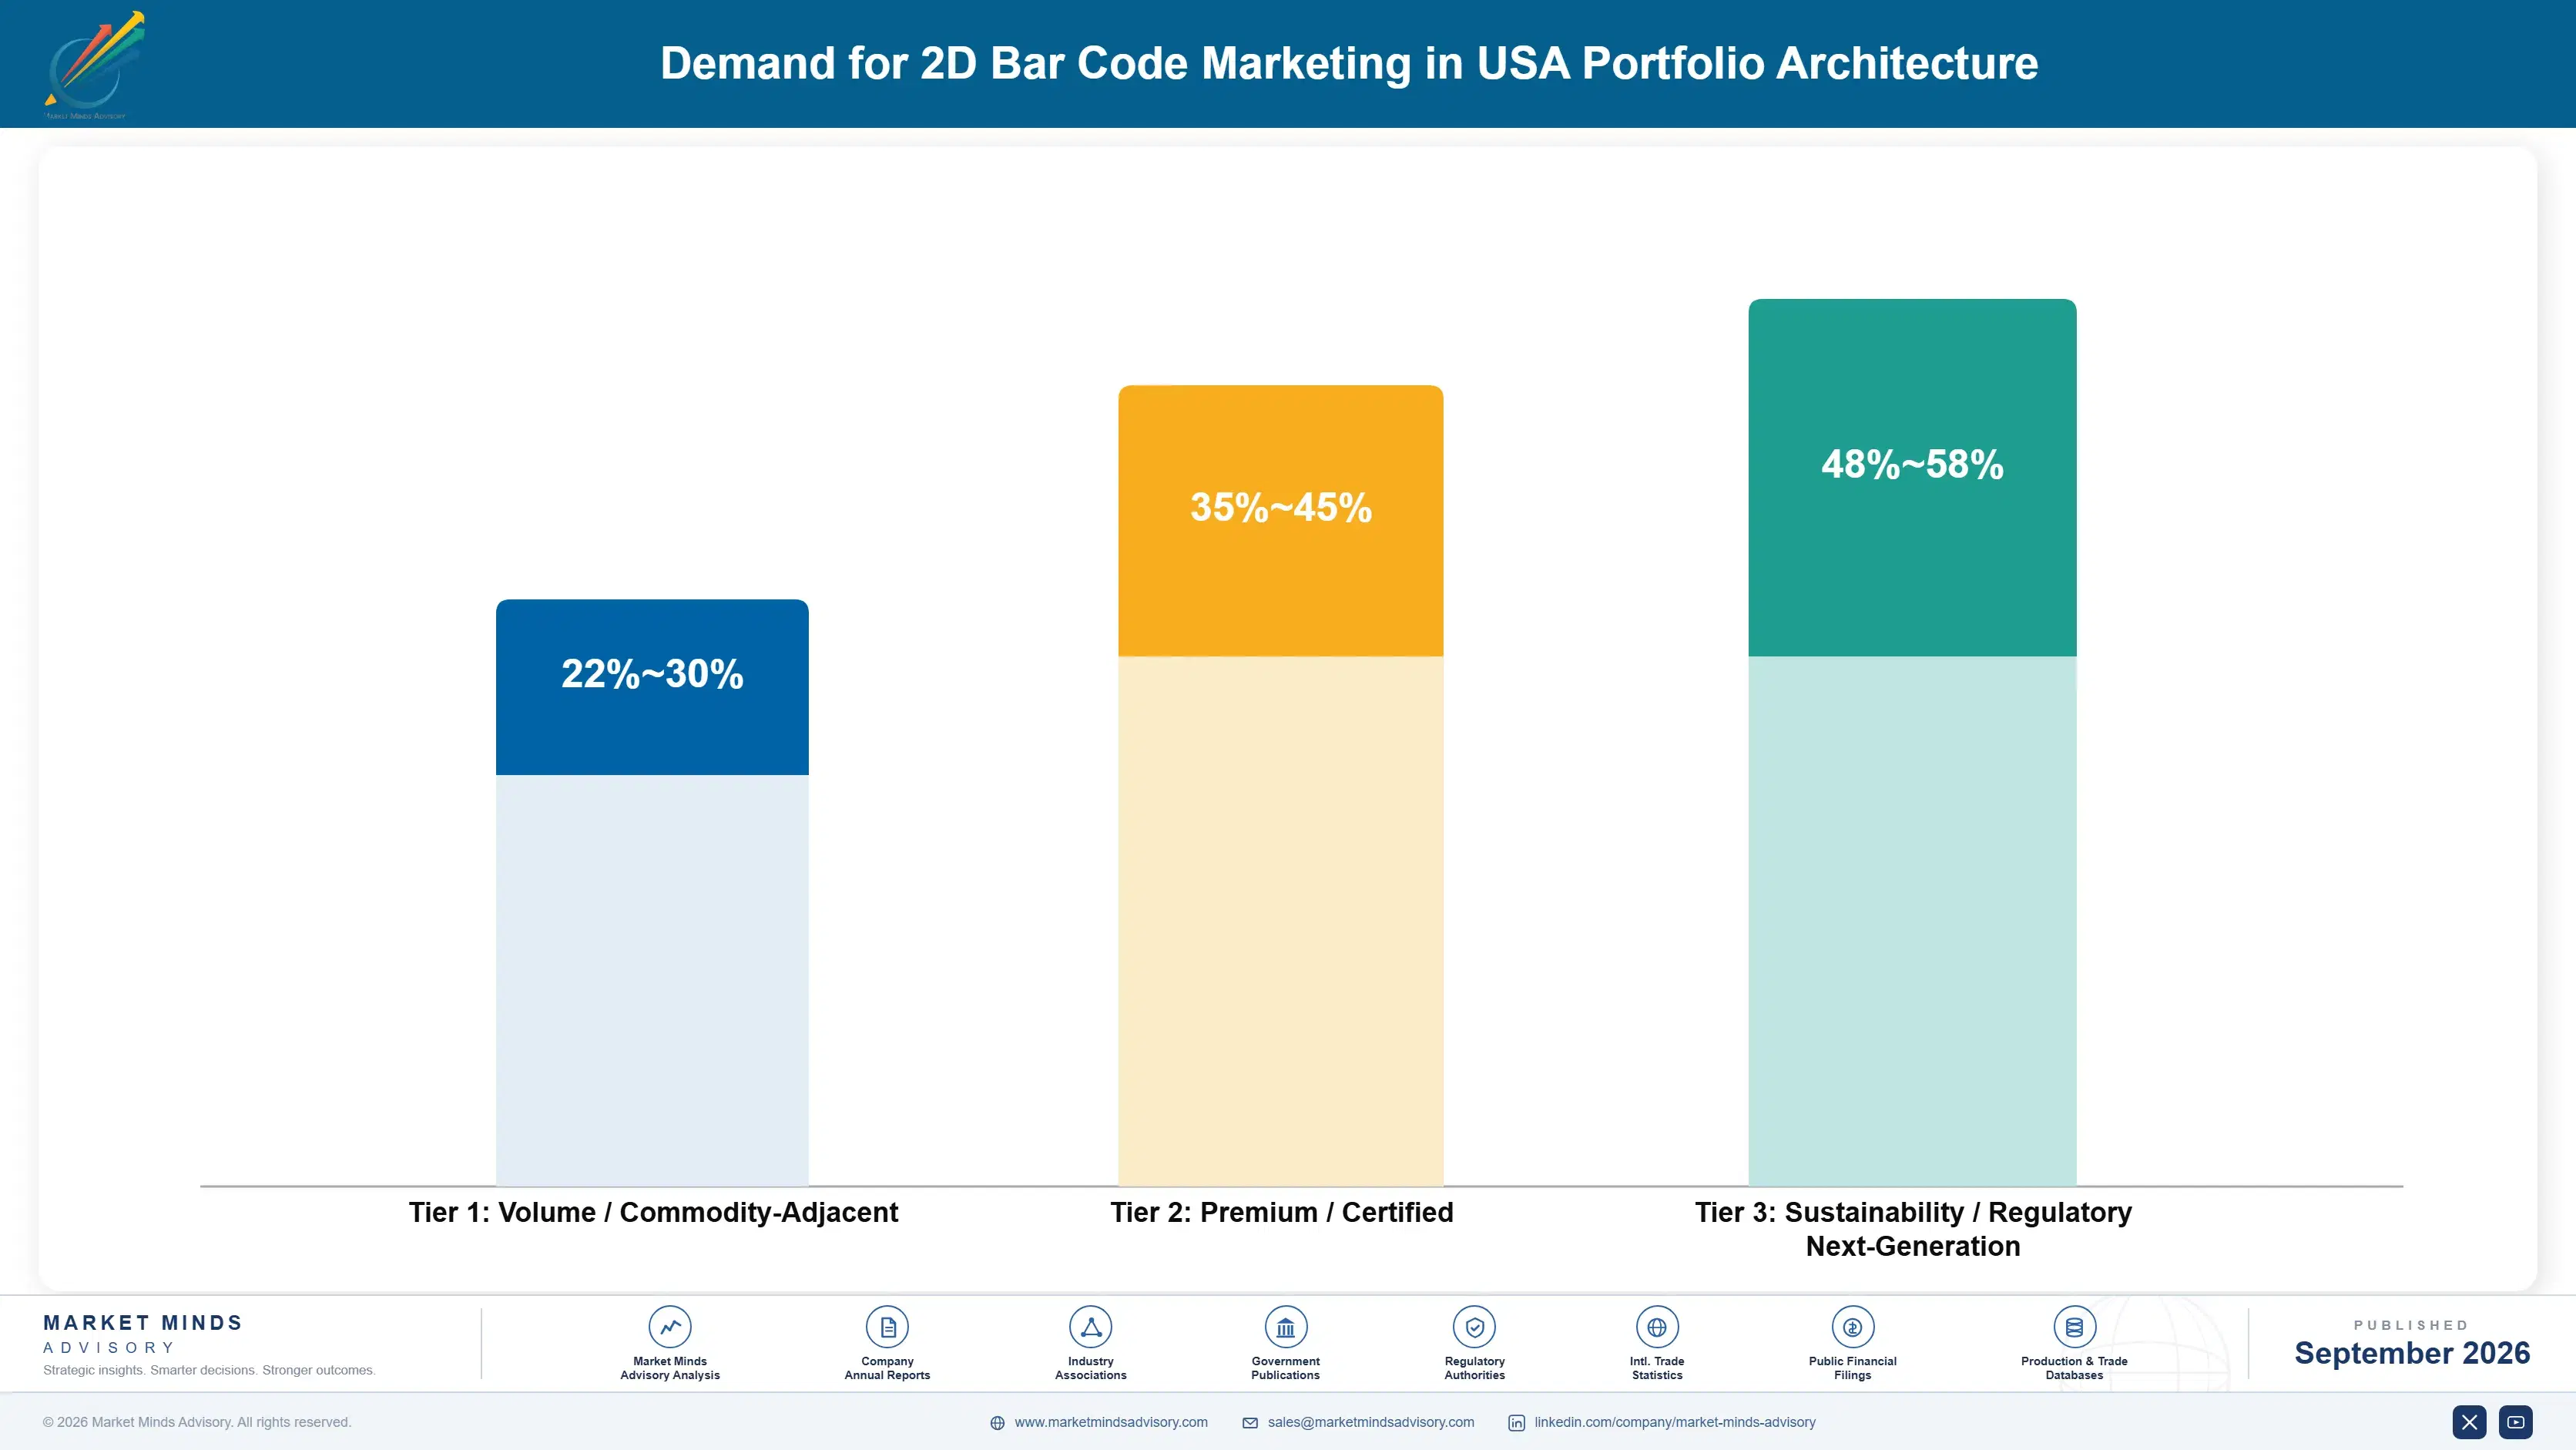
Three tiers structure this market's margin economics, from volume static code generation sold on price to certified attribution platforms and next-generation incrementality offerings that command the widest margins across the industry. Volume tier competition remains intense on unit price alone, while premium and next-generation tiers reward vendors with attribution and retail media integration capability that basic code generation competitors cannot easily replicate at comparable cost.
Tension between volume and premium tiers plays out most visibly among small local businesses, where budget-constrained buyers often choose basic static codes despite the long-term cost of forgoing attribution insight over a campaign's lifecycle. Premium tier buyers, largely consumer packaged goods and national retail brands pursuing verified attribution, are willing to pay considerably more for integrated analytics and retail media bundled into a single accountable vendor relationship.

High-value margin pools concentrate overwhelmingly in the sustainability and regulatory tier, where retail media integration and incrementality testing both command premium pricing well above ordinary code generation margins across most major programs. Vendors positioning exclusively in the volume tier face the greatest long-term margin compression as code generation costs standardize further and price competition intensifies among an expanding field of low-cost static code providers entering the space.

Volume / Commodity-Adjacent

Standardized static QR code generation competing primarily on unit price with minimal analytics bundling, sold largely to small local businesses and budget-constrained marketing teams managing tight annual budgets nationwide today.
Gross Margin: 22-30%

Premium / Certified

Dynamic codes bundled with attribution analytics and cross-channel tracking, sold to consumer packaged goods and national retail brands pursuing verified marketing spend justification and incremental sales measurement each fiscal quarter.
Gross Margin: 35-45%

Sustainability / Regulatory / Next-Generation

Retail media integration and incrementality testing platforms sold as measurement infrastructure to brands facing escalating attribution accountability and tightening privacy compliance requirements across most channels, product formats, and campaign types.
Gross Margin: 48-58%
united-states-2d-bar-code-marketing-market-portfolio-architecture-1788452048775

High-value Sub-segments and Strategic Watch-out

Dynamic QR Campaign Analytics and Attribution Platforms

Dynamic QR campaign analytics and attribution platforms combine the fastest growth rate in the entire market with premium subscription pricing, making them the clearest high-value high-growth opportunity for vendors with the patient capital needed to build attribution accuracy rather than rely purely on commodity code generation sales alone.

Retail Media Network Integration Services

Retail media network integration services offer strong margins tied to unified advertising reporting, though growth trails the attribution analytics segment since it depends on retailer program expansion timelines rather than pure vendor-driven demand alone, making this a high-value but moderate-growth opportunity worth watching closely for further acceleration.

Static QR Code Generation

Static QR code generation remains the volume core of this market, generating steady if unspectacular revenue as the entry point most small businesses specify first before considering attribution or retail media add-ons that vendors hope to attach later during subsequent campaign renewal cycles across the brand's marketing budget.

Consumer Scan Fatigue

Scan fatigue among consumers represents a strategic watch-out given persistent engagement rate declines that could undermine platform value regardless of headline attribution accuracy claims, making a genuine content value proposition a critical priority vendors must address collectively or risk losing brand confidence permanently over time.

Attribution Contracts Anchor Renewal Revenue

Once a brand's marketing analytics dashboard depends on a specific platform's historical scan data and campaign benchmarks, switching vendors mid-campaign means losing comparative baseline data, a cost few marketing teams choose to absorb. This creates a renewal dynamic stronger than typical software subscription patterns, since campaign performance reviews rely on multi-period comparison that resets entirely if a brand switches platforms mid-cycle before campaign completion.
Adoption depth varies sharply by end-use vertical: consumer packaged goods brands running national retail campaigns adopt full attribution suites quickly, while small and mid-size local businesses often use basic static code generation only. Restaurant and hospitality brands show intermediate adoption, driven less by attribution sophistication and more by operational necessity for contactless menu and ordering access that persisted well beyond the original pandemic use case.

A generational shift is underway as younger marketing managers who grew up with digital advertising dashboards expect physical marketing channels to provide the same real-time performance data as online ad platforms. Procurement authority is also shifting from brand and creative agencies toward performance marketing and data analytics teams who evaluate platforms on attribution accuracy rather than code design aesthetics alone, changing who vendors need to court.
united-states-2d-bar-code-marketing-market-end-use-penetration-index-1788452049275

Where Attribution Wins Marketing Budget

These are among the four positions where our research anticipates prominent divergence between winners and laggards over the coming forecast period. Each is grounded in the demand model, the regulatory perimeter, and the announced capacity pipeline.
01 / ATTRIBUTION SOFTWARE INVESTMENT

Build or acquire attribution depth before code generation margins compress further

Vendors still selling static code generation as standalone product are ceding the most durable and profitable revenue stream in this entire market to competitors who bundle attribution analytics from day one. The gap will widen further as brands increasingly require verified scan-to-purchase attribution that only software-enabled platforms can reliably deliver at meaningful scale across dozens of campaigns simultaneously. MMA expects code-only vendors to lose specification battles on enterprise brand contracts within the next three to four years unless they acquire or build credible attribution capability soon.
02 / RETAIL MEDIA NETWORK ALIGNMENT

Prioritize retail media integration before dashboard standards consolidate around fewer vendors

Retail media network integration is quickly becoming table stakes rather than a differentiator, and vendors who wait risk losing specification battles to competitors already embedded in retailer advertising dashboard workflows nationwide. Early movers are capturing a disproportionate share of unified reporting budgets, building relationships with retail media teams that latecomers will struggle to replicate quickly once preferred vendor lists solidify further. MMA views this window as narrowing steadily over the next two to three years as major retailers finalize preferred integration partner requirements across their networks.
03 / INCREMENTALITY MEASUREMENT RIGOR

Invest in incrementality testing to defend attribution claims against scrutiny

Marketing teams increasingly question whether scan-to-purchase attribution reflects genuine causation rather than correlation, and vendors who cannot demonstrate rigorous incrementality testing risk losing renewal contracts to competitors who can. Vendors building controlled testing methodology now are positioned to capture premium-tier contracts that less rigorous competitors simply cannot defend under increasing marketing budget scrutiny and accountability pressure. MMA expects incrementality rigor to become a baseline requirement within the next several years as brands demand measurement standards comparable to established digital advertising.
04 / CONSUMER ENGAGEMENT VALUE DESIGN

Design genuine scan-time value to counter rising consumer scan fatigue

Consumer scan fatigue is becoming a meaningful threat to platform value as engagement rates decline in campaigns offering minimal reason for consumers to scan beyond a generic landing page experience. Vendors emphasizing exclusive content, gamification, and immediate tangible rewards are positioned to defend engagement rates better than competitors relying solely on basic redirect functionality and static landing pages. MMA recommends vendors invest in genuine consumer value design immediately rather than waiting for declining engagement rates to further erode brand confidence in the channel.

Engagement Snapshot From the Field

A live engagement with an industry participant carrying material or product regulatory and market exposure ahead of a defining policy shift, showing how our research translates into a defensible multi-year portfolio strategy.
MARKET MINDS ADVISORY · CLIENT ENGAGEMENT SUMMARY
Demand for 2D Bar Codeing in USA Producer Strategic Portfolio Review and Transition Roadmap 2026·Investment Scenario on Demand for 2D Bar Codeing in USA Exposure Evaluation 2025-26
CLIENT PROFILE
The client is a national consumer packaged goods brand running dynamic QR code campaigns across roughly 200 SKUs distributed through major US grocery and mass retail chains nationwide. Facing pressure to justify continued packaging marketing spend against digital advertising alternatives, the brand sought guidance on which attribution vendor could reliably demonstrate incremental sales lift given its specific retail distribution footprint and existing platform investment.
STRATEGIC CHALLENGE
The client needed to evaluate competing attribution platforms without a clear framework for comparing incrementality methodology claims, risking a costly platform switch that failed to deliver defensible attribution data as promised on time and within budget. Internal teams lacked the technical expertise needed to assess vendor measurement rigor claims independently.
MMA APPROACH
MMA conducted a vendor capability assessment across the five leading attribution platforms, benchmarking incrementality methodology claims against documented field outcomes reported by comparable consumer packaged goods programs. The engagement produced a vendor shortlist tied to projected attribution defensibility and total account cost across a three-year contract horizon for the client's specific retail footprint.
KEY FINDINGS
  1. Two of five evaluated vendors met the incrementality testing standards required by the client's internal marketing measurement committee (client-reported, unverified by MMA).
  2. Switching to the recommended vendor was projected to reduce disputed attribution claims by roughly 40 percent across the portfolio (client-reported, unverified by MMA).
  3. Retail media integration reduced manual reporting labor by 30 percent within the first four months of deployment time (client-reported, unverified by MMA).
  4. Vendor contract terms varied by up to $850,000 annually across the five platforms evaluated during the assessment period (client-reported, unverified by MMA).
CLIENT PROFILE
The client is a national consumer packaged goods brand running dynamic QR code campaigns across roughly 200 SKUs distributed through major US grocery and mass retail chains nationwide. Facing pressure to justify continued packaging marketing spend against digital advertising alternatives, the brand sought guidance on which attribution vendor could reliably demonstrate incremental sales lift given its specific retail distribution footprint and existing platform investment.
STRATEGIC CHALLENGE
The client needed to evaluate competing attribution platforms without a clear framework for comparing incrementality methodology claims, risking a costly platform switch that failed to deliver defensible attribution data as promised on time and within budget. Internal teams lacked the technical expertise needed to assess vendor measurement rigor claims independently.
MMA APPROACH
MMA conducted a vendor capability assessment across the five leading attribution platforms, benchmarking incrementality methodology claims against documented field outcomes reported by comparable consumer packaged goods programs. The engagement produced a vendor shortlist tied to projected attribution defensibility and total account cost across a three-year contract horizon for the client's specific retail footprint.
KEY FINDINGS
  1. Two of five evaluated vendors met the incrementality testing standards required by the client's internal marketing measurement committee (client-reported, unverified by MMA).
  2. Switching to the recommended vendor was projected to reduce disputed attribution claims by roughly 40 percent across the portfolio (client-reported, unverified by MMA).
  3. Retail media integration reduced manual reporting labor by 30 percent within the first four months of deployment time (client-reported, unverified by MMA).
  4. Vendor contract terms varied by up to $850,000 annually across the five platforms evaluated during the assessment period (client-reported, unverified by MMA).
RECOMMENDED STRATEGY
Phase 1: Phase one migrates the highest-volume SKU categories to the recommended platform within the first five months of the overall program. Phase 2: Phase two extends the migration to remaining SKU categories while renegotiating existing retail media integration terms directly with each retailer. Phase 3: Phase three establishes ongoing incrementality testing and ties platform performance reviews to quarterly attribution benchmarks going forward each fiscal year.
OUTCOME
The client completed the platform migration within seven months, reporting attribution defensibility improvements consistent with initial MMA projections across the SKU portfolio (client-reported, unverified by MMA). The vendor evaluation framework was subsequently adopted for the client's ongoing marketing technology procurement decisions, extending its use beyond the original attribution engagement scope.

Frequently Asked Questions

Foundational context covering the market sizes, CAGR, scope, country, region and competition that inform every finding below. This section is provided to cover basics and most often pre-purchase conversations, answered from the MMA Primary Research Dataset.

What is the current size of the Demand for 2D Bar Code Marketing in USA Market?

The global 2D barcode marketing platform market, of which the USA is the analytical focus of this report, is valued at $4.2 billion in 2025. Growth is driven primarily by retail media integration and attribution demand.

How large will the Demand for 2D Bar Code Marketing in USA Market be by 2036?

The market is projected to reach $11.4 billion by 2036. This reflects sustained demand from attribution analytics adoption and expanding retail media network integration requirements.

What is the CAGR for the Demand for 2D Bar Code Marketing in USA Market 2026 to 2036?

The market is expected to grow at a compound annual rate of 9.5 percent between 2026 and 2036. Bull and bear scenarios range from 8.3 to 10.7 percent.

Which segment is growing fastest?

Dynamic QR Campaign Analytics and Attribution Platforms leads at roughly 15.5 percent annually, about 1.63 times the overall market rate. Brands requiring verified scan-to-purchase attribution are the primary growth catalyst driving adoption.

Who are the major companies in the Demand for 2D Bar Code Marketing in USA Market?

Flowcode, Beaconstac, QR Tiger, Uniqode, and Scanova lead the competitive field across code generation, attribution analytics, and retail media integration categories. Together the top five platforms hold 41 percent combined revenue share.

Which country is growing fastest?

India leads at roughly 13.5 percent annually, driven by brands using existing scan behavior built through widespread digital payment platform adoption across the entire country nationwide.

Report Segmentation Architecture

The full report scope spans multiple orthogonal segmentation dimensions, with cross-tabulated demand data provided for each dimension pair. Coverage extends further to regional breakdowns, trend trajectories, and the competitive detail needed to support segment-level decision-making.
  • Static QR Code Generation
  • Dynamic QR Campaign Analytics and Attribution Platforms
  • Retail Media Network Integration Services
  • Incrementality Testing and Measurement Services
  • Packaging Design Software Integration Tools
  • Consulting and Campaign Strategy Services
  • Consumer Packaged Goods Brands
  • Retail and Grocery Chains
  • Restaurant and Hospitality Brands
  • Media and Entertainment Companies
  • Direct Brand Purchase Channel
  • Retail Media Network Partnership Channel
  • Packaging Vendor Integration Channel
  • Marketing Agency Reseller Channel

By Region

  • North America
  • Western Europe
  • East Asia
  • South Asia and Pacific
  • Latin America
  • Middle East and Africa
  • Eastern Europe

Scope, Methodology, and Coverage

Every figure in this report is reproducible from documented input assumptions. The scope below maps the historical period, the forecast horizon, the segmentation dimensions, and the countries covered, alongside the underlying primary and qualitative methodology.
Historical Period
2020 to 2025
Forecast Period
2026 to 2036
Base Year
2025 (USD billions; MMA Primary Research Dataset, September 2026)
Market Definition
This report covers dynamic and static 2D barcode generation platforms, campaign analytics software, and scan attribution services used by US brands for marketing, packaging, and in-store engagement. It excludes payment-processing QR codes, industrial inventory barcodes, and general mobile app deep-linking services unrelated to marketing campaigns.
Quantitative Units
USD billions (current prices)
Segmentation Dimensions
By Product Type; By End-Use Industry; By Commercial Dimension; By Region
Regions Covered
North America, Western Europe, East Asia, South Asia and Pacific, Latin America, Middle East and Africa, Eastern Europe
Countries Covered
USA, China, Germany, France, UK, Japan, South Korea, India, Australia, Canada, Brazil, Mexico, Indonesia, Vietnam, Thailand, Malaysia, UAE, Saudi Arabia, South Africa, Nigeria, Turkey, Poland, Netherlands, Italy, Spain, Sweden, Switzerland, Argentina, Colombia, Singapore, and additional markets relevant to this sector
Key Companies Profiled
Flowcode Inc, Beaconstac Inc, QR Tiger Inc, Uniqode Inc, Scanova Inc, Bitly Inc, QR Code Generator Pro, Scanbuy Inc, Zappar Ltd, Rebrandly Inc, Cardinal Path LLC, GS1 US Inc, Kroger Precision Marketing, Walmart Connect, Criteo SA, QRStuff Pty Ltd, Databar Inc, NeoReader GmbH, Delivra Inc, Vibenomics Inc
Quantitative Methodology
Primary survey, n=3,800 respondents, Q4 2025, six countries; demand-side model with trade association cross-validation
Qualitative Methodology
47 expert interviews, Q4 2025; applied to validate demand model assumptions, identify emerging dynamics, and assess competitive positioning
Report Format
PDF and XLSX data workbook (Word format preview document)
Publisher
Market Minds Advisory
Report Code
MMA-2026-TEC-249
Published
September 2026
Contact
sales@marketmindsadvisory.com | www.marketmindsadvisory.com

Purchase the full Demand for 2D Bar Code Marketing in USA Report (2026 to 2036).

This report delivers a complete assessment of the global 2D barcode marketing platform market, using the USA's retail media network leadership as an analytical lens for attribution-driven marketing technology through 2036. It quantifies segment-level growth rates, regional demand concentration, and competitive positioning among twenty leading platform vendors. The analysis draws on primary survey data from 3,800 respondents and 47 expert interviews conducted in the fourth quarter of 2025. Readers gain a clear view of where attribution revenue concentrates and which vendors are best positioned to capture it.
Ten-year market sizing and growth forecasts
Segment-level CAGR and demand growth analysis
Competitive benchmarking of twenty leading vendors
Regional demand architecture across seven regions
Input cost and cloud infrastructure risk assessment
Strategic revenue lever identification for vendors

Built For The People Who Decide

From boardroom strategy to bench-side execution, this report is read cover-to-cover by leaders shaping the next decade of their industry, turning demand scenarios, market dynamics and valuation benchmarks into decisions.
CXOs/ Presidents/ VPs/ Managers
M&A and Corporate Development
Strategy Teams and R&D Heads
Procurement and Product Directors
Regulatory and Compliance Leaders
Investor Relations and Equity Analysts