Market Minds Advisory
Demand for Virtual Event Platforms in UK

Demand for Virtual Event Platforms in UK: Demand for Virtual Event Platforms in UK: Attendance Reality, Consented Data and the Webinar That Was Never an Event

Roughly 38% of registrants actually attend, and the industry still quotes registrations. What British buyers are really purchasing is consented first-party contact data, and the video was never the hard part.

Lead Analyst

Published

September 2026

Make Smarter Decisions with Customized Research Insights

Request a free sample report and evaluate market opportunities, growth trends, and competitive dynamics relevant to your business needs.

2025 MARKET VALUE$5.4BMarket Size 2025
2036 FORECAST VALUE$13.4BBase Case , 2026 to 2036
CAGR 2026 TO 20368.6 %Bull 9.8% / Bear 7.4%
INCREMENTAL OPPORTUNITY$7.5BNet 10- year value creation
EXPANSION MULTIPLE2.28x2036 value over 2026 base
Strategic Levers
M&A Pipeline
Regional Outlook
Country Rankings
Competitive Intelligence
Segmental Deep-dive
Call-Us : 91 93563 13602

Executive Snapshot and Market Trajectory.

The pure virtual conference did not survive the return of in-person events, and a good deal of this industry spent two years pretending otherwise. What survived is the webinar, which was always a marketing channel wearing an event costume, and roughly 71% of spend now comes from marketing budgets.
Webinar and demand generation platforms grow at 12.9%, half again the market rate of 8.6%, because they produce consented contact data rather than attendance. Event data and attribution tooling follows at 11.2% for exactly the same reason. Western Europe takes 33% of value, with the United Kingdom the analytical centre of this report and the largest business events market in Europe by some distance. Virtual trade show platforms grow at 3.2% and barely justify maintenance.
Concentration sits near 33% across the top five on measured platform subscription and service revenue, split between general communication vendors and event specialists competing for the same budget. Registration to attendance runs about 38%, and the industry still reports registrations. British buyers who have measured that number buy very differently from those who have not. Average session duration sits near 24 minutes, which is the other number.
Market Definition
This market covers software platforms used to deliver, register and measure online and hybrid business events, spanning webinar and demand generation platforms, hybrid event extension and registration, virtual conference and trade show platforms, internal and employee event platforms, learning and certification event delivery, and event data and attribution tooling. Value is measured as platform subscription, usage and attributable service revenue at supplier level, with the United Kingdom treated as the analytical centre within a global sizing frame. General video conferencing for internal meetings, physical venue and production services, marketing automation suites, and consumer streaming and entertainment platforms are excluded.
Base Year Value
$5.4B in 2025 (MMA Primary Research Dataset, September 2026)
Forecast Period
2026 to 2036, eleven discrete annual values
CAGR
8.6% base case. Bull 9.8%. Bear 7.4%.
Fastest Growth Segment
Webinar and Demand Generation Platforms: 12.9% CAGR
Fastest Growth Country
India: 11.6% CAGR
Fastest Growth Region
South Asia and Pacific: 10.8% CAGR
Largest Region
Western Europe: 33% of 2025 global value
Market Leaders
Zoom Communications, Cvent, ON24, Kaltura and RingCentral lead on measured platform subscription and service revenue. Source: MMA Primary Research Dataset, July 2026.
Primary Survey
n=3,800 procurement and R&D decision-makers, Q4 2025, six countries
Methodology
Demand-side build-up, cross-validated against public data, 47 expert interviews

Demand for Virtual Event Platforms in UK Market Forecast Scenarios

united-kingdom-virtual-event-platforms-market-size-forecast-scenario-1788425186956
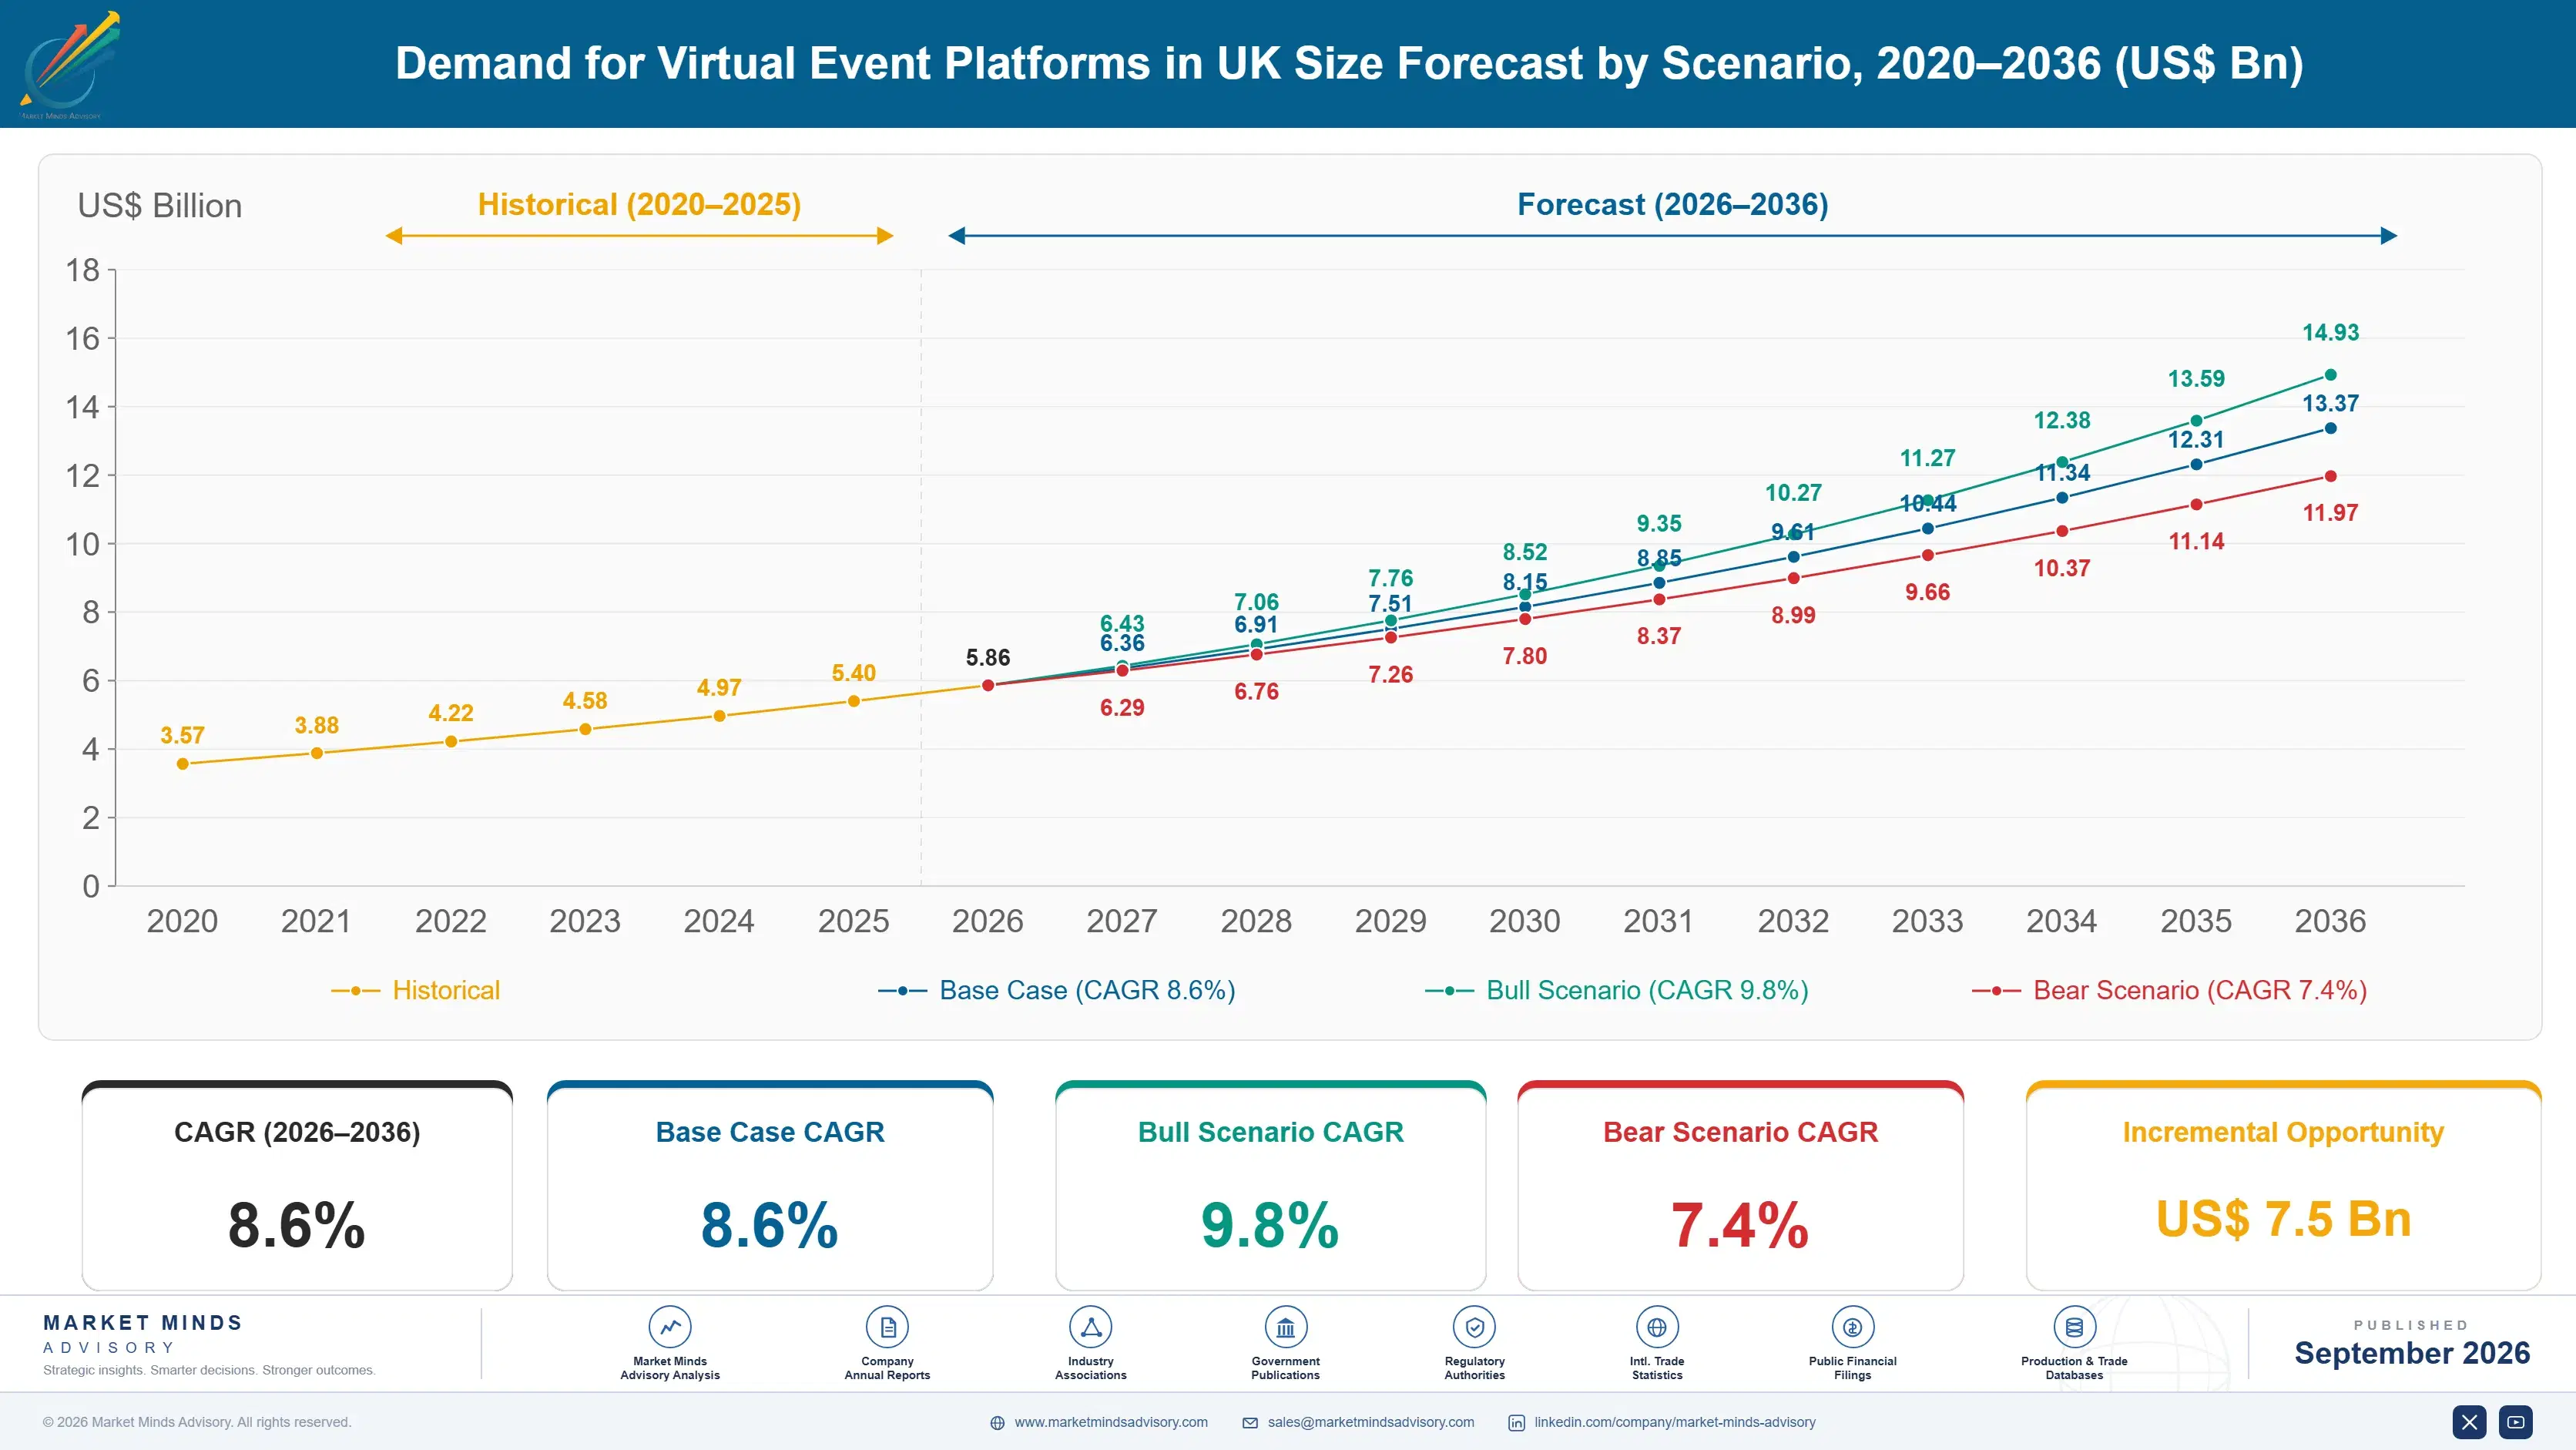
Growth ran at 7.6% from 2020 to 2025, which conceals an extraordinary spike and an equally severe correction rather than steady expansion. Virtual conference platforms raised money and headcount against 2021 demand that reversed almost completely once travel resumed, and several were sold or wound down. British marketing teams kept their webinar programmes throughout, because those never depended on anybody being unable to travel.
The base case at 8.6% rests on three mechanisms. Webinar programmes function as demand generation rather than as events, funded from marketing budgets representing about 71% of spend and measured against pipeline rather than attendance. Consented first-party contact data has become scarce as third-party tracking declined, and an attendee providing consent at 62% yield is worth more than the session producing them. Third, hybrid extension attaches platform spend to physical events that are themselves growing again.
The bull case at 9.8% assumes attribution matures enough that marketing teams can defend webinar spend against other channels on measured pipeline. The bear case at 7.4% is that buyers finally price the 38% attendance rate honestly, conclude a webinar is an expensive way to reach a modest audience, and move budget to channels whose numbers were never inflated.

The Registration Number Is Not the Audience

Two numbers reframe this market. About 38% of registrants actually turn up, and those who do stay around 24 minutes. Every case study quotes registrations, because that is the flattering figure and attendance is the honest one. British teams who measured both quietly rebuilt their programmes around fewer sessions with better follow-up, and their platform requirements changed accordingly.
TOP FIVE CONCENTRATION33%Fragmented across communication vendors and event platform specialists
REGISTRATION TO ATTENDANCE38%Registrants who actually join the live session itself
AVERAGE SESSION DURATION24 minutesTime attendees remain before leaving a typical session
MARKETING BUDGET SHARE71%Spending funded from marketing rather than from events budgets
ON-DEMAND VIEW SHARE54%Content consumed after the live session has ended
CONSENTED CONTACT YIELD62%Attendees providing usable consent for later follow-up contact
The product being bought is not video delivery. Streaming a session reliably stopped being difficult years ago and free tools do it adequately. What buyers pay for is everything around the session: registration capture, consent handling, on-demand access covering the 54% of viewing that happens later, and the data connecting an attendee to a pipeline record. Platforms selling production quality compete on the part nobody struggles with.
In the United Kingdom, consent rules make data a sharper question than technology. An attendee record is only useful if the consent behind it holds, and yield sits near 62% once genuine permission rather than a pre-ticked box is needed. That constraint has been good for platforms with proper consent handling and awkward for those treating registration as a form. Roughly 71% of spend comes from marketing, and marketing is judged on usable contacts.
"The honest question for any buyer is what a session actually delivered: not registrations, not views, but consented contacts who stayed long enough to hear the point. Most organisations have never calculated it. The ones that have generally run half as many webinars and get considerably more out of them."
Director, Marketing Technology and Digital Engagement Practice · MMA Technology Practice · September 2026

Market Trends

Consented First-Party Data Becomes the Actual Product

As third-party tracking declined across browsers and advertising platforms, a contact who has voluntarily provided details and consent has become considerably harder to obtain, which is exactly what a webinar registration produces. Consented yield sits near 62% where permission is properly sought rather than assumed. British buyers operating under strict consent rules evaluate platforms on how cleanly that record passes into their marketing systems, not on video quality. Webinar and demand generation platforms grow at 12.9% on that logic, which has nothing to do with events at all. Video quality has not decided a contract in years.
Market Impact: Draws 71% from marketing budgets
On-Demand Viewing Overtakes the Live Session

Roughly 54% of content consumption now happens after the live session ends, which means the scheduled broadcast is increasingly a production exercise for an asset that gets watched later by people who never registered for the original. That changes what matters: searchable archives, gated access and follow-up triggers rather than live interaction features. Platforms built around real-time engagement are optimising the smaller half of the audience. Buyers who measure post-event viewing generally restructure their programmes around fewer, better-produced sessions. The scheduled broadcast is increasingly a production event staged for an archive that most of the audience will watch later.
Market Impact: Serves 4 language markets simultaneously

Market Opportunities and Growth Drivers

Marketing Budgets Fund This, Not Events Budgets

About 71% of platform spend now comes from marketing rather than from event or corporate communications budgets, which changes both the buying criteria and the survival test entirely. Marketing spend is measured against pipeline contribution and reallocated quarterly, so a platform that cannot demonstrate contribution competes against paid search and content syndication on their terms. That favours platforms with attribution tooling and disadvantages those selling attendee experience. British marketing teams reallocate faster than most European peers. Attendee experience arguments do not survive a quarterly reallocation review, whatever the events team thinks of them.
Market Impact: Delivers 38% of registered audience

English Language Content Serves Several Markets Together

British organisations produce webinar content that serves Irish, Nordic, Benelux and much of the Middle Eastern business audience without translation, which improves the economics of every session considerably against a French or German equivalent reaching one market. That advantage made United Kingdom marketing teams early and heavy adopters, and it sustains programme volumes that would not otherwise justify the production effort. Content reuse across markets is the underlying reason British webinar spend runs ahead of comparable European economies. Continental peers producing in one language carry roughly the same production cost against a fraction of the reach.
Market Impact: Costs 0 incremental spend

Market Restraints and Challenges

Attendance Rates Do Not Survive Honest Measurement

Registration to attendance runs near 38% and average session duration sits around 24 minutes, so a webinar reporting 800 registrants delivered perhaps 300 people who stayed a third of an hour. The root cause is that registering costs nothing and attending costs time, which no platform feature changes. Commercially this makes the channel considerably more expensive per genuine contact than headline figures suggest. Suppliers mitigate by reporting attendance and engagement rather than registrations, which is honest and costs them the flattering number. Nobody who reports registrations wants that comparison made in front of a finance director.
Market Impact: Yields consent from 62% of attendees

Free Video Tools Meet the Basic Requirement Adequately

Reliable streaming of a presentation to several hundred people is no longer difficult and general communication tools do it at no incremental cost to organisations already paying for them. The root cause is that the technically hard part of this market was solved years ago and the remaining difficulty sits in data, consent and attribution instead. Commercially this caps pricing for anything positioned as a broadcast tool. Suppliers mitigate by moving decisively into data and attribution, where the general tools do not compete. Broadcast capability alone is no longer a business here.
Market Impact: Covers 54% of total viewing
4 additional market trends, 3 additional growth drivers, and 2 additional restraints and challenges are covered in the full report. Contact sales@marketmindsadvisory.com to access the complete intelligence.

Segment CAGR and Growth Architecture

Segmentation follows platform function, because function determines which budget pays and what the buyer is measured on. A demand generation webinar answers to marketing and is judged on pipeline. An internal all-hands answers to communications and is judged on reach. A virtual trade show answers to nobody at all any more, which is why that segment barely grows.
united-kingdom-virtual-event-platforms-market-market-share-analysis-1788425187493

Webinar and Demand Generation Platforms

Webinar platforms grow at 12.9%, half again the market rate of 8.6%, and they are not really event products at all. They are contact acquisition channels funded from marketing budgets, competing against paid search and content syndication rather than against conference software. Consented contact yield near 62% is the metric that matters, since third-party tracking decline made voluntarily provided data genuinely scarce. British adoption runs ahead of comparable European economies because English content serves several markets from one production. The commercial risk is that attribution eventually shows what a contact actually costs against other channels. British adoption also reflects marketing organisations that reallocate budget faster than most European peers, which cuts both ways for suppliers.
CAGR 12.9%

Event Data and Attribution Tooling

Attribution tooling grows at 11.2% because a marketing team spending from a budget reallocated quarterly must show what the spend produced, and event platforms have historically reported registrations rather than pipeline. Connecting an attendee record to an opportunity in a customer relationship system is the function being bought, and it is considerably harder than it sounds once consent, deduplication and multi-touch attribution are involved. British buyers operating under strict consent rules examine this closely. The segment's awkwardness is that better attribution may eventually prove the channel underperforms, which suppliers rarely mention in a proposal. Deduplication across marketing and sales systems is where most implementations actually stall, rather than at the reporting layer buyers evaluate during selection.
CAGR 11.2%
Full segment breakdown across 6 segments available in the complete report.

Regional Architecture and Country Demand Map

This report is United Kingdom centred within a global sizing frame, so regional shares describe where comparable platform value is bought worldwide. Marketing practice, language reach and consent regulation explain the pattern far better than population or business count. Business count predicts almost nothing about platform spend.

Western Europe

Western Europe holds 33%, above the regional band, because the United Kingdom is the analytical subject of this report and British demand sits within a region where consent regulation makes data handling the decisive purchase criterion. The United Kingdom hosts the largest business exhibition market in Europe and its marketing teams adopted webinar programmes earlier and more heavily than continental peers, partly because English content serves Irish, Nordic and Benelux audiences without translation. German and French buyers run smaller programmes reaching single language markets. Regional growth at 7.0% is the slowest anywhere, reflecting early adoption rather than any weakness of requirement. Dutch and Nordic buyers frequently consume British-produced content rather than commissioning their own.
Share: 33% | CAGR: 7.0% (2026 to 2036)

North America

American demand is the largest single national market and is characterised by higher programme volumes, larger platform budgets and considerably more aggressive attribution practice than European buyers apply. Marketing organisations here reallocate budget quarterly against measured pipeline, which rewards platforms with attribution capability and punishes those selling attendee experience alone. Consent requirements are less restrictive than British ones, so contact yield is higher and data quality frequently lower. Growth at 9.4% runs ahead of the market on programme volume expansion and on hybrid attachment to a large physical events industry. Virtual conference platforms raised and lost the most money here, and several were acquired or wound down once travel resumed. The surviving suppliers repositioned around marketing data.
Share: 32% | CAGR: 9.4% (2026 to 2036)
Regional intelligence for 5 additional markets available in the complete report: East Asia, South Asia and Pacific, Latin America, Middle East and Africa, Eastern Europe. Contact sales@marketmindsadvisory.com.
united-kingdom-virtual-event-platforms-market-country-cagr-analysis-1788425188020

Selling Contacts Rather Than Sessions

Every platform in this market can stream a session reliably, which means production capability sells nothing at all. What moves budget is consented contact yield, attribution into a pipeline record, and the on-demand asset that gets more viewing than the live event ever did. Those are marketing arguments made to marketing buyers who reallocate quarterly.

Report Attendance and Engagement, Never Registrations

Registration to attendance runs near 38% and every buyer who measures it discovers the gap within a quarter, at which point a supplier who reported the flattering number has a credibility problem rather than a performance one. Suppliers reporting attendance, duration and engagement by default retain customers through that discovery, and renewal rates differ by roughly 18 percentage points on this alone. It costs the impressive figure in the case study. It buys the renewal that the case study was supposed to produce. Nobody has ever renewed a contract because the case study looked impressive.
Market Impact: Shifts renewal rates by 18 percentage points overall

Build Consent Handling as the Differentiator

British and European consent rules mean an attendee record is worth nothing unless the permission behind it withstands scrutiny, and yield sits near 62% where consent is genuinely sought rather than assumed through a pre-ticked box. Platforms handling consent capture, storage and withdrawal properly pass clean records into marketing systems; those treating registration as a form create liability their customers inherit. Buyers audited on data handling switch away from weak platforms at roughly 3 times the general rate. It is unglamorous engineering that decides contracts. It never appears in a marketing brochure and it decides shortlists.
Market Impact: Switches away at roughly 3 times the rate

Monetise the On-Demand Archive Deliberately Instead

Roughly 54% of viewing happens after the live session, largely by people who never registered for it, and most platforms treat that archive as storage rather than as the larger half of the audience. Gated on-demand access with follow-up triggers converts passive viewing into contact records at meaningful volume, typically adding around 45% more consented contacts per session. The live broadcast is increasingly a production exercise for an asset consumed later. Platforms priced around live capacity are charging for the smaller half. Almost nobody is currently charging for the larger half of what they actually deliver.
Market Impact: Adds around 45% more consented contacts per session

Prove Pipeline Contribution Before Budgets Move

Marketing budgets funding about 71% of this spend are reallocated quarterly against measured contribution, so a platform that cannot connect an attendee to an opportunity competes against paid search on numbers it cannot produce. Attribution capability moves the renewal conversation from event quality to pipeline arithmetic, which is the only ground on which this spend survives a budget review. Platforms with attribution tooling retain roughly 25% better through reallocation cycles. The uncomfortable part is that honest attribution sometimes proves the channel underperforms. Suppliers avoiding that conversation are postponing a review they will not win later.
Market Impact: Retains roughly 25% better through each reallocation cycle

Who Controls the Margin Pool

Concentration sits near 33% across the top five on measured platform subscription and service revenue, which understates how contested the market is because two different kinds of supplier compete for the same budget. General communication vendors bundle webinar capability into subscriptions organisations already hold, making the incremental cost close to nothing. Event specialists sell depth in registration, consent and attribution that the bundled tools do not attempt to provide at all.
Competition runs on three dimensions. Data handling and consent capability is first among British and European buyers, since a record that fails scrutiny is worse than no record. Second is attribution into customer relationship systems, which decides whether the spend survives a quarterly budget review. Third is bundling economics, where general vendors offer adequate capability at effectively zero marginal price.

Two pressures will move positions. Attribution is becoming the ground on which renewals are decided, favouring specialists with genuine integration over vendors offering broadcast capability. Meanwhile bundling continues to compress the low end, and platforms positioned between adequate free tools and genuine data capability are being squeezed from both directions with nowhere obvious left to go, which several are discovering this year.
united-kingdom-virtual-event-platforms-market-company-positioning-matrix-1788425188541

Competitive Moat and Risk Dimensions

ZOOM COMMUNICATIONS

Moat: Bundled subscription economics

Zoom reaches buyers who already hold its subscriptions, which makes webinar capability an incremental decision rather than a new purchase and removes the procurement process specialists must navigate. Its reliability at scale is established and no longer questioned by anybody. Familiarity among attendees reduces the friction that unfamiliar platforms impose on registration and joining.
ZOOM COMMUNICATIONS

Risk: Attribution depth shortfall

Marketing budgets funding roughly 71% of this spend are defended on pipeline contribution, and connecting attendee records into customer relationship systems with consent intact is not what a communications platform was built to do. Specialists compete on exactly that capability. As attribution becomes the renewal criterion, bundling advantage matters less than the data plumbing underneath it.
CVENT

Moat: Registration and event data depth

Cvent holds deep capability in registration, attendee data and event programme management across physical, hybrid and virtual formats, which suits a market where platform spend increasingly attaches to physical events rather than replacing them. Its integration into marketing and customer relationship systems is established rather than aspirational. Enterprise relationships span whole event programmes rather than individual sessions.
CVENT

Risk: Bundled competition at entry

General communication vendors meet the basic webinar requirement at effectively no incremental cost, which removes the entry-level business that historically introduced buyers to specialist platforms. Growth must therefore come from buyers already sophisticated enough to need depth. The company also carries exposure to physical event cycles, which recovered strongly and have historically proven sensitive to economic conditions.

Players Tracked

Prominent Players

Zoom Communications
Cvent
ON24
Kaltura
RingCentral

Other Key Players

GoTo
Webex by Cisco
Microsoft
Bizzabo
Swapcard
Brella
Hubilo
Vimeo
Notified
Splash
Eventbrite
Whova
Airmeet
InEvent
Stova

Recent Developments

FEBRUARY 2025

British marketing teams restructure programmes around fewer measured sessions

Organisations that measured attendance and engagement rather than registrations reduced webinar frequency and increased production and follow-up investment per session. Consented contact yield per session rose materially while total programme cost fell, which surprised several marketing leaders who had assumed volume drove results. Volume had been assumed to drive results.
Signal: Measuring attendance rather than registration consistently produces fewer sessions and considerably better commercial outcomes for buyers.
JUNE 2025

Consent handling becomes a formal procurement requirement for platform selection

British and European buyers began auditing platform consent capture, storage and withdrawal behaviour during selection rather than after deployment, treating attendee records that fail scrutiny as a liability inherited by the customer. Several platforms were excluded from shortlists on this basis alone. Deployment had previously been the point of discovery.
Signal: Data handling has moved from a compliance checkbox into the criterion that decides which platforms reach shortlists.
OCTOBER 2025

Platforms reposition on-demand archives as gated contact acquisition assets

Suppliers began treating post-event content as a primary acquisition channel rather than as storage, adding gated access, follow-up triggers and attribution to viewing that happens after the live session ends. Post-event viewing had already exceeded live attendance across most customer programmes. Pricing models had not caught up with that shift.
Signal: The archive now generates more audience than the broadcast, which most platform pricing has not yet reflected.

What Running a Platform Costs

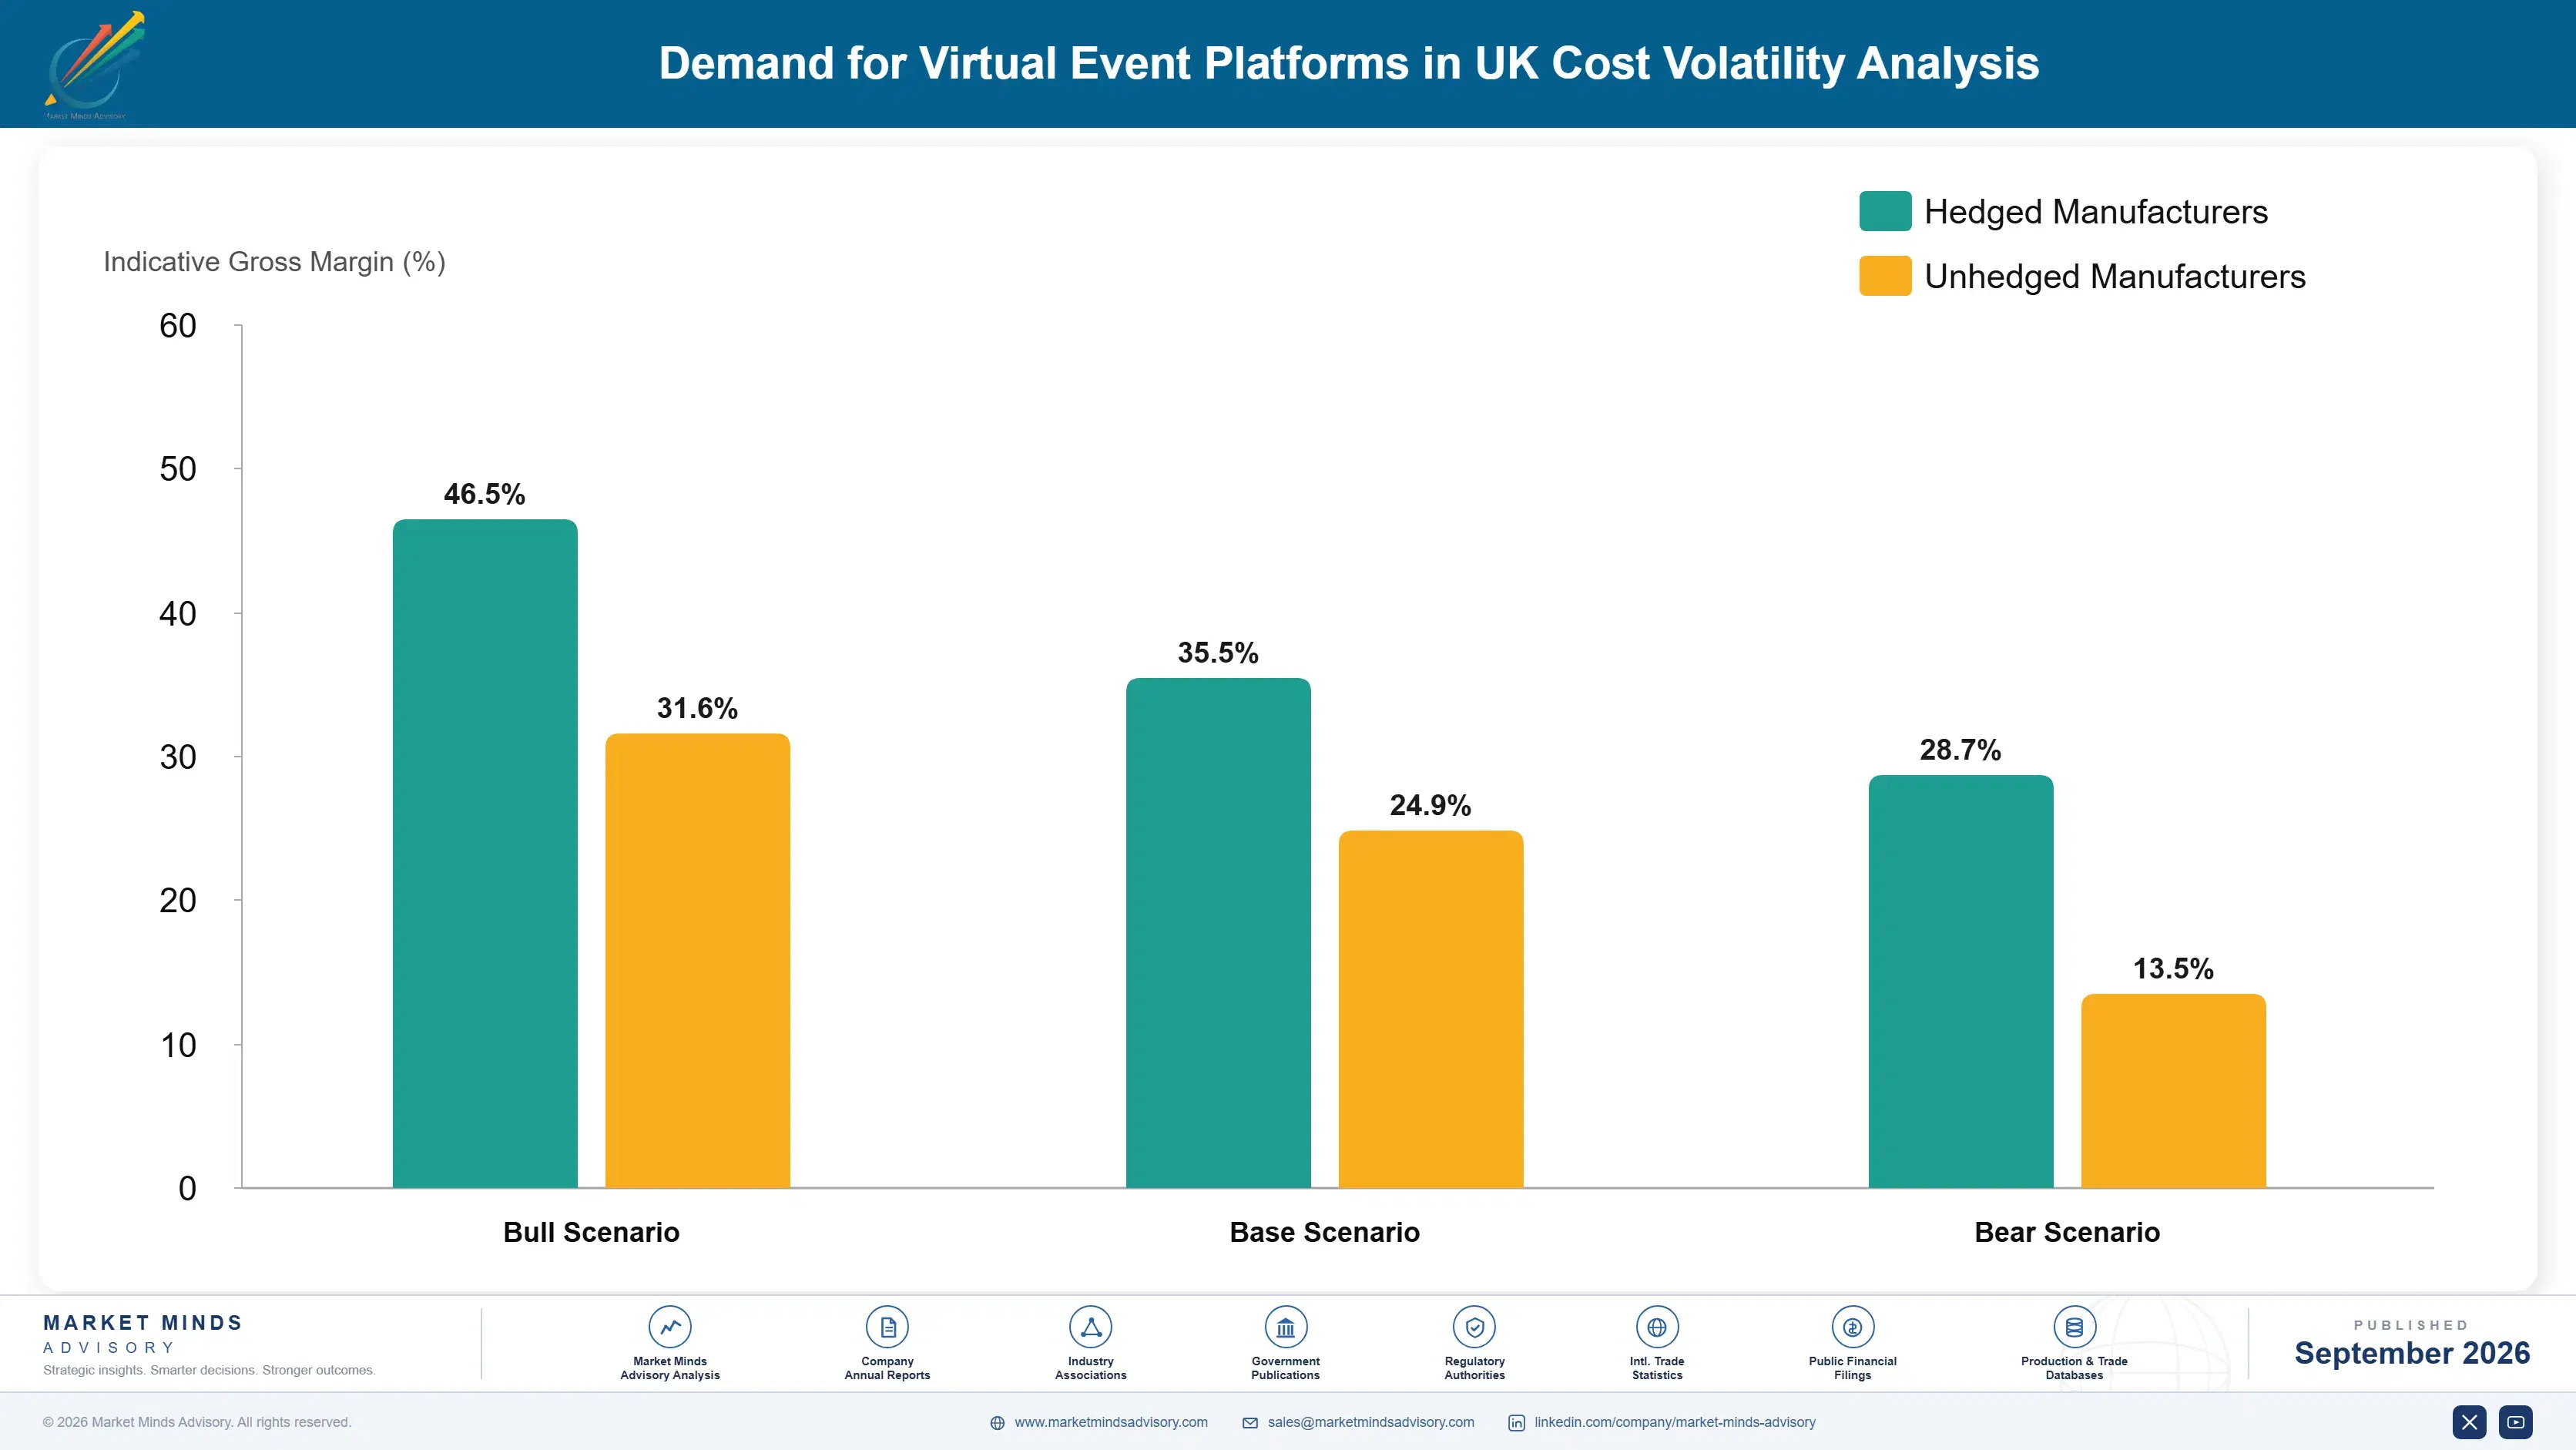
Cost structure is dominated by delivery infrastructure and customer success rather than by software engineering. Streaming bandwidth, transcoding, storage of on-demand archives and content delivery together account for roughly 34% of revenue at typical scale, and archive storage grows continuously because customers rarely delete anything. Customer success and event production support form a second large block, since enterprise customers expect assistance around events at fixed and inconvenient times.
Content delivery pricing has moved favourably. Bandwidth and delivery network costs continued falling through 2024 and 2025 as capacity expanded ahead of demand, which improved gross margins across the industry without anybody doing anything clever. Zoom Communications and RingCentral both referenced infrastructure and delivery cost conditions in recent annual reporting. Archive storage moved the other way, since roughly 54% of viewing happens on-demand and customers retain everything indefinitely.

Exposure varies by customer mix rather than by scale. Suppliers serving enterprise customers with scheduled event support carry customer success cost that scales with events rather than with revenue. Self-service platforms avoid that entirely and compete on price against bundled tools that are effectively free. Platforms holding large archives carry storage cost against content generating viewing rather than revenue, unless the archive is monetised.
united-kingdom-virtual-event-platforms-market-cost-volatility-analysis-1788425188737

Tier archive storage against actual viewing patterns

Customers retain every recording indefinitely because deleting content feels like losing an asset, while viewing concentrates in the first few months. Tiering older content to cheaper storage with slower retrieval cuts archive cost substantially without affecting any experience a customer notices. It requires measuring viewing decay per customer, which suppliers rarely do because storage cost accumulates quietly.

Automate event day support before scaling enterprise accounts

Customer success cost scales with the number of scheduled events rather than with revenue, since every event happens at a fixed time and customers expect somebody available. Rehearsal tooling, automated checks and self-service controls reduce that demand. Suppliers adding enterprise accounts without this discipline discover their support cost growing faster than their subscription revenue, which is difficult to reverse afterwards.

Monetise the archive rather than storing it silently

Post-event viewing accounts for roughly 54% of consumption and generates storage cost while producing no revenue under most pricing models. Gated on-demand access converts the archive from a cost line into an acquisition channel, typically adding around 45% more consented contacts per session. The engineering involved is modest and the pricing conversation with existing customers is what suppliers avoid.

Portfolio Architecture for Margin Defence

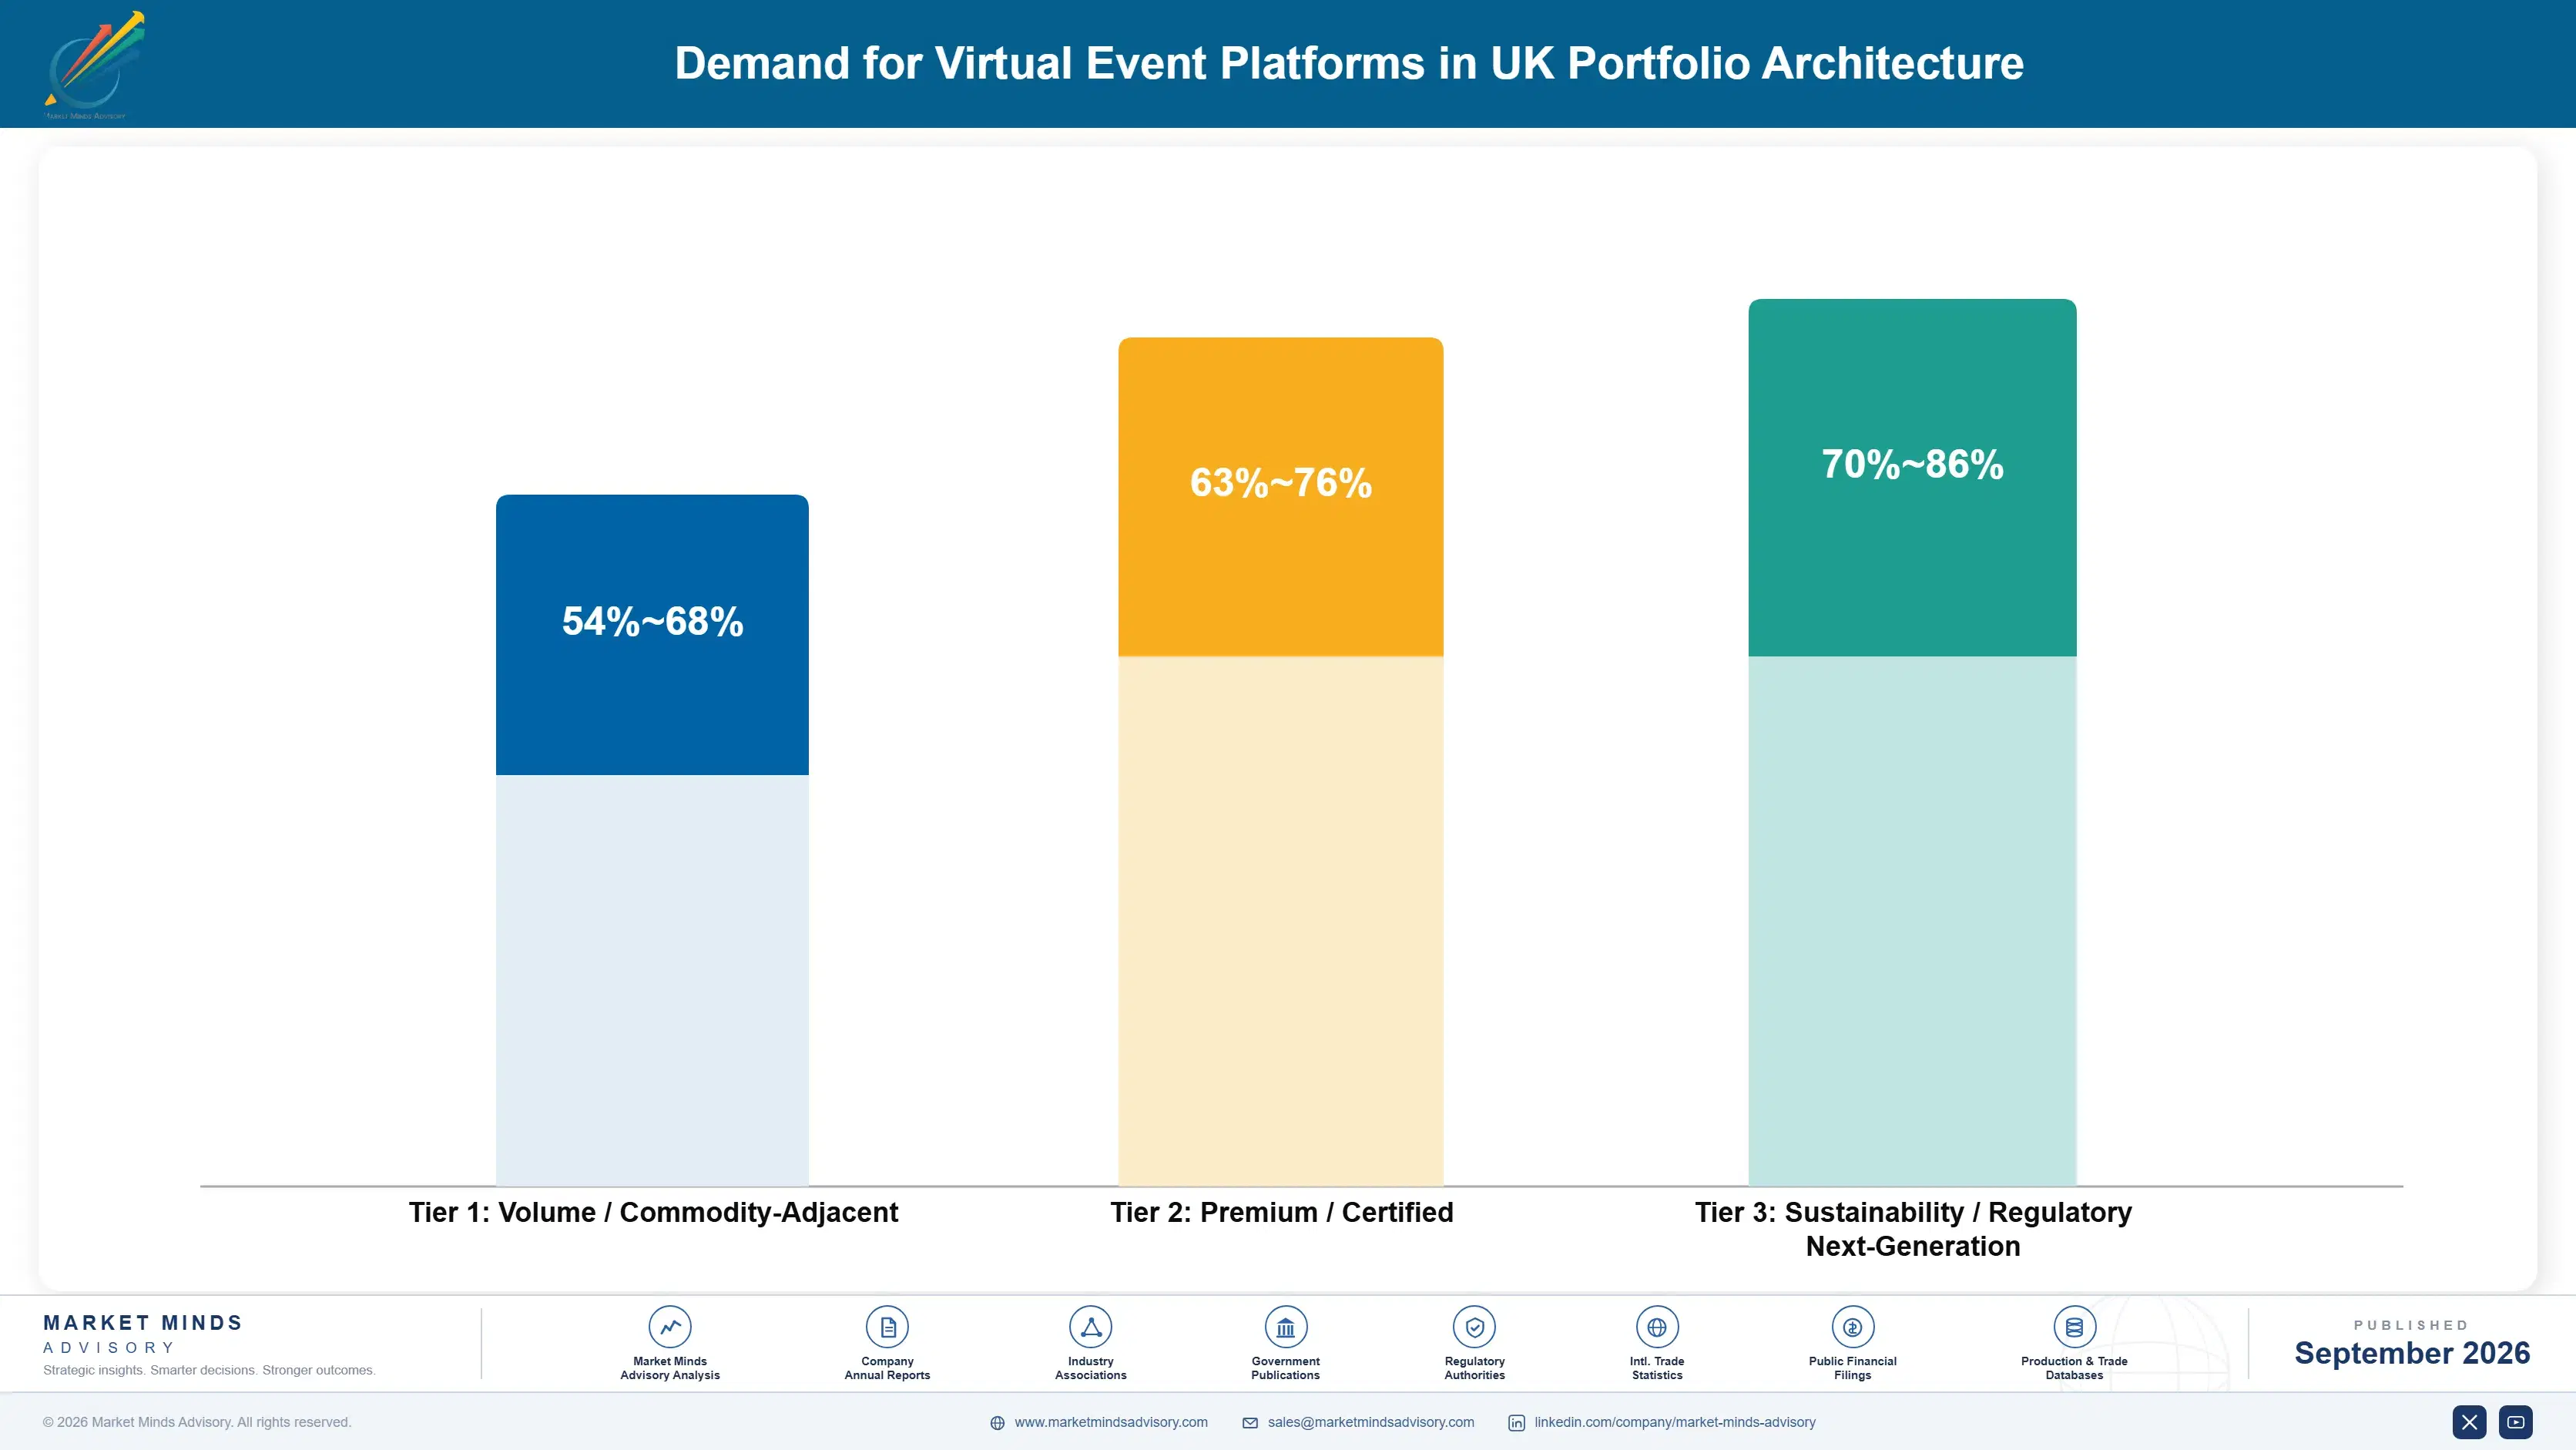
Margin architecture separates on whether the platform produces data or delivers video. Broadcast-focused subscriptions earn modest margins because general communication tools meet the same requirement at effectively no incremental cost, which caps pricing regardless of quality. Registration, consent and attribution capability earns considerably more, since it addresses a requirement bundled tools do not attempt and buyers cannot easily assemble themselves.
The tension runs between self-service scale and enterprise depth. Self-service platforms scale cleanly, carry no event day support cost and compete directly against free bundled tools on price. Enterprise platforms earn far better and carry customer success cost that scales with scheduled events rather than with revenue, which erodes the apparent margin advantage more than most suppliers measure. Very few operate both models well within one organisation.

High-value revenue concentrates in attribution tooling and in enterprise programme management spanning physical and hybrid events. Both are defended by integration depth that takes years to build and that buyers cannot replicate internally. The on-demand archive is the underdeveloped pool, generating roughly 54% of viewing while producing storage cost and, under most current pricing, no revenue whatsoever for the platform hosting it.

Volume / Commodity-Adjacent

Self-service webinar and broadcast subscriptions competing against bundled communication tools on price. The range reflects delivery infrastructure efficiency and support model. Pricing is capped by tools customers already hold rather than by any competitor's list price.
Gross Margin: 54-68%

Premium / Certified

Enterprise registration, hybrid event extension and programme management sold across physical and virtual formats. Margin depends heavily on how much event day support is automated rather than staffed. Integration depth rather than feature count decides these selections.
Gross Margin: 63-76%

Sustainability / Regulatory / Next-Generation

Consent handling, attribution tooling and gated on-demand acquisition sold to marketing organisations defending budget on pipeline. The widest range in the portfolio, reflecting integration complexity and how much archive monetisation has been implemented. Highest margin and hardest to displace.
Gross Margin: 70-86%
united-kingdom-virtual-event-platforms-market-portfolio-architecture-1788425189231

High-value Sub-segments and Strategic Watch-out

Attribution and Pipeline Tooling

High value with strong growth at 11.2%, deciding whether platform spend survives quarterly marketing budget reallocation at all. The range reflects integration depth into customer relationship systems. Its awkwardness is that honest attribution may eventually prove the channel underperforms other marketing options available. Suppliers rarely raise it.
Gross Margin: 72-86%

Consent and Data Handling Capability

High value with steady growth, decisive among British and European buyers who audit data handling during selection rather than after deployment. The range reflects regulatory scope covered. It is unglamorous engineering that removes platforms from shortlists when absent and rarely appears in any marketing material.
Gross Margin: 70-84%

Self-Service Webinar Subscriptions

The volume core, competing directly against communication tools customers already pay for and therefore priced against effectively zero incremental cost. The range reflects delivery efficiency and support automation. It funds the customer base that higher-value data capability is then sold into. That is its only real purpose.
Gross Margin: 53-67%

Virtual Trade Show Platforms

The strategic watch-out, built for a demand condition that ended when travel resumed and sustained since largely by suppliers unwilling to write off the engineering. Growth at 3.2% barely covers maintenance. Several suppliers still present this capability prominently in materials that buyers no longer read.
Gross Margin: 0-18%

Why This Spend Renews

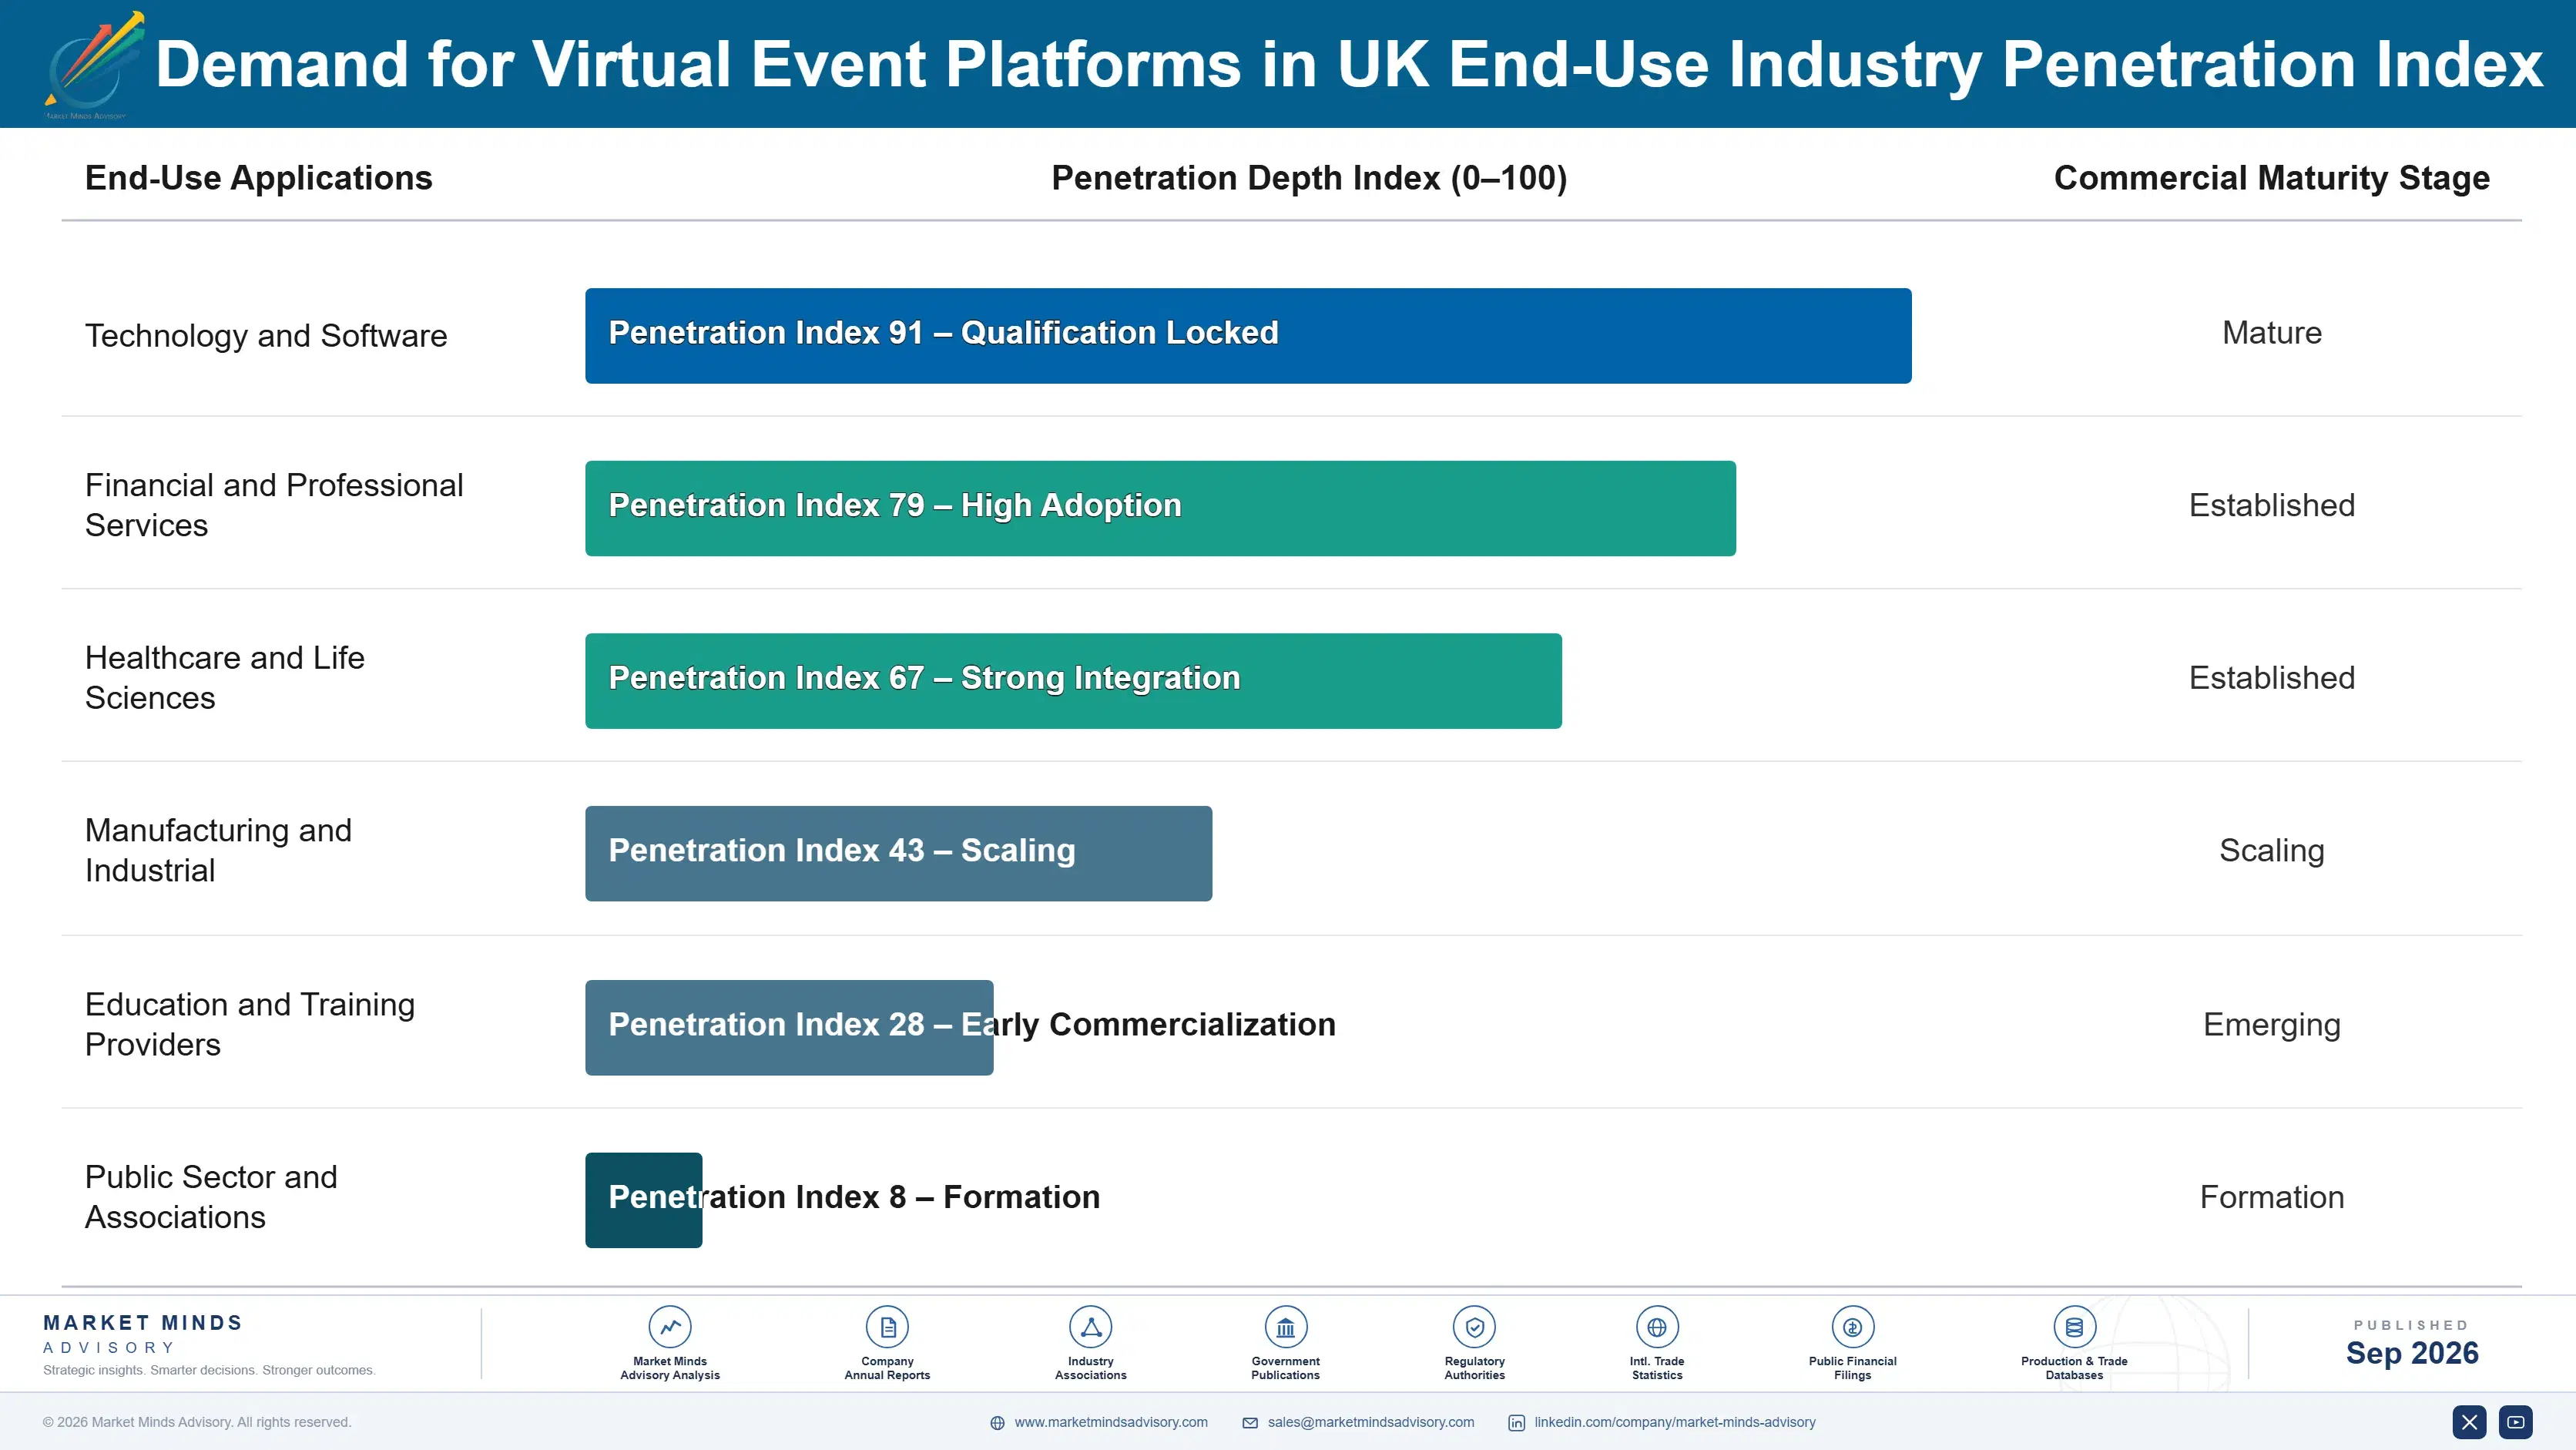
Recurrence works through marketing programme cycles rather than through event calendars. Platform subscriptions renew annually and are reviewed quarterly against pipeline contribution, which makes this among the least secure recurring revenue in software. Enterprise programme management renews more firmly, because registration data, integrations and historical records accumulate inside the platform. Archives create a quieter form of retention, since years of gated content are genuinely awkward to move.
Adoption depth varies with how integrated the data has become. Organisations passing attendee records automatically into marketing and sales systems have built dependencies that survive budget scrutiny, because removing the platform breaks reporting somebody senior relies upon. Those using a platform purely to broadcast can switch over a weekend and periodically do. British enterprise buyers sit toward the integrated end, partly because consent handling requirements pushed them into proper data architecture earlier.

The buyer moved from events teams to marketing operations and has kept moving. Early virtual event purchasing sat with events and communications functions evaluating attendee experience. It now sits with marketing operations and demand generation leaders evaluating cost per consented contact and pipeline contribution. Suppliers whose materials still lead with attendee engagement address a function that no longer holds the budget.
united-kingdom-virtual-event-platforms-market-end-use-penetration-index-1788425189718

What Actually Retains Customers

These are among the four positions where our research anticipates prominent divergence between winners and laggards over the coming forecast period. Each is grounded in the demand model, the regulatory perimeter, and the announced capacity pipeline.
01 / HONEST ATTENDANCE REPORTING

Report attendance and engagement, never registration counts

Registration to attendance runs near 38% and every buyer who measures it finds the gap within a quarter, at which point a supplier who reported the flattering figure has a credibility problem rather than a performance one. Suppliers reporting attendance, duration and engagement by default retain customers through that discovery, and renewal rates differ by roughly 18 percentage points on this alone. It costs the impressive number in the case study and buys the renewal that number was meant to secure.
02 / CONSENT ARCHITECTURE INVESTMENT

Make data handling the reason buyers shortlist you

British and European consent rules mean an attendee record is worthless unless the permission behind it withstands audit, and yield sits near 62% where consent is properly sought rather than assumed through a pre-ticked box nobody reads. Platforms handling capture, storage and withdrawal correctly pass clean records onward, while those treating registration as a form create liability the customer inherits at audit. Buyers audited on data handling switch away from weak platforms at roughly 3 times the general rate observed elsewhere.
03 / ARCHIVE MONETISATION DISCIPLINE

Charge for the half of viewing that happens later

Roughly 54% of consumption occurs after the live session, largely from people who never registered, and most platforms treat that archive as storage cost rather than as the larger portion of their audience by some margin. Gated on-demand access with follow-up triggers converts passive viewing into contact records, typically adding around 45% more consented contacts per session at modest engineering effort and no new production cost. Platforms priced around live capacity are charging customers for the smaller half of what they receive.
04 / PIPELINE CONTRIBUTION PROOF

Win the budget review, not the feature comparison

Marketing funds about 71% of this spend and reallocates quarterly against measured contribution, so a platform unable to connect an attendee to an opportunity competes against paid search on numbers it simply cannot produce at all. Attribution capability moves the renewal conversation from event quality onto pipeline arithmetic, which is the only ground where this spend reliably survives an annual review, and platforms with it retain roughly 25% better. The uncomfortable part is that honest attribution occasionally proves the channel underperforms other options.

Engagement Snapshot From the Field

A live engagement with an industry participant carrying material or product regulatory and market exposure ahead of a defining policy shift, showing how our research translates into a defensible multi-year portfolio strategy.
MARKET MINDS ADVISORY · CLIENT ENGAGEMENT SUMMARY
Demand for Virtual Event Platforms in UK Producer Strategic Portfolio Review and Transition Roadmap 2026·Investment Scenario on Demand for Virtual Event Platforms in UK Exposure Evaluation 2025-26
CLIENT PROFILE
A British business services group running approximately 140 webinars annually across six divisions (client-reported, unverified by MMA), using three separate platforms adopted independently by different marketing teams. Total platform and production spend approached GBP 2.4 million, and programme performance was reported to the board entirely in registration counts, quarter after quarter. Nobody had questioned it.
STRATEGIC CHALLENGE
The group finance director had questioned whether the programme justified its cost, and nobody could answer because attendance, engagement and pipeline contribution had never been measured together. Consent handling differed across the three platforms, which the data protection team had flagged as a risk. Budget for the following year was under review.
MMA APPROACH
MMA measured attendance, duration, on-demand viewing and consented contact yield per session across all three platforms, none of which had been compared before. We traced attendee records into the customer relationship system, interviewed 23 marketing, sales and data protection staff, and assessed consent capture against the group's own policy rather than platform claims.
KEY FINDINGS
  1. Registration to attendance averaged 34% across the programme, and average session duration was 21 minutes, both below the figures reported to the board.
  2. On-demand viewing exceeded live attendance at every division, and none of the three platforms gated that content or captured contacts from it.
  3. Consented contact yield varied between 41% and 68% across the three platforms, entirely because of how each handled permission at the registration step.
  4. Only one division could trace webinar attendees into opportunities, and its measured cost per opportunity was considerably lower than the group had assumed.
CLIENT PROFILE
A British business services group running approximately 140 webinars annually across six divisions (client-reported, unverified by MMA), using three separate platforms adopted independently by different marketing teams. Total platform and production spend approached GBP 2.4 million, and programme performance was reported to the board entirely in registration counts, quarter after quarter. Nobody had questioned it.
STRATEGIC CHALLENGE
The group finance director had questioned whether the programme justified its cost, and nobody could answer because attendance, engagement and pipeline contribution had never been measured together. Consent handling differed across the three platforms, which the data protection team had flagged as a risk. Budget for the following year was under review.
MMA APPROACH
MMA measured attendance, duration, on-demand viewing and consented contact yield per session across all three platforms, none of which had been compared before. We traced attendee records into the customer relationship system, interviewed 23 marketing, sales and data protection staff, and assessed consent capture against the group's own policy rather than platform claims.
KEY FINDINGS
  1. Registration to attendance averaged 34% across the programme, and average session duration was 21 minutes, both below the figures reported to the board.
  2. On-demand viewing exceeded live attendance at every division, and none of the three platforms gated that content or captured contacts from it.
  3. Consented contact yield varied between 41% and 68% across the three platforms, entirely because of how each handled permission at the registration step.
  4. Only one division could trace webinar attendees into opportunities, and its measured cost per opportunity was considerably lower than the group had assumed.
RECOMMENDED STRATEGY
Phase 1: Consolidate onto the single platform with compliant consent handling and working customer relationship integration, retiring the other two at renewal. Phase 2: Reduce programme volume by roughly a third and redirect the saving into production quality and structured follow-up on each remaining session. Phase 3: Gate on-demand archives across all divisions, since post-event viewing already exceeds live attendance and currently produces no contact records at all.
OUTCOME
Consented contacts per session rose by about 55% while programme volume fell by a third, and total spend dropped to roughly GBP 1.7 million (client-reported, unverified by MMA). The board now receives attendance, engagement and pipeline contribution rather than registration counts, which was the change the finance director had actually been asking for.

Frequently Asked Questions

Foundational context covering the market sizes, CAGR, scope, country, region and competition that inform every finding below. This section is provided to cover basics and most often pre-purchase conversations, answered from the MMA Primary Research Dataset.

What is the current size of the Demand for Virtual Event Platforms in UK?

The market was worth USD 5.4 billion in 2025 and reaches USD 5.86 billion in 2026 on a global sizing frame. The United Kingdom is the analytical centre of this report.

How large will the Demand for Virtual Event Platforms in UK be by 2036?

MMA forecasts USD 13.37 billion by 2036, an expansion of 2.28 times over the forecast period. That represents USD 7.51 billion of incremental annual revenue against 2026.

What is the CAGR for the Demand for Virtual Event Platforms in UK 2026 to 2036?

The base case is 8.6% compound annual growth, with a bull case at 9.8% and a bear case at 7.4%. Whether attribution can defend the spend separates the scenarios.

Which segment is growing fastest?

Webinar and demand generation platforms grow at 12.9%, half again the market rate of 8.6%. They produce consented contact data rather than attendance, which is what marketing budgets actually fund.

Who are the major companies in the Demand for Virtual Event Platforms in UK?

Zoom Communications, Cvent, ON24, Kaltura and RingCentral lead on measured platform subscription and service revenue. Together they hold roughly 33%, split between communication vendors and event specialists.

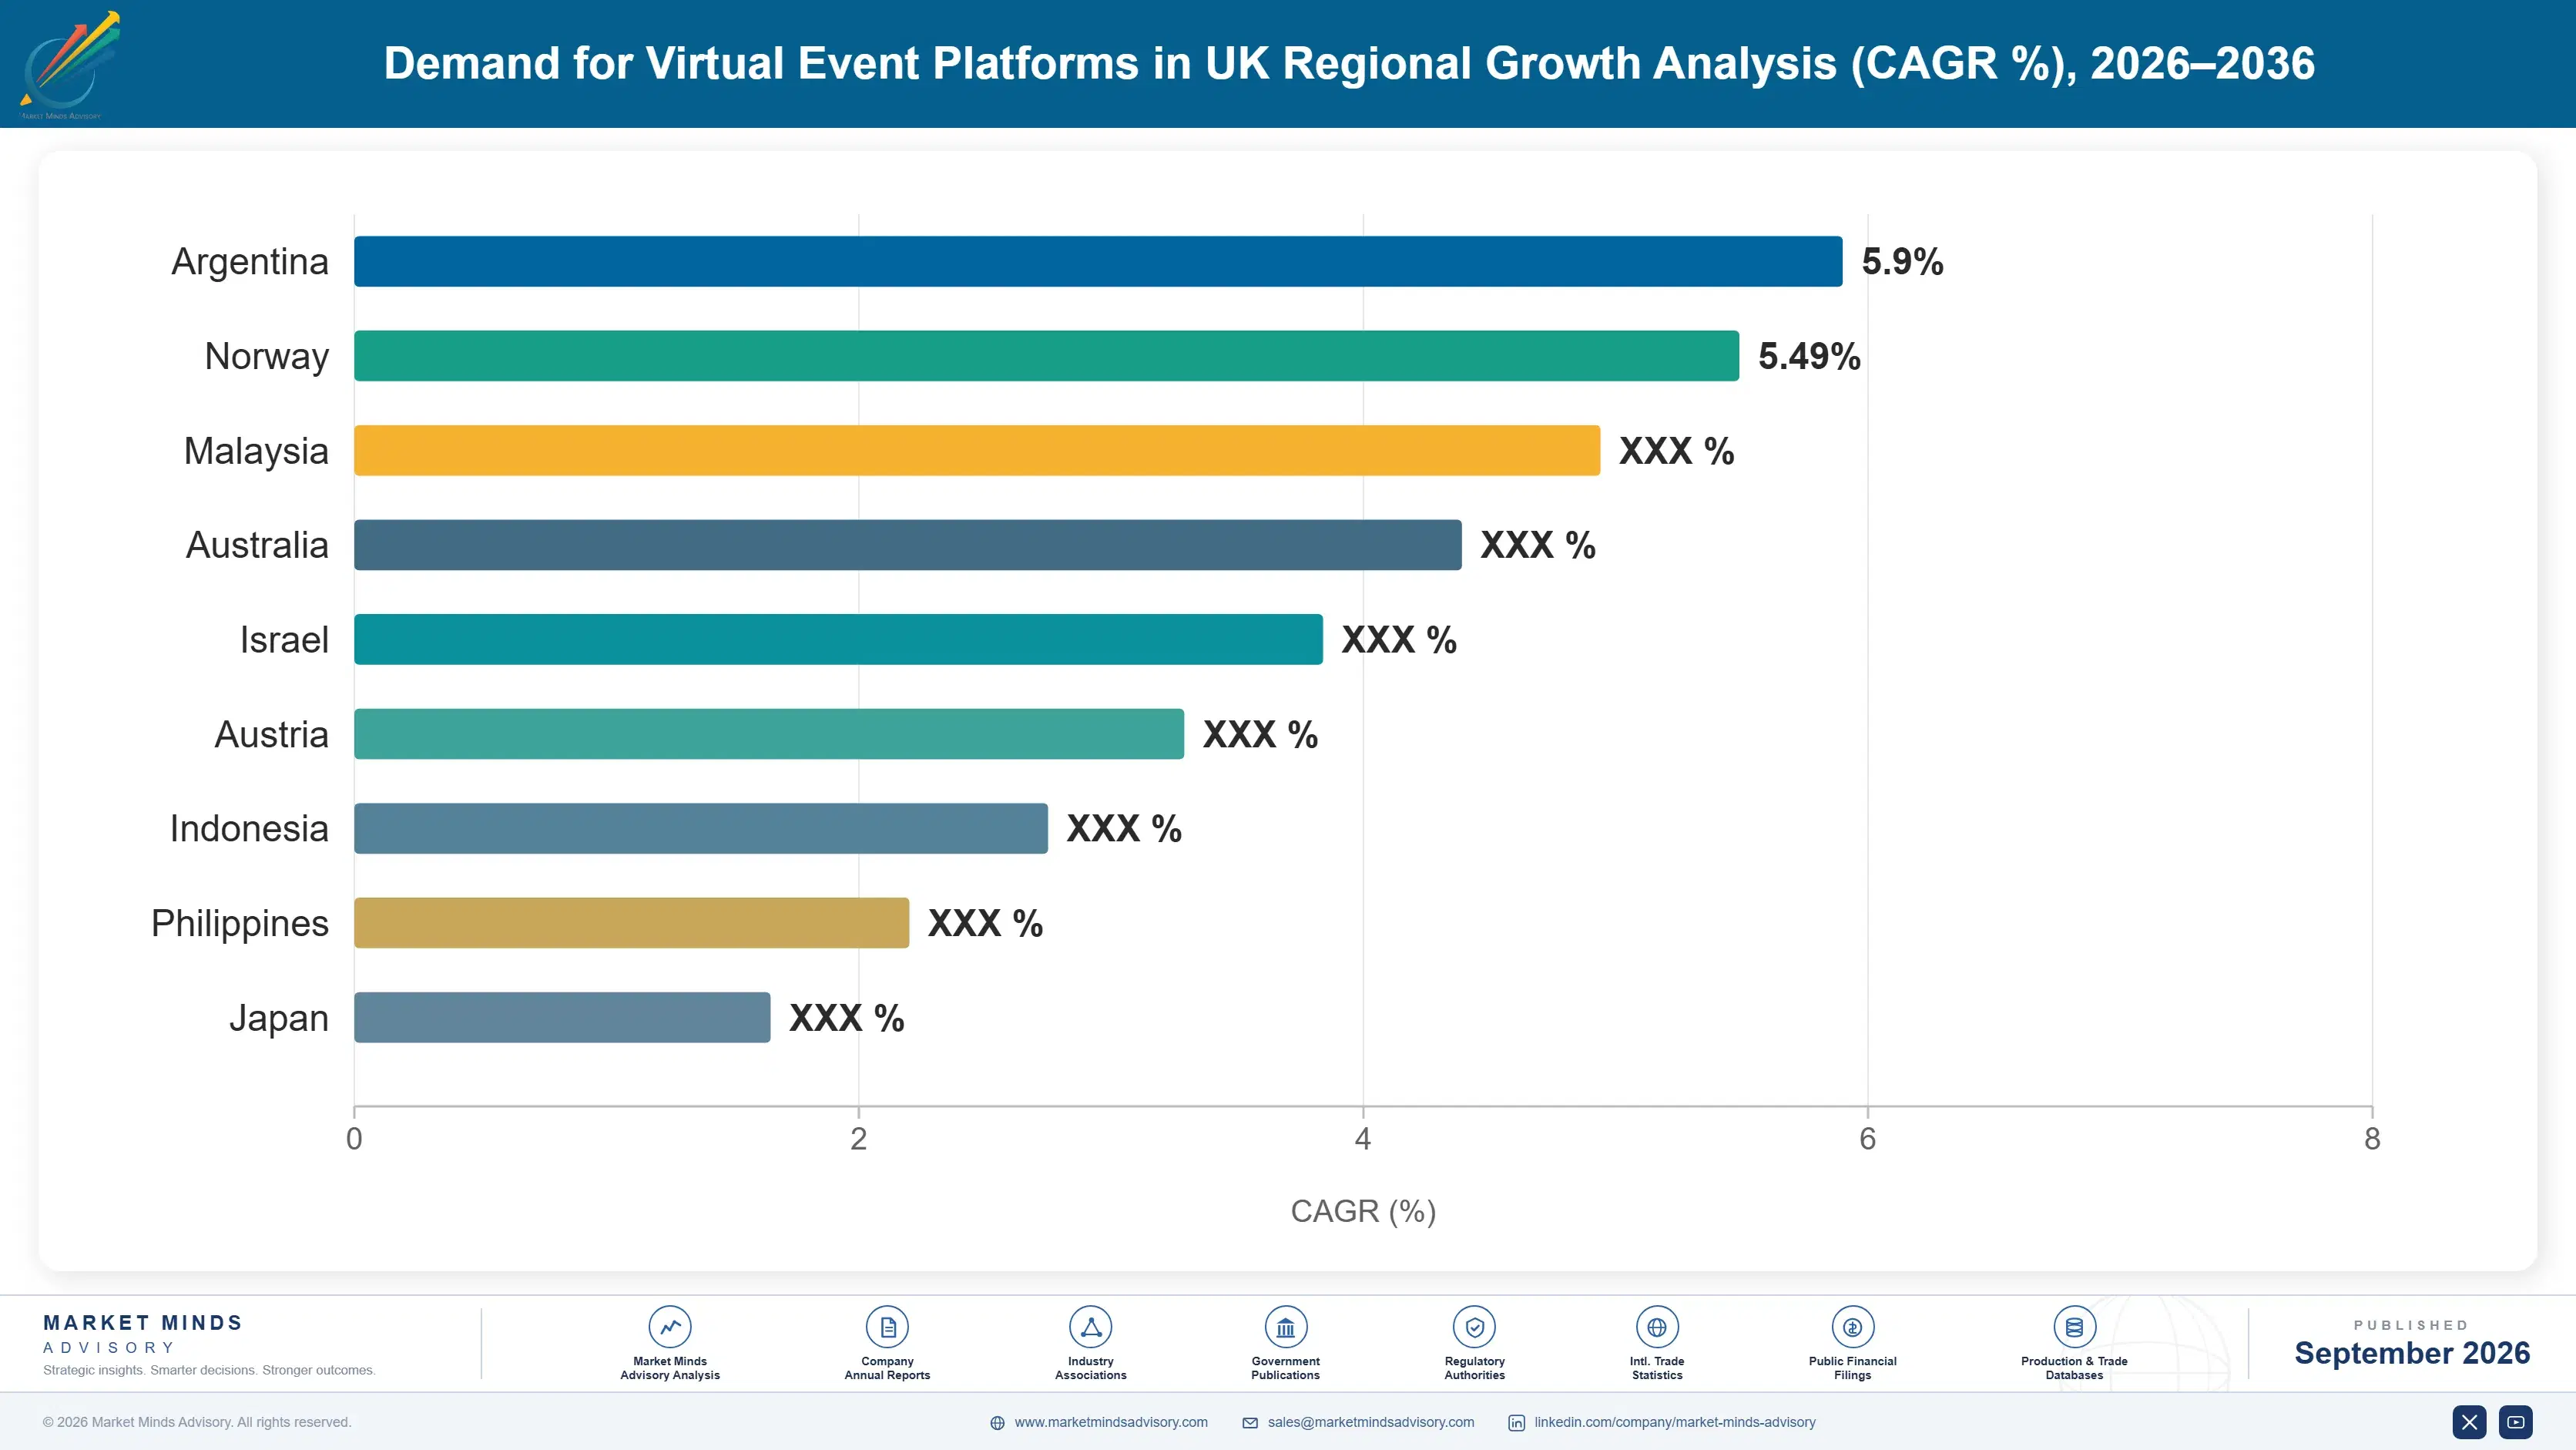
Which country is growing fastest?

India grows fastest at 11.6%, on a large English-speaking business audience and technology firms running webinar programmes aimed at North American and British buyers rather than domestic ones.

Report Segmentation Architecture

The full report scope spans multiple orthogonal segmentation dimensions, with cross-tabulated demand data provided for each dimension pair. Coverage extends further to regional breakdowns, trend trajectories, and the competitive detail needed to support segment-level decision-making.

By Primary Market Dimension

  • Webinar and Demand Generation Platforms
  • Hybrid Event Extension and Registration
  • Virtual Conference and Trade Show Platforms
  • Internal and Employee Event Platforms
  • Learning and Certification Event Delivery
  • Event Data and Attribution Tooling

By End-Use Industry

  • Technology and Software
  • Financial and Professional Services
  • Healthcare and Life Sciences
  • Manufacturing and Industrial
  • Education and Training Providers
  • Public Sector and Associations

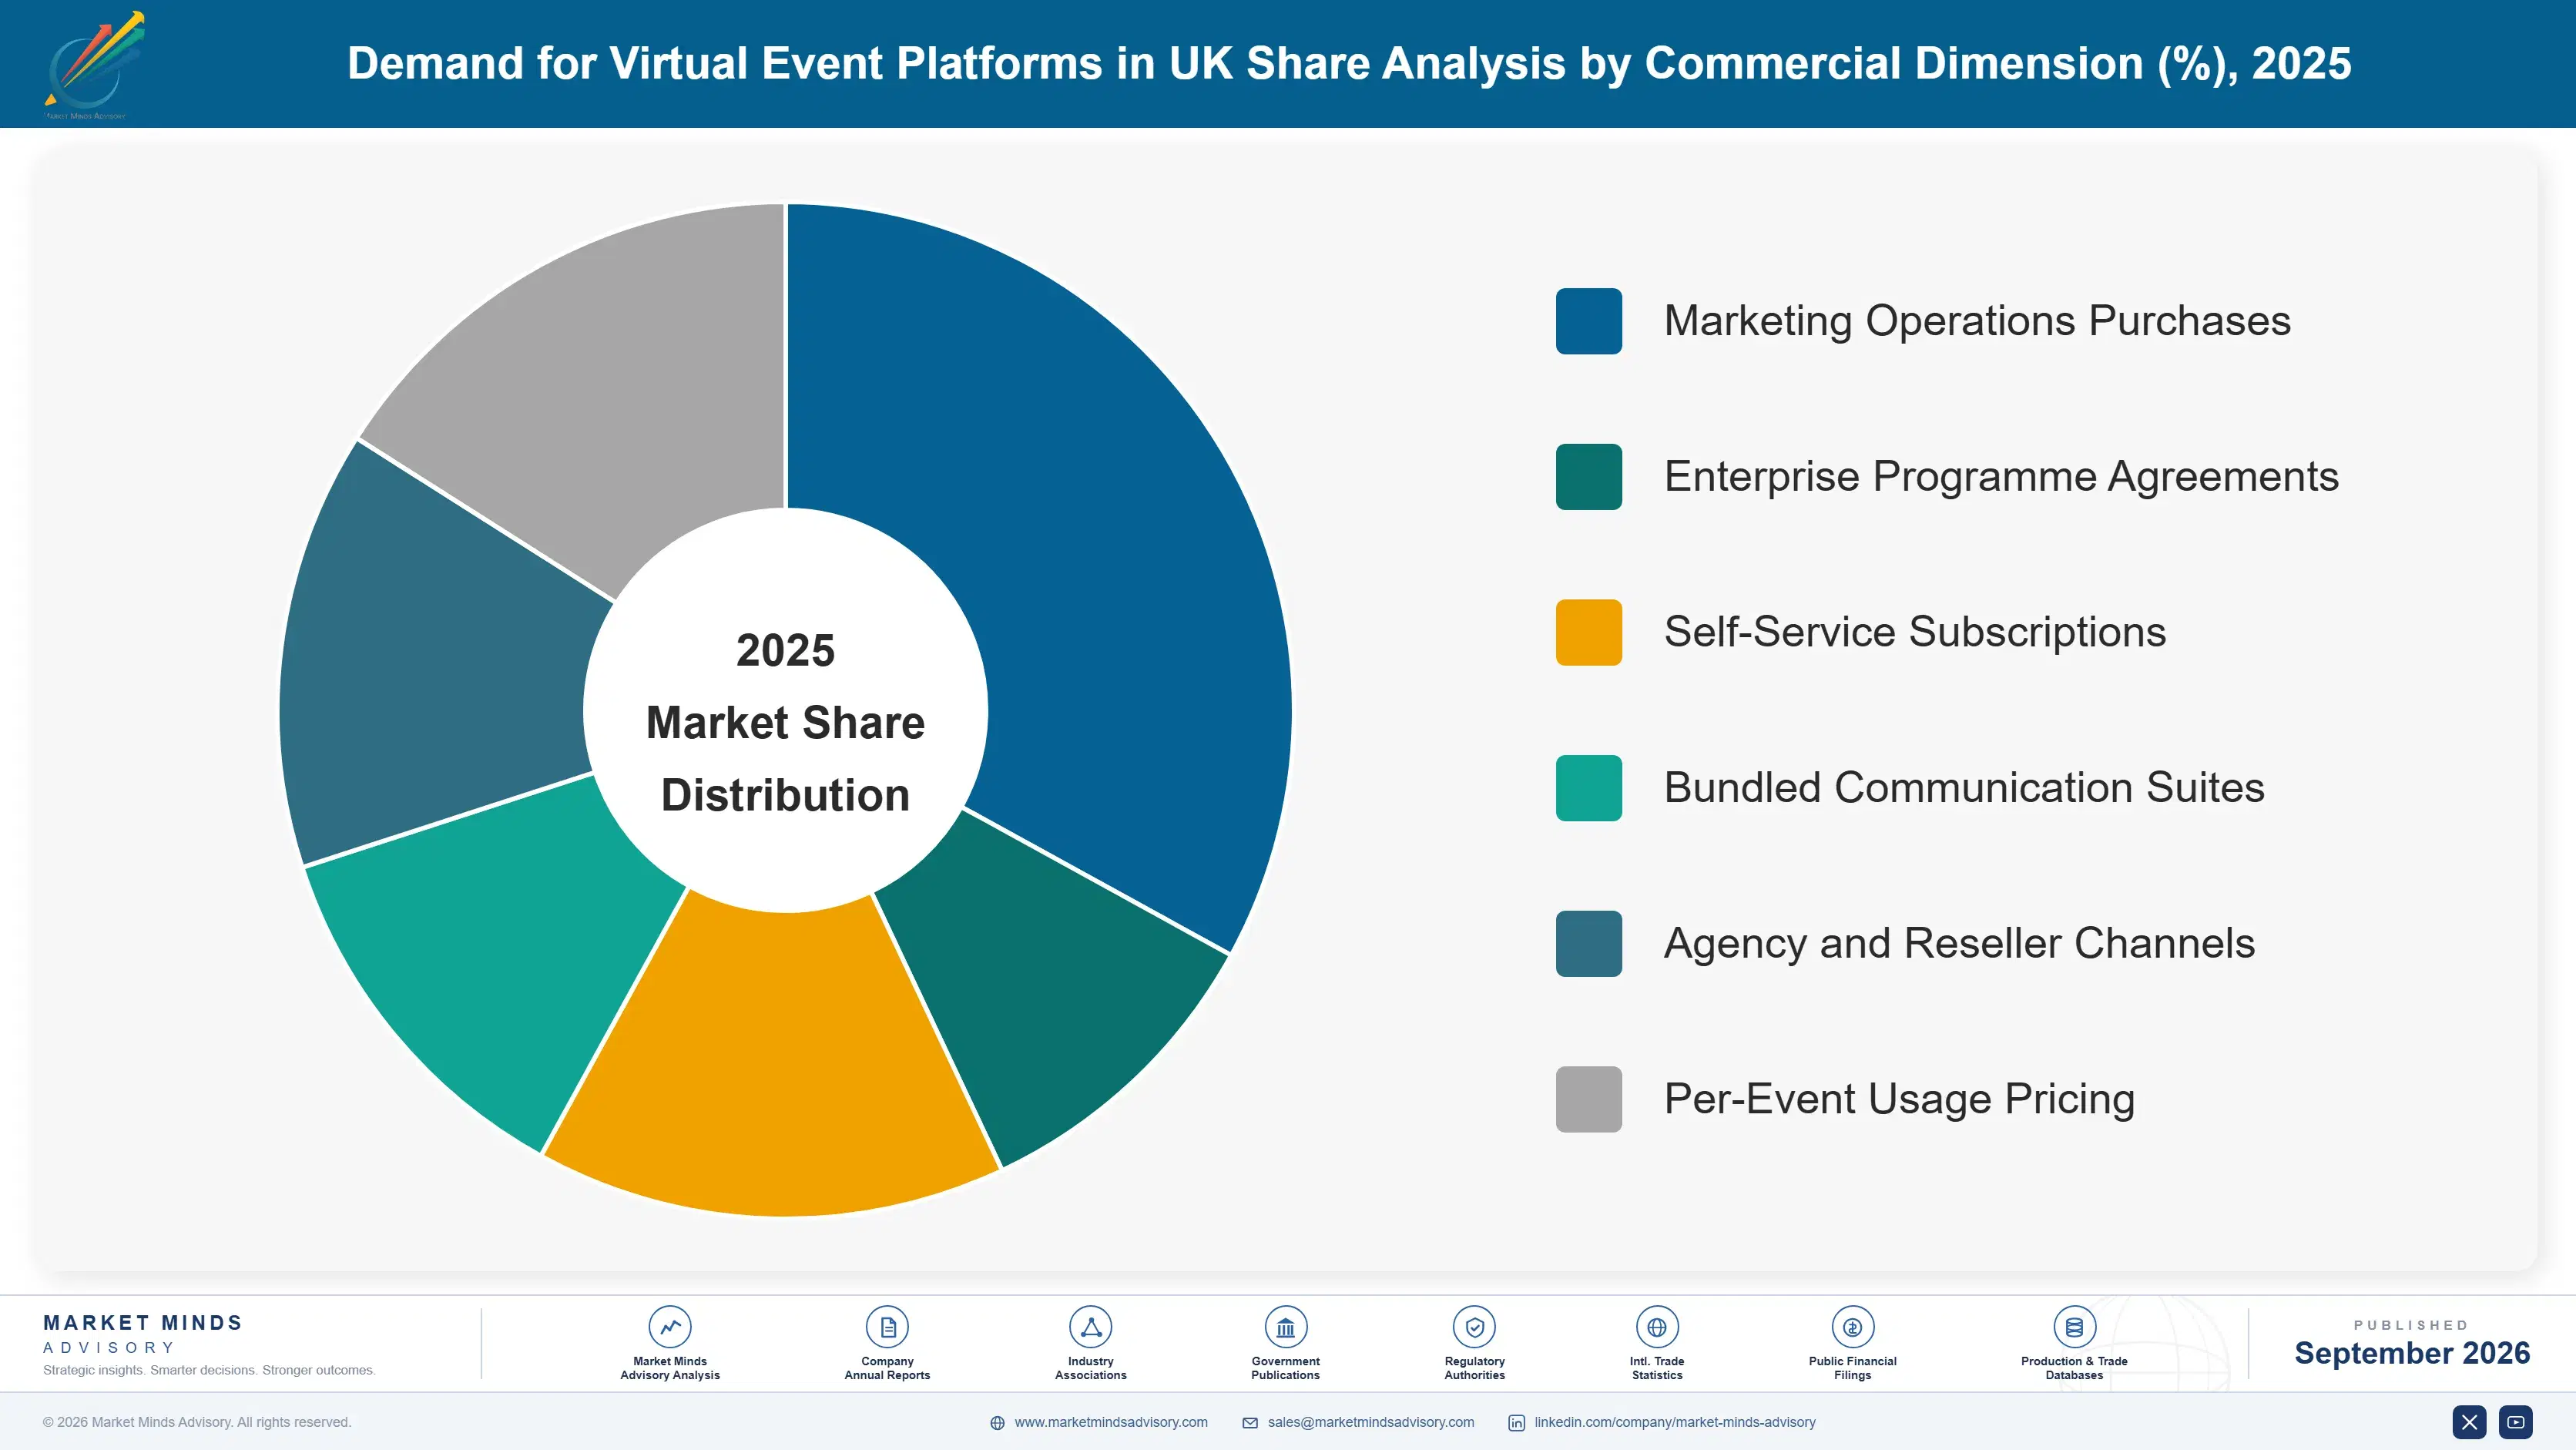
By Commercial Dimension

  • Marketing Operations Purchases
  • Enterprise Programme Agreements
  • Self-Service Subscriptions
  • Bundled Communication Suites
  • Agency and Reseller Channels
  • Per-Event Usage Pricing

By Region

  • North America
  • Western Europe
  • East Asia
  • South Asia and Pacific
  • Latin America
  • Middle East and Africa
  • Eastern Europe

Scope, Methodology, and Coverage

Every figure in this report is reproducible from documented input assumptions. The scope below maps the historical period, the forecast horizon, the segmentation dimensions, and the countries covered, alongside the underlying primary and qualitative methodology.
Historical Period
2020 to 2025
Forecast Period
2026 to 2036
Base Year
2025 (USD billions; MMA Primary Research Dataset, September 2026)
Market Definition
This market covers software platforms used to deliver, register, host and measure online and hybrid business events, spanning webinar and demand generation platforms, hybrid event extension and registration, virtual conference and trade show platforms, internal and employee event platforms, learning and certification event delivery, and event data and attribution tooling. Value is measured as platform subscription, usage and attributable service revenue at supplier level, with the United Kingdom treated as the analytical centre within a global sizing frame required by the seven-region reporting structure. General video conferencing for internal meetings, physical venue hire and audiovisual production services, marketing automation suites, learning management systems, and consumer streaming and entertainment platforms are excluded from scope.
Quantitative Units
USD billions, platform subscription, usage and attributable service revenue at supplier level
Segmentation Dimensions
Platform function, end-use industry, commercial model, region
Regions Covered
North America, Western Europe, East Asia, South Asia and Pacific, Latin America, Middle East and Africa, Eastern Europe
Countries Covered
United Kingdom, Ireland, Germany, France, Netherlands, Belgium, Sweden, Denmark, Spain, Italy, Poland, Czechia, Hungary, United States, Canada, Mexico, Brazil, Colombia, Chile, China, Japan, South Korea, Singapore, India, Australia, New Zealand, Indonesia, Philippines, United Arab Emirates, Saudi Arabia, South Africa
Key Companies Profiled
Zoom Communications, Cvent, ON24, Kaltura, RingCentral, GoTo, Webex by Cisco, Microsoft, Bizzabo, Swapcard, Brella, Hubilo, Vimeo, Notified, Splash, Eventbrite, Whova, Airmeet, InEvent, Stova
Quantitative Methodology
Primary survey, n=3,800 respondents, Q4 2025, six countries; demand-side model with trade association cross-validation
Qualitative Methodology
47 expert interviews, Q4 2025; applied to validate demand model assumptions, identify emerging dynamics, and assess competitive positioning
Report Format
PDF and XLSX data workbook (Word format preview document)
Publisher
Market Minds Advisory
Report Code
MMA-2026-TEC-981
Published
September 2026
Contact
sales@marketmindsadvisory.com | www.marketmindsadvisory.com

Purchase the full Demand for Virtual Event Platforms in UK Report (2026 to 2036).

The full MMA report treats virtual event platforms as a marketing data channel rather than an events business, and works through what honest attendance and consent measurement does to the commercial case. It sizes the market to 2036 across six platform functions, seven regions and 31 countries, with segment growth rates and regional demand mechanisms set out throughout. Competitive analysis covers 20 suppliers assessed on measured platform subscription and service revenue, with moat and risk assessment for the two leaders. The report quantifies delivery cost structure, archive economics and margin architecture across three portfolio tiers. It closes with four verdicts and an anonymised British business services engagement.
Six platform functions sized through 2036
Seven regions with demand mechanism analysis
Twenty suppliers on consistent revenue basis
Attendance, consent yield and viewing benchmarks
Margin architecture across three portfolio tiers
Anonymised British webinar programme review engagement

Built For The People Who Decide

From boardroom strategy to bench-side execution, this report is read cover-to-cover by leaders shaping the next decade of their industry, turning demand scenarios, market dynamics and valuation benchmarks into decisions.
CXOs/ Presidents/ VPs/ Managers
M&A and Corporate Development
Strategy Teams and R&D Heads
Procurement and Product Directors
Regulatory and Compliance Leaders
Investor Relations and Equity Analysts